1. Introduction
With the deterioration of the environment and the improvement of environmental awareness. Nitrogen oxides, sulfur oxides, hydrocarbons and carbon dioxide generated by fossil fuel combustion during ship navigation have caused non-negligible environmental pollution in the river basin. The requirements of emission reduction for ships are improving, and the ship propulsion system must be comprehensively upgraded and optimized.
The only energy source of the ship is ship power system, which directly affect the emission and other performance of the whole ship [
1]. There are three power application forms of the ships, including mechanical forms, hybrid forms and pure electric forms [
2]. The traditional power form uses diesel, natural gas, methanol and other fuels as fuel to drive the diesel engine or gas engine to do work, and transfer power to the propeller through the gearbox reducer unit. Hybrid systems employ different forms of energy as power sources. Electric ships completely abandon fossil fuels and use clean energy sources such as lithium batteries, fuel cells, supercapacitors and solar energy as power sources. Diesel engine has high economy and strong mobility, but it has large pollution. The gas machine has obvious advantages in environmental protection and economy, but the specific power of the gas machine is small and the mobility is poor. Hybrid ships have various forms. Generally, diesel engines or gas engines and batteries are used as power sources to promote the ship. Compared with diesel engines, hybrid ships have the advantages of saving energy and reducing pollution emissions, and are cheaper than electric ships. Electric ships have attracted the attention of various institutions and academia because of their zero emission, but the problems of stability and expensive cost make their popularity in inland river ships still have a large gap [
3,
4].
1.1. Problem Statement
The fundamental measure to achieve zero ship emission is the oil-free of ship power system. However, considering the economy and the current technical environment, there are some problems such as poor endurance, high cost and low battery life in all-electric ships. Therefore, it is not mature to realize the large-scale pure electric ship, and hybrid power system emerges at the historic moment.
The world’s first hybrid tug was delivered in November 2009 and is powered by two diesel generators and lead-acid batteries [
5]. In 2013, a hybrid ferry based on lithium battery energy storage was delivered in Germany. In 2017, the first ship equipped with battery technology was launched in Norway. The ship was converted from four LNG engines to three engines plus energy storage.
The introduction of ESS can effectively improve the performance of the hybrid power system. However, the energy storage equipment is expensive, and the characteristics of different energy storage devices are very different. In the actual configuration process, many factors such as cost and working environment need to be considered, so as to meet the requirements of system economy, economy and security. Optimization of configuration for ESS is the key technologies of hybrid power system. The optimization problem of energy storage system is generally divided into single objective optimization and multi-objective optimization. The optimization objectives include volume, cost, charging and discharging capacity. The solution methods include iterative method, analytical method and intelligent algorithm. At present, there are a lot of studies on the capacity configuration of energy storage systems.
1.2. Related Works
In order to reduce ship pollution, KISTNER et al. realized the configuration of single ESS and composite ESS for two kinds of ships based on optimization theory [
6]. In order to study and analyze power supply systems with different topology forms, TSAI et al. selected the best optimization scheme based on decision theory [
7]. In order to achieve the lowest cost of ESS, WANG and JIANG, respectively determined the energy scheduling strategy by using low-pass filter and wavelet variation, and carried out optimized calculation [
8,
9]. SHI et al. introduced energy storage system for optimal configuration in order to realize the economy and reliability of power grid, and discussed the optimal microgrid under different weight objectives [
10]. Similarly, WU et al. used particle swarm optimization to optimize energy storage in order to suppress grid fluctuations and ensure system reliability [
11]. Similarly, based on fuzzy artificial bee colony optimization theory, WANG optimized the configuration of the diesel-electric hybrid power system from the perspective of cost and load power shortage rate [
12]. CHENG proposed a method of freely combining energy storage forms and energy storage devices, and realized the fast configuration of power system by combining the method of wavelet change parameters [
13]. ZHUANG et al. established an optimization model to determine the different configuration results of the four hybrid systems, and compared the system cost, control complexity and other factors under different modes [
14]. In order to estimate the future development trend of energy storage system, HUA et al. used global mixed integer linear programming to predict the development trend of two energy storage technologies [
15].
At present, the research methods for capacity configuration of ESS have not been unified, mainly based on the allocation research of optimization theory, and the research methods are still in the exploratory and experimental stage.
1.3. Research Approach
The purpose of this research is to propose a powertrain upgrade scheme for a tourist ship based on a multivariable optimization process, for maximizing the cost performance. The new scheme is gas-electric hybrid power system, acquired by NGSA-II algorithm and TOPSIS theory, by exploring different combination of the decision variable, used to solve the capacity configuration problem of the ESS.
The article is organized as follows.
Section 2 analyzes the typical case pf target ship and determine the new propulsion power based on the ship-engine propeller model. The discussion of difference between LNG engine and Diesel engine is presented in
Section 3. We also complete the selection of topological structure in
Section 3. Subsequently,
Section 4 calculates capacity configuration model with multiple objectives for ESS by NGSA-II algorithm, generating an optimal scheme based on TOPSIS theory. Finally, in
Section 5, the discussion and conclusion are presented.
2. Ship-Engine-Propeller Matching
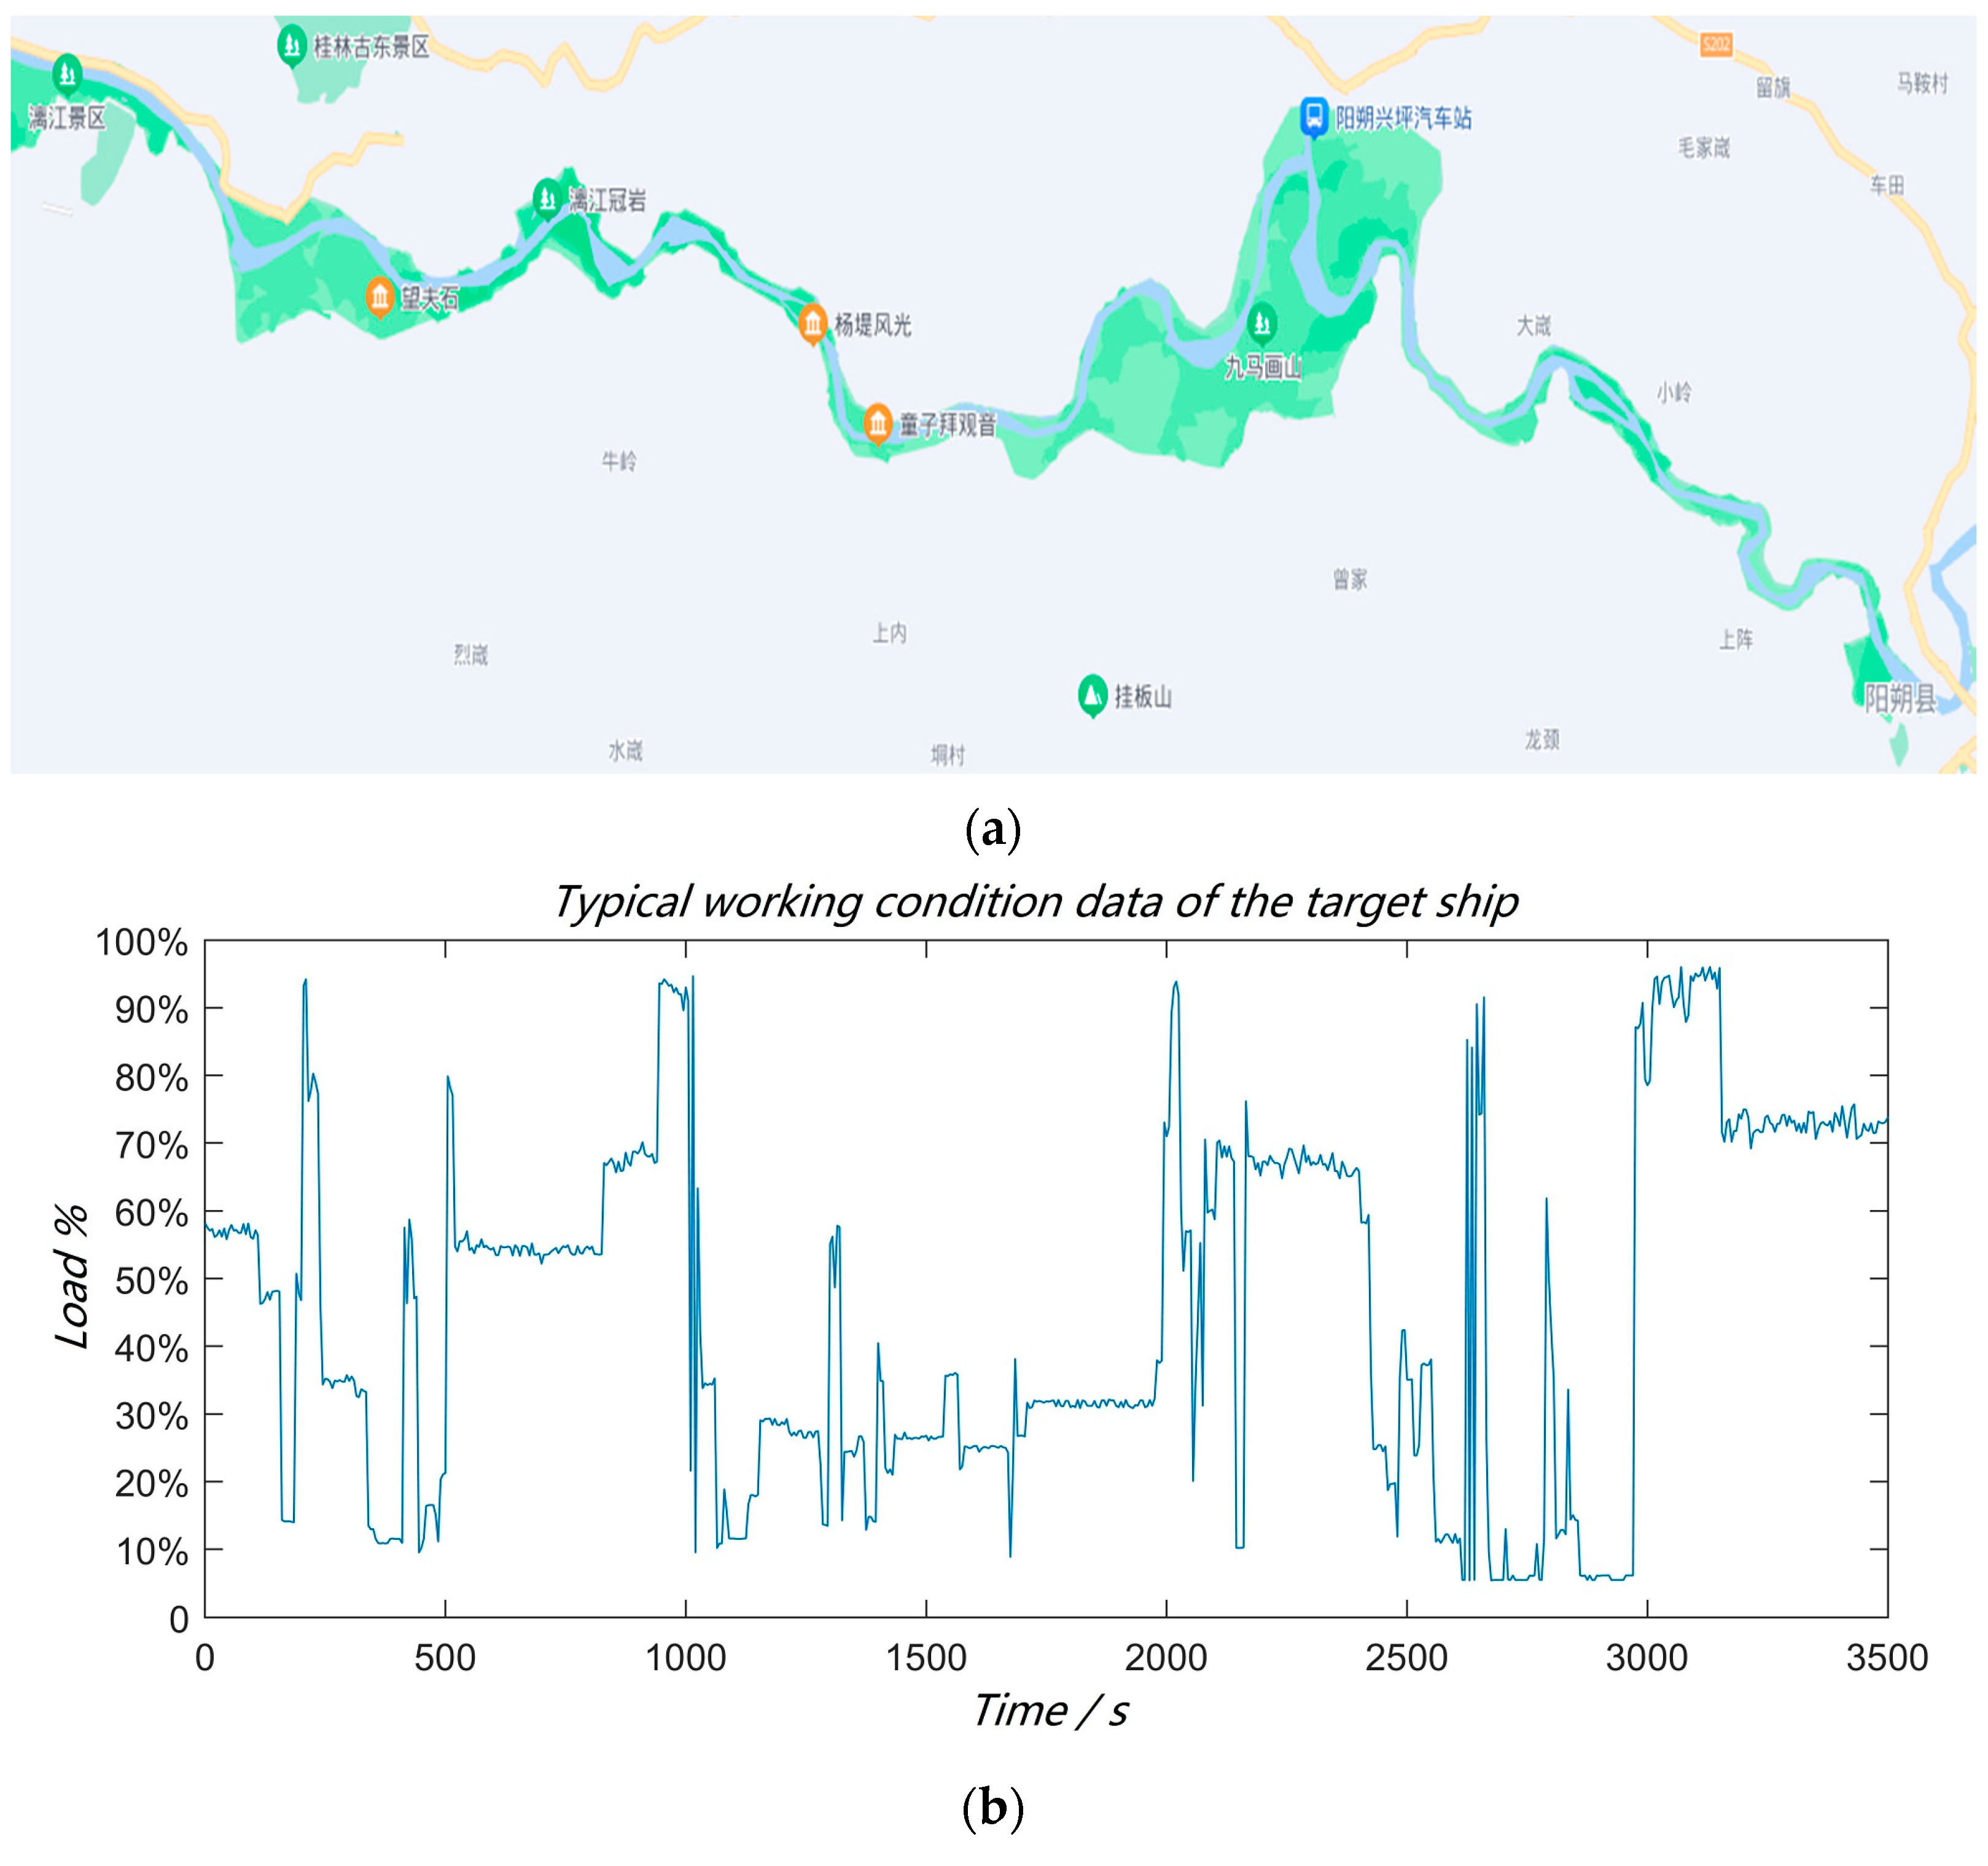
The target ship is a tourist boat, “Guilin”, whose single voyage time is 4 h.
Figure 1a shows the route of the boat. The boat will go through a complex basin with a voyage of about one hour on the way, which is called typical case.
Figure 1b shows the typical sailing load data of the ship on 3 May 2021, with the sampling frequency of 1 Hz.
2.1. Analysis of Target Ship’s Typical Working Profiles
Table 1 shows the data statistic results in typical case. The average value of the boat’s load level is 42.5%, and the mean square error of the load data is 39%. The
Table 1 also shows that the diesel engine power has a large probability density distribution in each load range, and is mainly concentrated in the 30% working profiles range.
2.2. Ship-Engine-Propeller Matching Model
In order to upgrade the form of the power system, this research conducts the ship-engine-propeller matching to determine the new propulsion power demand of the target boat.
The task of ship-engine-propeller matching is to select and configure the ship, main engine and propeller under the design working profiles, to optimize the configuration parameters of ship-engine-propeller. The key task of this paper is to improve the power form of the target boat, so the calculation of the ship’s propulsion power is arranged, the preliminary matching calculation of the ship’s engine and propeller is completed.
The preliminary matching of ship-engine-propeller is to calculate the power of the main engine by determining the diameter or speed of the propeller when the propeller is selected according to the boat’s design requirements.
Relationship between ship resistance, ship effective power and ship speed are expressed as follow:
Relationship between propeller thrust and ship resistance can be described as:
Propeller thrust
T of ships during actual navigation can be reflected in:
Thrust coefficient and torque coefficient, which are typically presented in the form of regression polynomials for standard series are expressed as follow [
16]:
According to the above formula, the expression of thrust coefficient
with propeller diameter
D at speed
can be obtained.
Advance coefficient
can be obtain:
Get propeller efficiency
:
Relationship between rotational velocity
and ship speed
can be described as:
Output power of the engine can be described as:
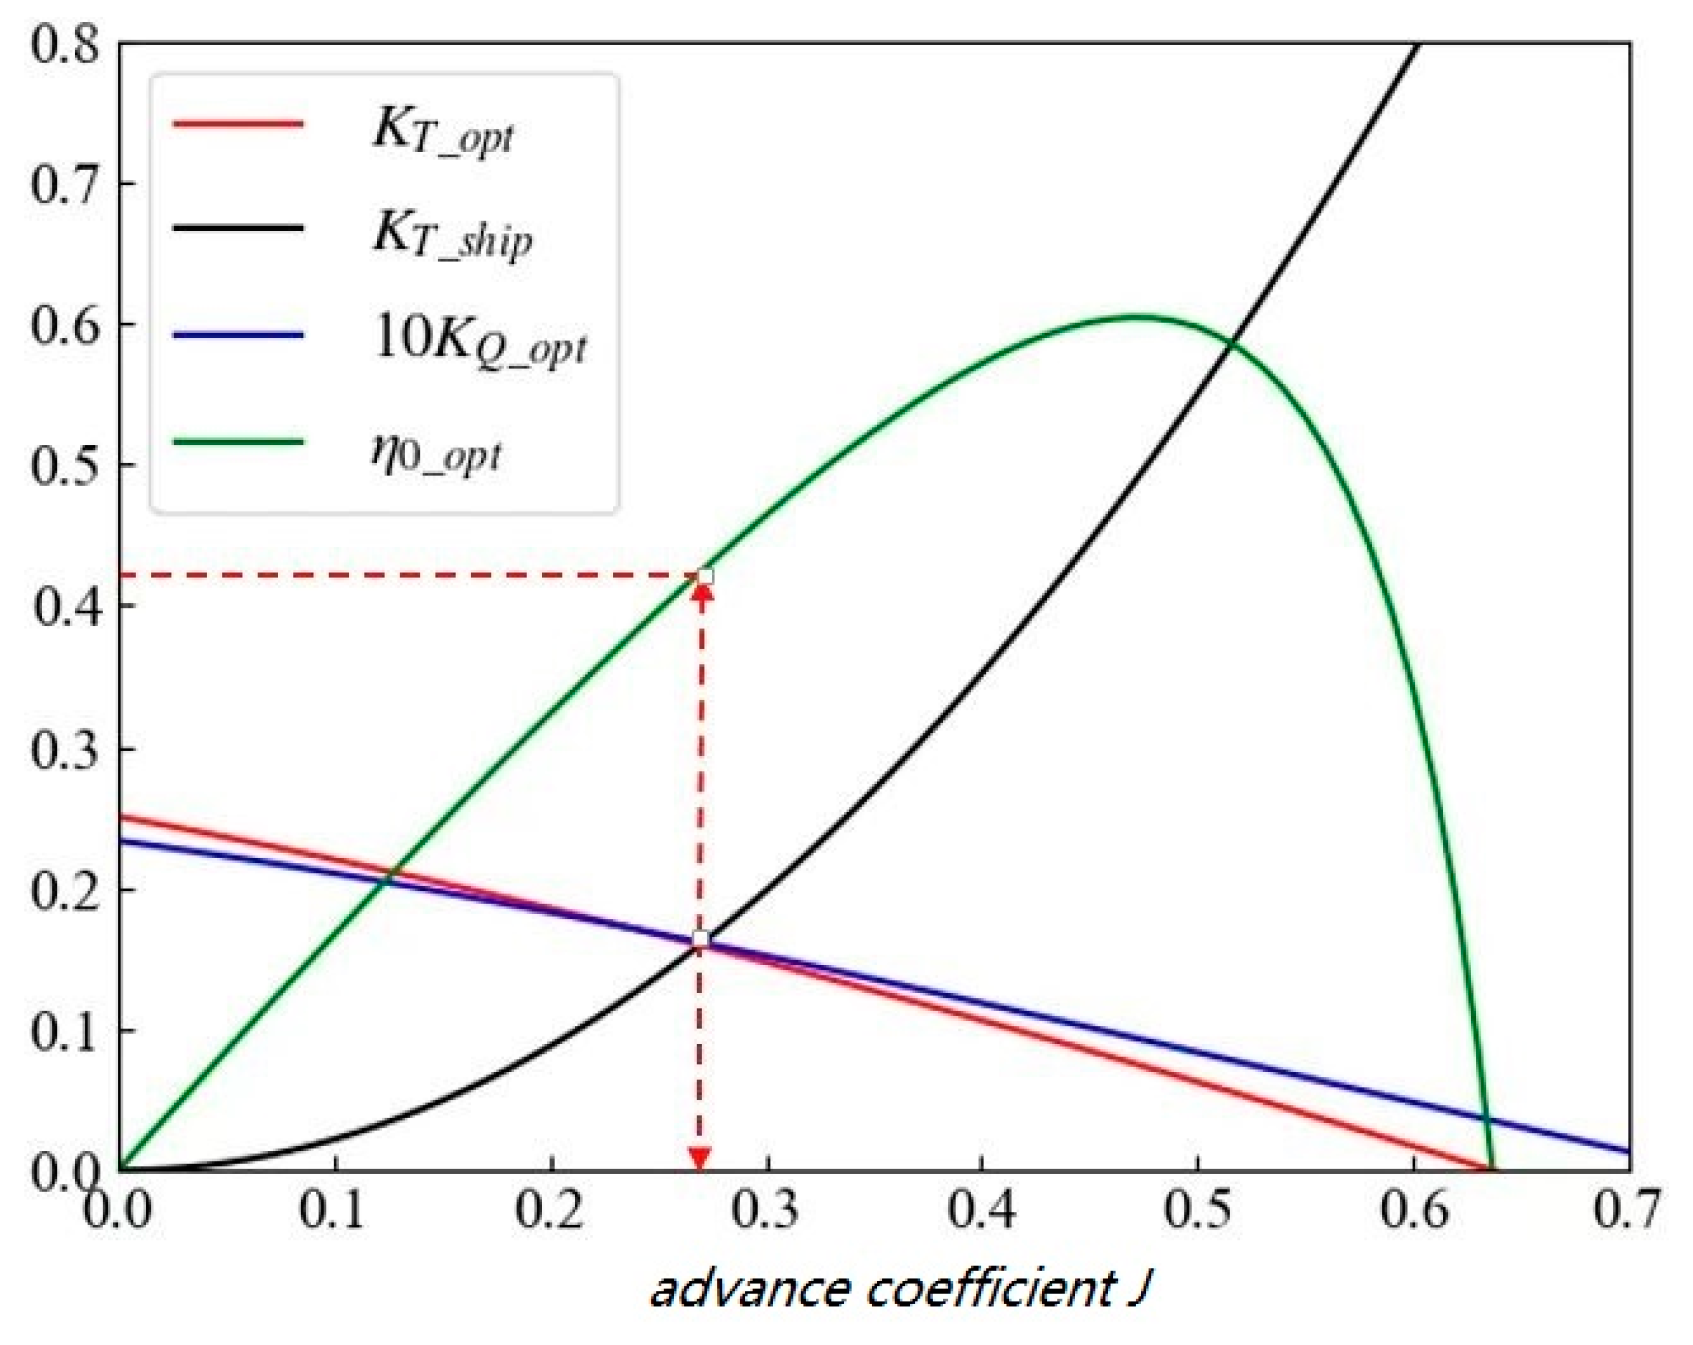
2.3. Results of Ship Engine Propeller Matching Model
The Dutch B series propeller is selected in this paper, and the parameter settings of propeller matching models are shown in
Table 2:
Figure 2 shows the propulsion coefficient diagram and the open water characteristics diagram of propeller. The intersection of propeller thrust coefficient diagram and the open water characteristics diagram of propeller is the balance point of ship power. The thrust coefficient, torque coefficient and propeller efficiency
at each balance point are calculated by setting different pitch ratios. By comparing the calculated results, the corresponding pitch ratio of the maximum propeller efficiency is finally obtained.
After calculation, the corresponding pitch ratio of the maximum propulsion efficiency is 0.62, and the propulsion power is 2 × 72.42 kW.
3. Propulsion System Scheme Selection
LNG is a clean fuel with high efficiency, no pollution and high calorific value [
17]. This section discusses the economy, power performance and pollution of LNG engine, and compares with the original power system under typical working profiles.
3.1. Propulsion System Comparison
3.1.1. Economic Analysis
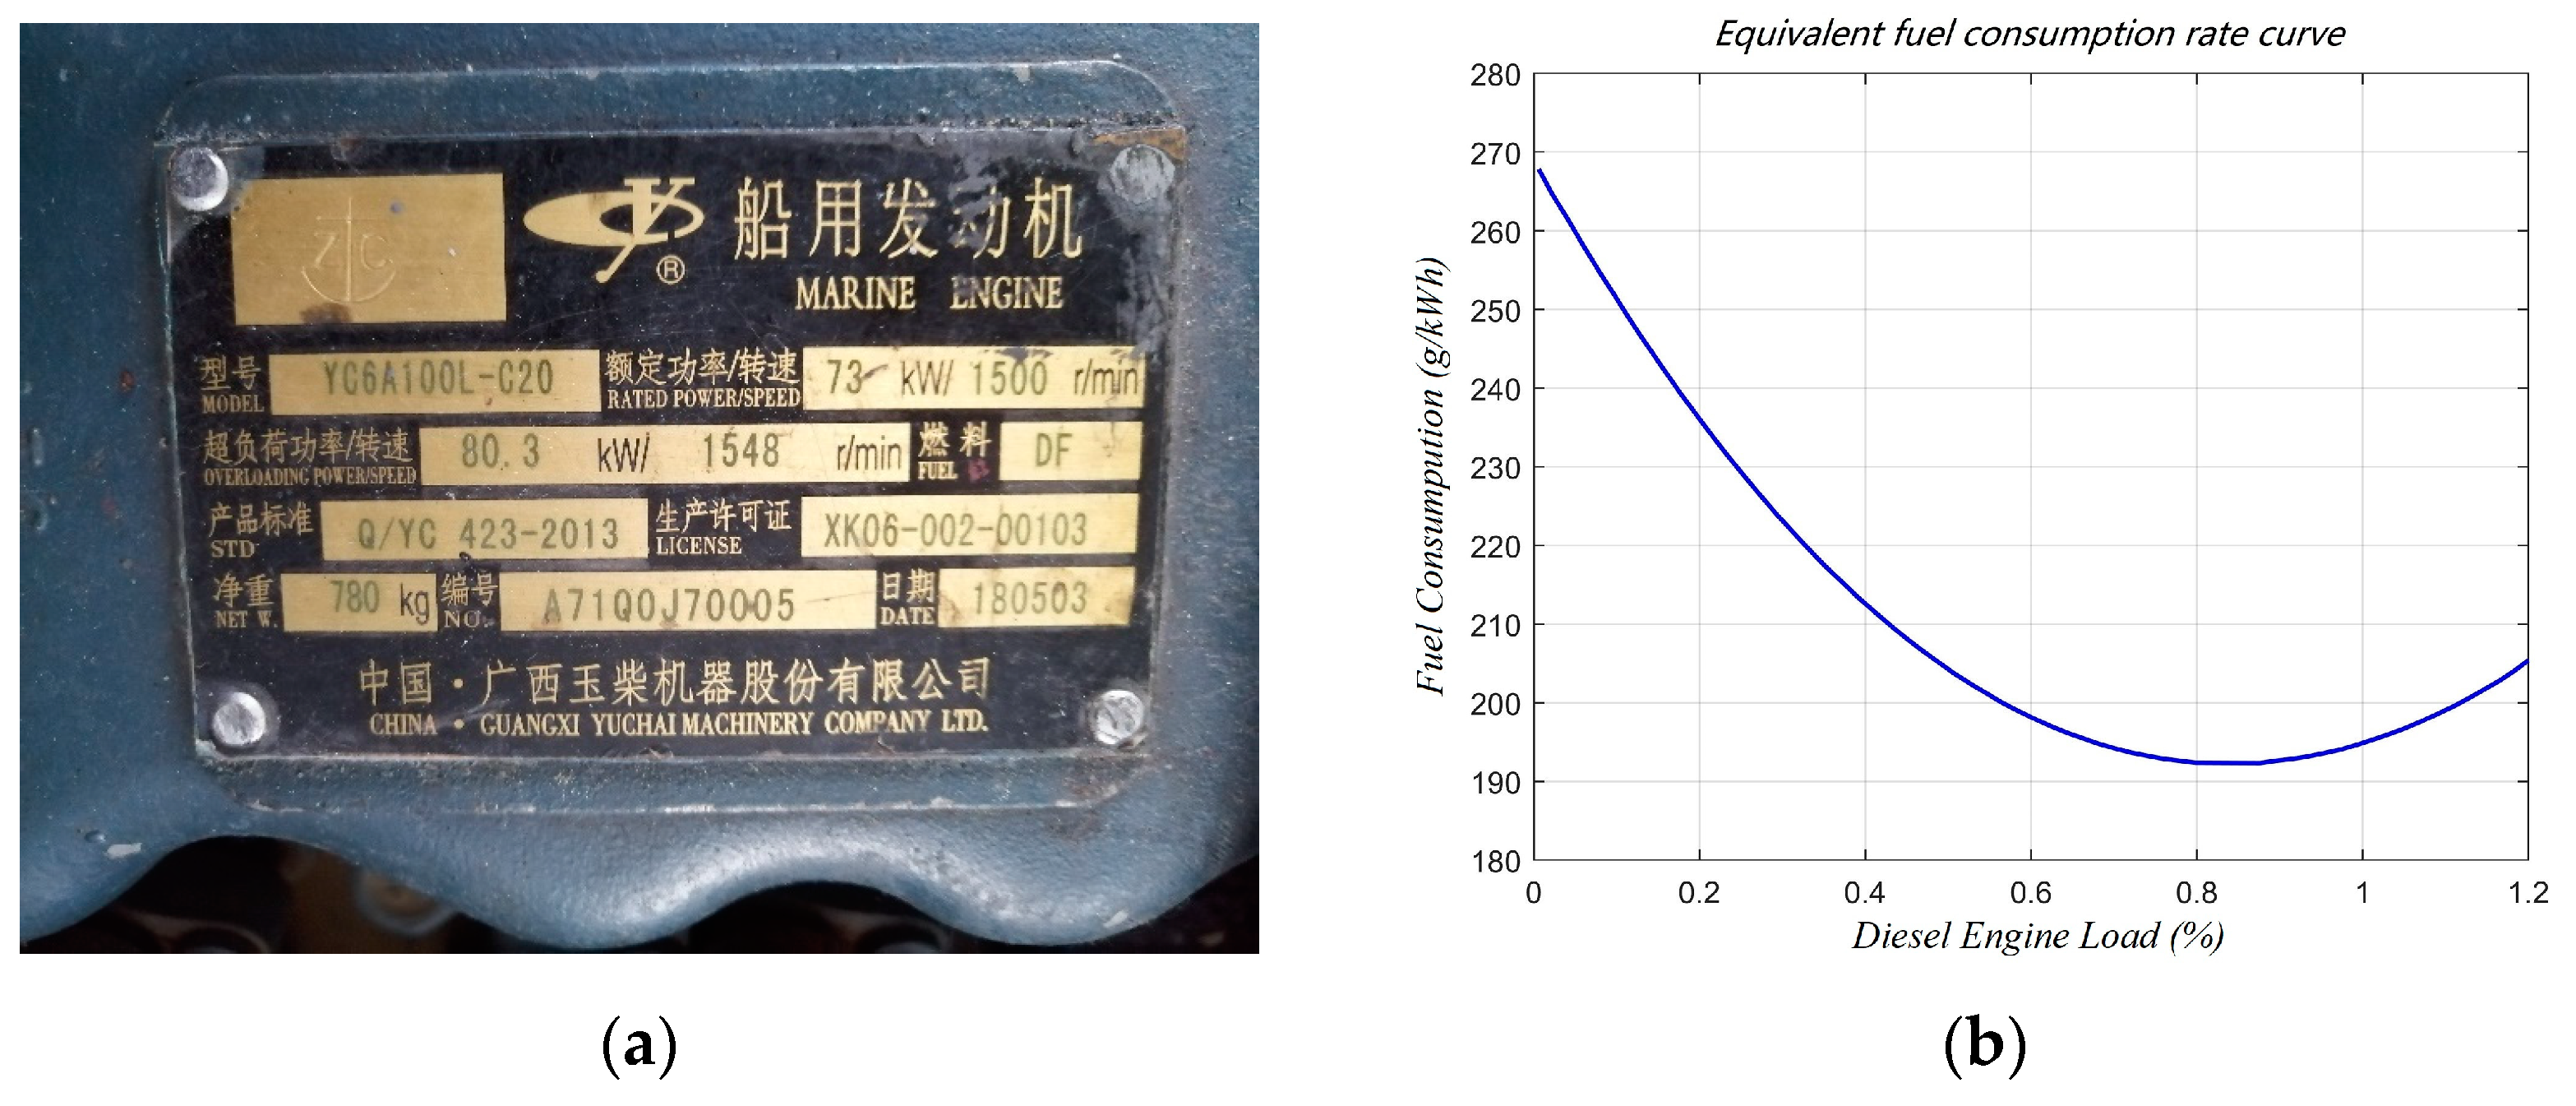
The economy of the propulsion system is analyzed by calculating the fuel consumption under typical working profiles.
Figure 3a shows the engine of the target ship. According to the engine test data, the relationship between engine power level and fuel consumption is obtained by fitting method, as shown in
Figure 3b.
Fuel consumption of diesel engine is expressed as follows:
In order to measure LNG engine performance, we found a WP4.1NG100E50 engine whose power is 74 kW. According to the test data provided by the manufacturer, the relationship between fuel consumption and power level can be obtained by fitting as follows:
The fuel consumption of LNG engine
can be described as:
After calculation, the total fuel consumption of diesel engine under typical working profiles is 13.55 kg. The average fuel consumption rate is 205.11 g/kWh, nearly 7% higher than the lowest fuel consumption point. The fuel consumption of LNG is 10.25 kg.
The price of diesel is about 5200 RMB/t (748 $/t), and the price of natural gas is about 3800 RMB/t (551.5 $/t). Therefore, the price of diesel engine and LNG engine in this case is 70.5 RMB (10.1 $) and 39 RMB (5.6 $), respectively.
3.1.2. Emission Analysis
At present, the calculation methods of ship pollutants include calculation based on fuel consumption and calculation based on ship activities. The calculation based on ship activities, the fuel consumption is calculated according to actual power of host and fuel type and actual power of auxiliary engine in each segment and under each navigation condition. Due to the lack of ship activity data, this paper uses the method based on fuel consumption combined with emission factors to calculate pollutants. The ship pollution factors commonly used are shown in
Table 3.
According to the emission factor table, the emissions of various pollutants can be described as:
The calculated pollutant emissions of diesel engine and LNG engine are shown in
Table 4.
3.1.3. Dynamic Behavior Analysis
The dynamic behavior of diesel engine and LNG engine are presented by the fuel loading-unloading diagram. The figure shows the fuel loading-unloading characteristic diagram of two types of engines. As shown in
Figure 4.
The dynamic behavior of diesel engine and LNG engine is compared in the actual ship working profiles.
Figure 5 shows the response of diesel engine and LNG engine under current working profiles. It can be seen from the figure that the diesel engine can well meet the power demand, but the output power of the diesel engine fluctuates seriously in the response process. The response of LNG engine is obviously slow and even cannot meet the basic demand of ship power for a long time.
Therefore, LNG engine has absolute advantages in fuel cost and low emission performance relative to diesel engine, but the power performance of LNG engine is bad in this case, so it cannot be used as an independent power system for the ship.
3.2. Topological Structure of Hybrid Power Ship
The load changes greatly under typical working profiles, so it is unable to use LNG engine as power source alone. It is considered to introduce ESS to form a hybrid power system to stabilize the output of LNG engine.
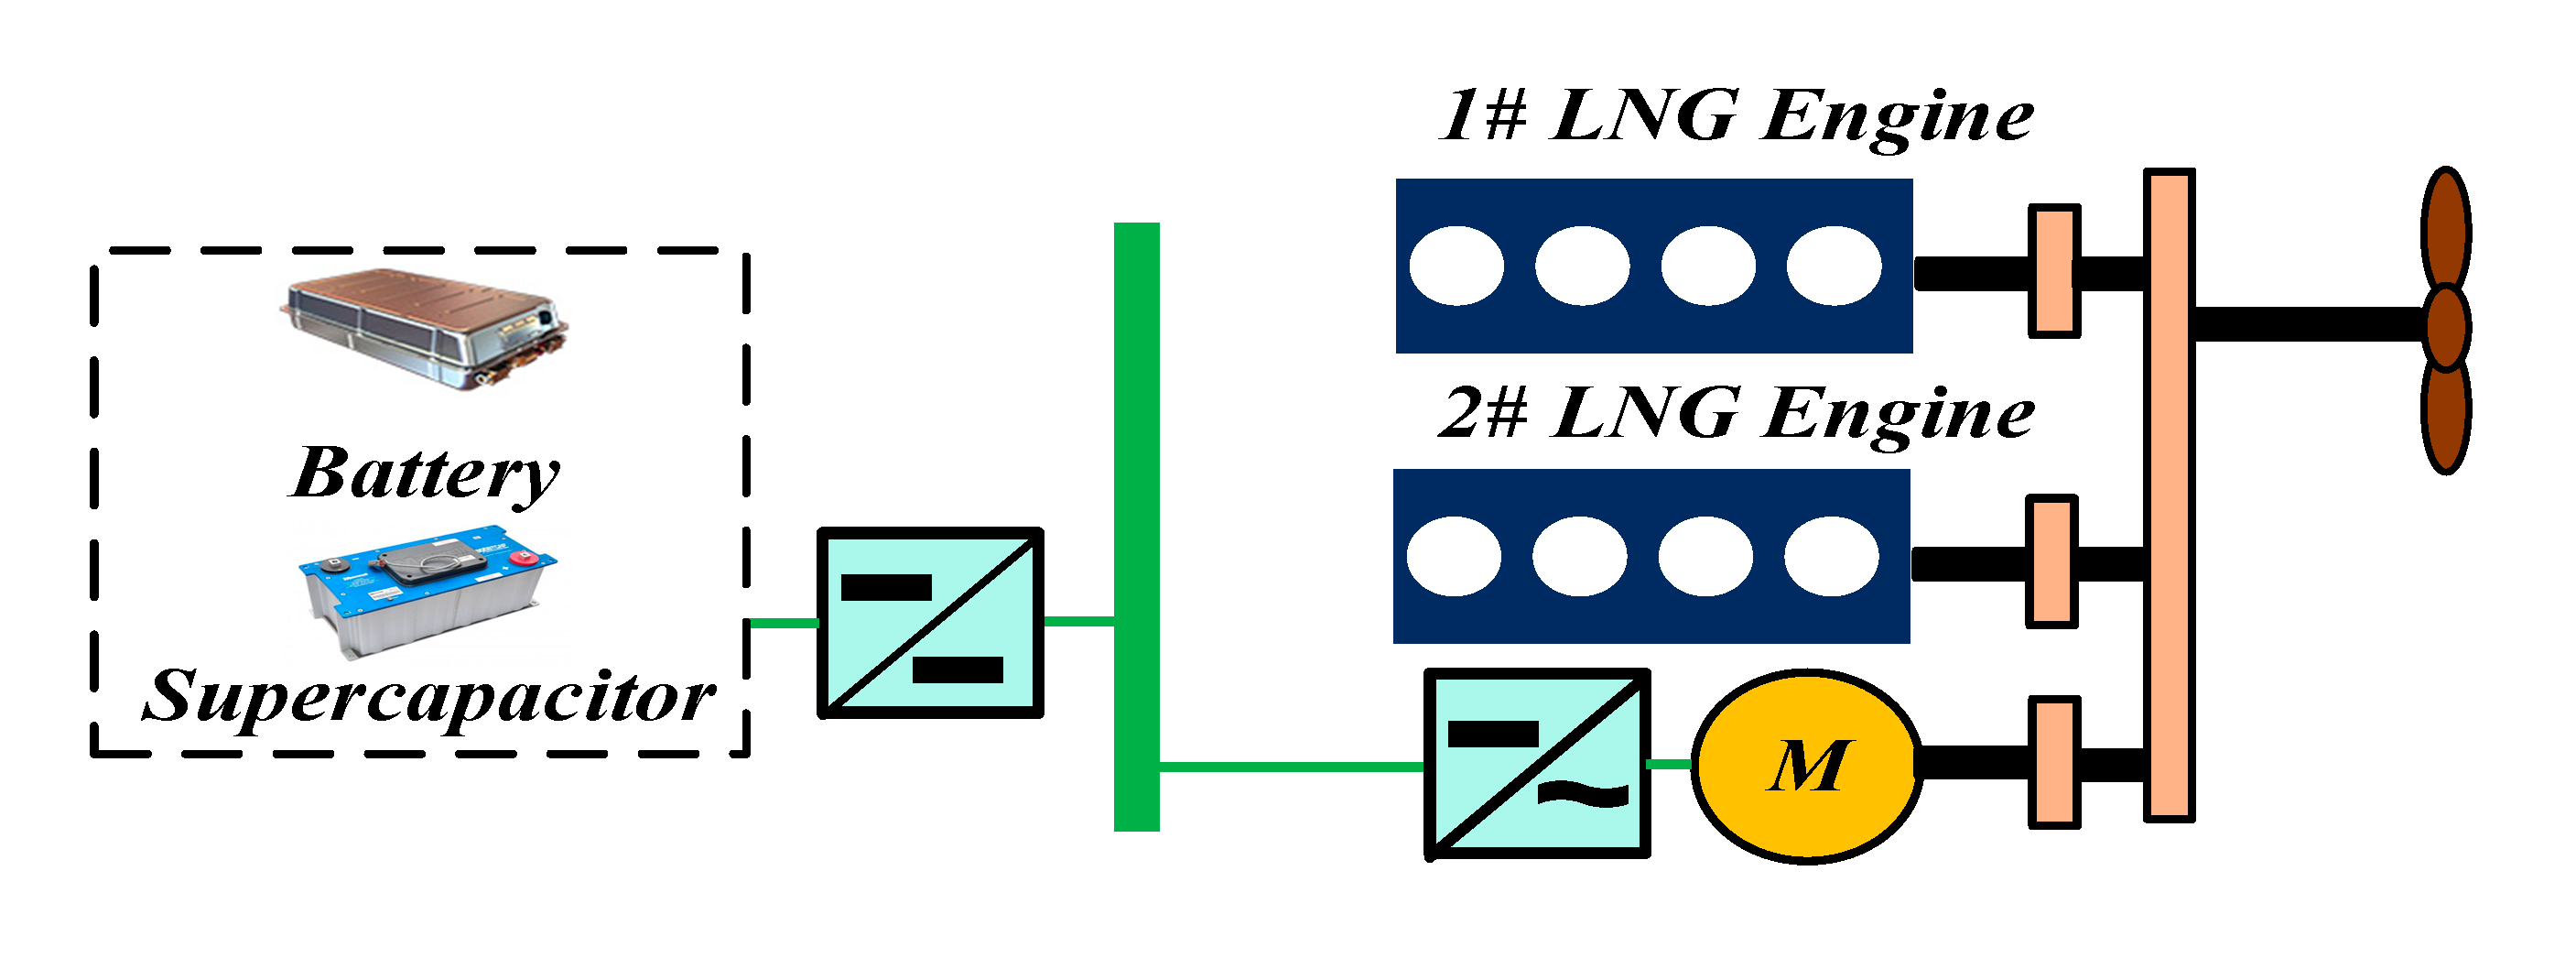
According to the different coupling forms and working modes of the power source, the topological structure of common hybrid propulsion configuration is mainly divided into serial, parallel and serial-parallel.
The serial configuration is simple in topology and convenient in use, but its energy loss is large after secondary conversion, it is suitable for engineering ships. The parallel configuration supports the joint propulsion of motor and engine, with various working modes and high energy utilization rate. However, the engine and propeller adopt mechanical structure, the working point is limited. The serial-parallel configuration combines the advantages of the serial configuration and the parallel configuration, but its structure is complex, energy flow and distribution are diverse, and it is difficult to promote in practice.
Considering that the typical working profiles of the ship only account for about ¼ of the sailing time, most of the working time are relatively stable, where the task can be completed only by LNG engine. According to the result of the ship-engine-propeller matching model, the new ship power system is equipped with 2 × 80 kW LNG engine which consider a power reserve of 10% due to wind and wave currents. In addition, the working environment are complex under typical case, and LNG engine is difficult to complete tasks alone. Therefore, parallel hybrid power configuration is designed, and LNG engine and ESS complete tasks together. The topological structure of the designed hybrid power system is shown in
Figure 6.
3.3. Demand Analysis and Selection of ESS Equipment
The ship often encounters impact load during navigation. If only lithium battery is used as the ESS, the lithium battery will suffer high amplitude current pulse under frequent variable working profiles, which violates the characteristics of lithium battery and seriously affects the service performance and life of lithium battery. The advantage of supercapacitor is to bear high-frequency power, its energy density is low, so it cannot be used as energy storage device alone [
18]. In this research, lithium battery and supercapacitor are combined as a composite ESS, in which supercapacitor bears high-frequency power and lithium battery bears low-frequency power, so as to optimize energy storage performance and life.
Compared with other lithium batteries, lithium titanate batteries have high safety, high stability, long life and environmental protection, and are suitable for inland ships, which pursue high stability and long cycle applications.
The lithium titanate battery cabinet produced by SaiSiYi Company is selected in this research. Its discharge rate is up to 10 C, which is much higher than other lithium batteries. The SOC range is 20–100%, and the unit price is 3600 RMB/kWh.
A supercapacitor is a power device, which has the advantages of high power density, fast dynamic response and long life [
19]. Due to its low energy density, it generally works together with other energy equipment.
Current, terminal voltage, capacity, energy and other factors should be considered when selecting supercapacitor. In this research, supercapacitor cabinet produced by Maxwell is selected. Under 1kWhconfiguration, the average power of this supercapacitor can reach 29.4kW/min, the peak power can reach 676kW, and the price is about 47,000 RMB/kWh (6760 $/kWh).
4. Capacity Configuration Optimization Model of ESS
The main task of this section is to optimize the capacity configuration of the power system. Capacity configuration optimization is an important part of the design process of hybrid electric ships. The configuration process is complicated and often involves many aspects such as cost, emission, power and battery life.
4.1. Energy Management Strategy
According to the previous analysis, the average power of the ship in typical working profiles is about 42%. Therefore, the operation mode under typical working profiles is set as a combined operation of one LNG engine and ESS. Develop basic energy management strategies as follows.
4.1.1. Engine Power
In order to ensure the operation efficiency of the LNG engine, The Engine power is set to work stably within the ideal fuel consumption interval.
4.1.2. ESS Distribution
Due to the different power response to different frequencies, low pass filter is used to divide the load power of ESS for battery and supercapacitor. They make use of:
Through the above equation, the frequency domain is mapped to the interval [0,1], and different are set to acquire filters with different cut-off frequencies. is the maximum frequency point, Hz.
4.2. Configuration Model
The tasks of capacity optimization for hybrid electric ships are mainly divided into objective function and constraint condition.
4.2.1. Objective Function
4.2.2. Constraints
Constraints are limits on system characteristics. The more constraints, the more practical significance the model has.
Constraint of power
Constraint of energy
Energy balance
At every moment, the energy relationship between the supercapacitor and the battery should be balanced:
Energy constraint
The configuration of the ESS shall meet the maximum discharge energy and charging energy:
Constraint of SOC
SOC constraints for lithium battery:
In this research, the of lithium battery is set as 20%, as 85%, as 10% and as 90%.
Finally, the energy optimal allocation model is established as follows:
According to the optimization model, the capacity optimization problem of the target ship’s ESS is a multi-objective and multi-constraint coupled optimization problem, which is difficult to be solved by classical mathematical methods. Therefore, NSGA-II algorithm was adopted in this paper to solve the optimal configuration model, which with low computational complexity and good convergence.
4.3. NGSA-II Algorithm
NSGA-II is an evolutionary genetic algorithm based on Pareto solution. Compared with the general genetic algorithm, NSGA-II algorithm runs faster and has better convergence of solution set [
21]. NSGA-II algorithm flow:
Initializing a population P containing N individuals;
Using non-dominant sequencing, selection, cross-cutting and mutation to obtain the primary population;
Combine the parent and child populations, calculate the crowding degree by using the fast non-dominant algorithm, and select suitable individuals according to the non-dominant relationship to form a new population;
Repeat (2) and (3) until the program termination conditions are met.
Combined NGSA-II algorithm and the capacity configuration model, the calculation process of the capacity configuration model of the power system is determined as shown in
Figure 7.
4.4. Solution of Model
4.4.1. Parameters Set of Model and Algorithm
The thermal efficiency of LNG Engine is generally about 50%. The market price of natural gas is about 2.5RMB per cubic meter. The relevant parameters of the optimization model and NGSA-II algorithm as shown in
Table 5.
4.4.2. Results
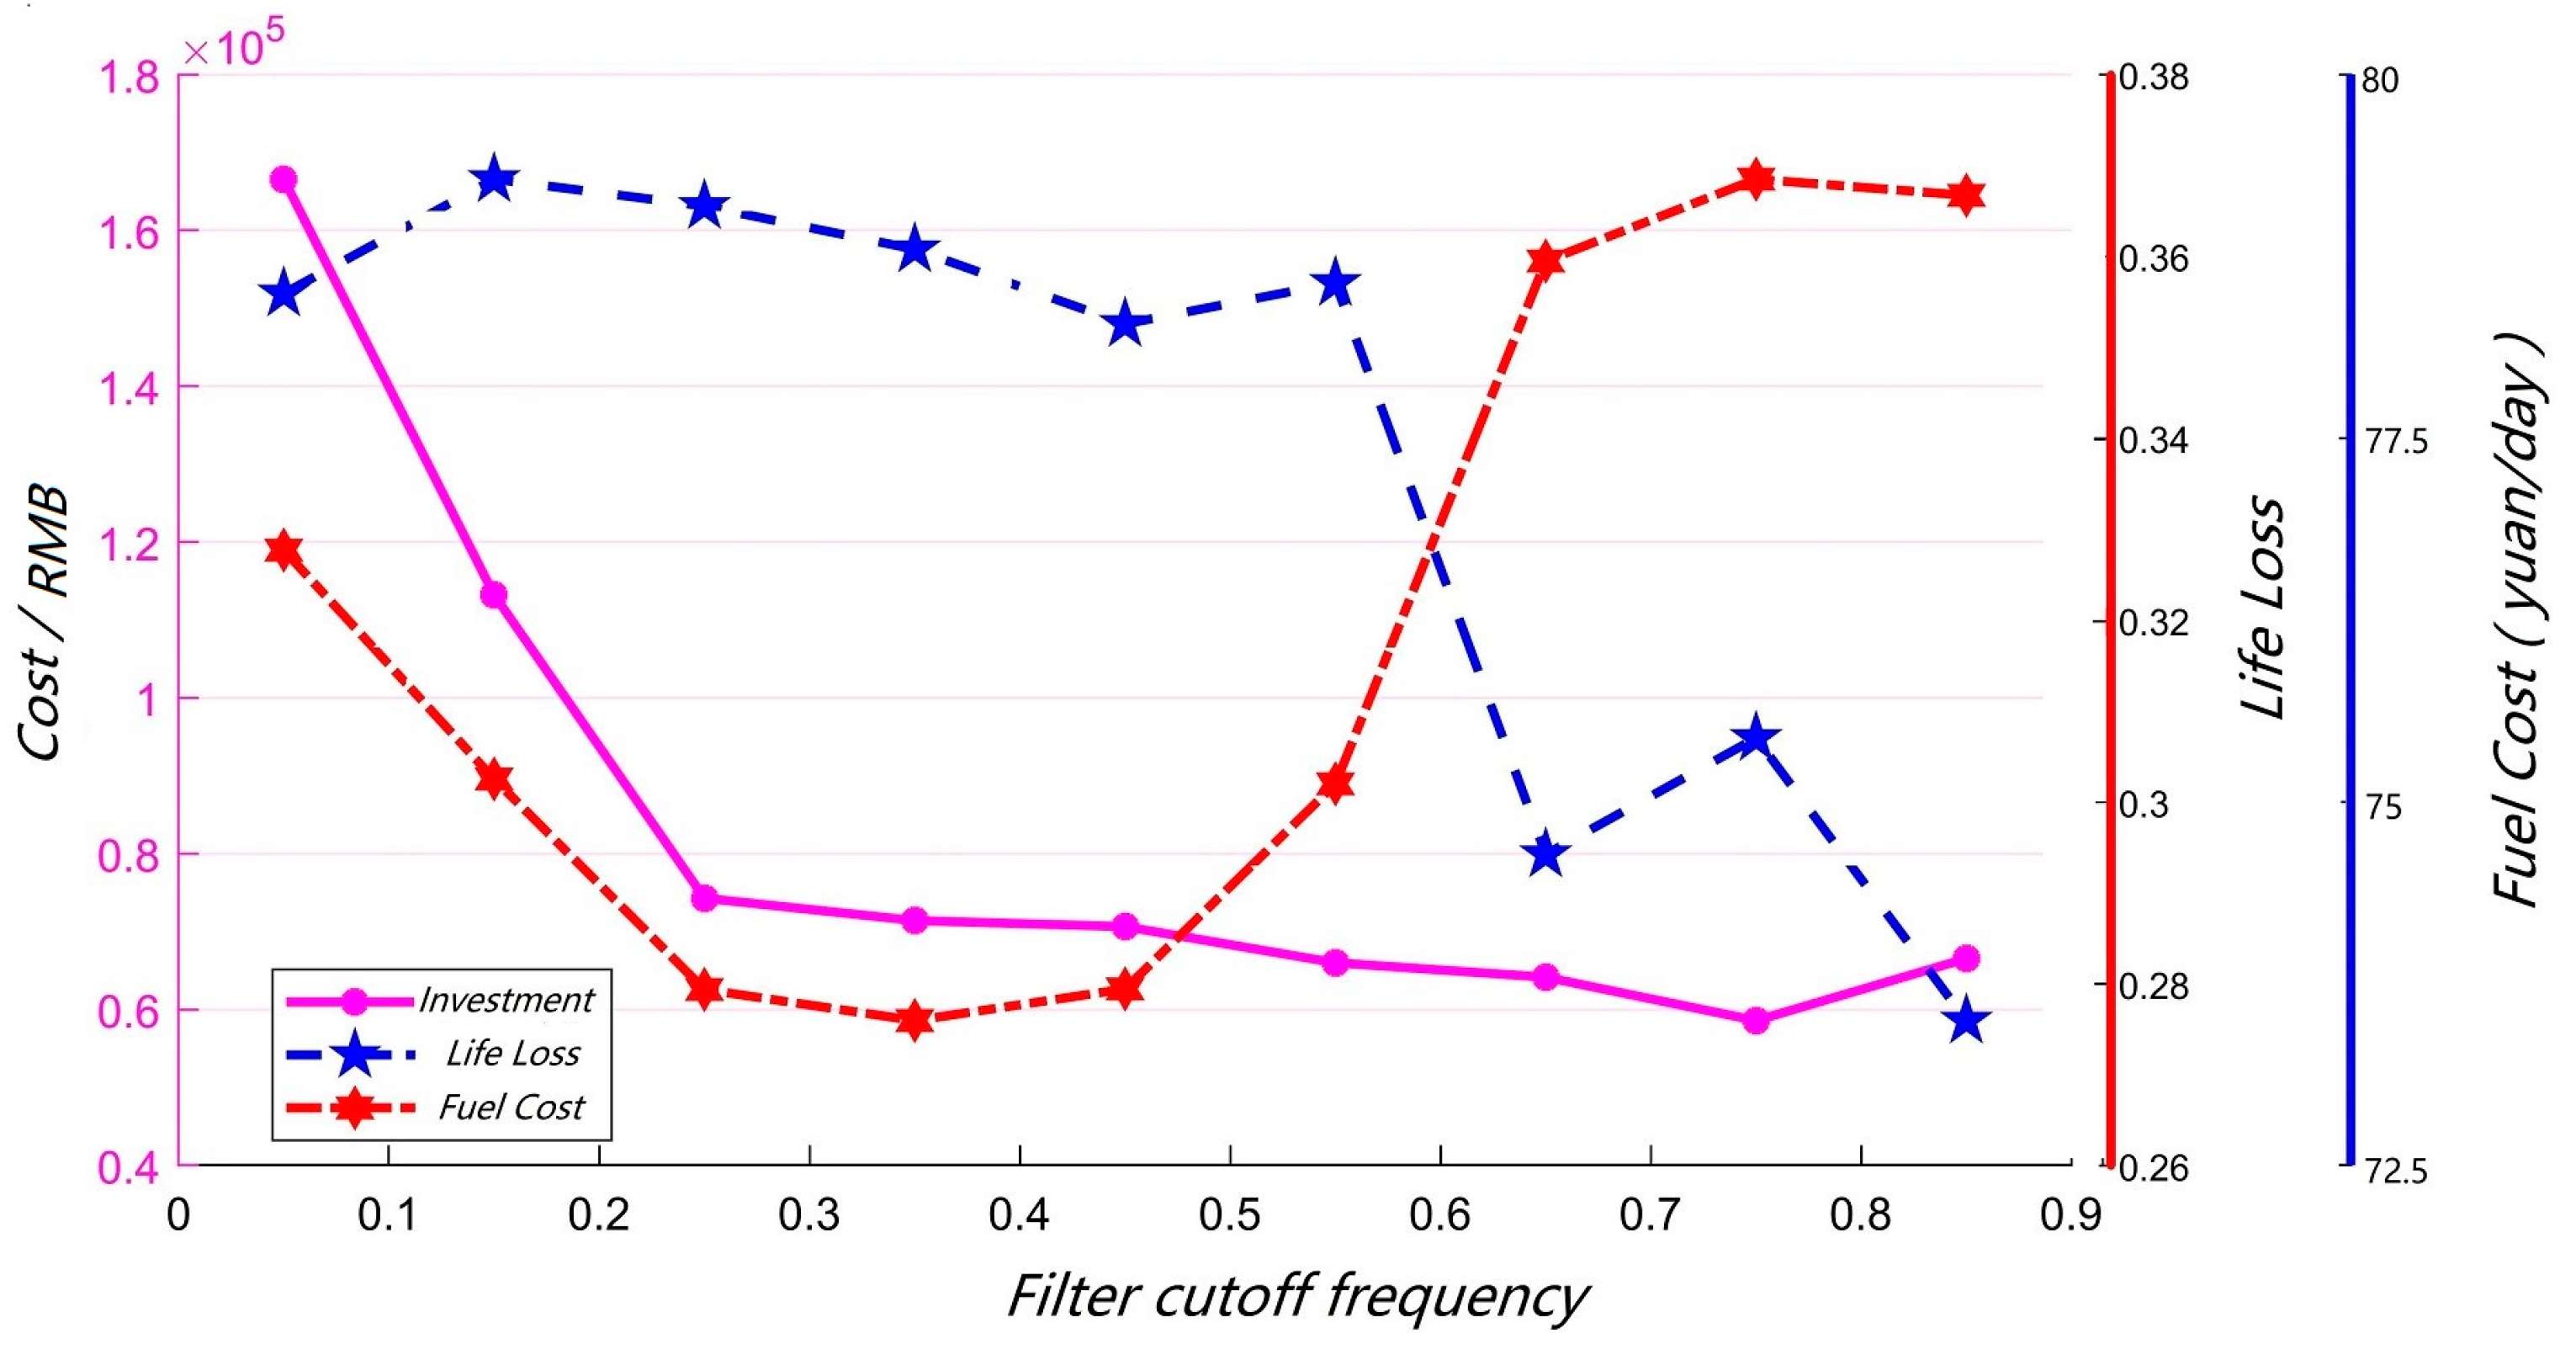
If the filter parameters are set as continuous variables, the calculation is huge and the convergence is bad. In this paper, the trial frequency method is used to set different filter frequencies to initialize the model, and then solved the model.
Figure 8 records the change rule of the objective function of the 50 population particles with the lowest fitness value under each filter.
The results show that when = 0.75, the initial investment cost is the lowest and the daily fuel cost is relatively low. Considering the optimization results of the three objective functions under different filter parameters, the filter cutoff frequency was selected as 0.75. Analyzing the relationship between the typical design variable and the objective function under the cutoff frequency.
Figure 9a shows the influence of supercapacitor capacity on the three objective functions. The fluctuation of data is small, and the capacity is concentrated around 0.12 kWh.
Figure 9b records that the life of the ESS shows a downward trend with the increase of the lithium battery configuration capacity, and the initial investment cost of the system increases approximately linearly. Lastly, the fuel cost is negatively correlated with the lithium battery capacity.
As shown in
Figure 9a,b, the power capacity ratio of the selected supercapacitor is as high as 673 kW/kWh, so there is no need to configure a large capacity to fully meet the power demand of the current system. Therefore, the price of the entire ESS is mainly determined by the cost of lithium batteries. Lithium-ion batteries can replace the output of LNG engines, reducing fuel costs. However, at the same time, the increase of power distribution power causes frequent charge and discharge of lithium battery, cause the life of lithium battery decreases.
Figure 9c shows the relationship between object functions and engine power distribution. The figure shows a positive correlation between fuel cost and engine power distribution, and the life decreases as the power of the LNG engine decreases. In addition, the system investment cost decreases significantly when the engine allocates high power. As shown in
Figure 9b,c, LNG engine and lithium battery together undertake low-frequency power distribution of the system, so engine power distribution directly affects the configuration of lithium battery. When the power of LNG engine is low, the sensitivity of initial investment cost to engine power distribution parameters is very low, indicating that this type of lithium battery can well meet the load energy demand.
In summary, the three objective functions are most sensitive to filter parameters, relatively sensitive to lithium battery capacity and engine power distribution, and completely insensitive to supercapacitor capacity. The filter cut-off frequency basically determines the configuration result of the whole ESS. Therefore, it is of great significance to optimize the configuration of ESS by combining energy management strategy.
4.5. Scheme Evaluation and Result Analysis
The calculation result of the model is a set of solutions, and each solution is the optimal solution. In this section, the evaluation index system is first established. Next, based on multi-attribute decision making theory, entropy weight method and TOPSIS method are used to construct a decision model to realize scheme decision.
4.5.1. Evaluation System
This paper will establish an evaluation system with investment cost, fuel cost, pollutant emission and ESS life as indicators which investment cost, fuel cost and life of ESS are multi-objective optimization results.
In the upgraded powertrain solution, the pollution source is exhaust gas of LNG engine. The pollutants can be presented as:
Therefore, four indicators are developed, which are indicator 1 to indicator 4, which, respectively, represent the acquisition cost, daily fuel cost, annual life loss and pollution emissions.
4.5.2. TOPSIS Method Based on Entropy Weight Method
Entropy weight process
Mathematical expression of the evaluation object [
22]
Assuming that there are n evaluation objects, and each evaluation object includes evaluation indicators, an original index data matrix X of can be formed.
Data preprocessing
Realize dimensionless and indexation of original data.
Computational entropy of information
Calculated the specific gravity of each index in each sample and established specific gravity matrix. According to the information theory knowledge, we can obtain the entropy value of each index.
Determine the weight
By using the obtained information entropy, the index weight is assigned to obtain the index weight.
TOPSIS process
Process of normalization
Conduct dimensionless processing on various index data, and then normalize the original data.
Construct a weighted matrix
Combined with the entropy weight method to calculate the weight and the normalized processing results, then we can acquire the weighting matrix.
Determine the best alternative
Find out the optimal solution and the worst value of each index, and establish the optimal value vector and the worst value vector.
Calculate the good solution distance
Calculate the Euclidean distance between each object with the best and the worst solution.
Relative proximity ordering
Calculate the closeness between each scheme and the optimal solution.
From the results obtained by relative proximity ordering, we acquire the optimal target.
4.5.3. Decision Result
Considering the three optimization objectives of investment cost, life and fuel cost in typical working profiles comprehensively, four schemes to be decided are selected, as shown in
Table 6.
According to the selected scheme set, calculating the indicators of the four scheme, the result is shown in
Table 7.
The TOPSIS model which is based on entropy weight is calculated and the final scores are shown in
Table 8.
Plan B got the highest score and be selected as the best plan. The initial investment cost is about 53,000 RMB (7621 $), the service life of the ESS is about 5 years, and the fuel cost in typical working profiles is 78.35 RMB (11.27 $).
4.5.4. Comparison of Schemes
In order to further discuss the upgraded powertrain, calculate the cost of investment, the cost of daily fuel operation, and the recovery period of the ESS.
The price configuration of ordinary diesel engine is generally 400 RMB/kW (58 $/kW), and the price of LNG engine is about 1000 RMB/kW (143.8 $/kW) according to market research. Based on the results of ship-engine paddle matching, the results of ship-engine paddle matching, the configuration price of the prime power system needed to be configured is about 60,000 RMB (8708 $), and the price of the new power system is about 200,000 RMB (28758 $).
The sailing cycle of the target ship in a day is about 8 h, with typical working profiles accounting for 2 h. Assuming that the ship runs in accordance with the design working profiles during the rest of the time, the fuel consumption of the prime power system and the new power system is calculated to be 152.5 kg and 129.1 kg, respectively, and the fuel cost is calculated to be 793 RMB (114 $) and 491 RMB (70.6 $), respectively. The new power system can save 38% of the fuel cost in one day.
Based on the result of fuel cost calculation, the recovery period of initial investment cost can be calculated as follows:
where,
and
are the prices of the original and current schemes, respectively, RMB;
is the recovery period, years. It is calculated that the recovery life is about 1.28 years.
5. Conclusions and Discussion
In this research, the power data of target ship in typical working profiles are analyzed and the result that the power system has large power fluctuation and deviates from the optimal working conditions for a long time. In order to upgrade the existing power system, comparing the emissions, economy and power performance of LNG and diesel, the results show that upgrading the power propulsion form to gas-electric hybrid form can greatly reduce emissions and fuel costs, while meeting the power requirements.
After comparing different topological propulsion systems, the parallel propulsion configuration with high efficiency and diverse operation modes is selected, in which the energy storage system is composed of super capacitor and lithium battery.
Lastly, by using NGSA-II algorithm and TOPSIS method for configuration model which consider factors such as cost, lifetime of ESS, the best scheme was represented. The scheme is combination of 2 × 80 kW LNG engine and ESS which is consist of 0.12 kWh supercapacitor and 7.96 kWh lithium battery. After using new scheme, the pollutant emission was significantly reduced. At the same time, the initial investment increase from 60,000 to 200,000 RMB, but our daily fuel costs are reduced from 793 RMB to 491 RMB, a reduction of about 38%. In this case, we will realize cost recovery in 1.28 years.
Furthermore, we can extend the configuration model in more case to obtain better accuracy and adaptability in the future.
Author Contributions
Conceptualization, Q.C., H.C. and C.G.; methodology, Q.C., H.C. and Z.D.; software, Z.D.; validation, H.C., C.G., and Z.D.; formal analysis, Q.C. and Z.D.; investigation, Z.D.; resources, Z.D.; data curation, H.C.; writing—original draft preparation, Z.D.; writing—review and editing, Z.D. and C.G.; visualization, Z.D.; supervision, H.C.; project administration, H.C.; funding acquisition, H.C. and C.G. All authors have read and agreed to the published version of the manuscript.
Funding
This research was funded by Science Foundation of Shenzhen City (JCYJ20190809180805560), International S&T Cooperation Program of China (2019YFE0104600), and 111 Project (BP0820028).
Institutional Review Board Statement
Not applicable.
Informed Consent Statement
Not applicable.
Data Availability Statement
Not applicable.
Conflicts of Interest
The authors declare no conflict of interest.
Nomenclatures
| Effective power of ship (kW). |
| Ship resistance (N). |
| Ship speed (m/s). |
| Resistance coefficient. |
| ω | Wake coefficient. |
| Propeller thrust (N). |
| Thrust deduction coefficient. |
| Number of propeller blades. |
| Fluid density (kg/m3). |
| Rotational velocity of propeller (rad/s). |
| Diameter of propeller (m). |
| Advance coefficient. |
| Fuel consumption of Diesel engine (g). |
| (kW). |
| Number of samples. |
| Power level at time n (kW). |
| Sampling time. |
| Fuel consumption of LNG engine (g). |
| Total emissions of fuel pollutants. |
| Mass of fuel consumption (g). |
| Pollutant emission factor. |
| The capacity of energy storage device (kWh). |
| Cost of energy storage equipment per unit (RMB). |
| Supercapacitors or lithium batteries. |
| Fuel consumption of LNG engine (g/kWh). |
| Unit fuel consumption cost (g). |
| Maintenance coefficients. |
| Cycle life (discharge depth of i). |
| Discharge times of lithium battery. |
| Output Power of each module at time i (kWh). |
| Load power demand (kWh). |
| Minimum output power (kW). |
| Maximum output power (kW). |
| Maximum power commitment (kWh). |
| Energy change (kWh). |
| Stored energy (kWh). |
| Discharge depth. |
| Maximum discharge energy. |
| Charging efficiency. |
| Discharging efficiency. |
| Maximum charge energy (kW). |
References
- Geertsma, R.D.; Negenborn, R.R.; Visser, K.; Hopman, J.J. Design and control of hybrid power and propulsion systems for smart ships: A review of developments. Appl. Energy 2017, 194, 30–54. [Google Scholar] [CrossRef]
- Trinklein, E.H.; Parker, G.G.; McCoy, T.J. Modeling, optimization, and control of ship energy systems using exergy methods. Energy 2020, 191, 116542. [Google Scholar] [CrossRef]
- Chu-Van, T.; Ristovski, Z.; Pourkhesalian, A.M.; Rainey, T.; Garaniya, V.; Abbassi, R.; Jahangiri, S.; Enshaei, H.; Kam, U.S.; Kimball, R.; et al. On-board measurements of particle and gaseous emissions from a large cargo vessel at different operating conditions. Environ. Pollut. 2018, 237, 832–841. [Google Scholar] [CrossRef] [PubMed]
- Johnson, T.V. Review of Diesel Emissions and Control. SAE Int. J. Fuels Lubr. 2010, 3, 16–29. [Google Scholar] [CrossRef]
- Dedes, E.K.; Hudson, D.A.; Turnock, S.R. Assessing the potential of hybrid energy technology to reduce exhaust emissions from global shipping. Energy Policy 2012, 40, 204–218. [Google Scholar] [CrossRef]
- Kistner, L.; Bensmann, A.; Hanke-Rauschenbach, R. Optimal Design of Power Gradient Limited Solid Oxide Fuel Cell Systems with Hybrid Storage Support for Ship Applications. Energy Convers. Manag. 2021, 243, 114396. [Google Scholar] [CrossRef]
- Tsai, C.-T.; Beza, T.M.; Wu, W.-B.; Kuo, C.-C. Optimal Configuration with Capacity Analysis of a Hybrid Renewable Energy and Storage System for an Island Application. Energies 2019, 13, 8. [Google Scholar] [CrossRef]
- Wang, H.; Wang, T.; Xie, X.; Ling, Z.; Gao, G.; Dong, X. Optimal Capacity Configuration of a Hybrid Energy Storage System for an Isolated Microgrid Using Quantum-Behaved Particle Swarm Optimization. Energies 2018, 11, 454. [Google Scholar] [CrossRef]
- Jiang, Q.; Hong, H. Wavelet-Based Capacity Configuration and Coordinated Control of Hybrid Energy Storage System for Smoothing Out Wind Power Fluctuations. IEEE Trans. Power Syst. 2013, 28, 1363–1372. [Google Scholar] [CrossRef]
- Shi, H.; Wang, S.; Zhang, L.; Chen, L.; Fan, S. Research on Optimized Configuration of Micro-Power Supply for AC-DC Hybrid Microgrid Based on Particle Swarm Optimization Dynamic. J. Phys. Conf. Ser. 2019, 1325, 012213. [Google Scholar] [CrossRef]
- Wu, T.; Shi, X.; Liao, L.; Zhou, C.; Zhou, H.; Su, Y. A Capacity Configuration Control Strategy to Alleviate Power Fluctuation of Hybrid Energy Storage System Based on Improved Particle Swarm Optimization. Energies 2019, 12, 642. [Google Scholar] [CrossRef]
- Wang, R. Multi-objective configuration optimization method for a diesel-based hybrid energy system. Energy Rep. 2020, 6, 2146–2152. [Google Scholar] [CrossRef]
- Cheng, L.; Zhang, F.; Liu, S.; Zhang, Z. Configuration method of hybrid energy storage system for high power density in More Electric Aircraft. J. Power Source 2020, 445, 227322. [Google Scholar] [CrossRef]
- Ju, F.; Zhuang, W.; Wang, L.; Zhang, Z. Comparison of four-wheel-drive hybrid powertrain configurations. Energy 2020, 209, 118286. [Google Scholar] [CrossRef]
- Zhang, Y.; Hua, Q.S.; Sun, L.; Liu, Q. Life Cycle Optimization of Renewable Energy Systems Configuration with Hybrid Battery/Hydrogen Storage: A Comparative Study. J. Energy Storage 2020, 30, 101470. [Google Scholar] [CrossRef]
- Mira, J.-D.; Mendoza, F.; Betancur, E.; Manrique, T.; Mejía-Gutiérrez, R. A Propulsion System Design Methodology Based on Overall Efficiency Optimization for Electrically Powered Vessels. IEEE Trans. Transp. Electrif. 2022, 8, 239–250. [Google Scholar] [CrossRef]
- Elgohary, M.M.; Seddiek, I.S.; Salem, A.M. Overview of alternative fuels with emphasis on the potential of liquefied natural gas as future marine fuel. Proc. Inst. Mech. Eng. Part M J. Eng. Marit. Environ. 2014, 229, 365–375. [Google Scholar] [CrossRef]
- Nuchturee, C.; Li, T.; Xia, H. Energy efficiency of integrated electric propulsion for ships—A review. Renew. Sustain. Energy Rev. 2020, 134, 110145. [Google Scholar] [CrossRef]
- Trieste, S.; Hmam, S.; Olivier, J.C.; Bourguet, S.; Loron, L. Techno-economic optimization of a supercapacitor-based energy storage unit chain: Application on the first quick charge plug-in ferry. Appl. Energy 2015, 153, 3–14. [Google Scholar] [CrossRef]
- Georgescu, I.; Godjevac, M.; Visser, K. Efficiency constraints of energy storage for on-board power systems. Ocean Eng. 2018, 162, 239–247. [Google Scholar] [CrossRef]
- Yildizeli, A.; Cadirci, S. Multi-objective optimization of multiple impinging jet system through genetic algorithm. Int. J. Heat Mass Transf. 2020, 158, 119978. [Google Scholar] [CrossRef]
- Celik, E.; Akyuz, E. An interval type-2 fuzzy AHP and TOPSIS methods for decision-making problems in maritime transportation engineering: The case of ship loader. Ocean Eng. 2018, 155, 371–381. [Google Scholar] [CrossRef]
| Disclaimer/Publisher’s Note: The statements, opinions and data contained in all publications are solely those of the individual author(s) and contributor(s) and not of MDPI and/or the editor(s). MDPI and/or the editor(s) disclaim responsibility for any injury to people or property resulting from any ideas, methods, instructions or products referred to in the content. |
© 2023 by the authors. Licensee MDPI, Basel, Switzerland. This article is an open access article distributed under the terms and conditions of the Creative Commons Attribution (CC BY) license (https://creativecommons.org/licenses/by/4.0/).


