Article

Synoptic Flow Variability in a River-Influenced Inner Shelf off Central Chile

by
Marcus Sobarzo
1,2,3,
Camila Soto-Riquelme
4,
Raúl P. Flores
5,6 and
Gonzalo S. Saldías
2,7,8,*
1
Departamento de Oceanografía, Universidad de Concepción, Concepción 4030000, Chile
2
Centro de Investigación Oceanográfica COPAS COASTAL, Universidad de Concepción, Concepción 4030000, Chile
3
Interdisciplinary Center for Aquaculture Research (INCAR), University of Concepción, Concepción 4030000, Chile
4
Instituto de Fomento Pesquero, Putemún, Castro 5700000, Chile
5
Departamento de Obras Civiles, Universidad Técnica Federico Santa María, Valparaíso 2390123, Chile
6
Centro de Investigación para la Gestión Integrada del Riesgo de Desastres (CIGIDEN), Santiago 7820436, Chile
7
Departamento de Física, Facultad de Ciencias, Universidad del Bío-Bío, Concepción 4051381, Chile
8
Instituto Milenio en Socio-Ecología Costera (SECOS), Santiago 8331150, Chile
*
Author to whom correspondence should be addressed.
J. Mar. Sci. Eng. 2022, 10(4), 501; https://doi.org/10.3390/jmse10040501
Submission received: 2 February 2022 / Revised: 19 March 2022 / Accepted: 24 March 2022 / Published: 5 April 2022
(This article belongs to the Special Issue Frontiers in Physical Oceanography)

Abstract

:
The response of inner shelf circulation and bottom temperature variability to synoptic wind forcing and freshwater outflow is evaluated in an area with a wide continental shelf off central Chile. This forced circulation, with a strong seasonal evolution from upwelling- to downwelling-favorable conditions, is a key process modulating the exchange of water properties in a coastal zone characterized by multiple river outflows and high biological productivity. Ocean currents on the inner shelf (34 m depth) off the Itata River mouth were obtained and analyzed for a nine-month record (December 2008 to September 2009). The synoptic wind and current variability was defined between 2 and 16 days (0.02 to 0.0026 cph). The subinertial coastal circulation within the inner shelf off Itata River was dominated by the along-shelf flow, while cross-shelf flows driven by along-shelf winds were substantially reduced. The alongshore synoptic currents showed two distinct modal structures: (i) A mean two-layer flow field during upwelling-favorable wind stress with northward (southward) flow at the surface (bottom), and (ii) a mean southward flow through the entire water column during downwelling-favorable wind stress periods, which were intensified during peak river discharge events in winter. Calculations of the wind index clarified the relative importance of wind versus buoyancy forcing on the alongshore flow. The wind forcing dominated during summer when the river discharge was minimum, whereas the relative importance of the freshwater outflow from the Itata River became dominant in winter (May-August) when the buoyancy forcing, in conjunction with southward wind events, modulated strong barotropic southward flows. The change in the long-term regime of coastal winds and river discharges, with a dominance of upwelling winds and reduced river outflows in the last decade, is discussed in the context of observations of thinner river plumes under frequent upwelling conditions off central Chile.

1. Introduction

The dynamic of the inner shelf is of prime importance to define the exchange of water properties in the coastal zone, which off central Chile is characterized by the influence of several river discharges [1,2] and a strongly seasonal coastal upwelling/downwelling circulation [3] determining a high biological productivity over the continental shelf [4]. Although the inner shelf has been defined in different forms [5], here this term is used to describe the region where the turbulent surface and bottom boundary layers converge, occupying the entire water column [6]. This region is located between the surf zone and the middle shelf, typically spanning water depths from a few meters to a few tens of meters [7]. At mid latitudes and for moderate wind speeds, the inner shelf has a depth lower than 60–100 m [8].
On the mid or outer shelf, the surface and bottom boundary layers are typically thin compared to the total water depth [9,10,11]. Ekman [12] pointed out that due to the Earth’s rotation, the transport induced by friction within the boundary layers (Ekman transport) is perpendicular to the applied stress. According to Lentz [6], Earth’s rotation is less important in shallow waters and there is a direct transfer of momentum throughout the water column that results in a net transport in the same direction of the applied stress [13]. Other studies have also shown that the cross-shelf exchange in the inner shelf is likely a result of a complex interaction between along-shelf, cross-shelf, and wave-induced motions [7].
Idealized two-dimensional numerical models have been used to study the response of the inner shelf to upwelling- and downwelling-favorable winds in a water column with a well defined thermocline [14]. During upwelling (downwelling) events, the pycnocline intersects the surface (bottom) forming a front that is displaced offshore. In the unstratified case, the response to upwelling- or downwelling-favorable winds is basically the same, with only the sign of the circulation reversing. However, stratification imposes differences in the characteristics of the upwelling and downwelling fronts and the nearshore region. During upwelling, weak stratification is maintained in the inner shelf due to the onshore flow of dense water near the bottom. This weak stratification inhibits vertical mixing, which results in a weak cross-shelf circulation on the inner shelf [14]. For the case of downwelling-favorable winds, the inner shelf becomes unstratified due to a weak cross-shelf circulation that transport light water under dense water, causing convection and enhanced vertical mixing [9]. The width of the inner shelf increases as the upwelling front is advected offshore at a relatively constant rate, whereas the offshore velocity of the downwelling front is reduced as the thickness of the bottom boundary layer increases over the sloping bottom [14].
In terms of observational studies related to coastal currents, a previous work in the mid-shelf (∼90 m depth) off central Chile under upwelling-favorable wind stress showed that the observed transport, calculated using cross-shore subinertial currents and an Ekman layer of 20 m thick, correlated well with the theoretical Ekman transport using local wind stress data [11]. Farther onshore over the inner shelf the current variability in the near-diurnal band was significant and responded to the sea breeze, explaining up to 40% of the total current variance [15]. Then, coastal circulation on this shelf is influenced by synoptic and diurnal winds with relatively weak tidal currents (<18% of the total current variance), strong near-inertial currents, decreasing in intensity towards the coast [16], and strong input of freshwater from local rivers during winter and spring [17]. Other studies, related with internal tides proposed that semidiurnal internal waves could contribute to the input of nutrients to the photic zone due to internal mixing [18,19]. There is much less information on the subinertial and synoptic variability of the flow along the inner shelf, and its response to the dominant forcings. The aim of this study is to contribute to the understanding of the dynamics of the variability of coastal currents in the synoptic band on a river-influenced inner shelf off central Chile. It is motivated by the growing interest to estimate the transport and fate of dissolved and suspended materials in the water column coming from the ocean (nutrients, larvae, water of low oxygen content) and from river discharges (sediments, heavy metals, pesticides and other pollutants) in a region with a relatively wide continental shelf limited by submarine canyons [11,20].

2. Materials and Methods

The study area is located off central Chile between the Biobio and Itata submarine canyons, ∼2 km from the Itata River mouth (Figure 1). In this region, the coastline is straight, oriented to the northeast (20° from the North), and the bathymetry is characterized by isobaths which are more separated south of the Itata River [15], indicating a slightly narrower inner shelf north of the river mouth (Figure 1a). The width of the continental shelf at this latitude is about 60 km [11].
Coastal currents were measured from December 2008 to September 2009 using an upward-looking RDI Workhorse Acoustic Doppler Current Profiler (ADCP, 600 kHz), with a sampling frequency of 10 min and a vertical resolution of 1 m. The ADCP was deployed in 34 m depth (Figure 1b). The resulting velocity dataset ranged from depths of 32.6 m to 3.1 m, above which the data were discarded to avoid side-lobe and wave contamination. This instrument also measured bottom temperature and pressure. Hourly mean data were obtained from averaging the original data.
Wind data was obtained from the coastal station at Hualpen Point (36º45 S; 73º11 W) located 47 km south of the Itata River mouth. For the climatological analysis of the wind, data from the Carriel Sur airport were used (Figure 1a). After magnetic correction (6.82º W), the time series of winds and currents were averaged hourly, and decomposed in zonal (east-west) and meridional (north-south) components. Then, the wind and current time series were rotated into a coordinate system that is approximately aligned with the coast, with the alongshore direction (V) positive to the northeast and the cross-shore direction (U) positive onshore.
In order to focus our analysis on the synoptic variability of currents and its response to the corresponding pulses of winds and river discharges, subinertial winds and currents were obtained using a cosine Lanczos filter with a cut-off period of 40 h. These time series contain seasonal variability. Before applying the cosine filter, tidal currents were removed using harmonic analysis [21]. Tidal currents were relatively weak, accounting for 5–10% and 1–5% of the semidiurnal and diurnal currents (not shown), respectively. The inertial and seasonal variability explained about 3–5% and 3–8% of the variability (not shown), respectively, and the remainder was dominated by fluctuations in the synoptic band (2 to 16 days), which explained between 47–56% of the total current variability. The synoptic currents were dominant in the alongshore direction, while the inertial, diurnal, and semidiurnal currents showed more energy in the cross-shore component (not shown). The distribution of the synoptic currents showed a southward trend with a strong alignment with the local bathymetry, especially at mid-water and bottom levels (Figure 2). Thus, the synoptic current components were calculated along the major principal axis (alongshore flow). The vertical structure of the subinertial and synoptic signal was described using empirical orthogonal functions [22], and the relation between winds and currents was evaluated using cross-spectra and cross-correlation analyses.
A square wavelet coherence analysis was used to determine the coherence and phase between the time series of the wind stress (Hualpen Point) and currents, and also between the river discharge and currents [23]. For these analyses, the alongshore and cross-shore components of wind stress and currents (at 3.1, 18.1 and 32.6 m) were used.

3. Results

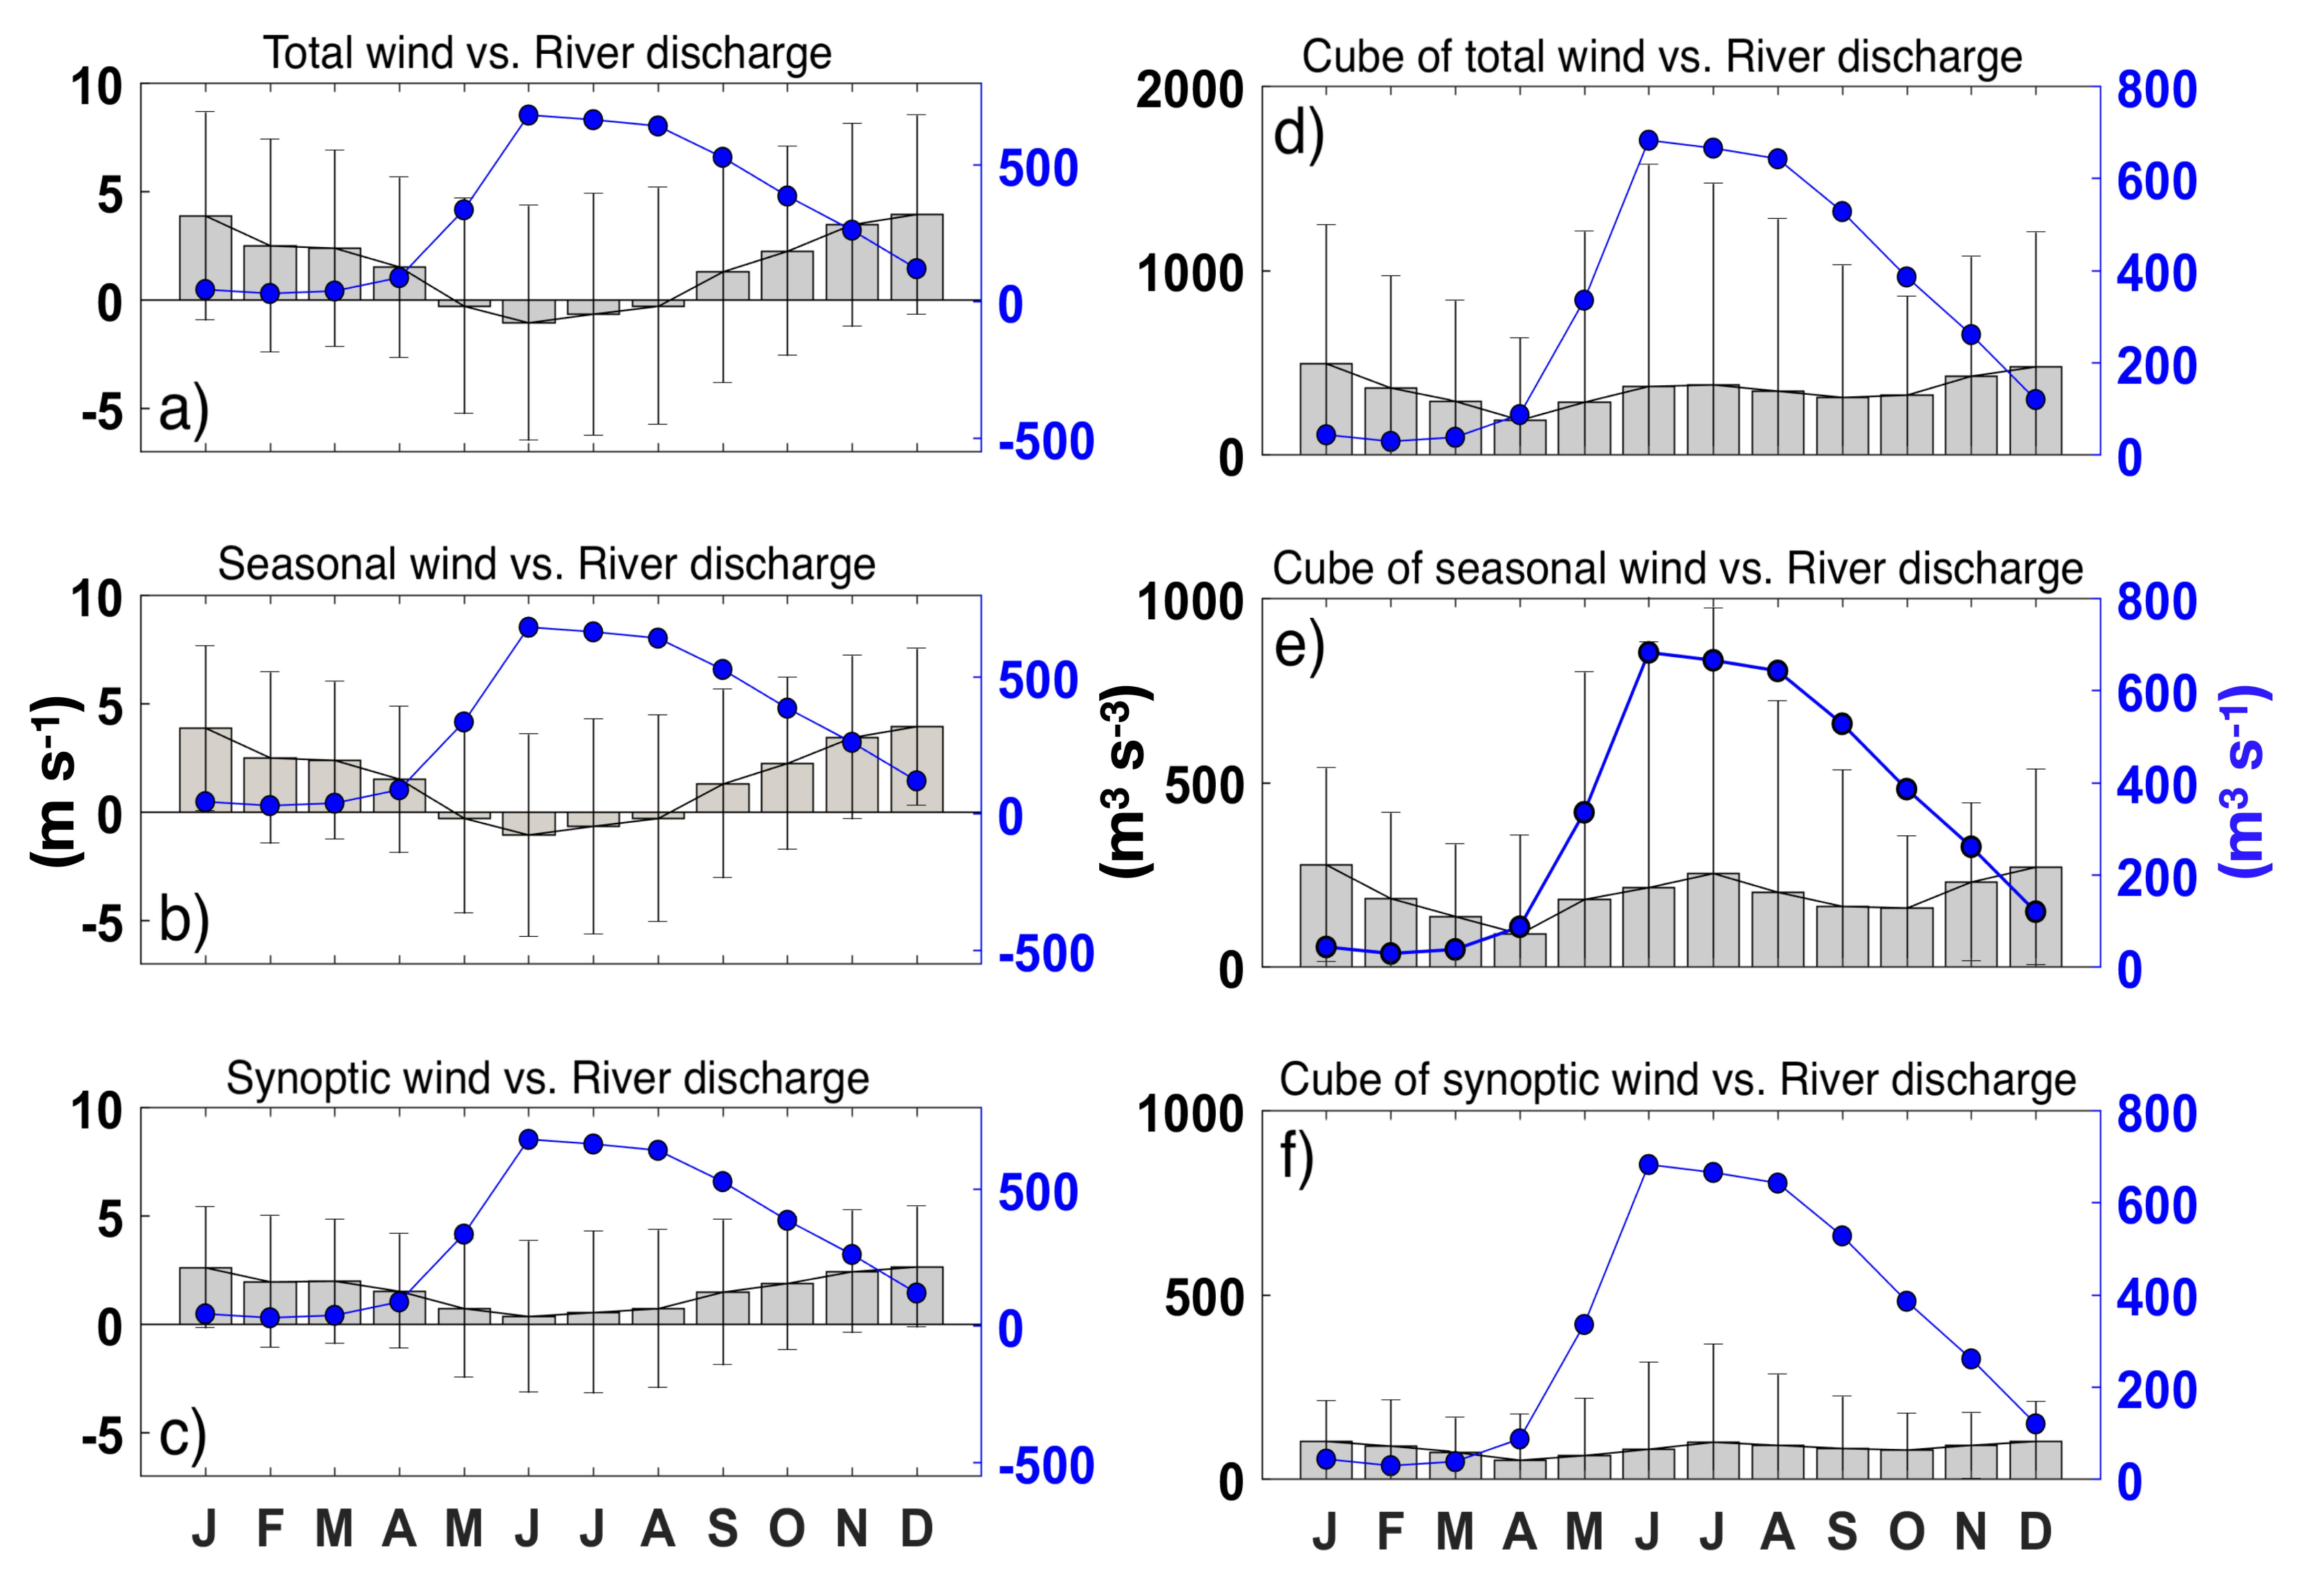
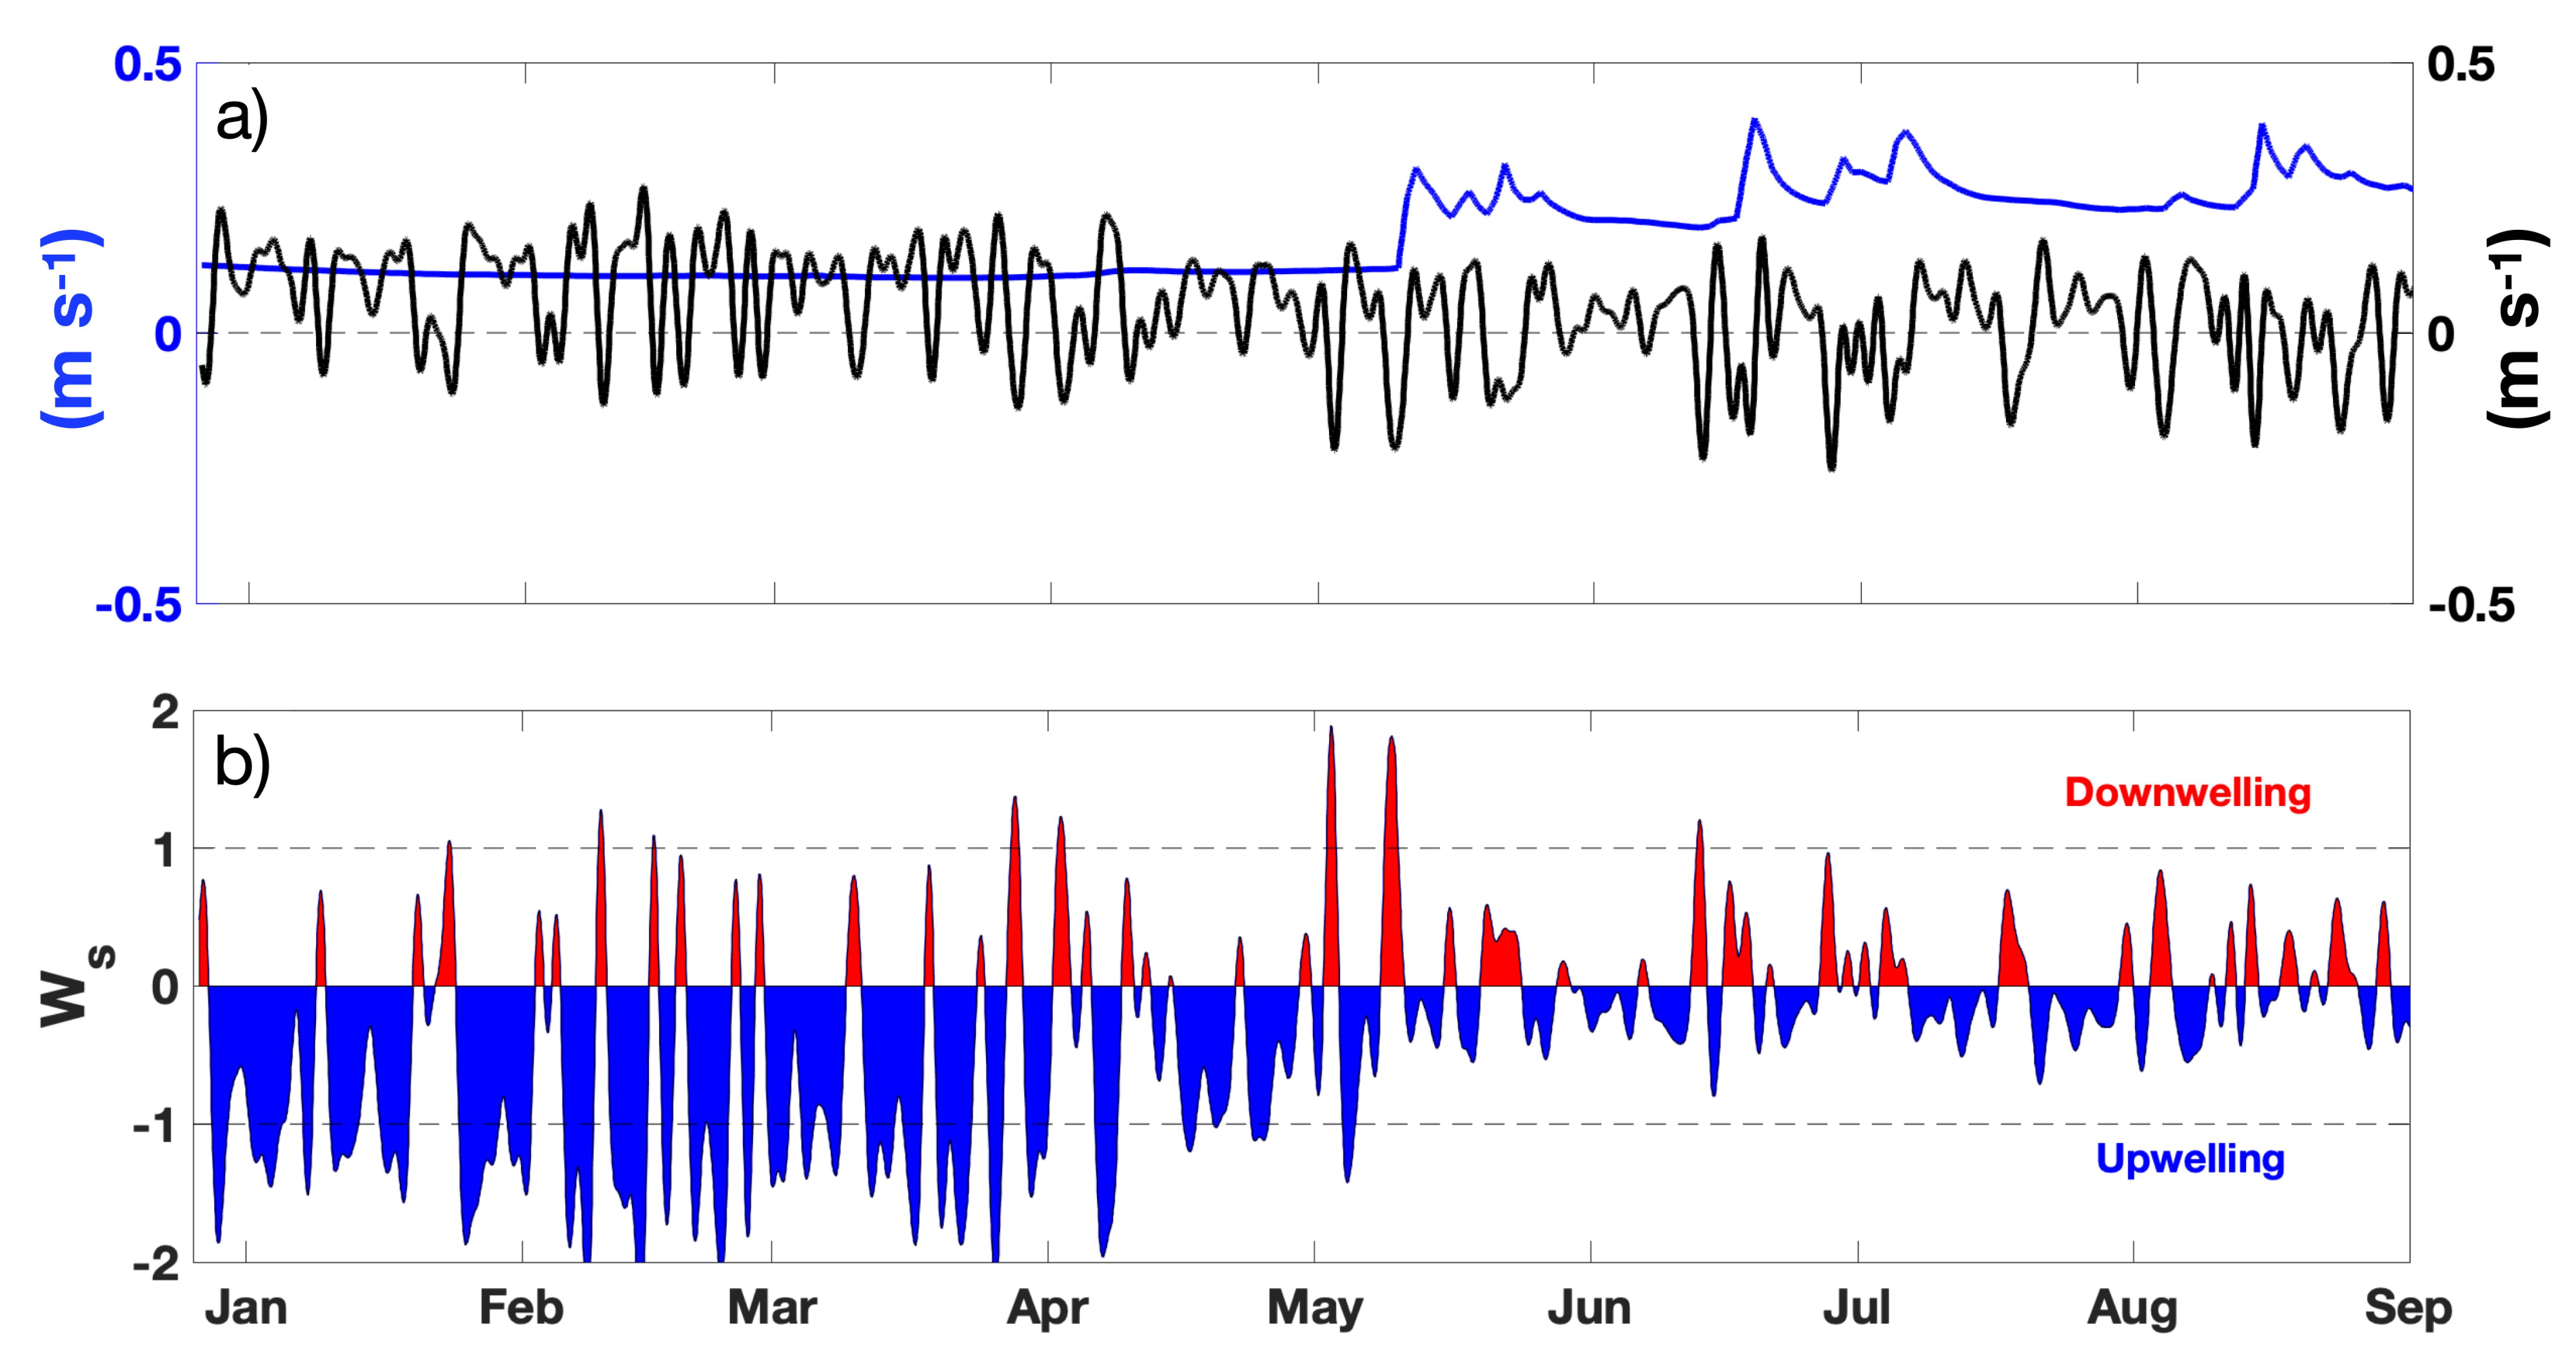
3.1. Seasonal and Synoptic Wind Variability

The seasonal variability of the total alongshore winds showed upwelling-favorable conditions during spring-summer (September–April) (Figure 3a). This wind pattern contrasts with the seasonal cycle of river discharge in the study area. Upwelling-favorable winds and relatively high river discharges occur in spring, whereas upwelling-favorable winds and the lowest river discharges of the annual cycle are found in summer (Figure 3a). In contrast, downwelling-favorable (southward) winds dominate in winter (May–August) when the river discharges are maximum (Figure 3a,b). While the magnitude of the winter winds are smaller than those of spring-summer, the mechanical wind energy available to generate mixing in the water column (cube of wind speed) is only slightly lower in winter (Figure 3d). The alongshore seasonal wind (periods > 16 days), followed the pattern of the total wind with mean amplitudes below 4 m s 1 (Figure 3b). For the case of the synoptic variability, the monthly mean of the alongshore upwelling-favorable winds dominate yearlong, but with the lowest mean values during winter (Figure 3c). The synoptic wind variability showed the lowest and less variable mechanical energy throughout the annual cycle, with values around 100 m 3 s 3 (Figure 3e,f).

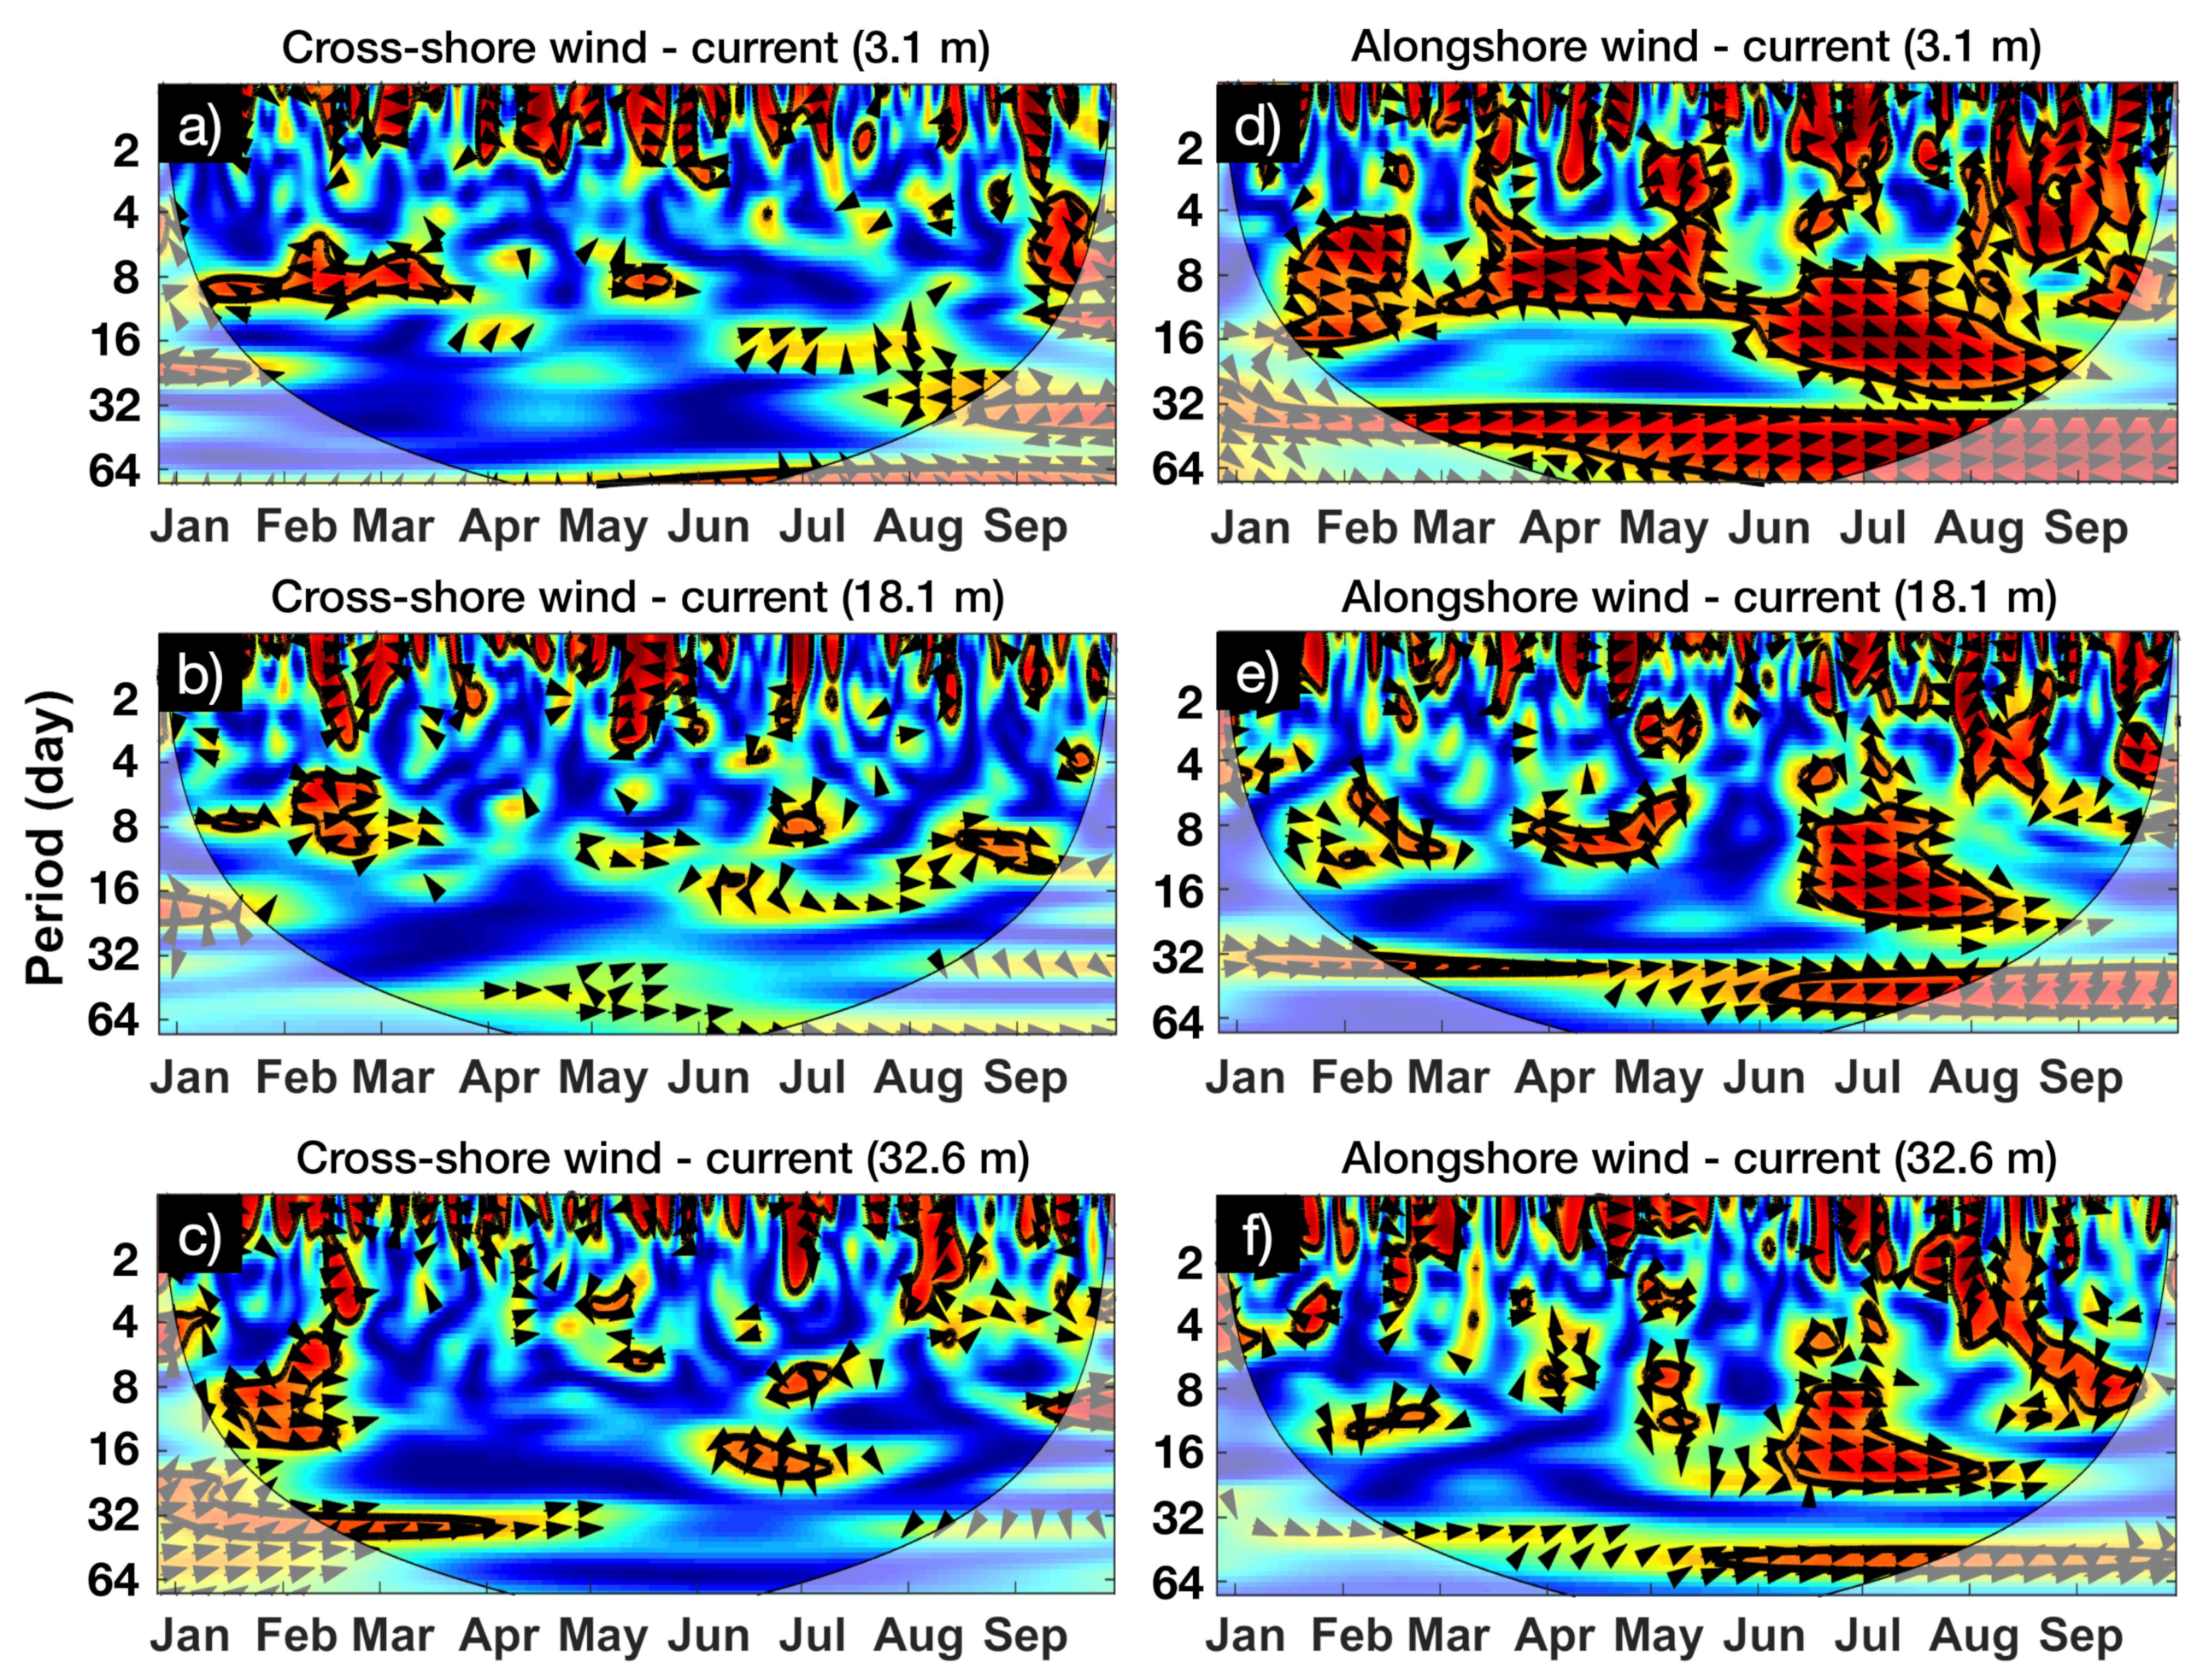
3.2. Coherence between Original Time Series of Wind at Hualpen Point, River Discharge and Currents

The coherence between wind and currents at three depths (3.1, 18.1 and 32.6 m) was studied using square wavelet coherence [23]. Significant coherence (>0.8) was observed on synoptic scales (2–16 days), particularly in the alongshore components and in the surface layer with periods between 5 and 30 days during the fall and winter (Figure 4d). Significant coherence was observed around 5.3 and 10.7 days in summer (between January and February 2009). By the end of the analyzed period, large coherence values were observed between 2.5 to 5.3 days, respectively. The coherence between the alongshore wind and the current at 18.1 and 32.1 m depth remained significant in winter (June and July) at around 10.7 days (Figure 4e,f). In summer this coherence was not significant. The cross-shore wind and current components also showed significant coherence, being out of phase at the surface in summer (from January to March) (Figure 4a). At deeper levels, the significant periods were shorter during summer and winter (Figure 4b,c).
High coherence between river discharge and alongshore currents were found for the synoptic band in winter (Figure 5). As the alongshore flow tends to be aligned in the alongshore direction throughout the water column (see Figure 2), specially during winter (primarily during May, June, July), the significant coherence extends through the water column (Figure 5, right panels). Cross-shore currents were significantly coherent with the river discharge near the surface (at 3.1 m) and also during winter months (Figure 5a).

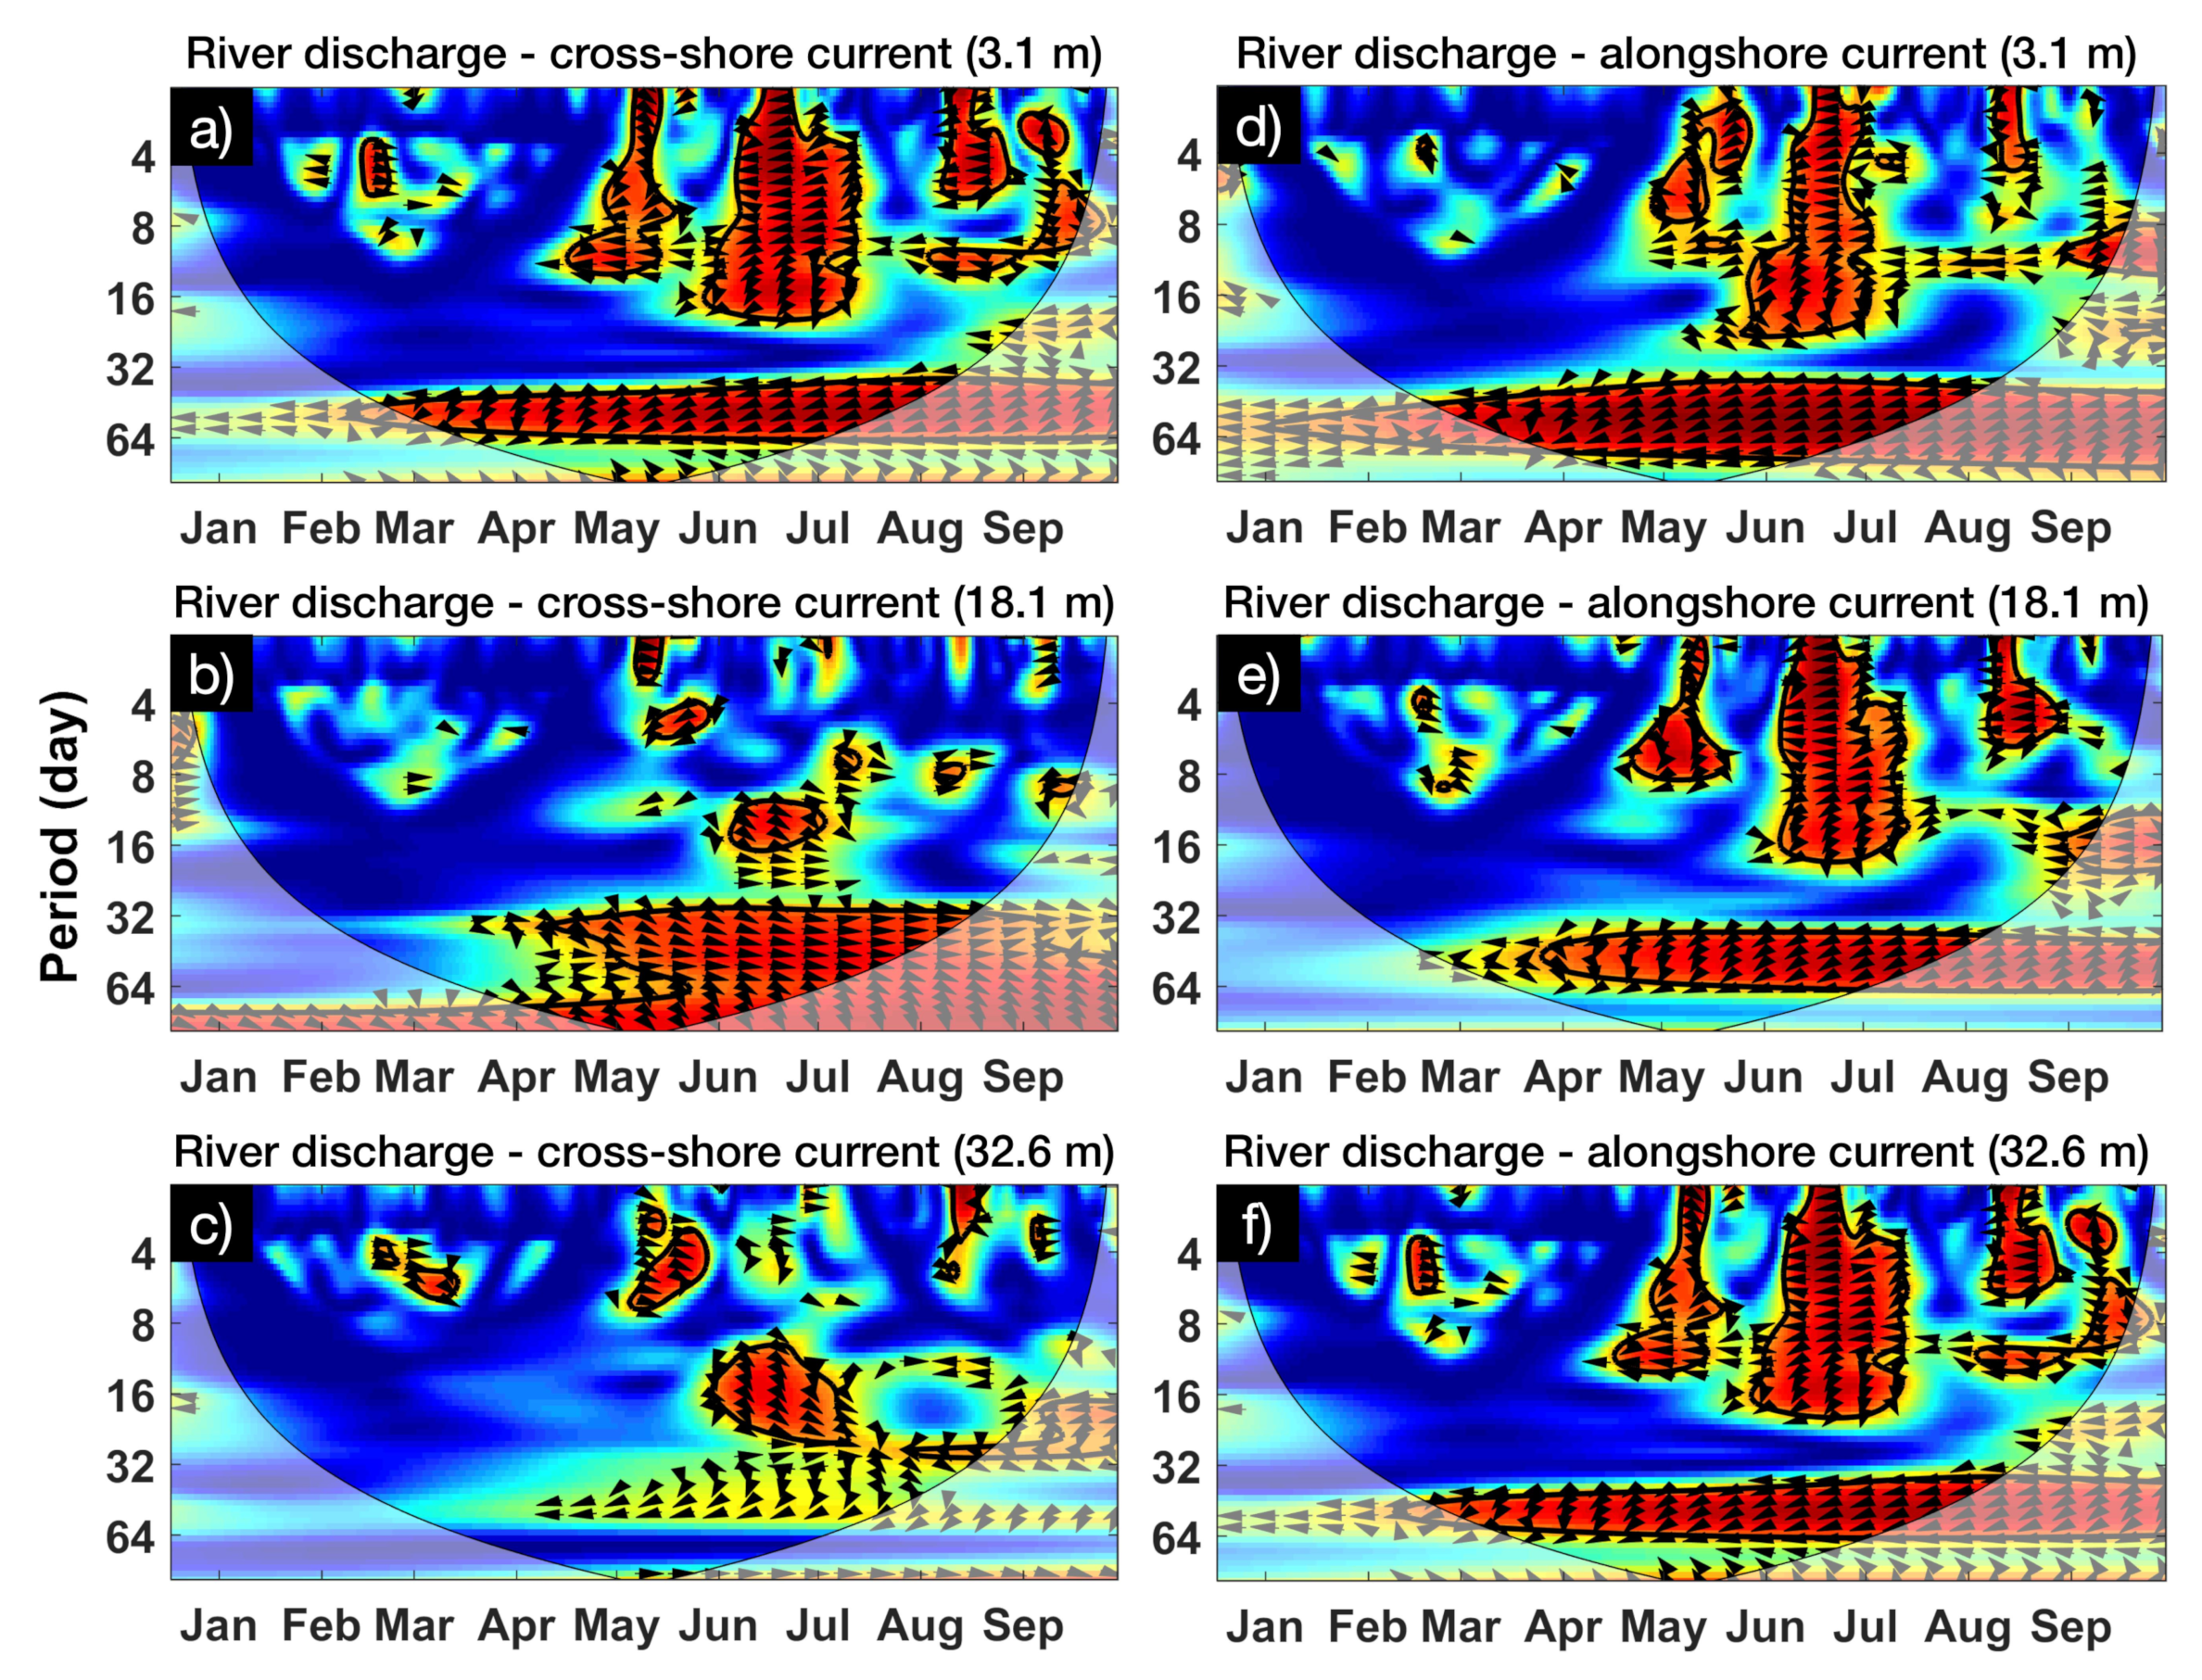
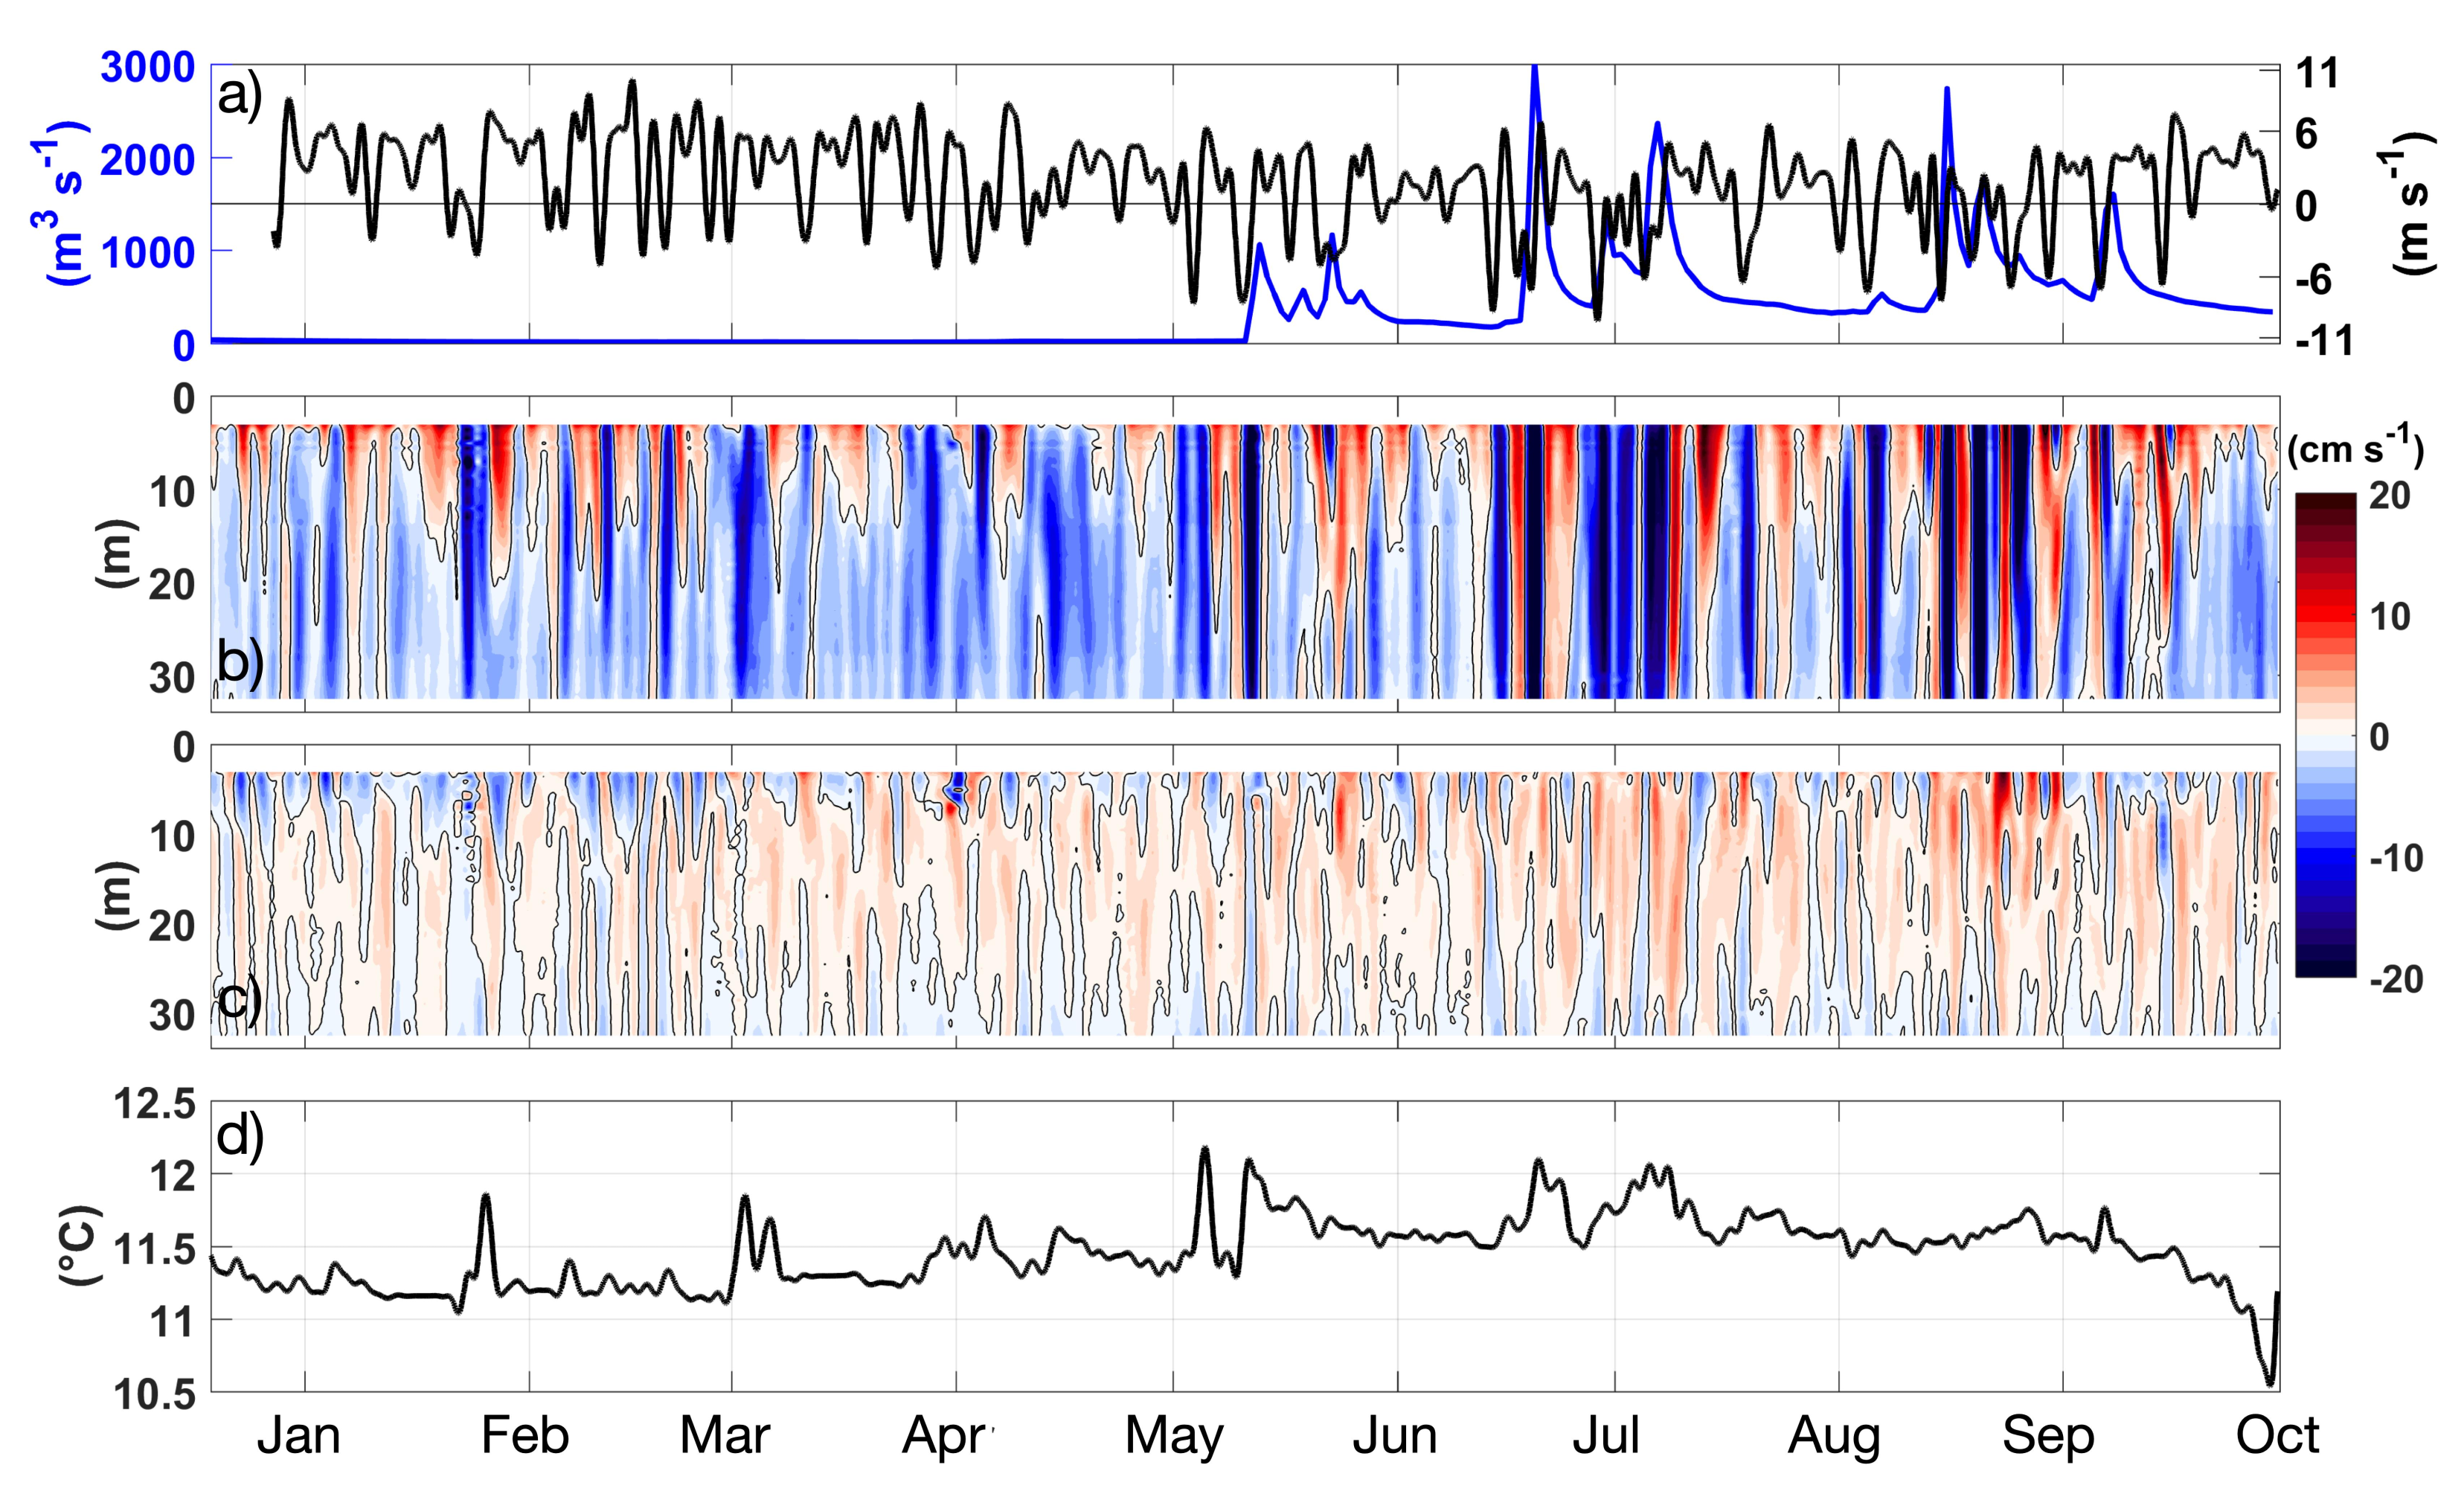
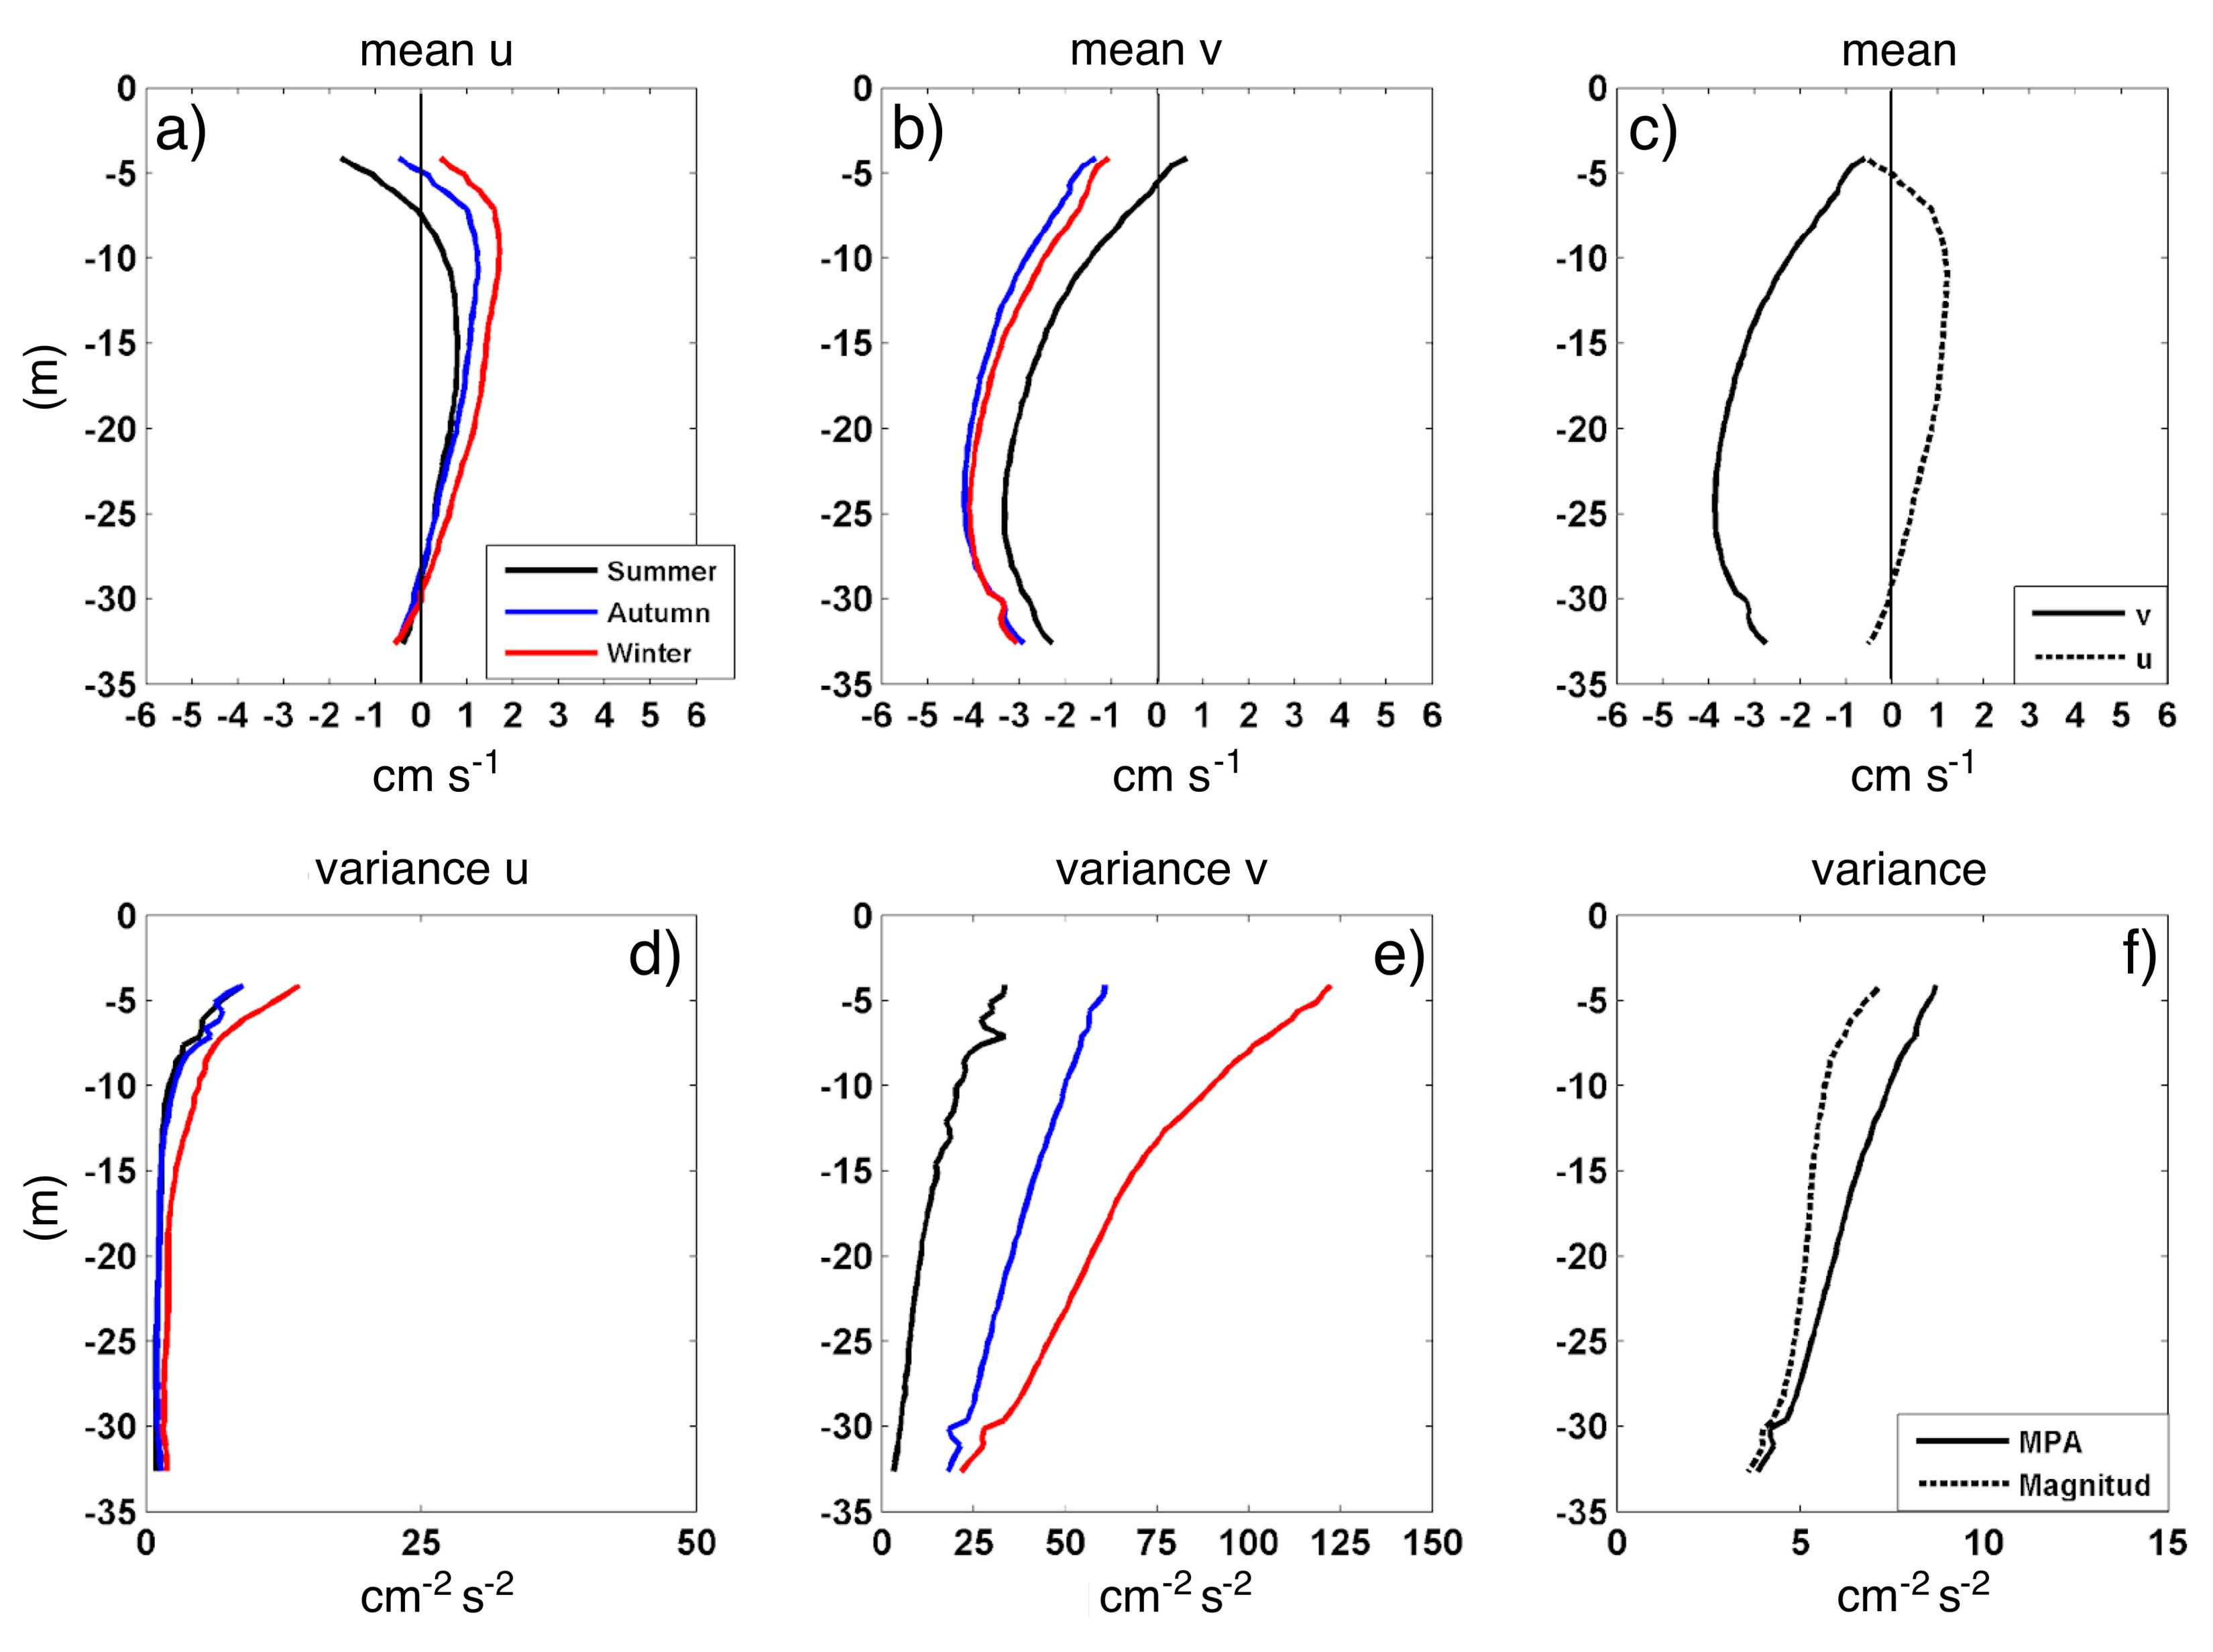
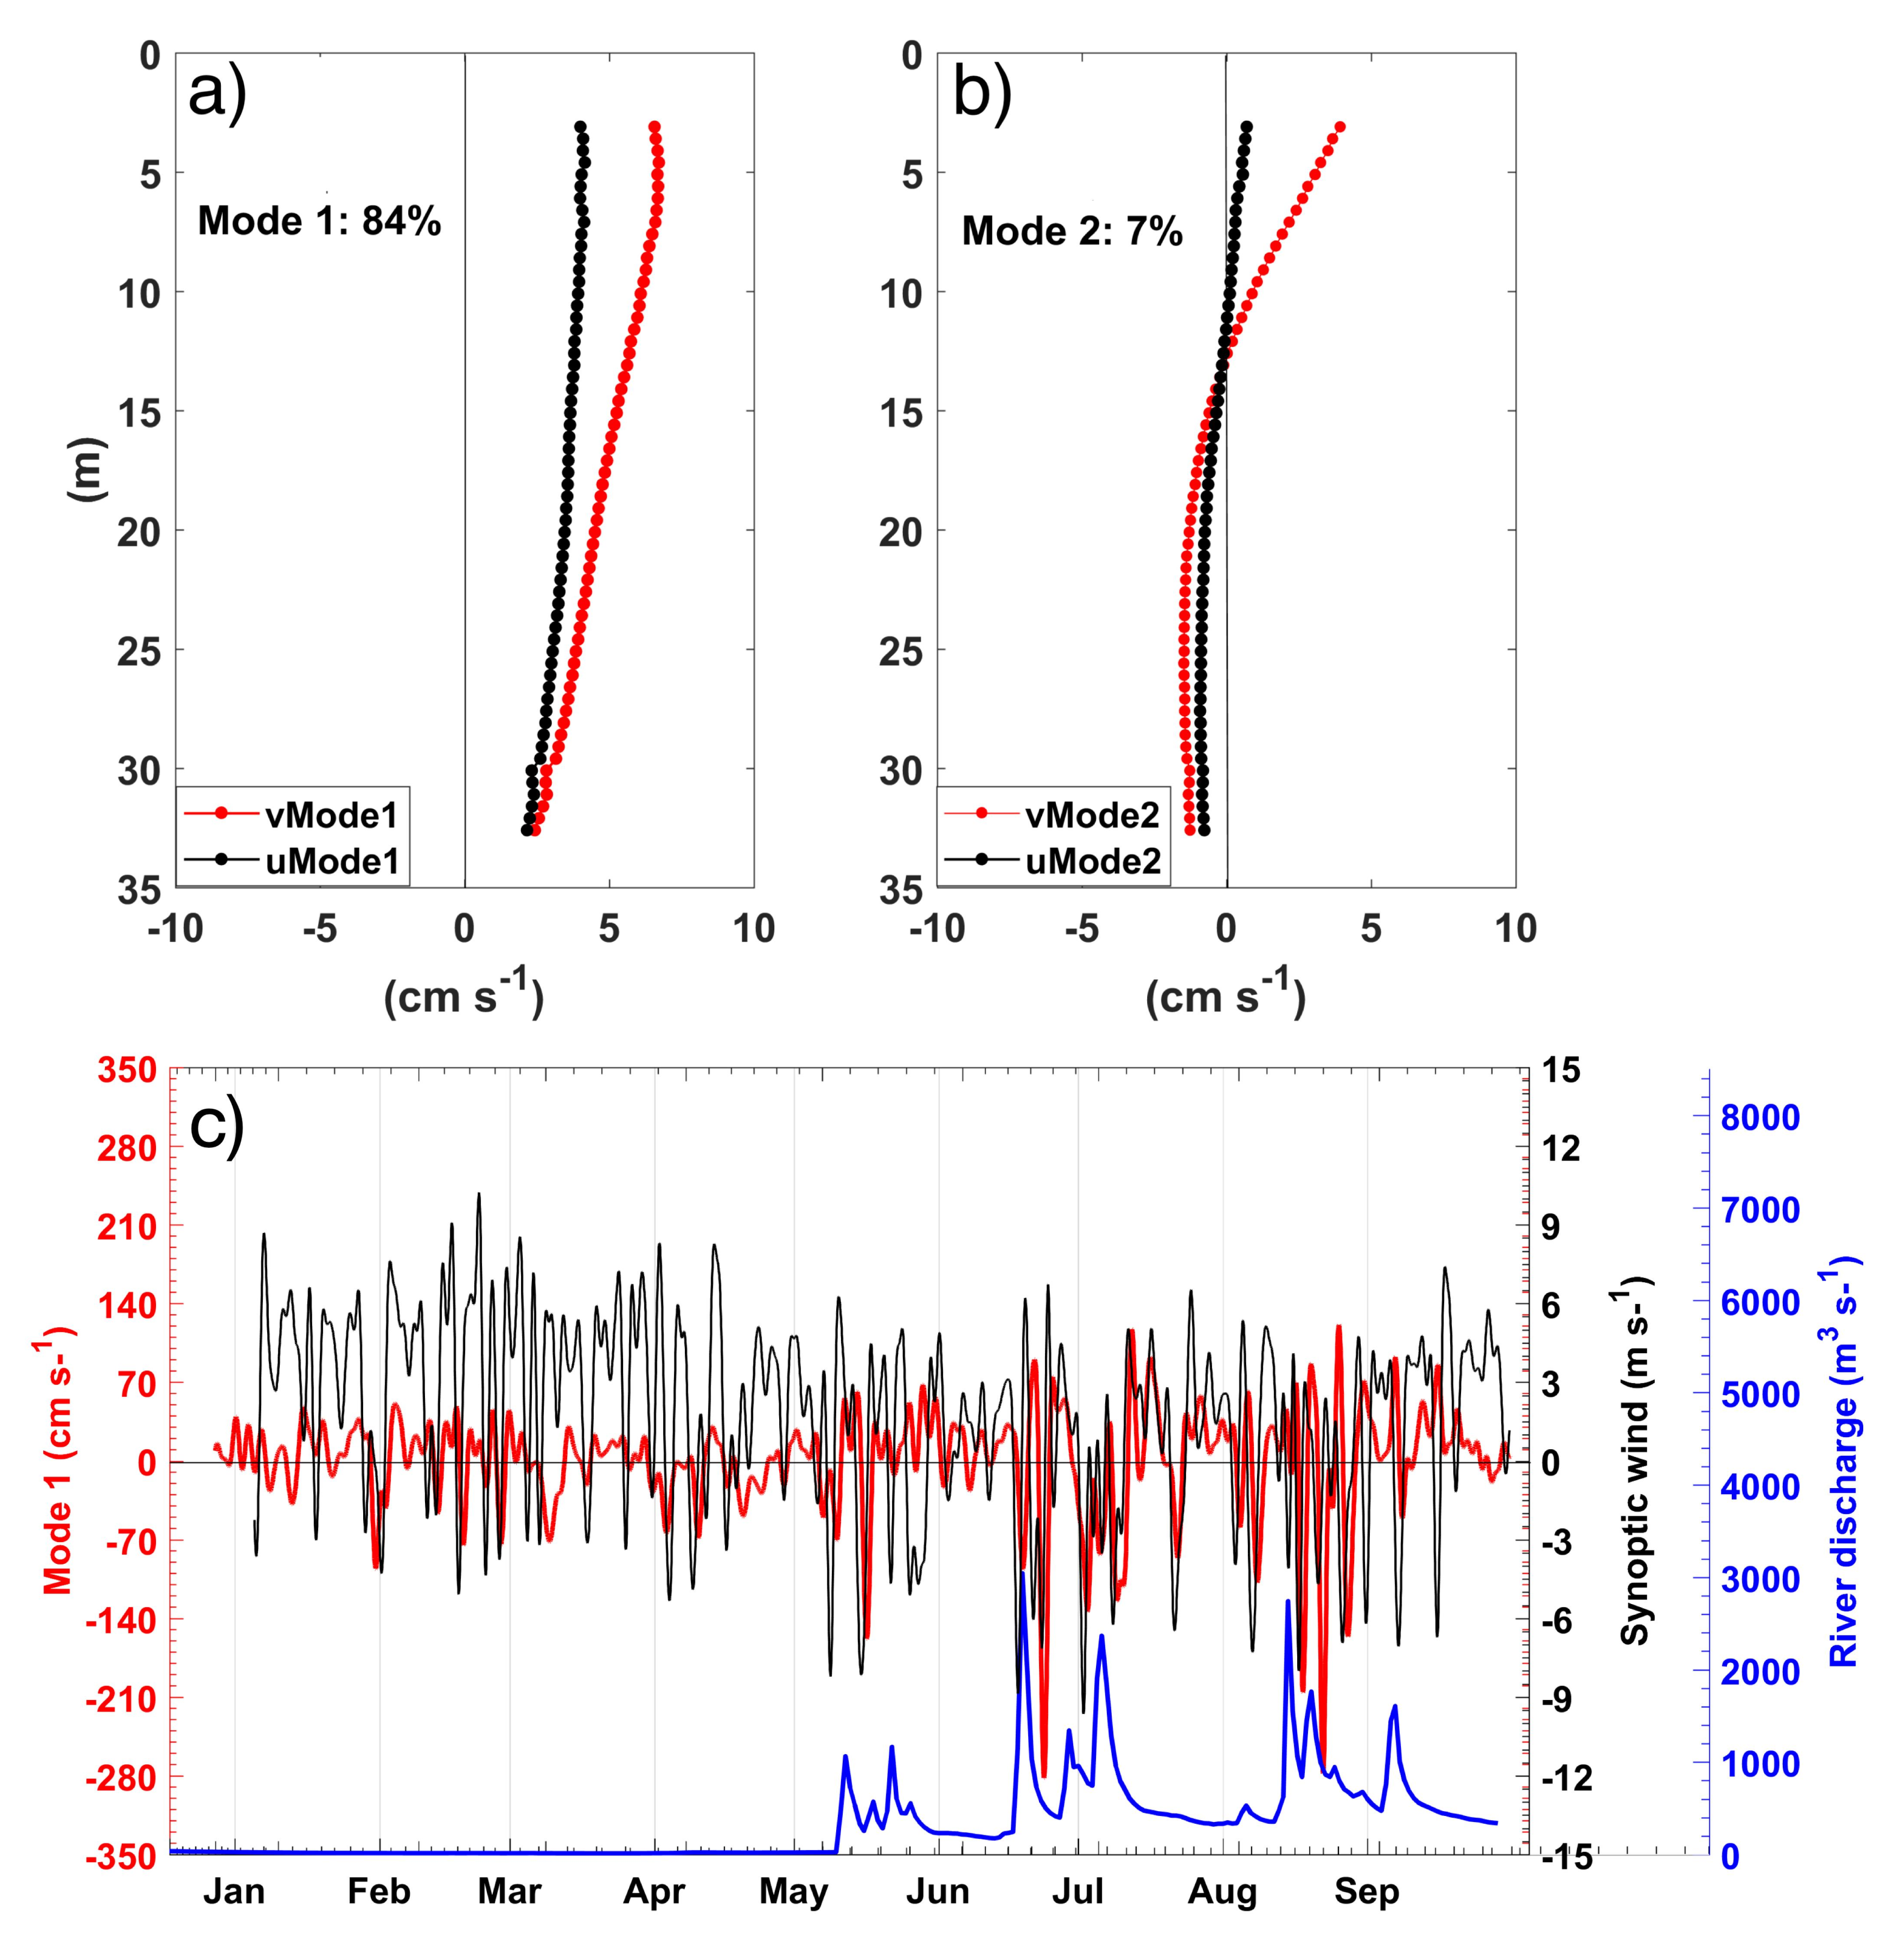
3.3. Seasonal Variability and Vertical Structure of the Synoptic Currents

Analysis of the alongshore synoptic currents and wind shows that northward winds force northward (southward) flows at the surface (bottom), whereas downwelling-favorable (southward winds) induced southward currents throughout the water column (Figure 6a,b). Several synoptic pulses of southward flow occurred through the entire water column, however, the inclusion of the river discharge helps to clarify that the stronger southward flow events responded to peaks in river outflow and downwelling-favorable winds during winter (Figure 6a,b). The cross-shore velocity component showed a near-surface offshore flow (specially during summer), mostly associated with the baroclinic alongshore currents (northward surface flow events), however, most of the water column presents an onshore flow field (Figure 6c). The highest bottom temperature values in the inner shelf were related with southward currents when upwelling-favorable winds relaxed or changed to downwelling conditions, especially during winter (May–August). In general, the lowest bottom temperature occurs in spring-summer with synoptic pulses of warmer waters responding to downwelling wind events (Figure 6d).
Considering the entire period of study, the mean vertical structure of the alongshore currents showed a single southward layer with increased velocities at mid water depths (Figure 7c). Cross-shore currents were characterized by offshore flow at the surface and bottom, whereas onshore flow dominated at mid depths (Figure 7a,b). The amplitude of the major principal axis (MPA) was greater than the amplitudes of the mean flow, especially at the surface layer, indicating the predominance of variance on average values (Figure 7f). A single southward layer was observed during fall and winter based on seasonal averages (Figure 7b). Nonetheless, a thin northward surface layer (about 5 m) was found in summer (Figure 7b). Major synoptic variability was observed in the alongshore currents during winter. This variability increased towards the surface (Figure 7e).
The first and second vertical empirical modes of the synoptic flow accounted for 84% and 7% of the total variance, respectively (Figure 8a,b). The vertical structure of the first vertical mode was barotropic with higher amplitudes (decreasing with depth) in the alongshore component (Figure 8a). The second vertical mode was baroclinic in both current components (Figure 8b), which is coherent with the vertical structure of the flow field during northward near-surface flow events (Figure 6b). The time series of the first vertical mode showed major amplitudes during wintertime, which was partially correlated with the alongshore synoptic wind (Figure 8c). The stronger barotropic events (of southward flow) occurred right after maximum river discharge events during winter (Figure 8c). Thus, most of the synoptic flow variability is confined in the southward barotropic current events during downwelling-favorable wind conditions, which in turn, present considerable seasonal variability by the influence of freshwater outflows in winter.

4. Discussion

The synoptic wind variability is a relatively constant feature of the coastal meteorology of central Chile [24]. This variability is superimposed on seasonal changes that follow the migration of the south Pacific anticyclone [25]. South of 35º S, the synoptic wind variability is increased during winter, when stronger southward winds are frequent due to the passage of extratropical atmospheric low-pressure disturbances, and also during summer due to the quasi-weekly occurrences of northward coastal low-level jet events alternating with periods of weak southward flows [15,26,27].
Without synoptic wind variability, the pure seasonal wind variability should cause permanent upwelling during summer and permanent downwelling during winter, due to the predominance of northward and southward winds, respectively. On the Itata shelf, many studies of currents and the flow variability have focused on the wind response to coastal upwelling, the sea-breeze, and internal tides [11,15,18,19]—little attention has received the role of the river outflows on the inner shelf dynamics. The monthly mean of seasonal wind speed is favorable for coastal upwelling during spring-summer (Figure 3b). On the other hand, the monthly mean of the seasonal winds are favorable to downwelling conditions solely during winter (June and July), with the months of May and August very close to zero (transition months). On average, the synoptic winds are favorable to coastal upwelling throughout the year but with major values from October to March (Figure 3c). High variability sets the conditions for synoptic southward wind events, which are higher in intensity during winter. Thus, the strong southward flow events in winter (Figure 6b) would result from the coupling between synoptic southward wind events and pulses of high river discharge, which are common during the development of large river plumes during winter storms [17].
The alongshore (cross-shore) current velocities ranged approximately between −30 cm s 1 to 20 cm s 1 (−5 cm s 1 to 5 cm s 1 ). The alongshore flow was significantly larger than the cross-shore currents, which is consistent with other studies showing that the cross-shelf flows driven by along-shelf winds are substantially reduced over the inner shelf, and that the cross-shelf circulation decreases from the mid-shelf to the coast [7,28,29]. Based of the dynamics of the inner shelf, the transfer of momentum from the wind provides mixing of the water column, which is faster than the effect of the Coriolis acceleration. Thus, the along-shelf wind stress is ineffective in driving cross-shelf transport [14,28].
A key feature of the inner shelf off central-southern Chile is the presence of buoyant outflows from river discharges (e.g., Figure 1b). In order to assess the relative degree of influence of the synoptic winds on the dynamics of the buoyant coastal current as it flows along the coast, we use the wind strength index ( W s ) proposed by Whitney and Garvine [30]. This index was developed to determine whether the along-shelf flow in the river plume is in a wind-driven or buoyancy-driven state by comparing velocity scales for the alongshore flow driven by each of these forcings [30]. The downshelf buoyancy-driven velocity ( u d i s ) is scaled based on a two-layer system that is in thermal wind balance, with a volume flux in the upper buoyant layer that is set to be equal to the geostrophic transport [30]. Following this approach, u d i s can be expressed as [30,31]:
u d i s = 1 K 2 g r Q f 1 / 4
where g is the reduced gravity of the river water ( g = g Δ ρ r / ρ a , where Δ ρ r = ρ o c e a n ρ r i v e r ), Q is river discharge, f is the Coriolis parameter (planetary vorticity) and K is the Kelvin number [32]. On the other hand, the wind-driven along-shelf velocity scale ( u w i n d ) is obtained based on a barotropic wind response, considering a steady state depth-averaged along-shelf momentum balance where the along-shelf wind stress is balanced by the bottom stress ( τ w y = τ b y ) [30,33]. Using quadratic drag laws to represent both the wind and bottom stresses, the frictionally adjusted u w i n d estimate is [30]:
u w i n d = ρ a i r ρ C 10 C D a U
where C 10 is the surface drag coefficient associated to the wind stress, C D a is the bottom drag coefficient for shallow water [34], and U is the along-shelf component of wind velocity. Whitney and Garvine [30] used ρ a = 1.2 kg m 3 , C 10 = 1.2 × 10 3 and C D a = 2.0 × 10 3 , by which Equation (2) becomes:
u w i n d 2.65 × 10 2 U
The reader is referred to Whitney and Garvine [30] for further details on the scaling of u d i s and u w i n d . In what follows, we use Equations (1) and (3) to determine the velocity scaling. The wind strength index ( W s ) is consequently defined as [30]
W s = u w i n d u d i s
W s is used to compare the importance of wind influence relative to river discharge in setting the along-shelf flow within the coastal current; river discharge forcing dominates when | W s | < 1 , and the coastal current is expected to flow downshelf controlled by buoyancy effects [30]. Since downshelf flow is taken as positive, W s is positive for downwelling-favorable winds as these intensify downshelf flow in the river plume. Consequently, W s is negative for upwelling-favorable winds as these act to counter and arrest the downshelf flow in the plume. Wind forcing should dominate when | W s | > 1 .
Figure 9 shows time series of u d i s , u w i n d , and W s for our study period. Calculations of u d i s were made using daily discharge data from the Itata River (Figure 6a), f = 0.86 × 10 4 s 1 (latitude of 36.38 S), and g r = 0.24 m s 2 , which considers salinities of 0 psu for river water and 32 psu for ocean waters. The Kelvin number in the Itata plume ranges from about 0.3 to 2.9 [17]. Here, we used K = 1.5 as an intermediate value. Calculations of u w i n d are made using Equation (3) and the along-shelf component of the synoptic wind time series (Figure 6a). Inspection of Figure 9 reveals that the inner shelf is in a wind-driven state ( | W s | > 1 , and mostly upwelling-favorable) primarily during the summer months, as river discharge is minimum, and in a buoyancy-driven state ( | W s | < 1 ) during the fall-winter period (May–August), as river discharge increases considerably due to seasonal precipitation (Figure 3 and Figure 6a). Overall, we see predominance of upwelling-favorable conditions during the study period ( W s < 0 , Figure 9b). However, during summer and early fall the predominant upwelling-favorable conditions are frequently interrupted by strong pulses of downwelling-favorable u w i n d that lead to W s 1 or W s > 1 (Figure 9a,b). These pulses are well timed with the occurrence of southward flow over the entire water column (Figure 6b and Figure 9b). When the plume is in a wind-driven state as a result of upwelling-favorable winds, the water column typically shows a two layer structure, with northward flow at the surface and southward flow towards the bottom (Figure 6b and Figure 9b). Although buoyancy-driven conditions prevail during the winter, as suggested by W s (Figure 9b), northward flow at the top of the water column is frequently observed at times of upwelling-favorable u w i n d , and sometimes extending to the bottom (Figure 6b and Figure 9b). This could be the result of the cyclostrophic circulation developed in the bulge region of the plume near the river mouth [35]. When a bulge is formed, part of the freshwater flows upstream, it rotates and then flows in the downstream direction [35]. A bulge is clearly formed when high river discharge events occur in the Itata River (see Figure 1b).
In general, the response of the alongshore shelf circulation to the wind forcing in the synoptic and seasonal scale has been poorly studied along the Chilean coast. In this study, synoptic currents presented a clear alignment with the bathymetry and a direct response to the synoptic wind and river discharge. Considering the strong alongshore winds and several river discharges along the coast of central-southern Chile [1], it is expected that these results should be consistent with the circulation in other river-influenced inner shelves. Future studies should evaluate the relative impact of the progressive decrease in river discharges (less buoyancy forcing) [36], and the implications of sporadic atmospheric rivers providing large amounts of freshwater [37], on the inner shelf circulation along central-southern Chile. An example of the cross-shore hydrographic structure of the inner and mid-shelf off Itata River is presented in Figure 10 during low river discharge conditions in winter. Note that the wintertime events of high river discharge of 2009 peaked, in general, over 1000 m 3 s 1 (Figure 6a), whereas the reduced freshwater outflows in recent years have produced that most peaks in river outflows reached only few hundred m 3 s 1 , which in occasions overlap with upwelling-favorable winds (Figure 10a). As a result, a thin river plume (only ∼1 m thick) develops (Figure 10b,e)—the reader is referred to the study of Saldías et al. [17] to compare with CTD sections during high river discharge conditions. The increment of upwelling winds under a dominance of La Niña conditions off central-southern Chile [38] would provide more upwelling winds and the advection of cold subsurface waters over the shelf (Figure 10c,f), with increased chlorophyll concentrations even during winter months (Figure 10d,g). Future studies might clarify the periodicity and potential new pattern of winter upwelling events off central-southern Chile.

5. Conclusions

This study evaluates the influence of wind and river discharge forcing on the synoptic flow variability during a 9-month mooring deployment (December 2008 to September 2009) off central Chile. The coastal circulation over the inner-shelf off central Chile was dominated by the along-shelf flow, whereas the cross-shelf circulation was substantially reduced in response to the dominant alongshore synoptic wind variability. An EOF analysis revealed that the alongshore synoptic currents showed two distinct modes of variability. With upwelling-favorable winds (strong and moderate wind), a two-layer circulation dominated with a northward surface flow and a southward bottom current. These events were characterized by cold bottom waters. During moderate-to-strong downwelling-favorable wind stress conditions (or during upwelling relaxations events) the alongshore flow was southward through the entire water column, and warmer bottom waters were recorded. The influence of the wind was dominant in summer, whereas the effect of buoyancy forcing, through the Itata River outflow, became dominant in winter when peaks in river discharge coincided with strong southward flow events. The calculation of the wind index suggests that the buoyancy forcing was the dominant forcing driving the circulation of the inner shelf in winter 2009. However, the combined effect of both southward wind stress and river discharges modulated the stronger southward flow events of the entire study period.

Author Contributions

Conceptualization, C.S.-R., M.S.; methodology, C.S.-R.; formal analysis, C.S.-R., R.P.F., G.S.S.; investigation, M.S., C.S.-R., R.P.F., G.S.S.; resources, M.S. and G.S.S.; data curation, C.S.-R., R.P.F., G.S.S.; writing—original draft preparation, M.S., C.S.-R., R.P.F., G.S.S. All authors have read and agreed to the published version of the manuscript.

Funding

This research was funded by FONDECYT grant number 1070501 and 1190805. Support for data collection as well as for MS was provided by Programa de Investigación Marina de Excelencia (PIMEX-Nueva Aldea) of the Faculty of Natural and Oceanographic Sciences of the University of Concepción, which is funded by Celulosa Arauco y Constitución S.A. MS and GSS are partially funded by COPAS COASTAL ANID FB210021 and FONDECYT grant number 1190805. GSS is also partially supported by ANID Millennium Science Initiative Program—Code ICN2019_015. MS is also partially supported by INCAR (FONDAP-ANID No. 15110027). RF is partially supported by FONDECYT grant number 11190378 and FONDAP grant number 15110017.

Institutional Review Board Statement

Not applicable.

Informed Consent Statement

Not applicable.

Data Availability Statement

The data that support the findings of this study are available from the corresponding author upon reasonable request.

Acknowledgments

We thank three anonymous reviewers for their constructive comments that improved considerably this manuscript.

Conflicts of Interest

The authors declare no conflict of interest.

References

  1. Saldías, G.S.; Largier, J.L.; Mendes, R.; Pérez-Santos, I.; Vargas, C.A.; Sobarzo, M. Satellite-measured interannual variability of turbid river plumes off central-southern Chile: Spatial patterns and the influence of climate variability. Prog. Oceanogr. 2016, 146, 212–222. [Google Scholar] [CrossRef]
  2. Salcedo-Castro, J.; Saldías, G.S.; Saavedra, F.; Donoso, D. Climatology of Maipo and Rapel river plumes off Central Chile from numerical simulations. Reg. Stud. Mar. Sci. 2020, 38, 101389. [Google Scholar] [CrossRef]
  3. Sobarzo, M.; Bravo, L.; Donoso, D.; Garcés-Vargas, J.; Schneider, W. Coastal upwelling and seasonal cycles that influence the water column over the continental shelf off central Chile. Prog. Oceanogr. 2007, 75, 363–382. [Google Scholar] [CrossRef]
  4. Testa, G.; Masotti, I.; Farias, L. Temporal variability in net primary production in an upwelling area off central Chile (36ºS). Front. Mar. Sci. 2018, 5, 179. [Google Scholar] [CrossRef]
  5. Garvine, R.W. The vertical structure and subtidal dynamics of the inner shelf off New Jersey. J. Mar. Res. 2004, 62, 337–371. [Google Scholar] [CrossRef]
  6. Lentz, S.J. Sensitivity of the inner-shelf circulation to the form of the eddy viscosity profile. J. Phys. Oceanogr. 1995, 25, 19–28. [Google Scholar] [CrossRef] [Green Version]
  7. Lentz, S.J.; Fewings, M.R. The wind-and wave-driven inner-shelf circulation. Annu. Rev. Mar. Sci. 2012, 4, 317–343. [Google Scholar] [CrossRef] [Green Version]
  8. Cudaback, C.N.; Washburn, L.; Dever, E. Subtidal inner-shelf circulation near Point Conception, California. J. Geophys. Rese. Oceans 2005, 110, C10007. [Google Scholar] [CrossRef] [Green Version]
  9. Lentz, S.J.; Trowbridge, J.H. The bottom boundary layer over the northern California shelf. J. Phys. Oceanogr. 1991, 21, 1186–1201. [Google Scholar] [CrossRef] [Green Version]
  10. Lentz, S.J. The surface boundary layer in coastal upwelling regions. J. Phys. Oceanogr. 1992, 22, 1517–1539. [Google Scholar] [CrossRef] [Green Version]
  11. Sobarzo, M.; Djurfeldt, L. Coastal upwelling process on a continental shelf limited by submarine canyons, Concepción, central Chile. J. Geophys. Res. Oceans 2004, 109, C12012. [Google Scholar] [CrossRef]
  12. Ekman, V.W. On the Influence of the Earth’s Rotation on Ocean-Currents. Ark. Mat. Astron. Fys 1905, 2, 1–52. [Google Scholar]
  13. Austin, J.A.; Barth, J.A. Variation in the position of the upwelling front on the Oregon shelf. J. Geophys. Res. Oceans 2002, 107, 3180. [Google Scholar] [CrossRef]
  14. Austin, J.A.; Lentz, S.J. The inner shelf response to wind-driven upwelling and downwelling. J. Phys.Oceanogr. 2002, 32, 2171–2193. [Google Scholar] [CrossRef]
  15. Sobarzo, M.; Bravo, L.; Moffat, C. Diurnal-period, wind-forced ocean variability on the inner shelf off Concepción, Chile. Cont. Shelf Res. 2010, 30, 2043–2056. [Google Scholar] [CrossRef]
  16. Sobarzo, M.; Shearman, R.K.; Lentz, S. Near-inertial motions over the continental shelf off Concepción, central Chile. Prog. Oceanogr. 2007, 75, 348–362. [Google Scholar] [CrossRef]
  17. Saldías, G.S.; Sobarzo, M.; Largier, J.; Moffat, C.; Letelier, R. Seasonal variability of turbid river plumes off central Chile based on high-resolution MODIS imagery. Remote Sens. Environ. 2012, 123, 220–233. [Google Scholar] [CrossRef]
  18. Aguirre, C.; Pizarro, O.; Sobarzo, M. Observations of semidiurnal internal tidal currents off central Chile (36.6° S). Cont. Shelf Res. 2010, 30, 1562–1574. [Google Scholar] [CrossRef]
  19. Bravo, L.; Ramos, M.; Sobarzo, M.; Pizarro, O.; Valle-Levinson, A. Barotropic and baroclinic semidiurnal tidal currents in two contrasting coastal upwelling zones of Chile. J. Geophys. Res. Oceans 2013, 118, 1226–1238. [Google Scholar] [CrossRef]
  20. Sobarzo, M.; Saldías, G.S.; Tapia, F.J.; Bravo, L.; Moffat, C.; Largier, J.L. On subsurface cooling associated with the Biobio River Canyon (Chile). J. Geophys. Res. Oceans 2016, 121, 4568–4584. [Google Scholar] [CrossRef]
  21. Pawlowicz, R.; Beardsley, B.; Lentz, S. Classical tidal harmonic analysis including error estimates in MATLAB using T_TIDE. Comput. Geosci. 2002, 28, 929–937. [Google Scholar] [CrossRef]
  22. Emery, W.J.; Thomson, R.E. Data Analysis Methods in Physical Oceanography, 2nd ed.; Elsevier: Amsterdam, The Netherlands, 2004. [Google Scholar]
  23. Grinsted, A.; Moore, J.C.; Jevrejeva, S. Application of the cross wavelet transform and wavelet coherence to geophysical time series. Nonlinear Processes Geophys. 2004, 11, 561–566. [Google Scholar] [CrossRef]
  24. Renault, L.; Dewitte, B.; Falvey, M.; Garreaud, R.; Echevin, V.; Bonjean, F. Impact of atmospheric coastal jet off central Chile on sea surface temperature from satellite observations (2000–2007). J. Geophys. Res. Oceans 2009, 114. [Google Scholar] [CrossRef] [Green Version]
  25. Saavedra, N.; Foppiano, A. Monthly mean pressure model for Chile. Int. J. Climatol. 1992, 12, 469–480. [Google Scholar] [CrossRef]
  26. Muñoz, R.C.; Garreaud, R. Dynamics of the low-level jet off the west coast of subtropical South America. Mon. Weather Rev. 2005, 133, 3661–3677. [Google Scholar] [CrossRef]
  27. Garreaud, R.; Rutllant, J.; Fuenzalida, H. Coastal lows along the subtropical west coast of South America: Mean structure and evolution. Mon. Weather Rev. 2002, 130, 75–88. [Google Scholar] [CrossRef] [Green Version]
  28. Horwitz, R.; Lentz, S.J. Inner-shelf response to cross-shelf wind stress: The importance of the cross-shelf density gradient in an idealized numerical model and field observations. J. Phys. Oceanogr. 2014, 44, 86–103. [Google Scholar] [CrossRef] [Green Version]
  29. Kirincich, A.R.; Barth, J.A.; Grantham, B.A.; Menge, B.A.; Lubchenco, J. Wind-driven inner-shelf circulation off central Oregon during summer. J. Geophys. Res. Oceans 2005, 110, C10S03. [Google Scholar] [CrossRef]
  30. Whitney, M.M.; Garvine, R.W. Wind influence on a coastal buoyant outflow. J. Geophys. Res. Oceans 2005, 110, C03014. [Google Scholar] [CrossRef]
  31. Yankovsky, A.E.; Chapman, D.C. A simple theory for the fate of buoyant coastal discharges. J. Phys. Oceanogr. 1997, 27, 1386–1401. [Google Scholar] [CrossRef] [Green Version]
  32. Garvine, R.W. A dynamical system for classifying buoyant coastal discharges. Cont. Shelf Res. 1995, 15, 1585–1596. [Google Scholar] [CrossRef]
  33. Csanady, G. The arrested topographic wave. J. Phys. Oceanogr. 1978, 8, 47–62. [Google Scholar] [CrossRef] [Green Version]
  34. Csanady, G.T. Circulation in the coastal ocean. Adv. Geophys. 1981, 23, 101–183. [Google Scholar]
  35. Horner-Devine, A.R. The bulge circulation in the Columbia River plume. Cont. Shelf Res. 2009, 29, 234–251. [Google Scholar] [CrossRef]
  36. Garreaud, R.D.; Boisier, J.P.; Rondanelli, R.; Montecinos, A.; Sepúlveda, H.H.; Veloso-Aguila, D. The central Chile mega drought (2010–2018): A climate dynamics perspective. Int. J. Climatol. 2020, 40, 421–439. [Google Scholar] [CrossRef]
  37. Viale, M.; Valenzuela, R.; Garreaud, R.D.; Ralph, F.M. Impacts of atmospheric rivers on precipitation in southern South America. J. Hydrometeorol. 2018, 19, 1671–1687. [Google Scholar] [CrossRef]
  38. Schneider, W.; Donoso, D.; Garcés-Vargas, J.; Escribano, R. Water-column cooling and sea surface salinity increase in the upwelling region off central-south Chile driven by a poleward displacement of the South Pacific High. Prog. Oceanogr. 2017, 151, 38–48. [Google Scholar] [CrossRef]
Figure 1. (a) Study area off central Chile showing the bathymetry/height in colors. The locations of the ADCP and wind stations in Hualpen Point (HP) and Carriel Sur (CS) are shown in a red circle and red triangles, respectively. A MODIS true color image (on 20 June 2009) of the enclosed area (black box) is presented in (b).
Jmse 10 00501 g001
Figure 2. Scatterplots of synoptic currents (hodographs) from 4.1 m to 32.1 m depth (ai) in the vicinity of the Itata River mouth. Isobaths are shown every 5 m.
Jmse 10 00501 g002
Figure 3. Monthly climatological averages (1999–2009) of (a) Alongshore total wind, (b) Alongshore seasonal wind (Period > 16 days), (c) Alongshore synoptic wind (Periods between 2–16 days), (d) Cube of total wind speed magnitude, (e) Cube of seasonal wind-speed magnitude, (f) Cube of synoptic wind speed magnitude. The monthly discharge of the Itata River is plotted in all panels (blue line). Historic wind data was obtained from the Carriel Sur station (see Figure 1 for its location). The cube of the wind speed represents the mechanical wind energy available to generate mixing.
Jmse 10 00501 g003
Figure 4. Coherence between time series of alongshore and cross-shore winds at Hualpen Point and currents (January–September 2009) at three depth levels (3.1 m, 18.1 m and 32.6 m). (ac) Cross-shore and (df) alongshore wind and current components, respectively. Statistically significant (95% confidence level) values are shown in red and are highlighted with black lines. Blue colors indicate areas of low spectral coherence. Shaded areas denote the cone of influence of the wavelet computations. In all panels, black arrows indicate the phase between the wind and current time series. The time series are in phase when the arrows point to the right (90°), and out phase when pointing to the left (270°).
Jmse 10 00501 g004
Figure 5. Coherence between time series of river discharge and currents (January–September 2009) at three depth levels (3.1 m, 18.1 m and 32.6 m). (ac) Cross-shore and (df) alongshore current components. Statistically significant (95% confidence level) values are shown in red and are highlighted with black lines. Blue colors indicate areas of low spectral coherence. Shaded areas denote the cone of influence of the wavelet computations. In all panels, black arrows indicate the phase between the wind and current time series. The time series are in phase when the arrows point to the right (90°), and out phase when pointing to the left (270°).
Jmse 10 00501 g005
Figure 6. Synoptic time series of (a) alongshore wind at Hualpen Point (black line) and Itata River discharge (blue line), (b) alongshore flow, (c) cross-shore flow, and (d) bottom temperature off the Itata River mouth. Currents and bottom temperature are obtained from the mooring in the vicinity of the river mouth (see Figure 1).
Jmse 10 00501 g006
Figure 7. Vertical structure of (ac) mean synoptic currents and (de) their variance, and (f) the amplitudes of the major principal axis (MPA) and the mean flow.
Jmse 10 00501 g007
Figure 8. Vertical structure of (a) first and (b) second EOF. (c) Time series of the first vertical mode (red line), synoptic alongshore wind (black line), and the river discharge (blue line).
Jmse 10 00501 g008
Figure 9. Wind index. (a) Time series of u d i s (blue line) and u w i n d (black line). (b) Time series of Wind index, W s . Blue and red areas denote upwelling- and downwelling-favorable u w i n d values, respectively.
Jmse 10 00501 g009
Figure 10. Cross-shore hydrographic section from a towed RapidPro CTD on 23 July 2021 off the Itata River mouth. High-resolution data (no interpolation) for (b,e) salinity, (c,f) temperature, and (d,g) chlorophyll are shown for the entire section (left panels), whereas the shallower inner shelf area (enclosed black box) is presented after applying objective interpolation (right panels) for better visualization. The history of meridional wind stress and river discharge during July 2021 is also presented in (a) where the shaded area indicates the day of hydrographic measurements. Note that upwelling-favorable winds characterized the week previous to the hydrographic measurements.
Jmse 10 00501 g010
Publisher’s Note: MDPI stays neutral with regard to jurisdictional claims in published maps and institutional affiliations.

