
Understanding Effects of Permafrost Degradation and Coastal Erosion on Civil Infrastructure in Arctic Coastal Villages: A Community Survey and Knowledge Co-Production

 ,
,  , ,
, ,  , ,
, , 
Abstract
:1. Introduction
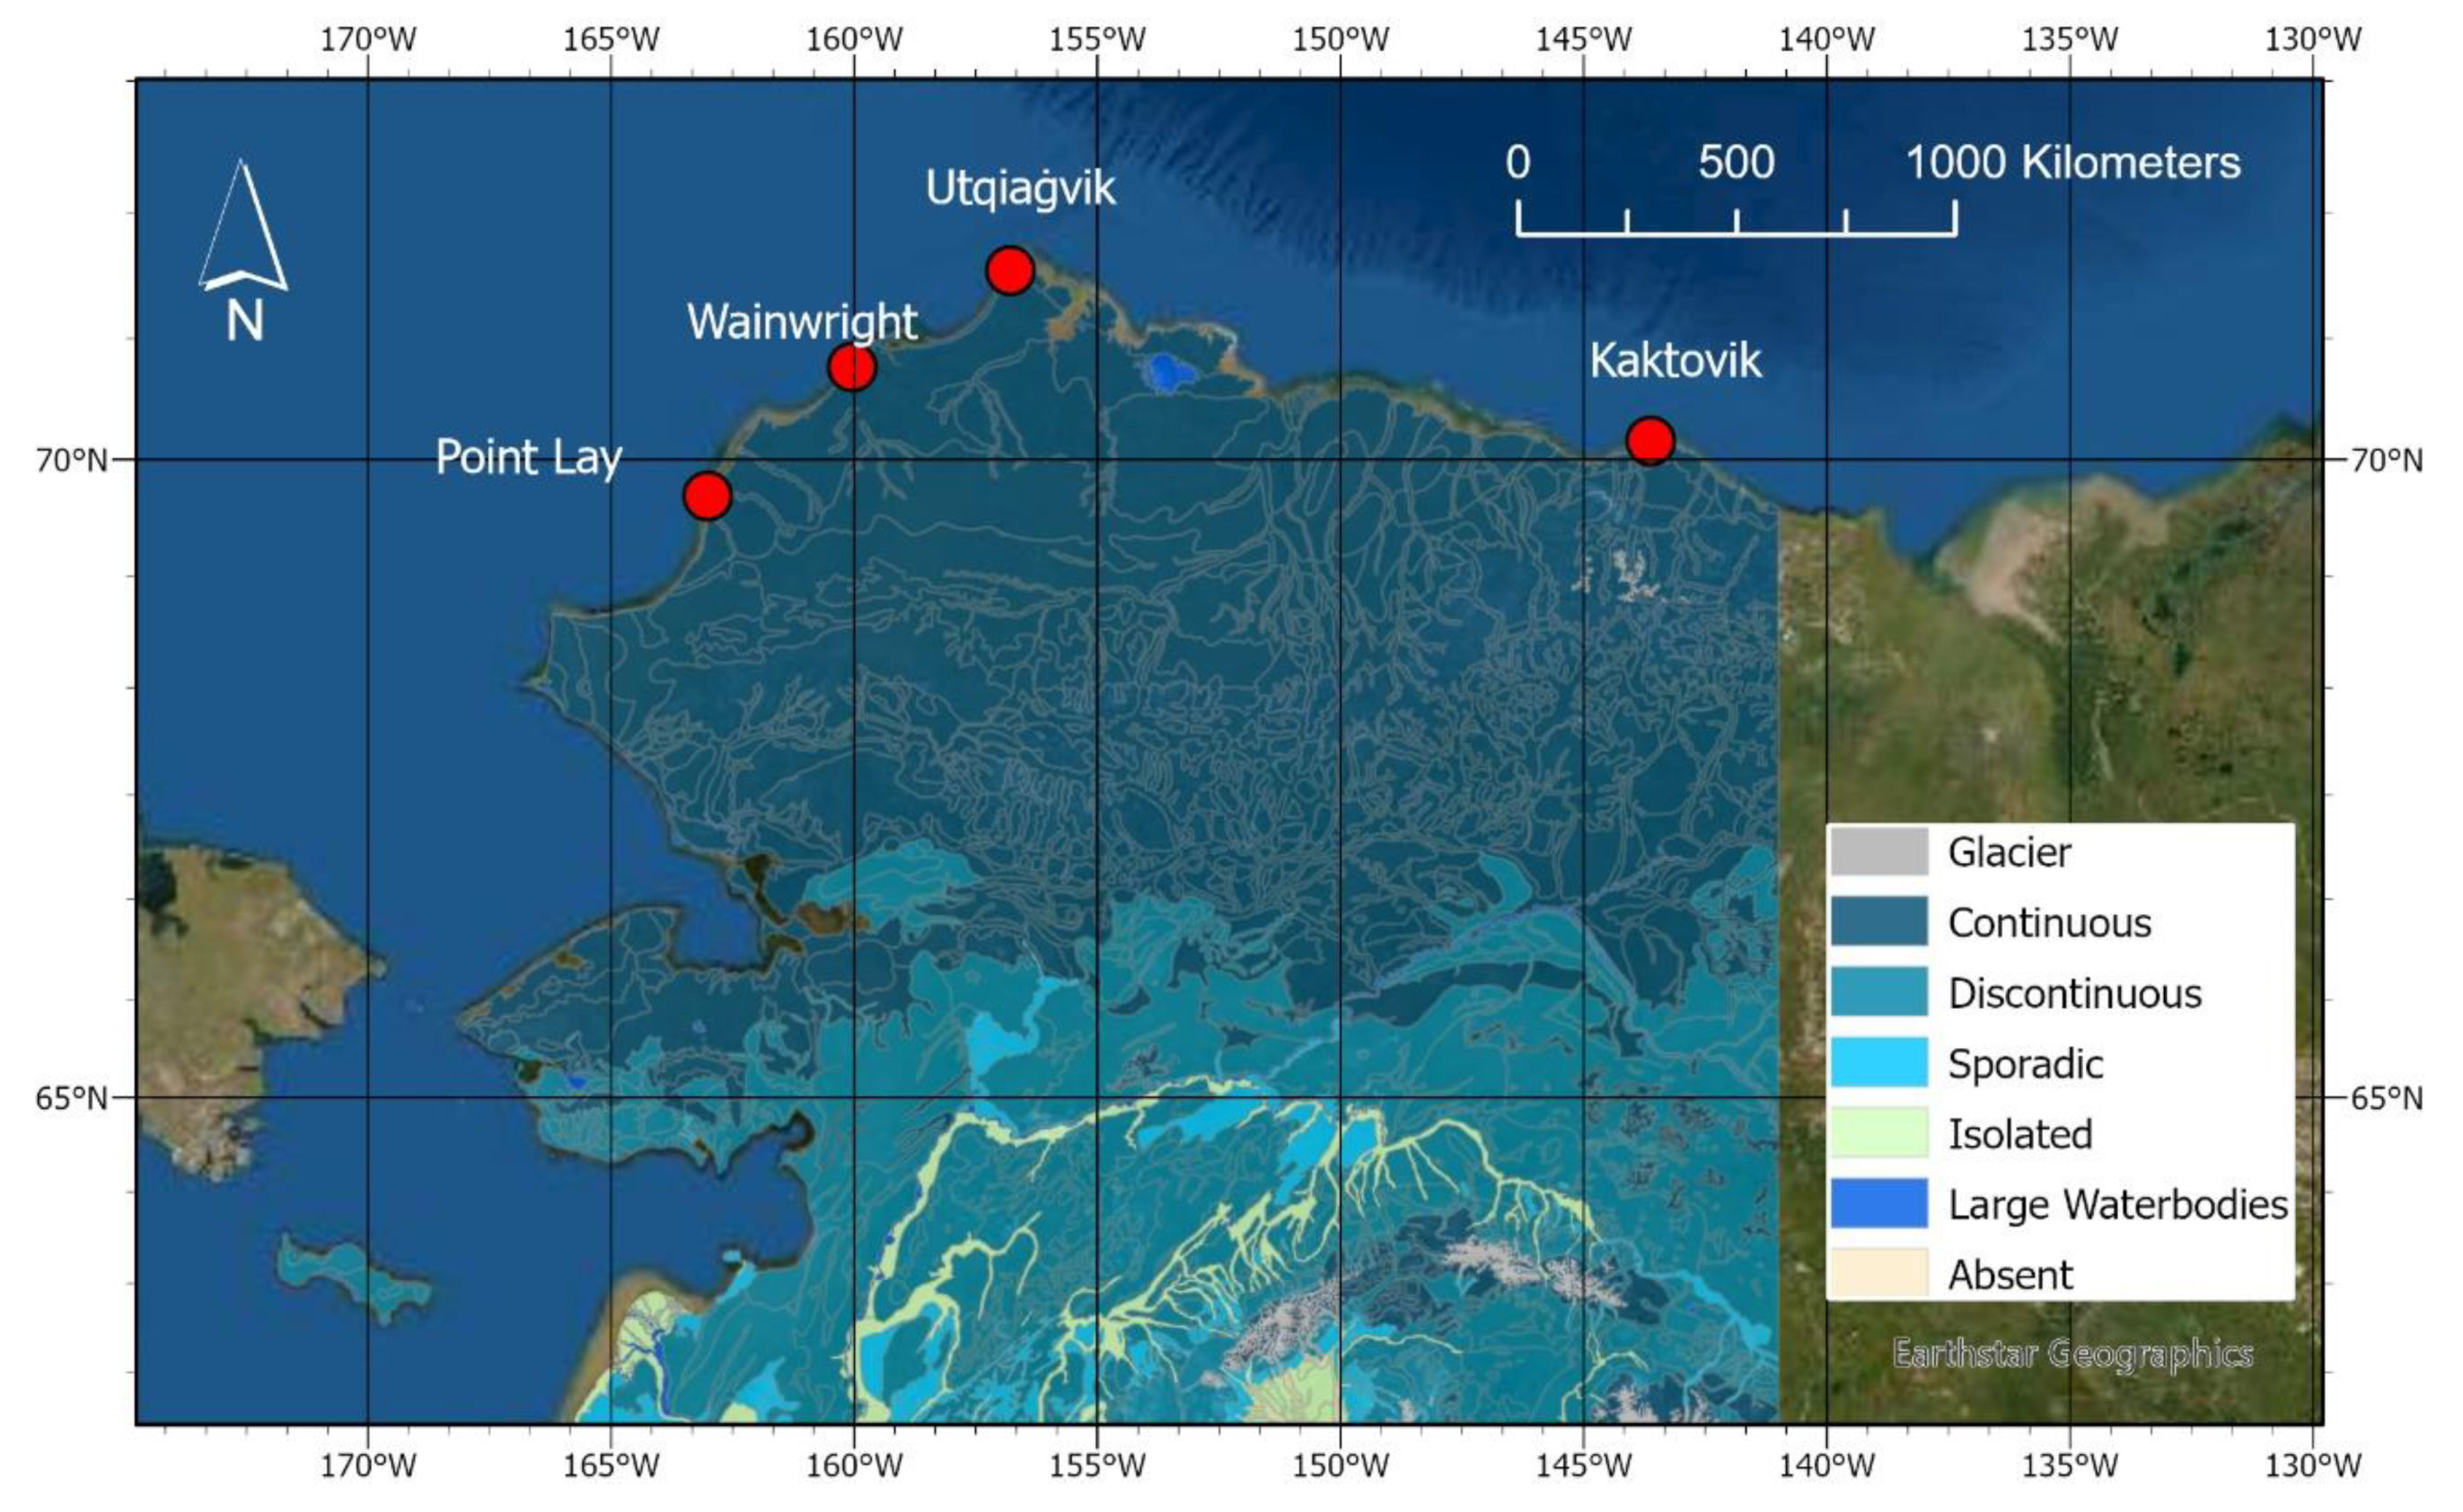
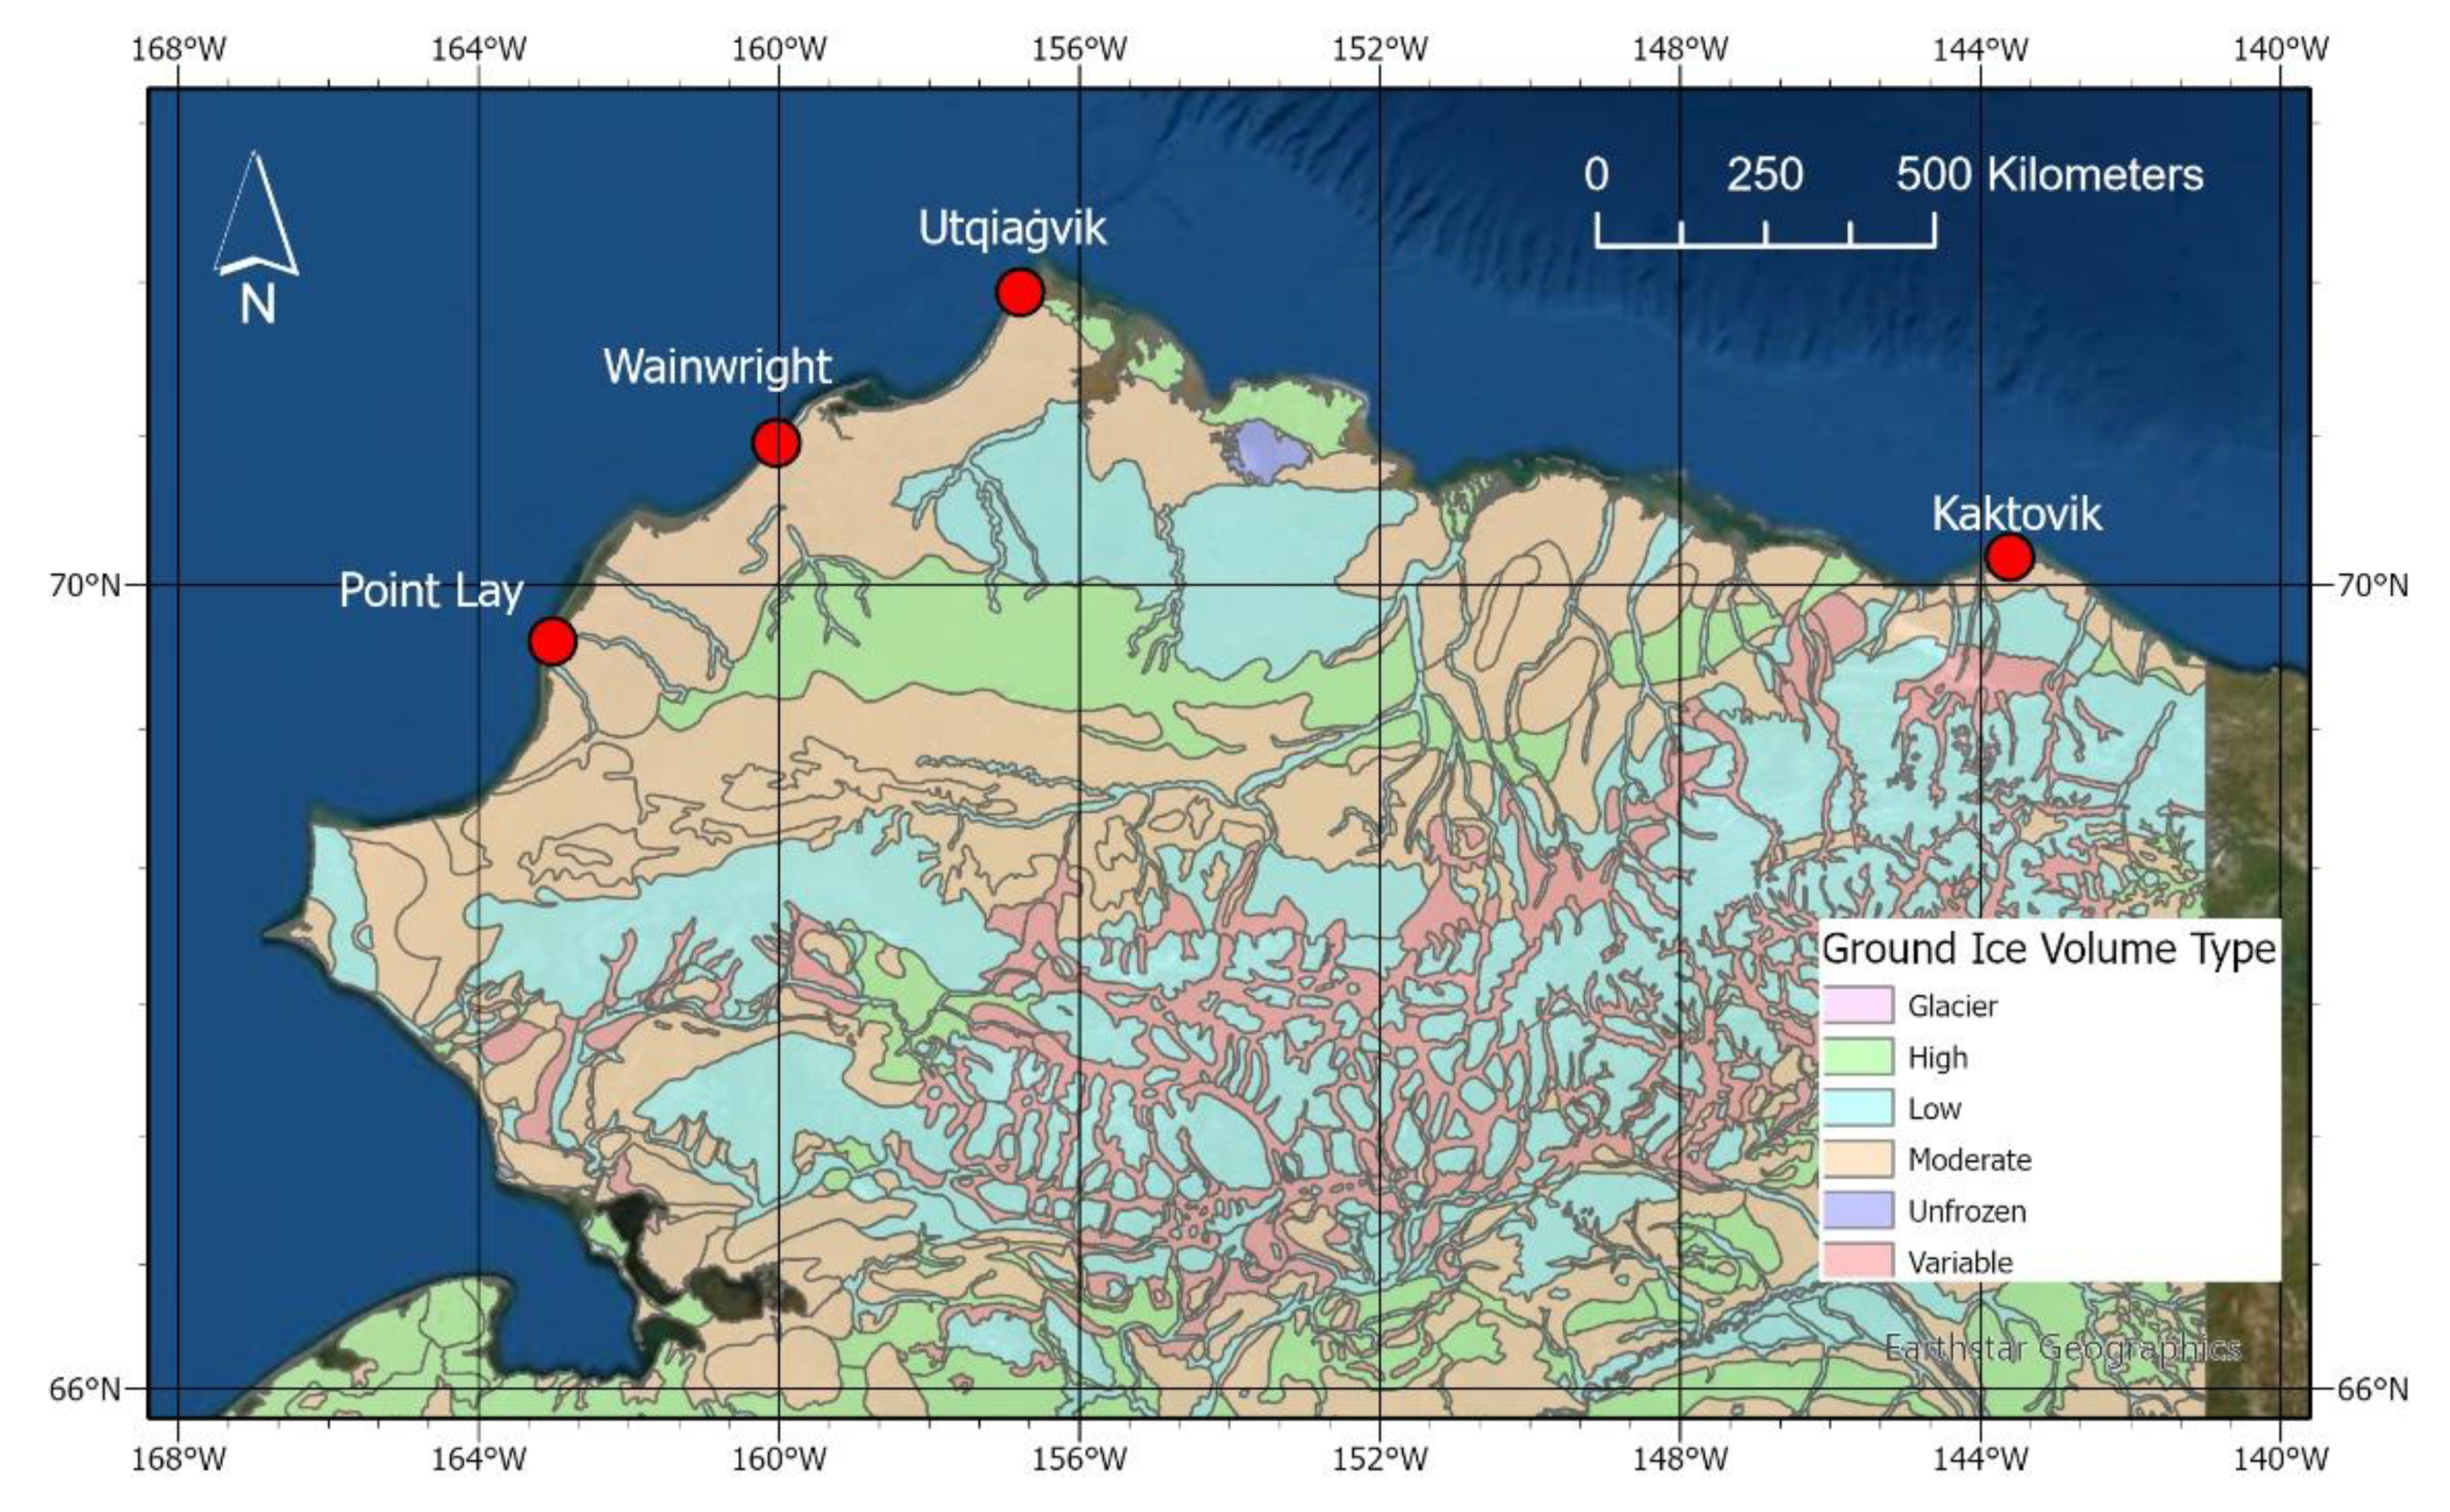
2. Study Areas
3. Survey Method
3.1. Questionnaire
3.2. Participants
3.3. Data Analysis
4. Results
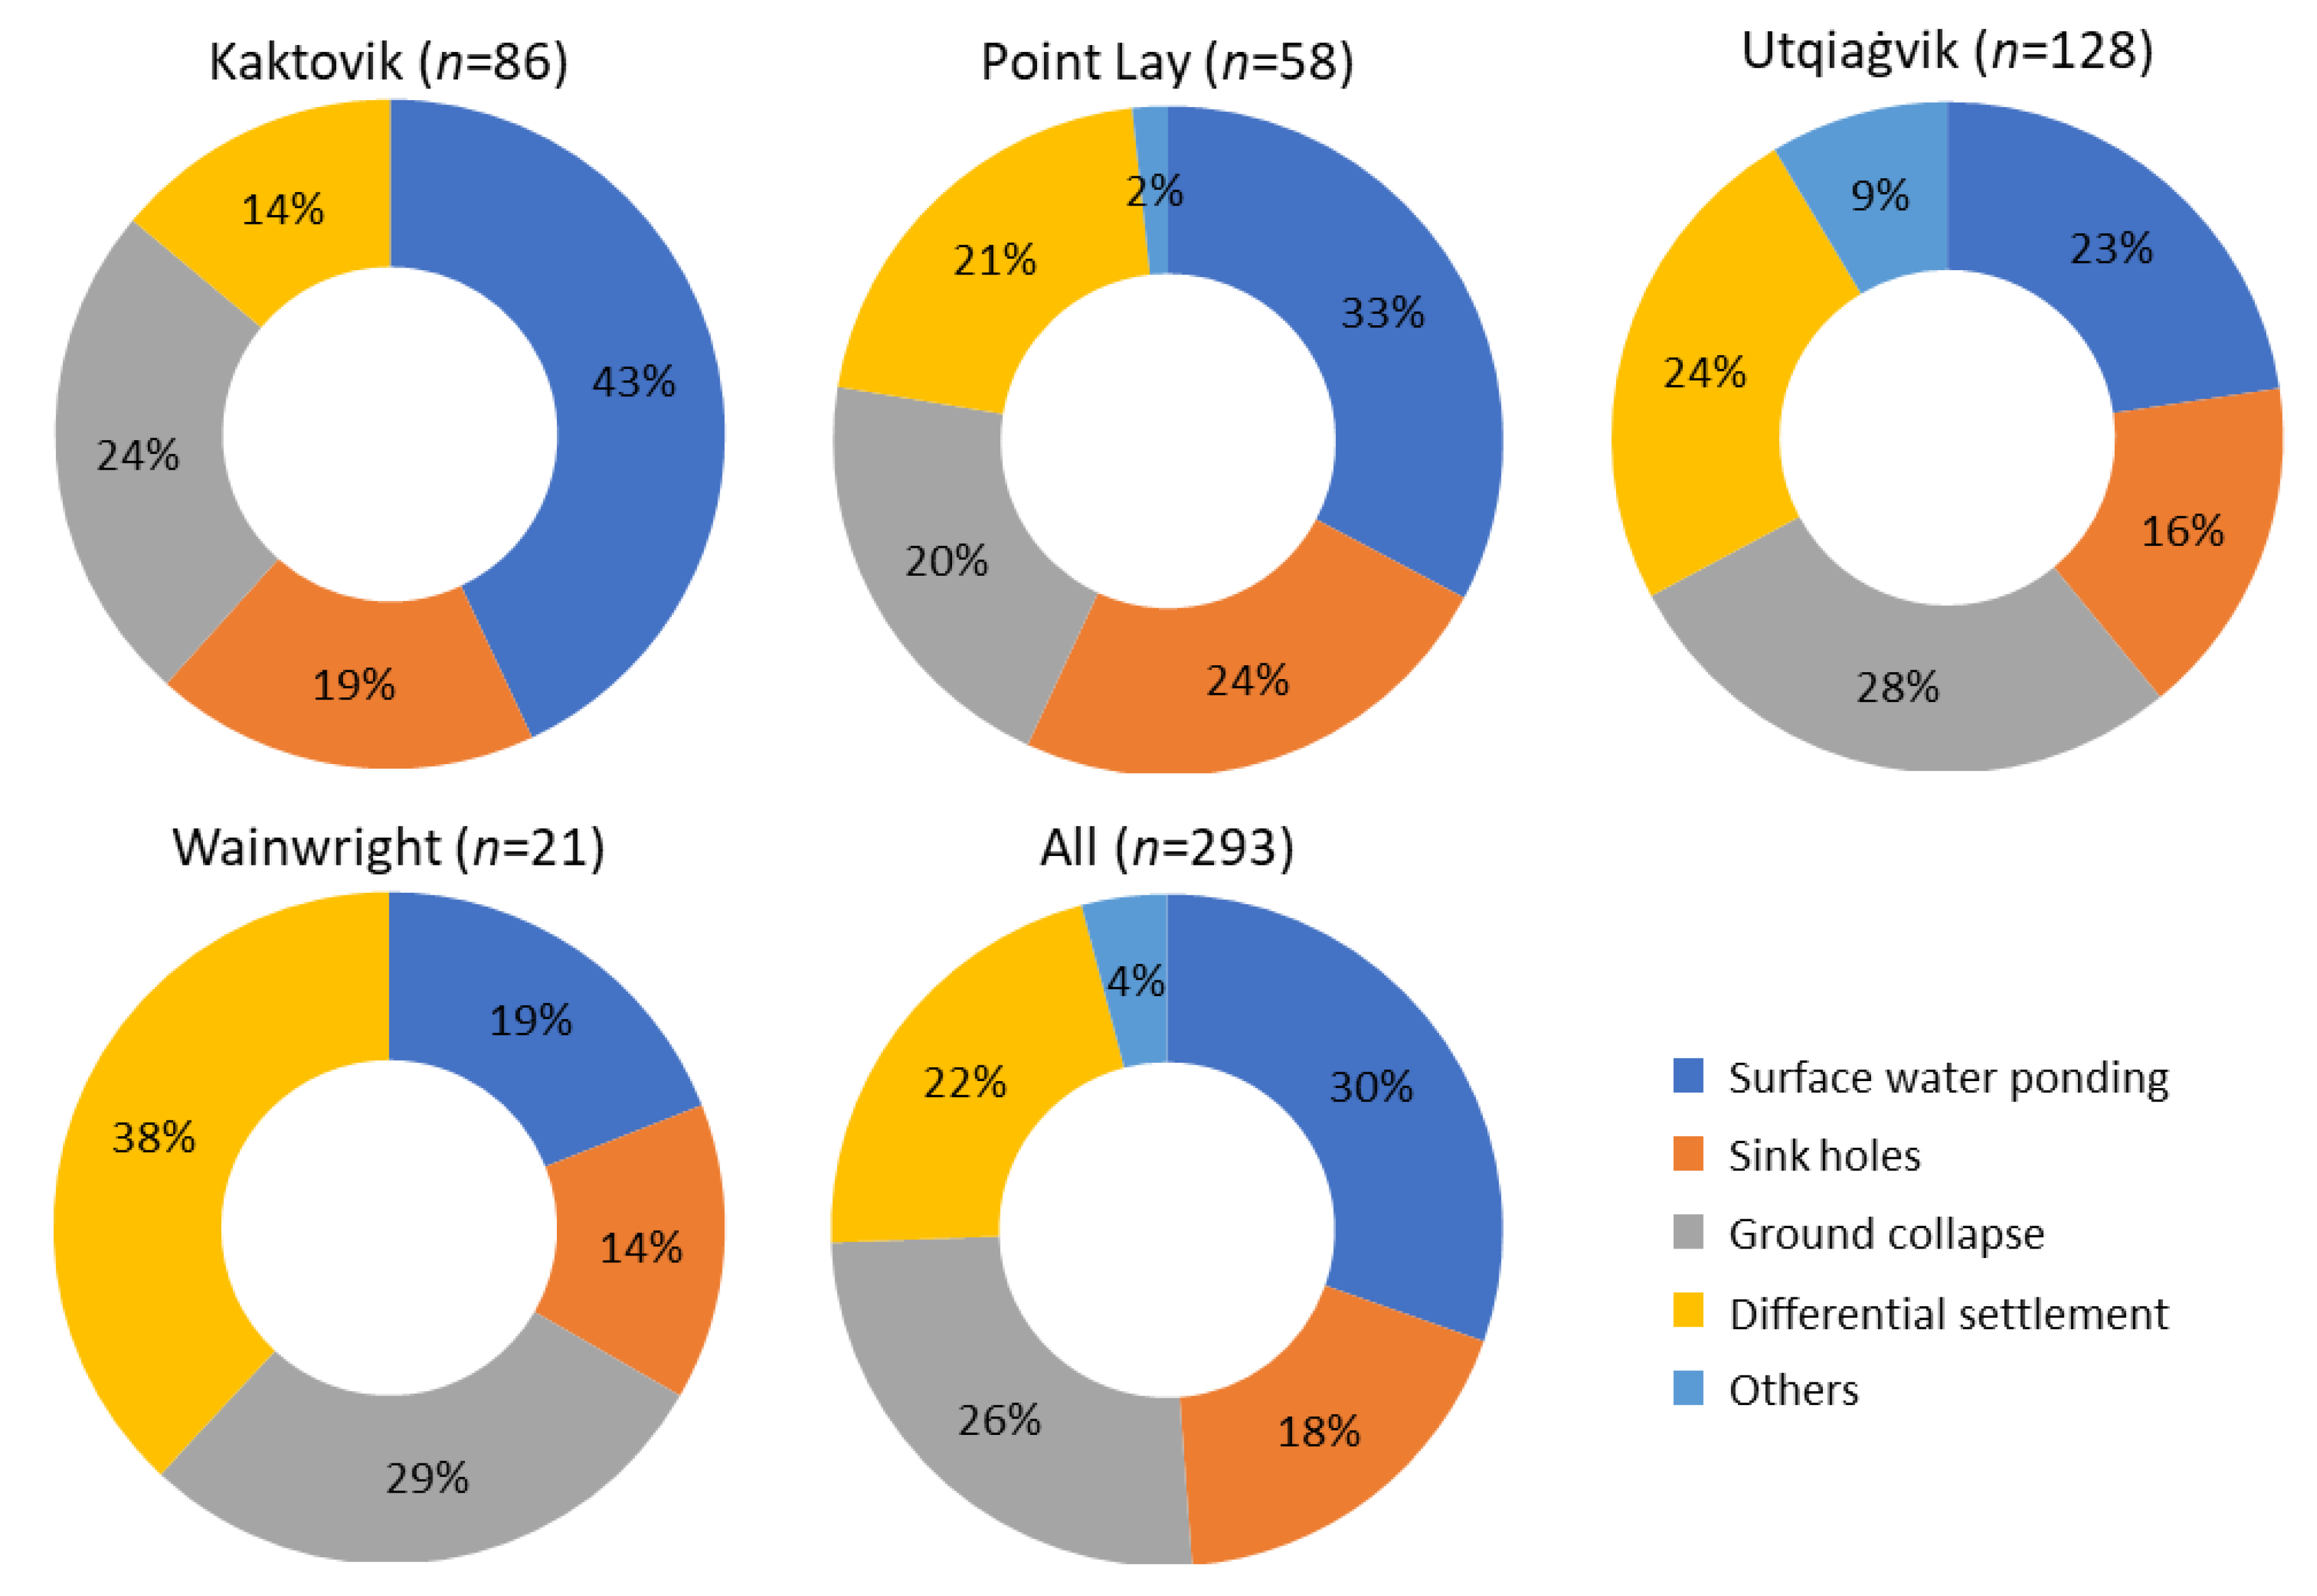
4.1. Permafrost Thaw and the Affected Civil Infrastructure
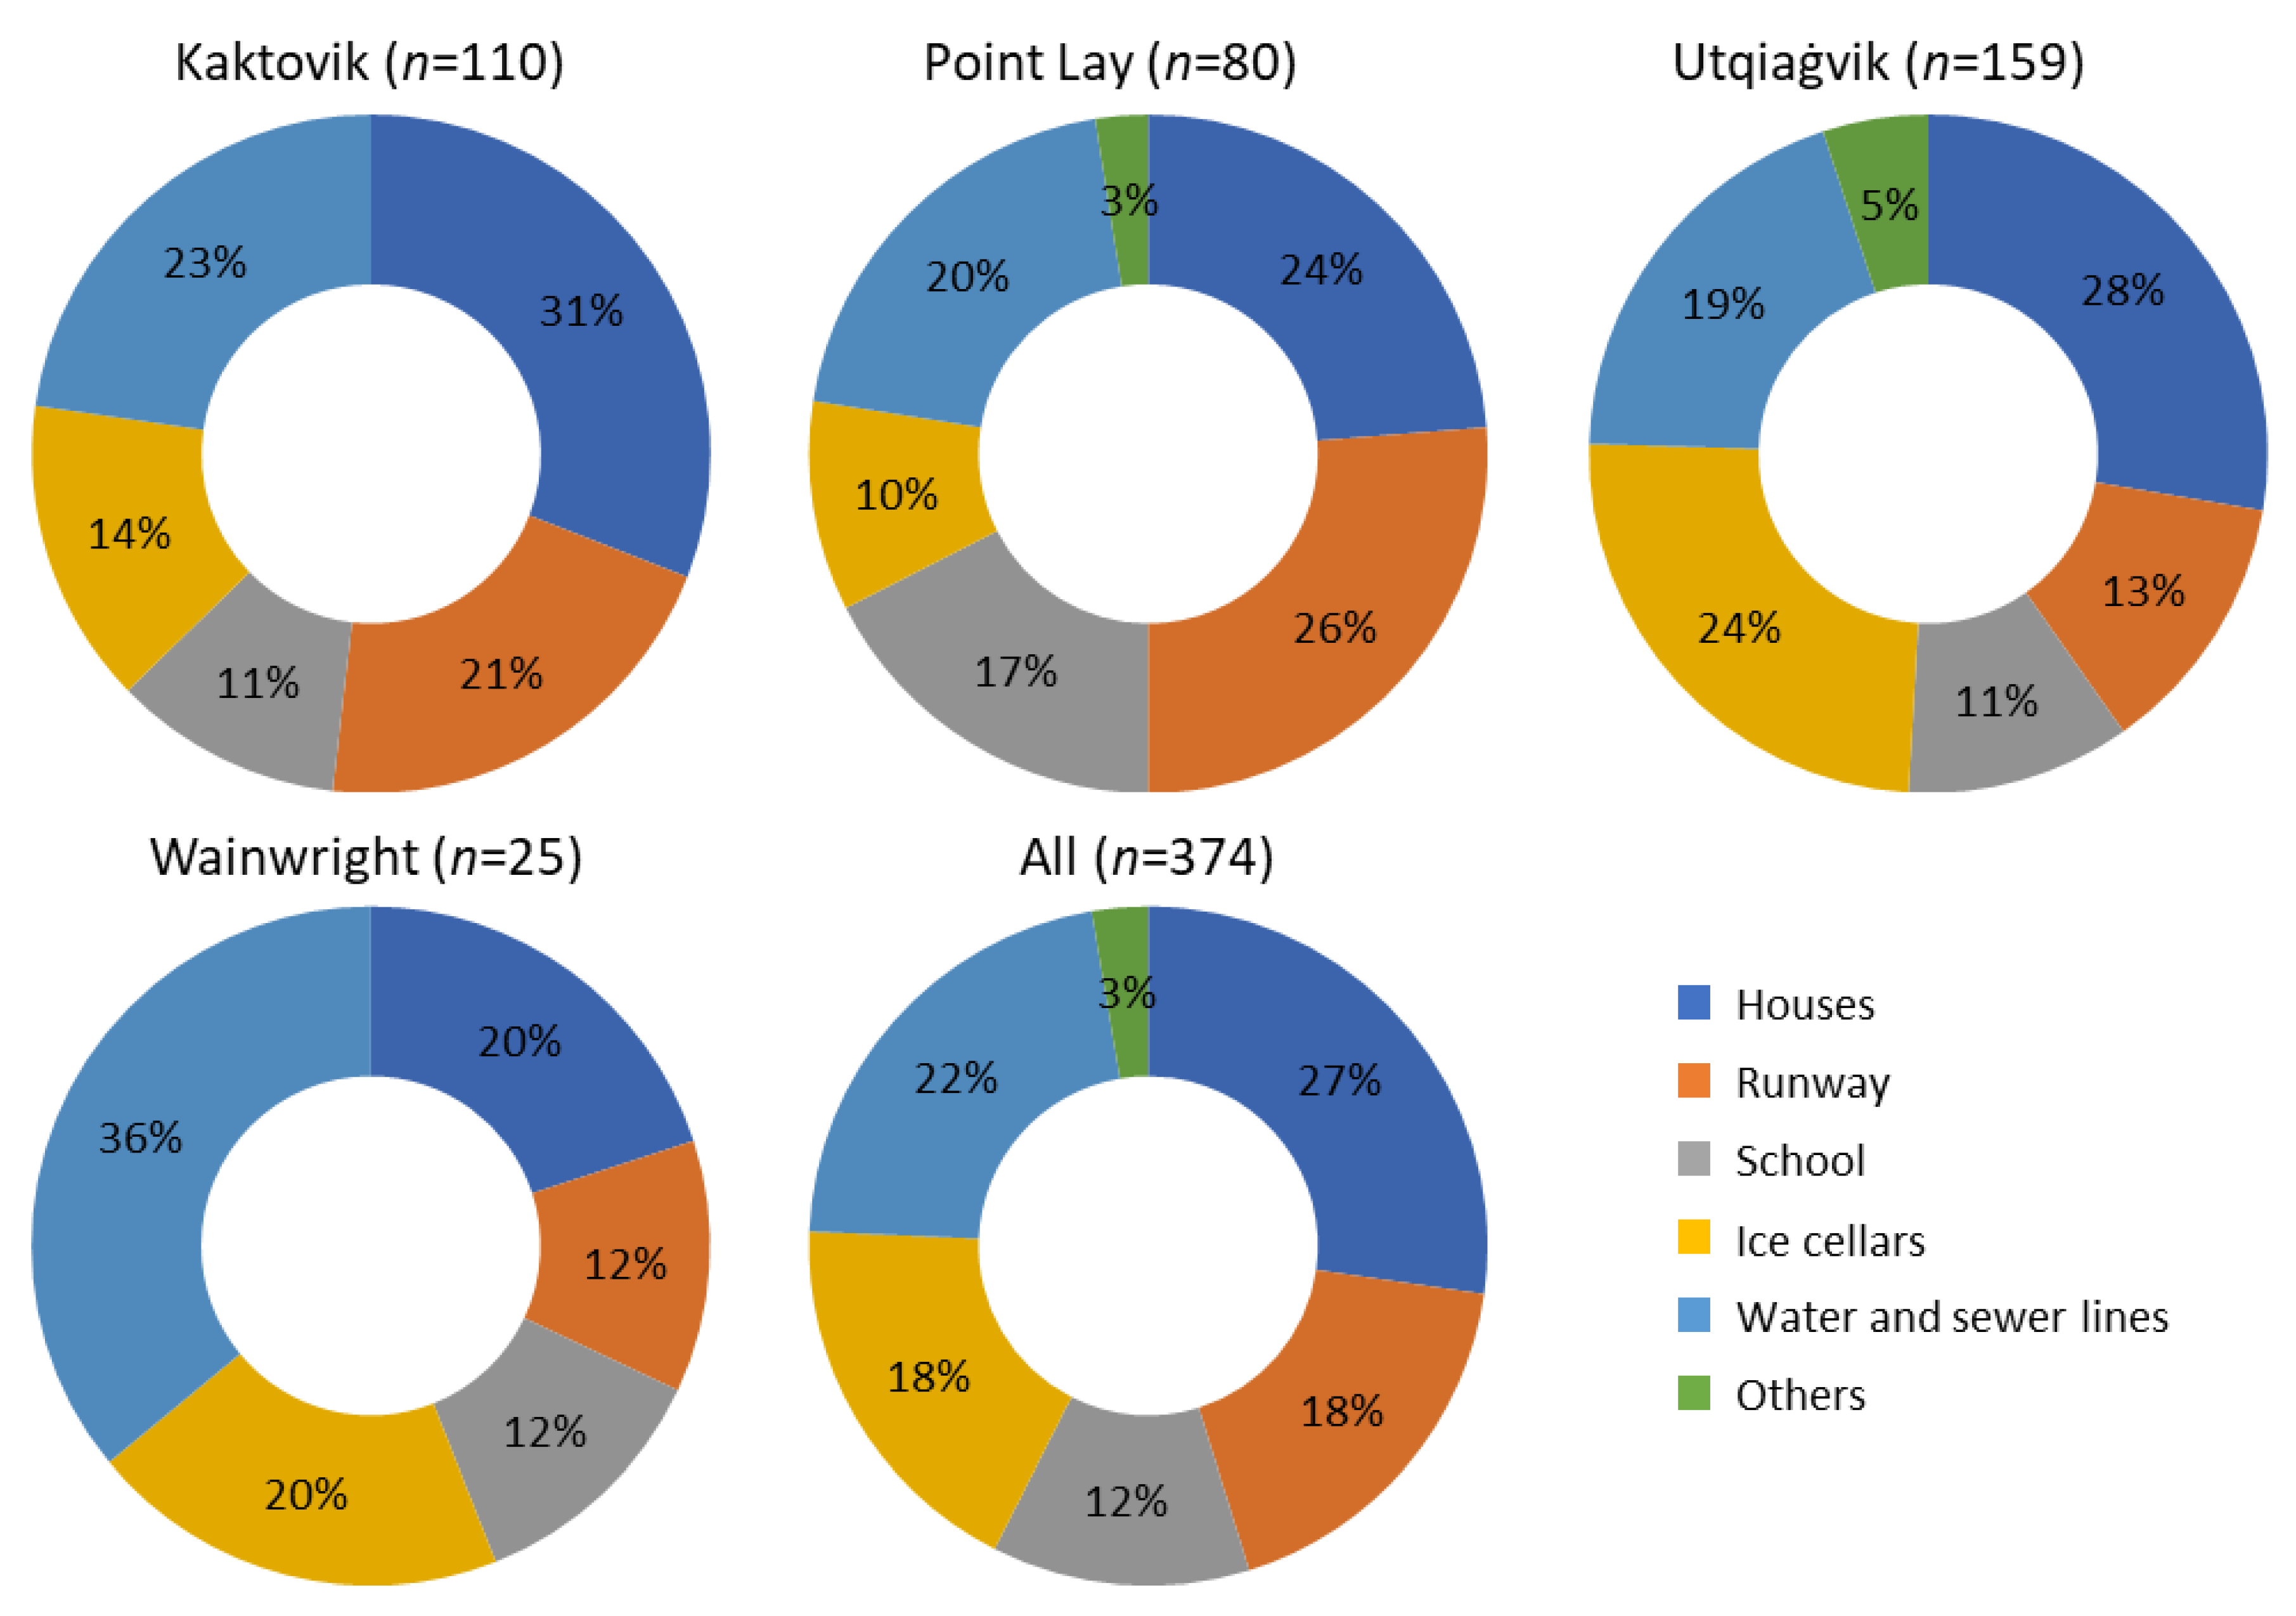
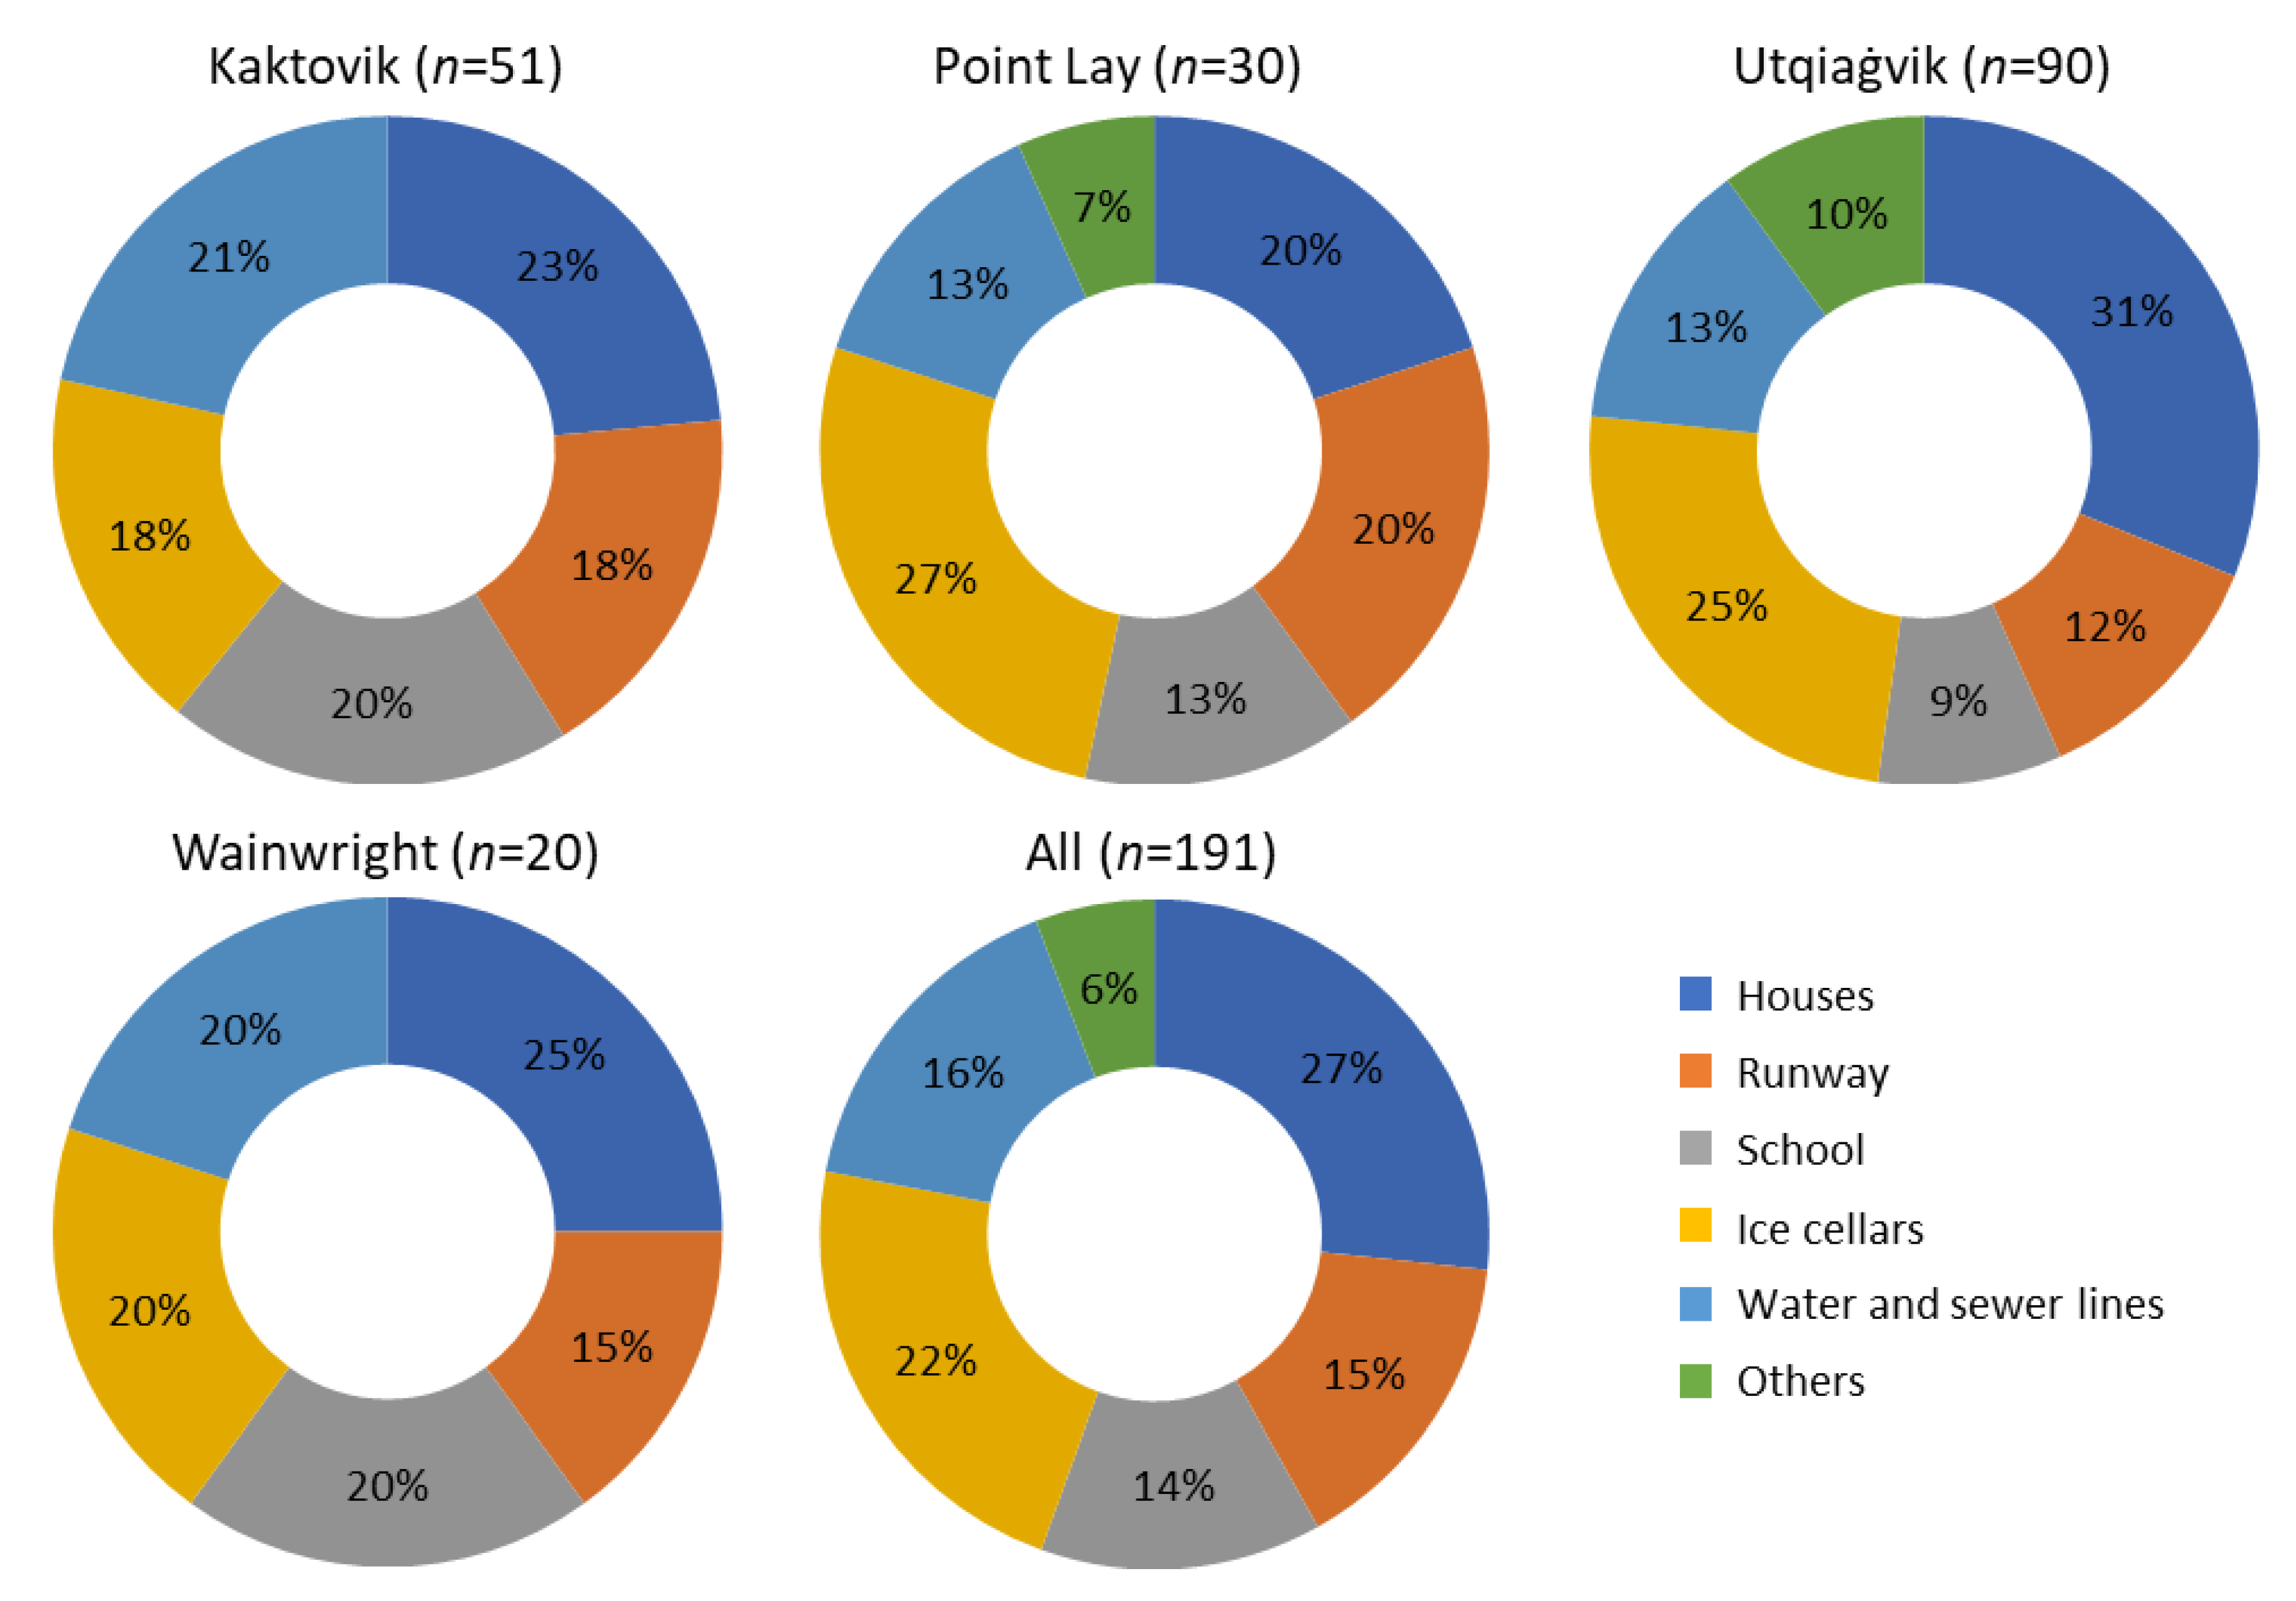
4.2. Permafrost Coastal Erosion and the Affected Civil Infrastructure
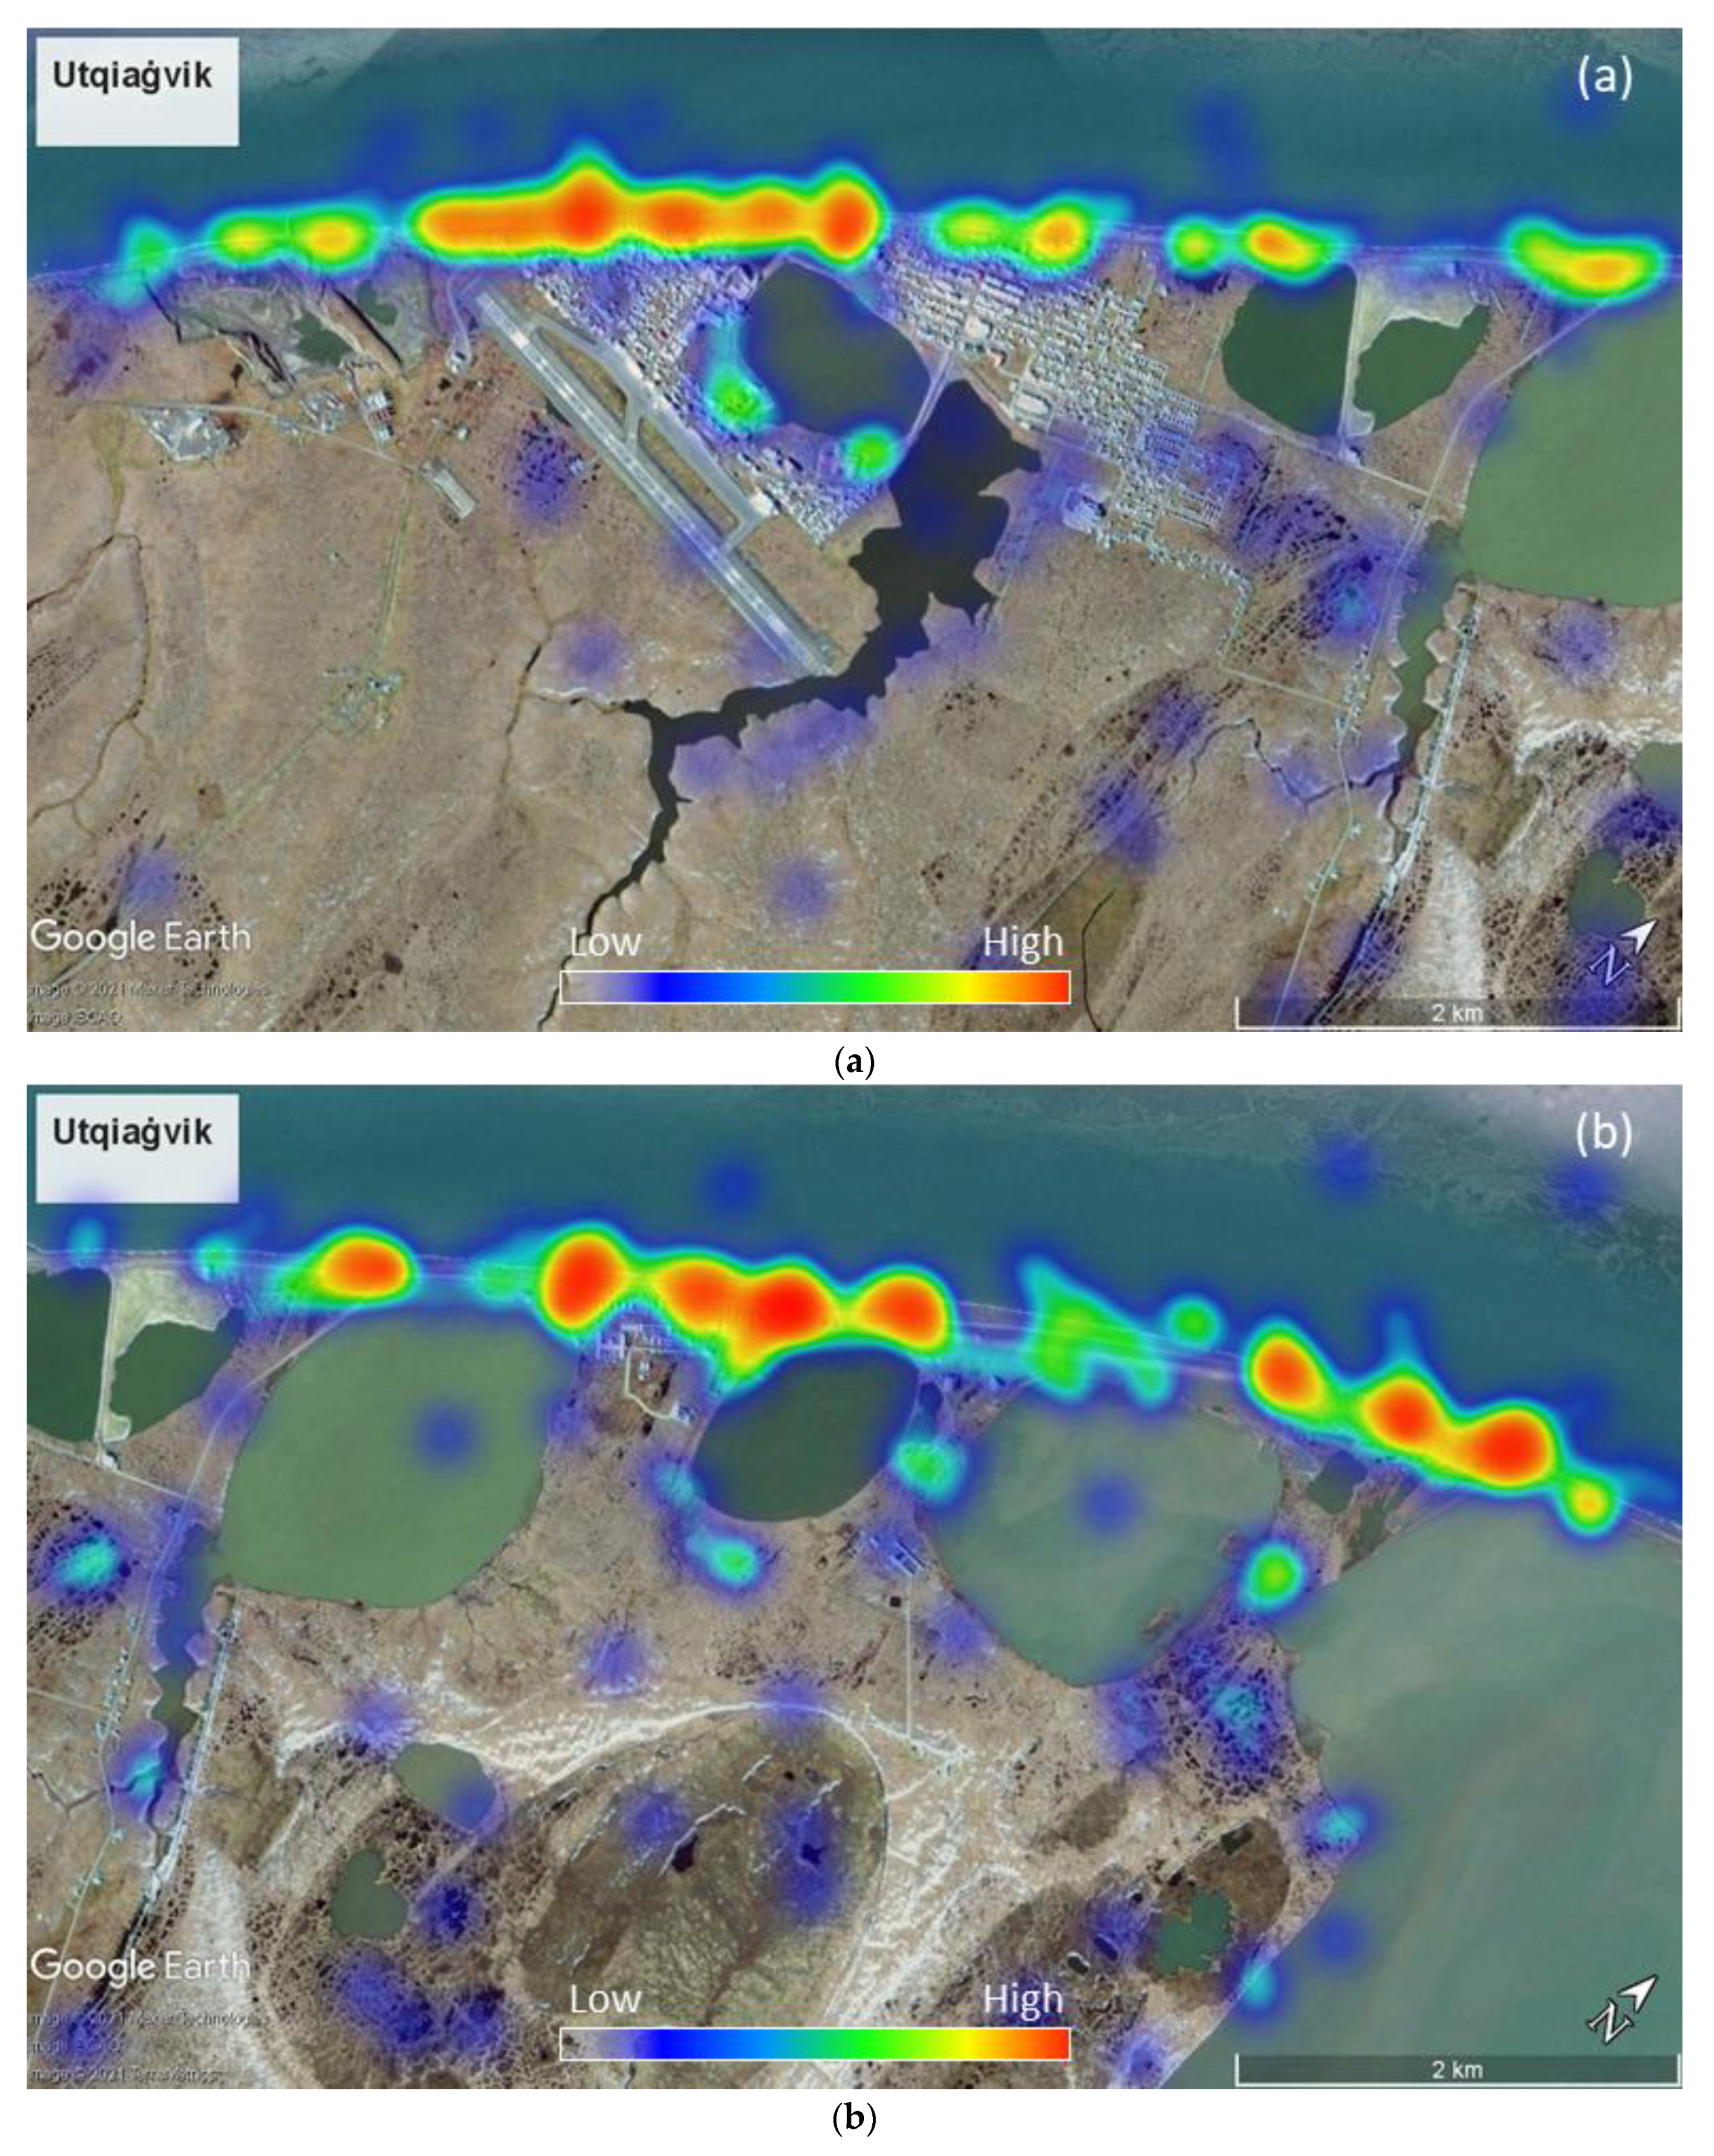
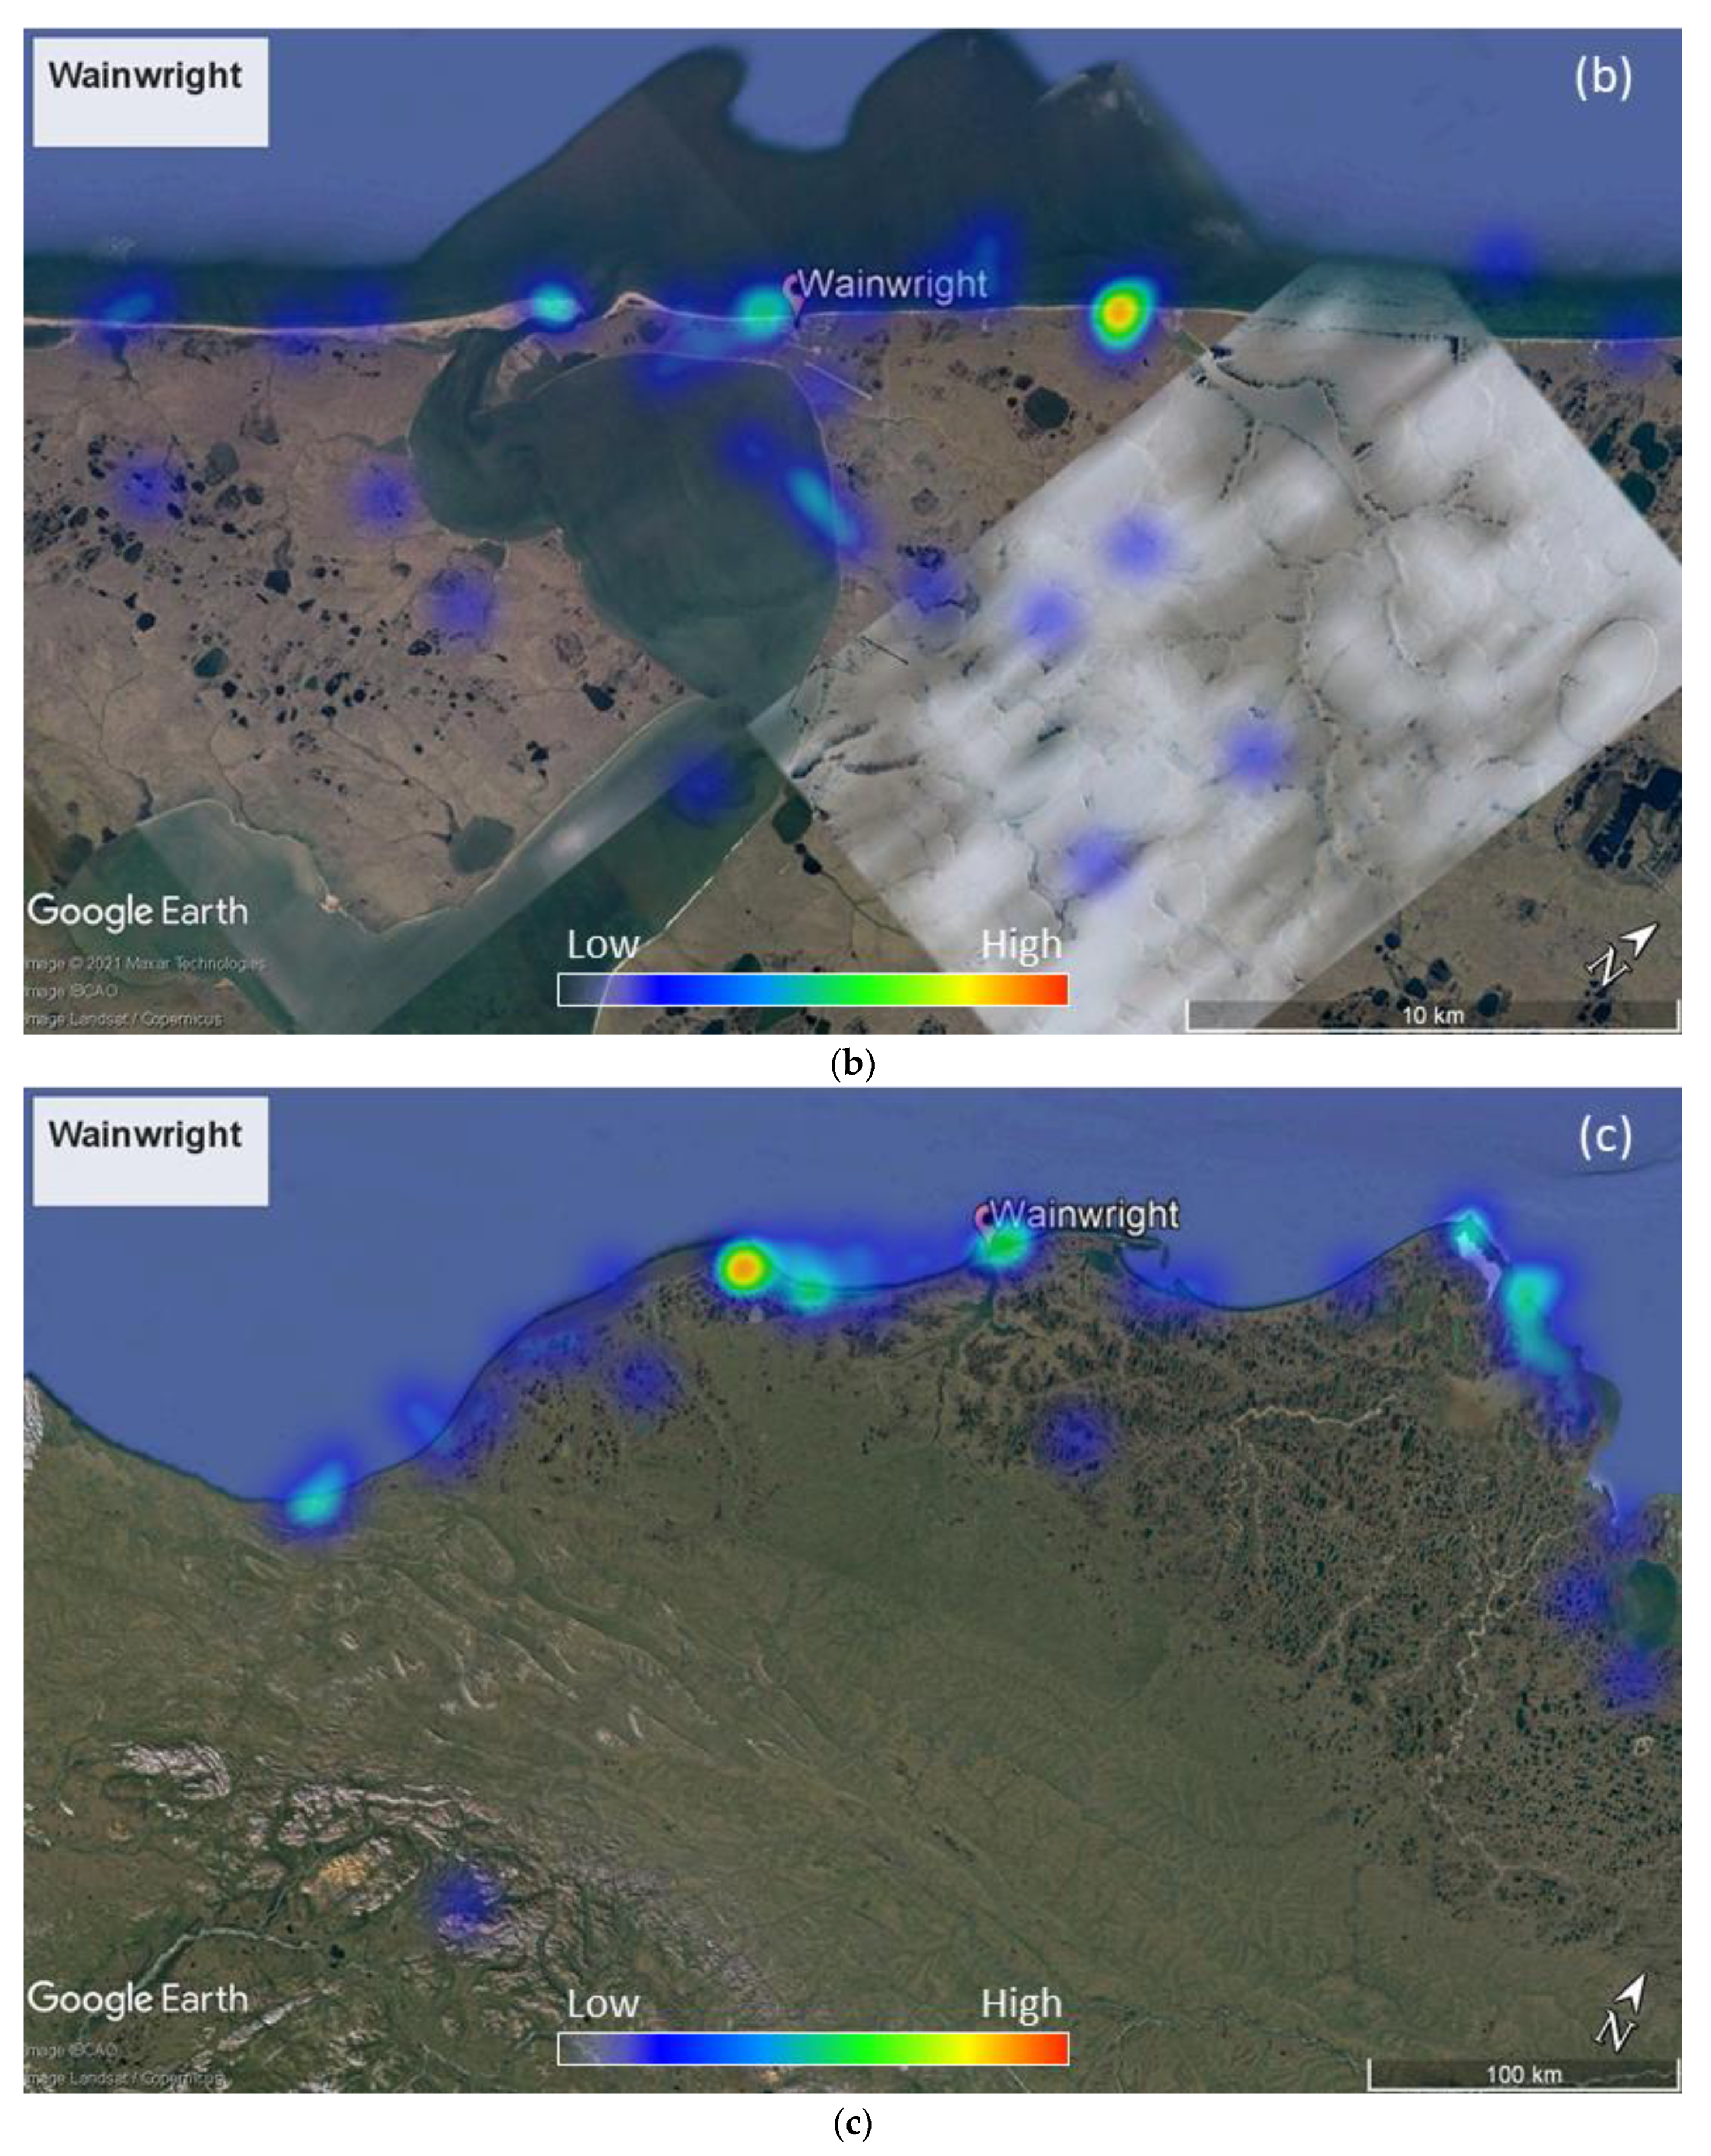
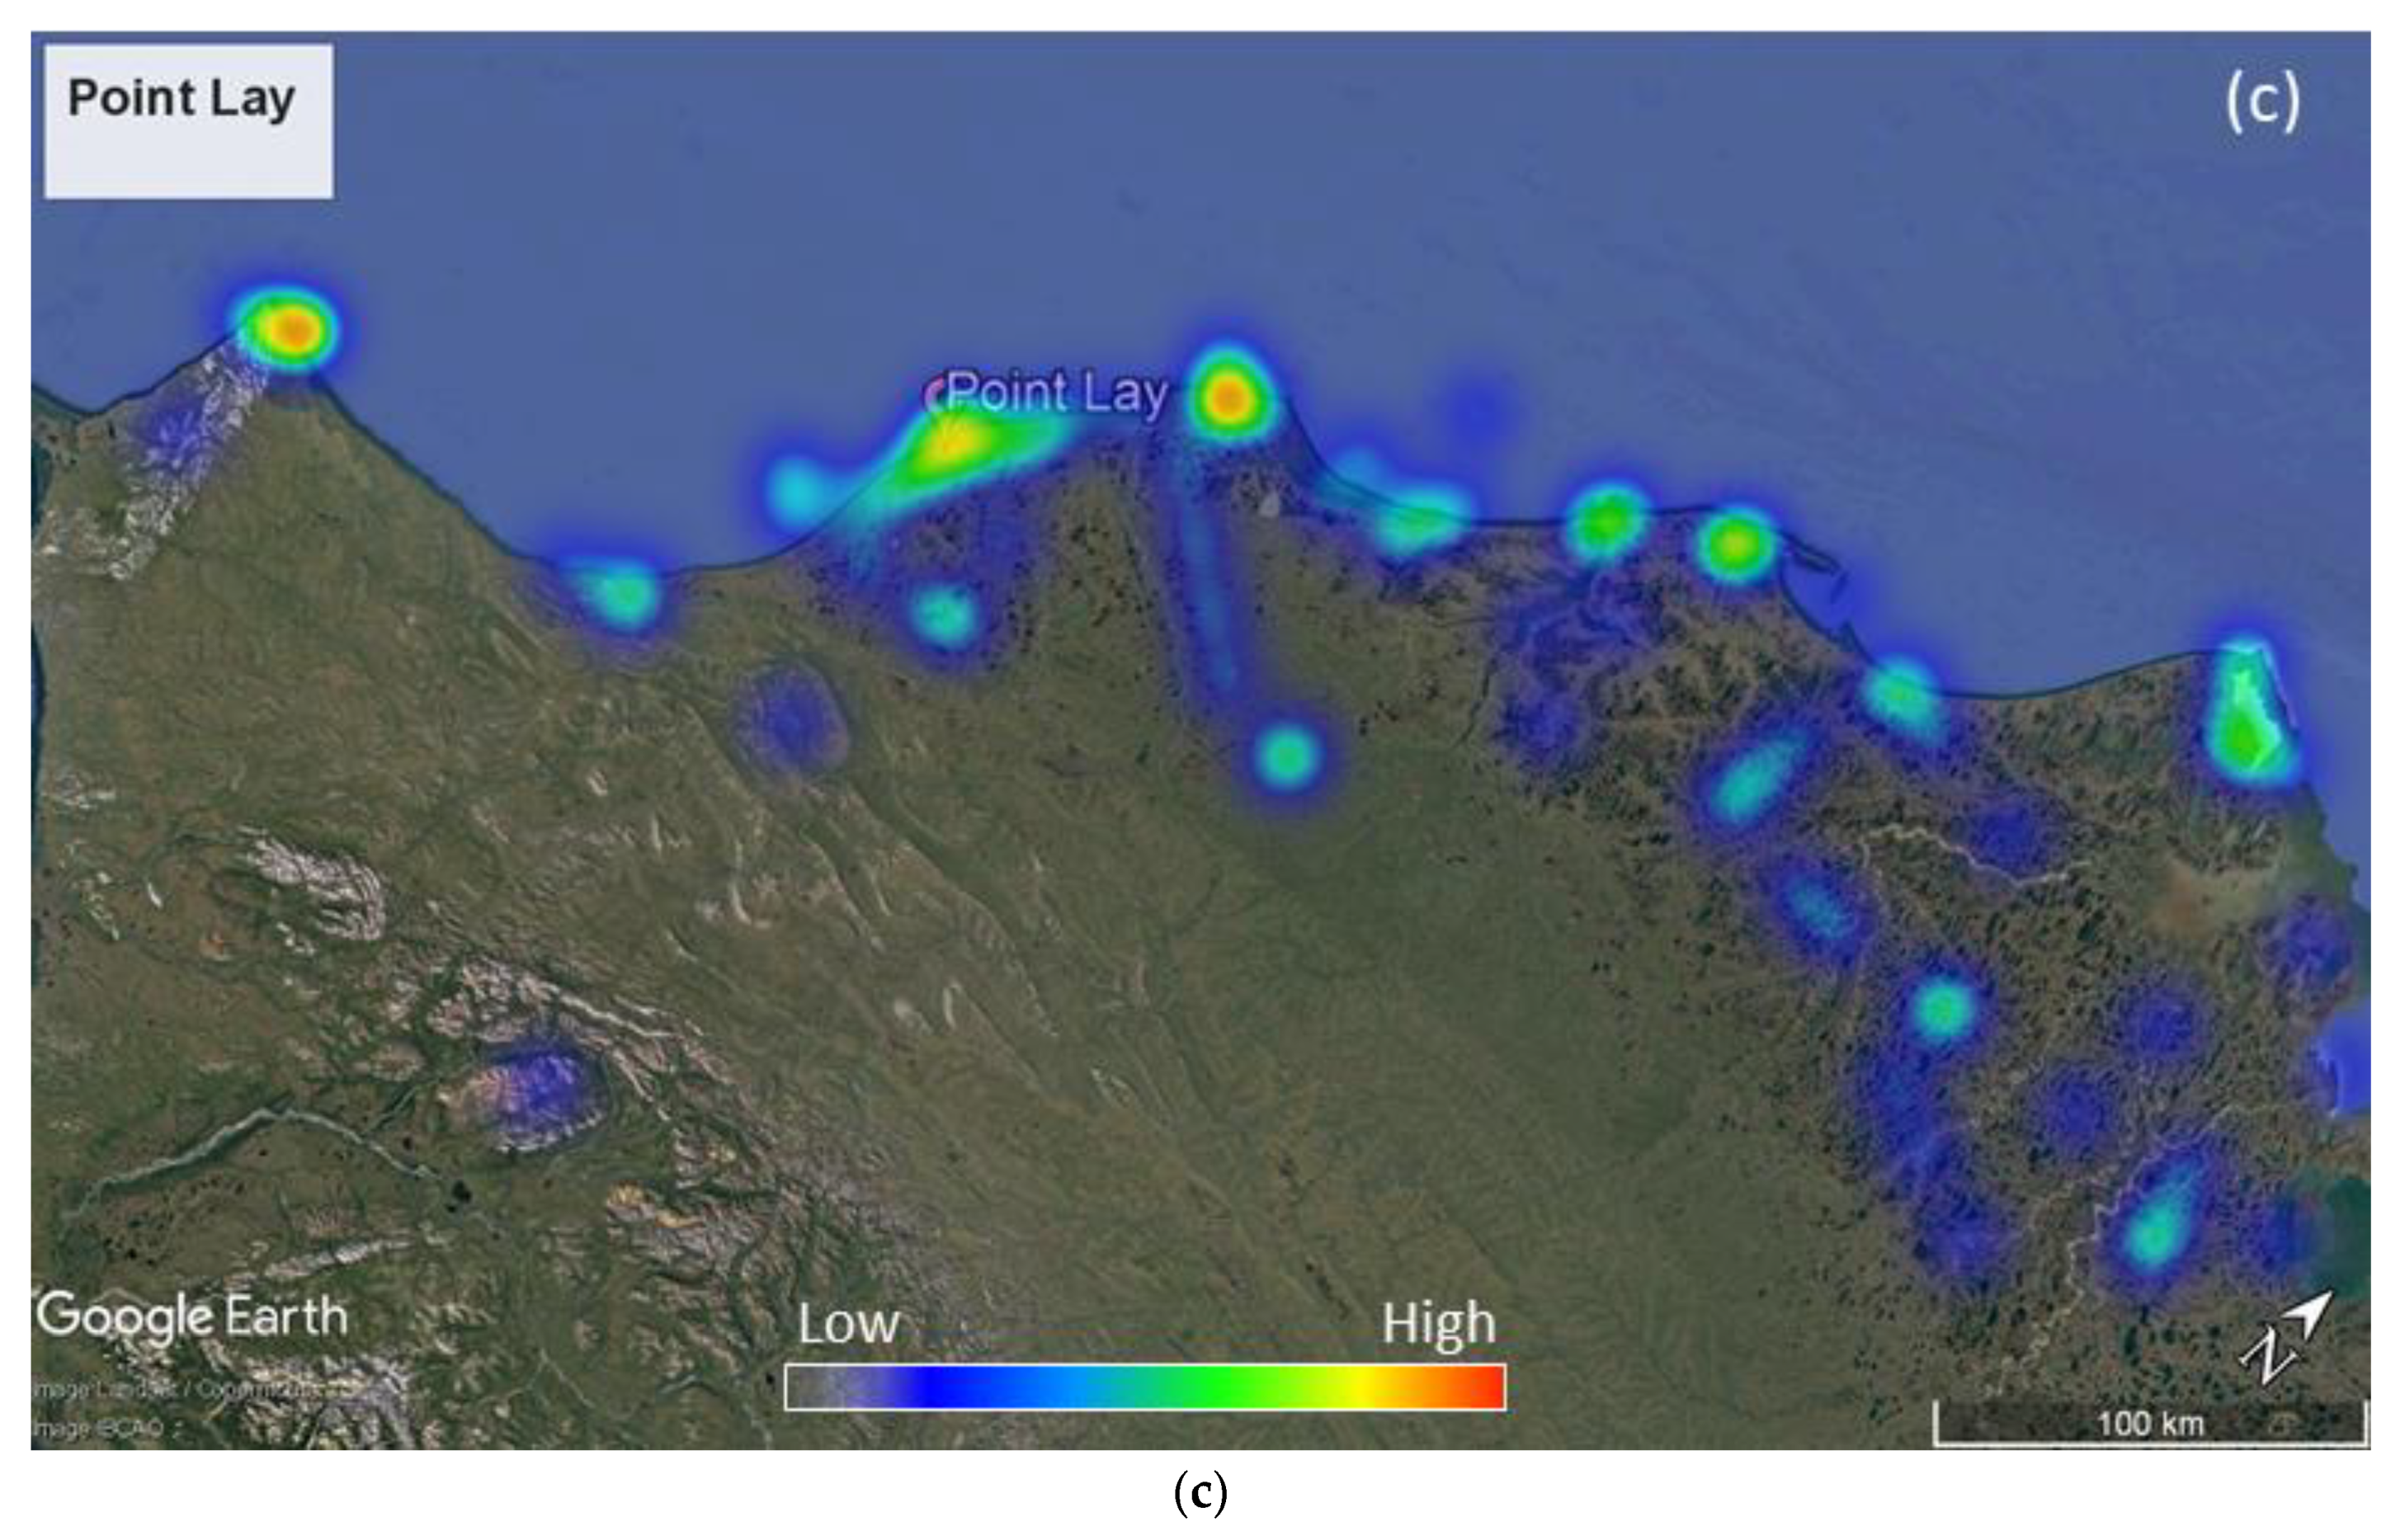
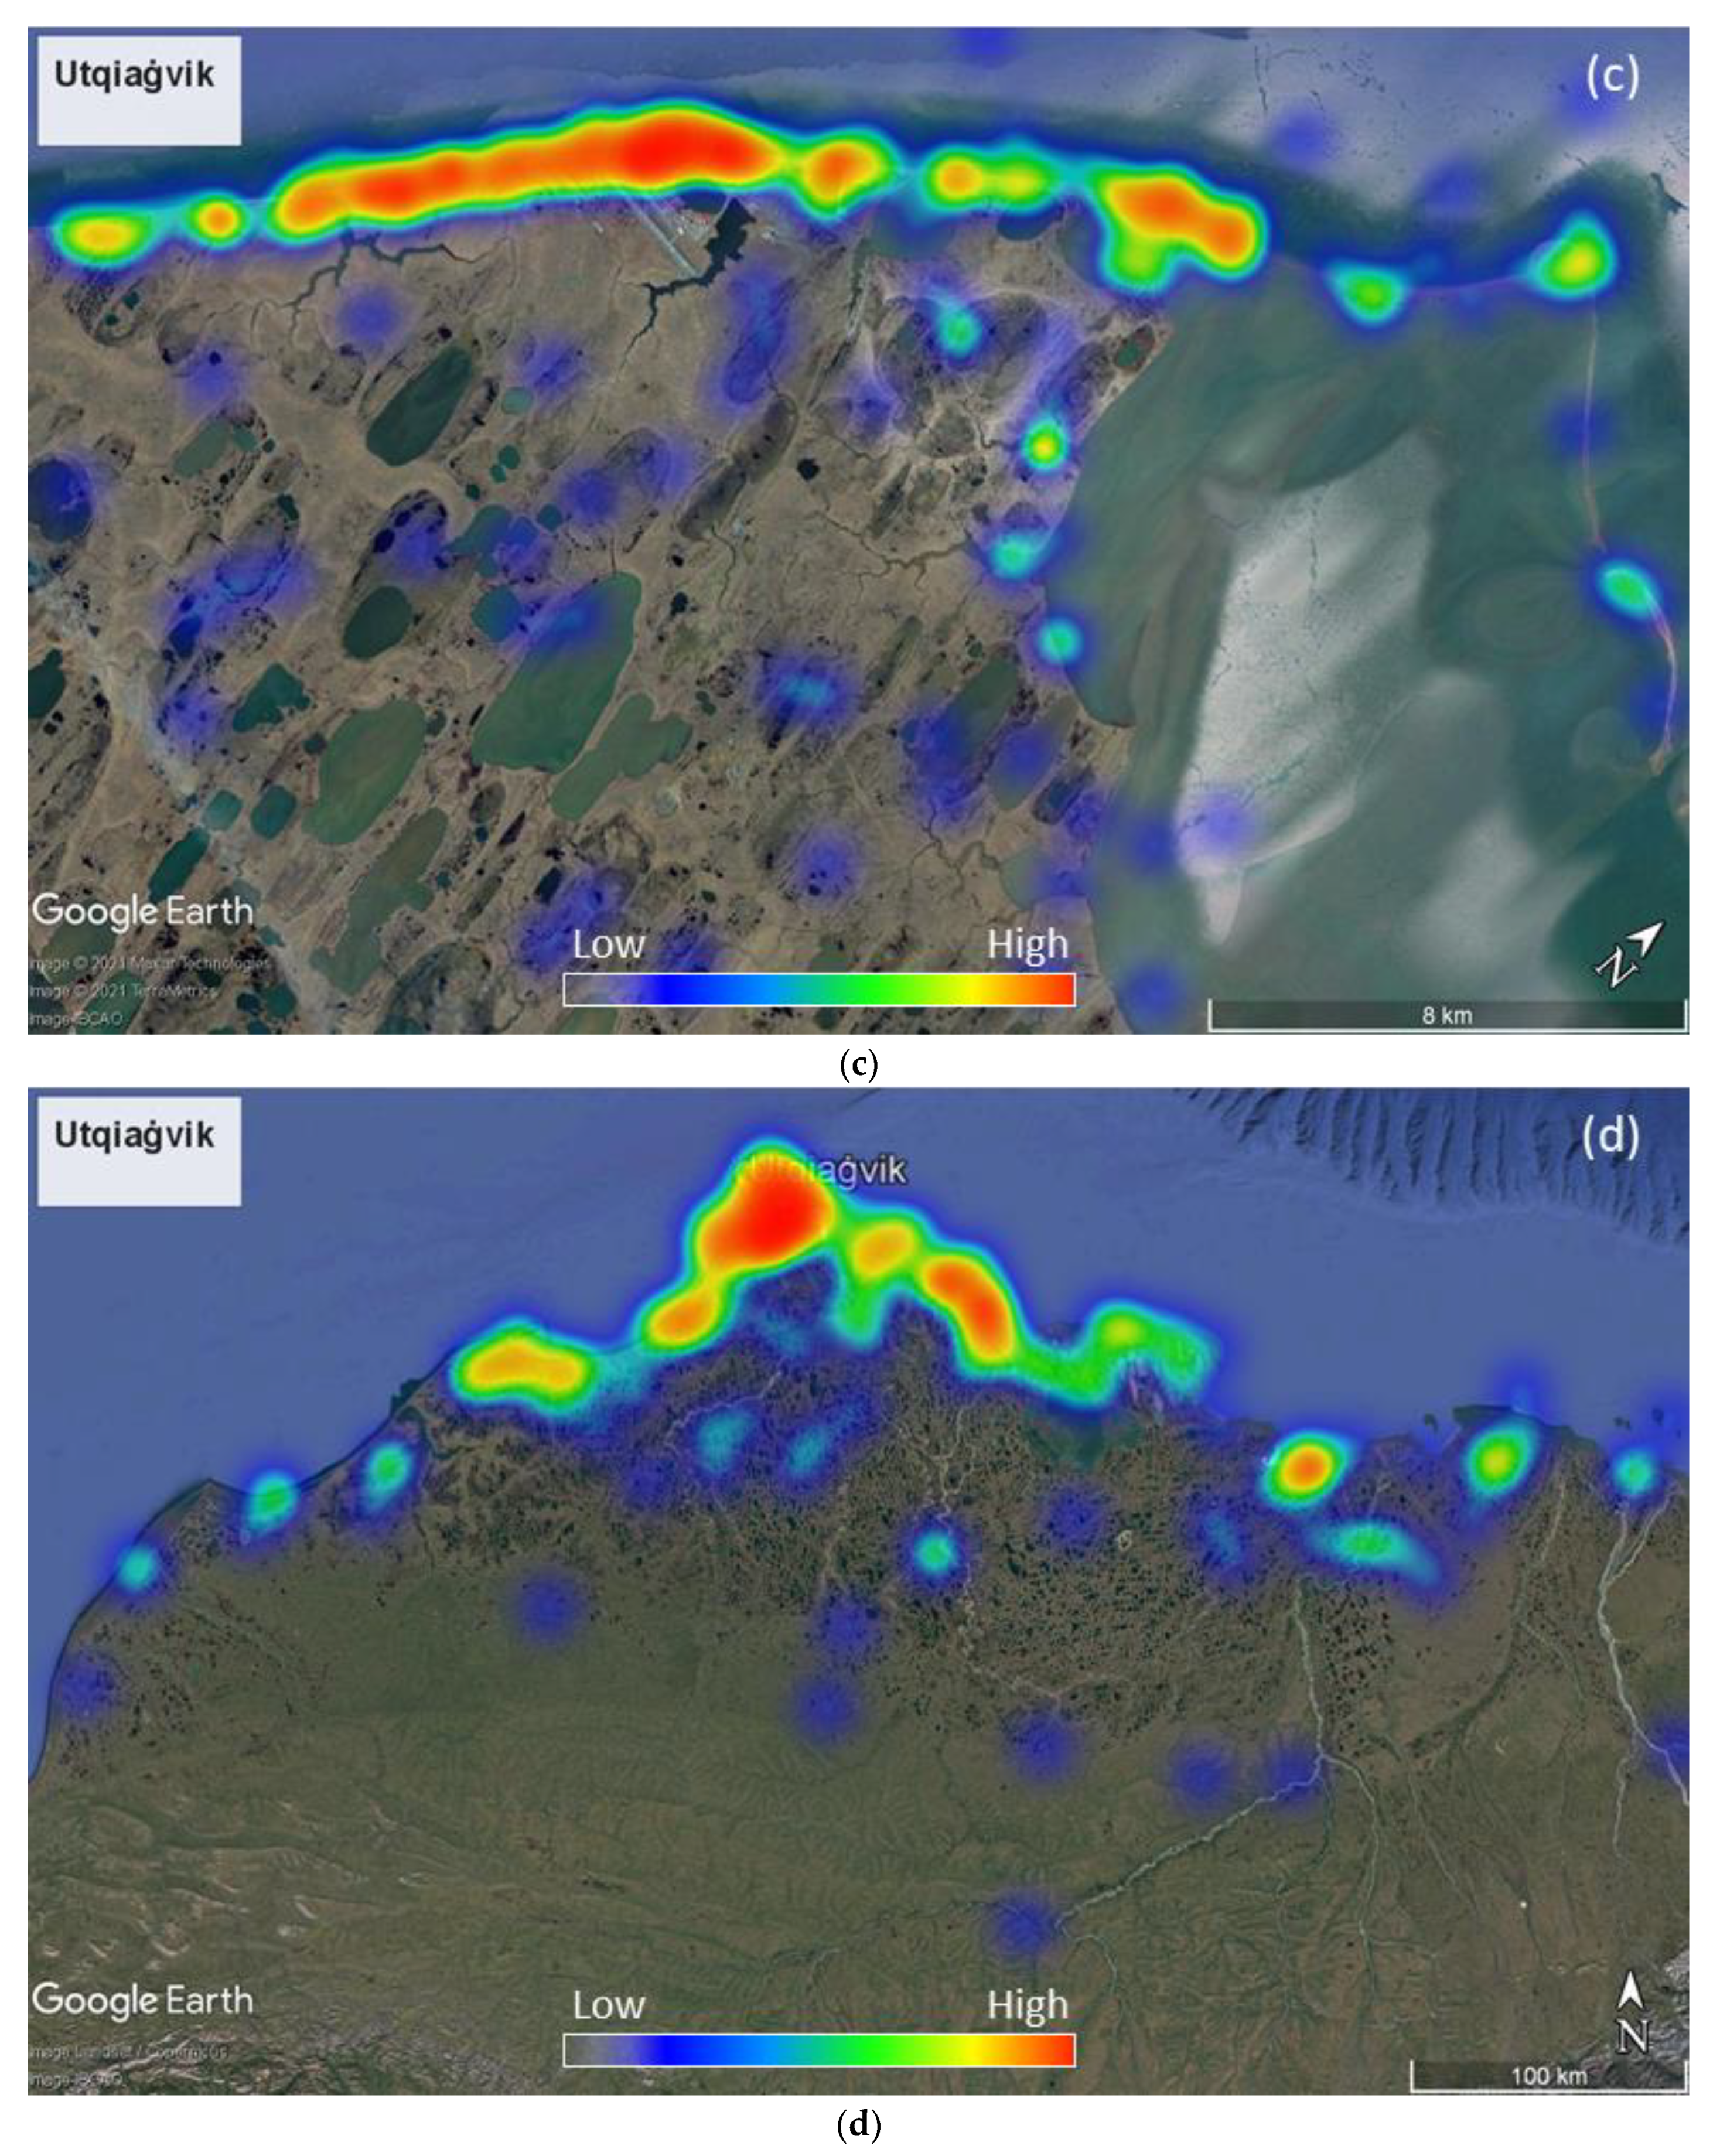
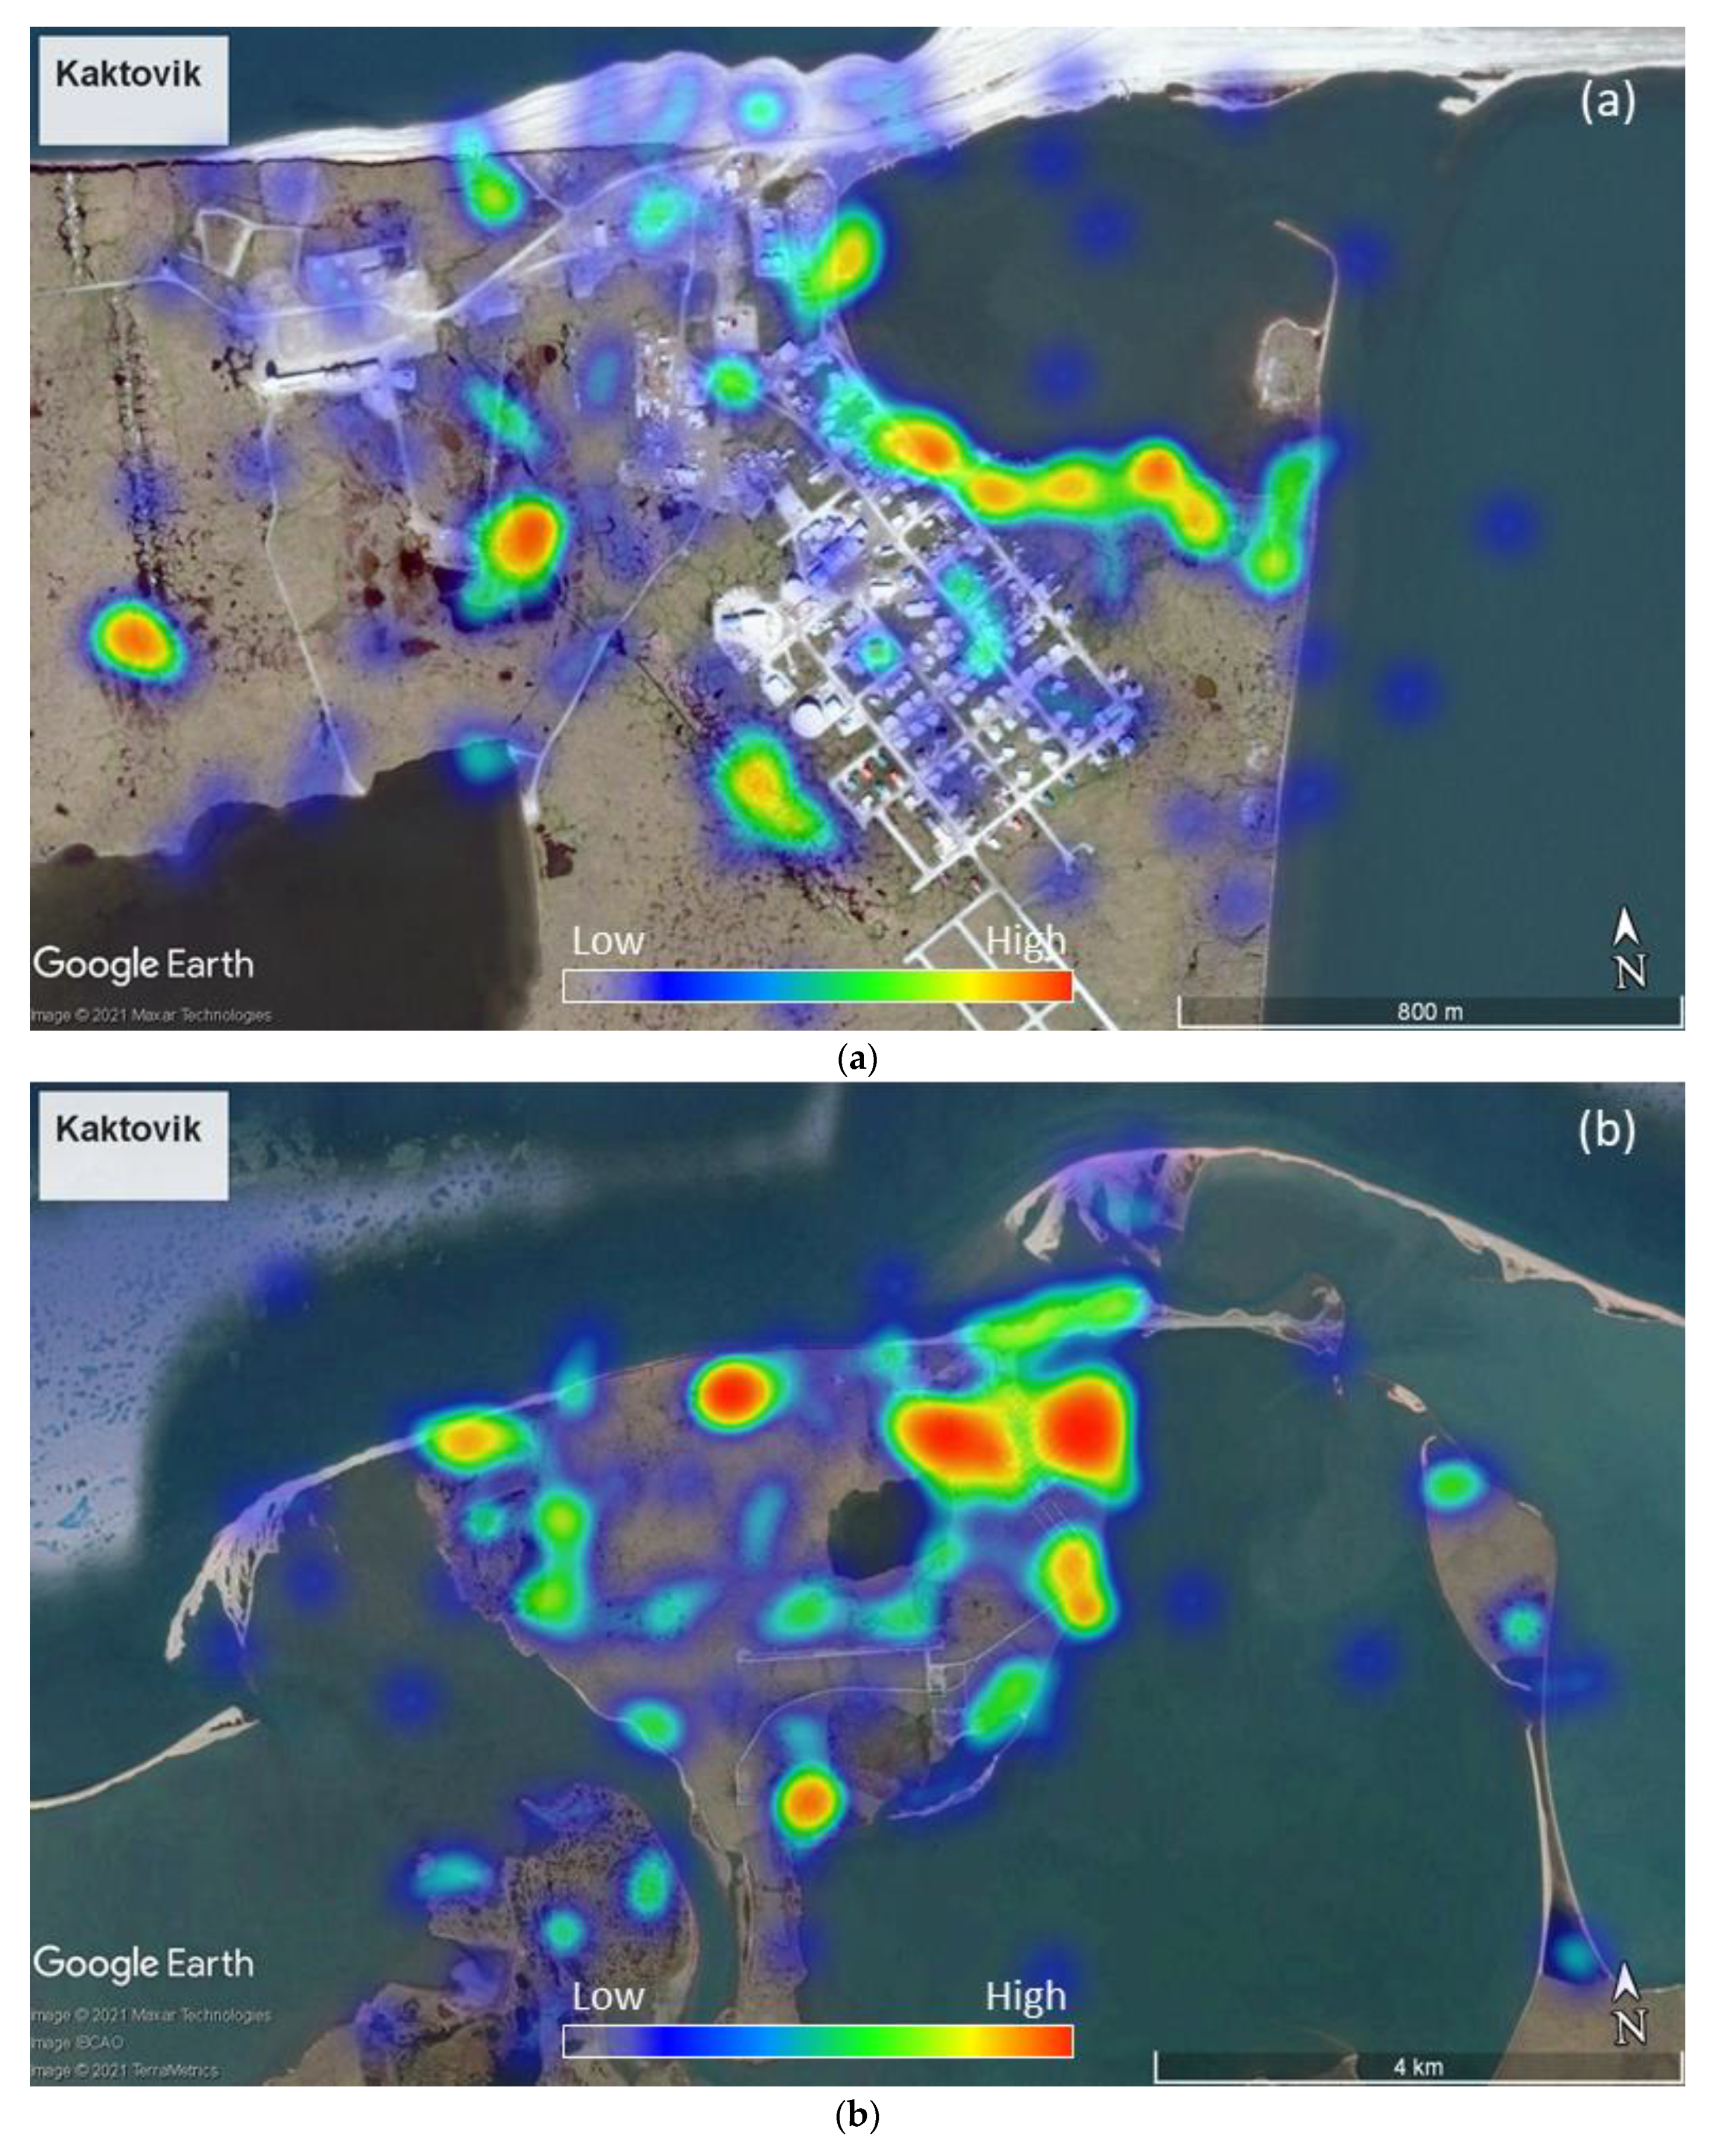
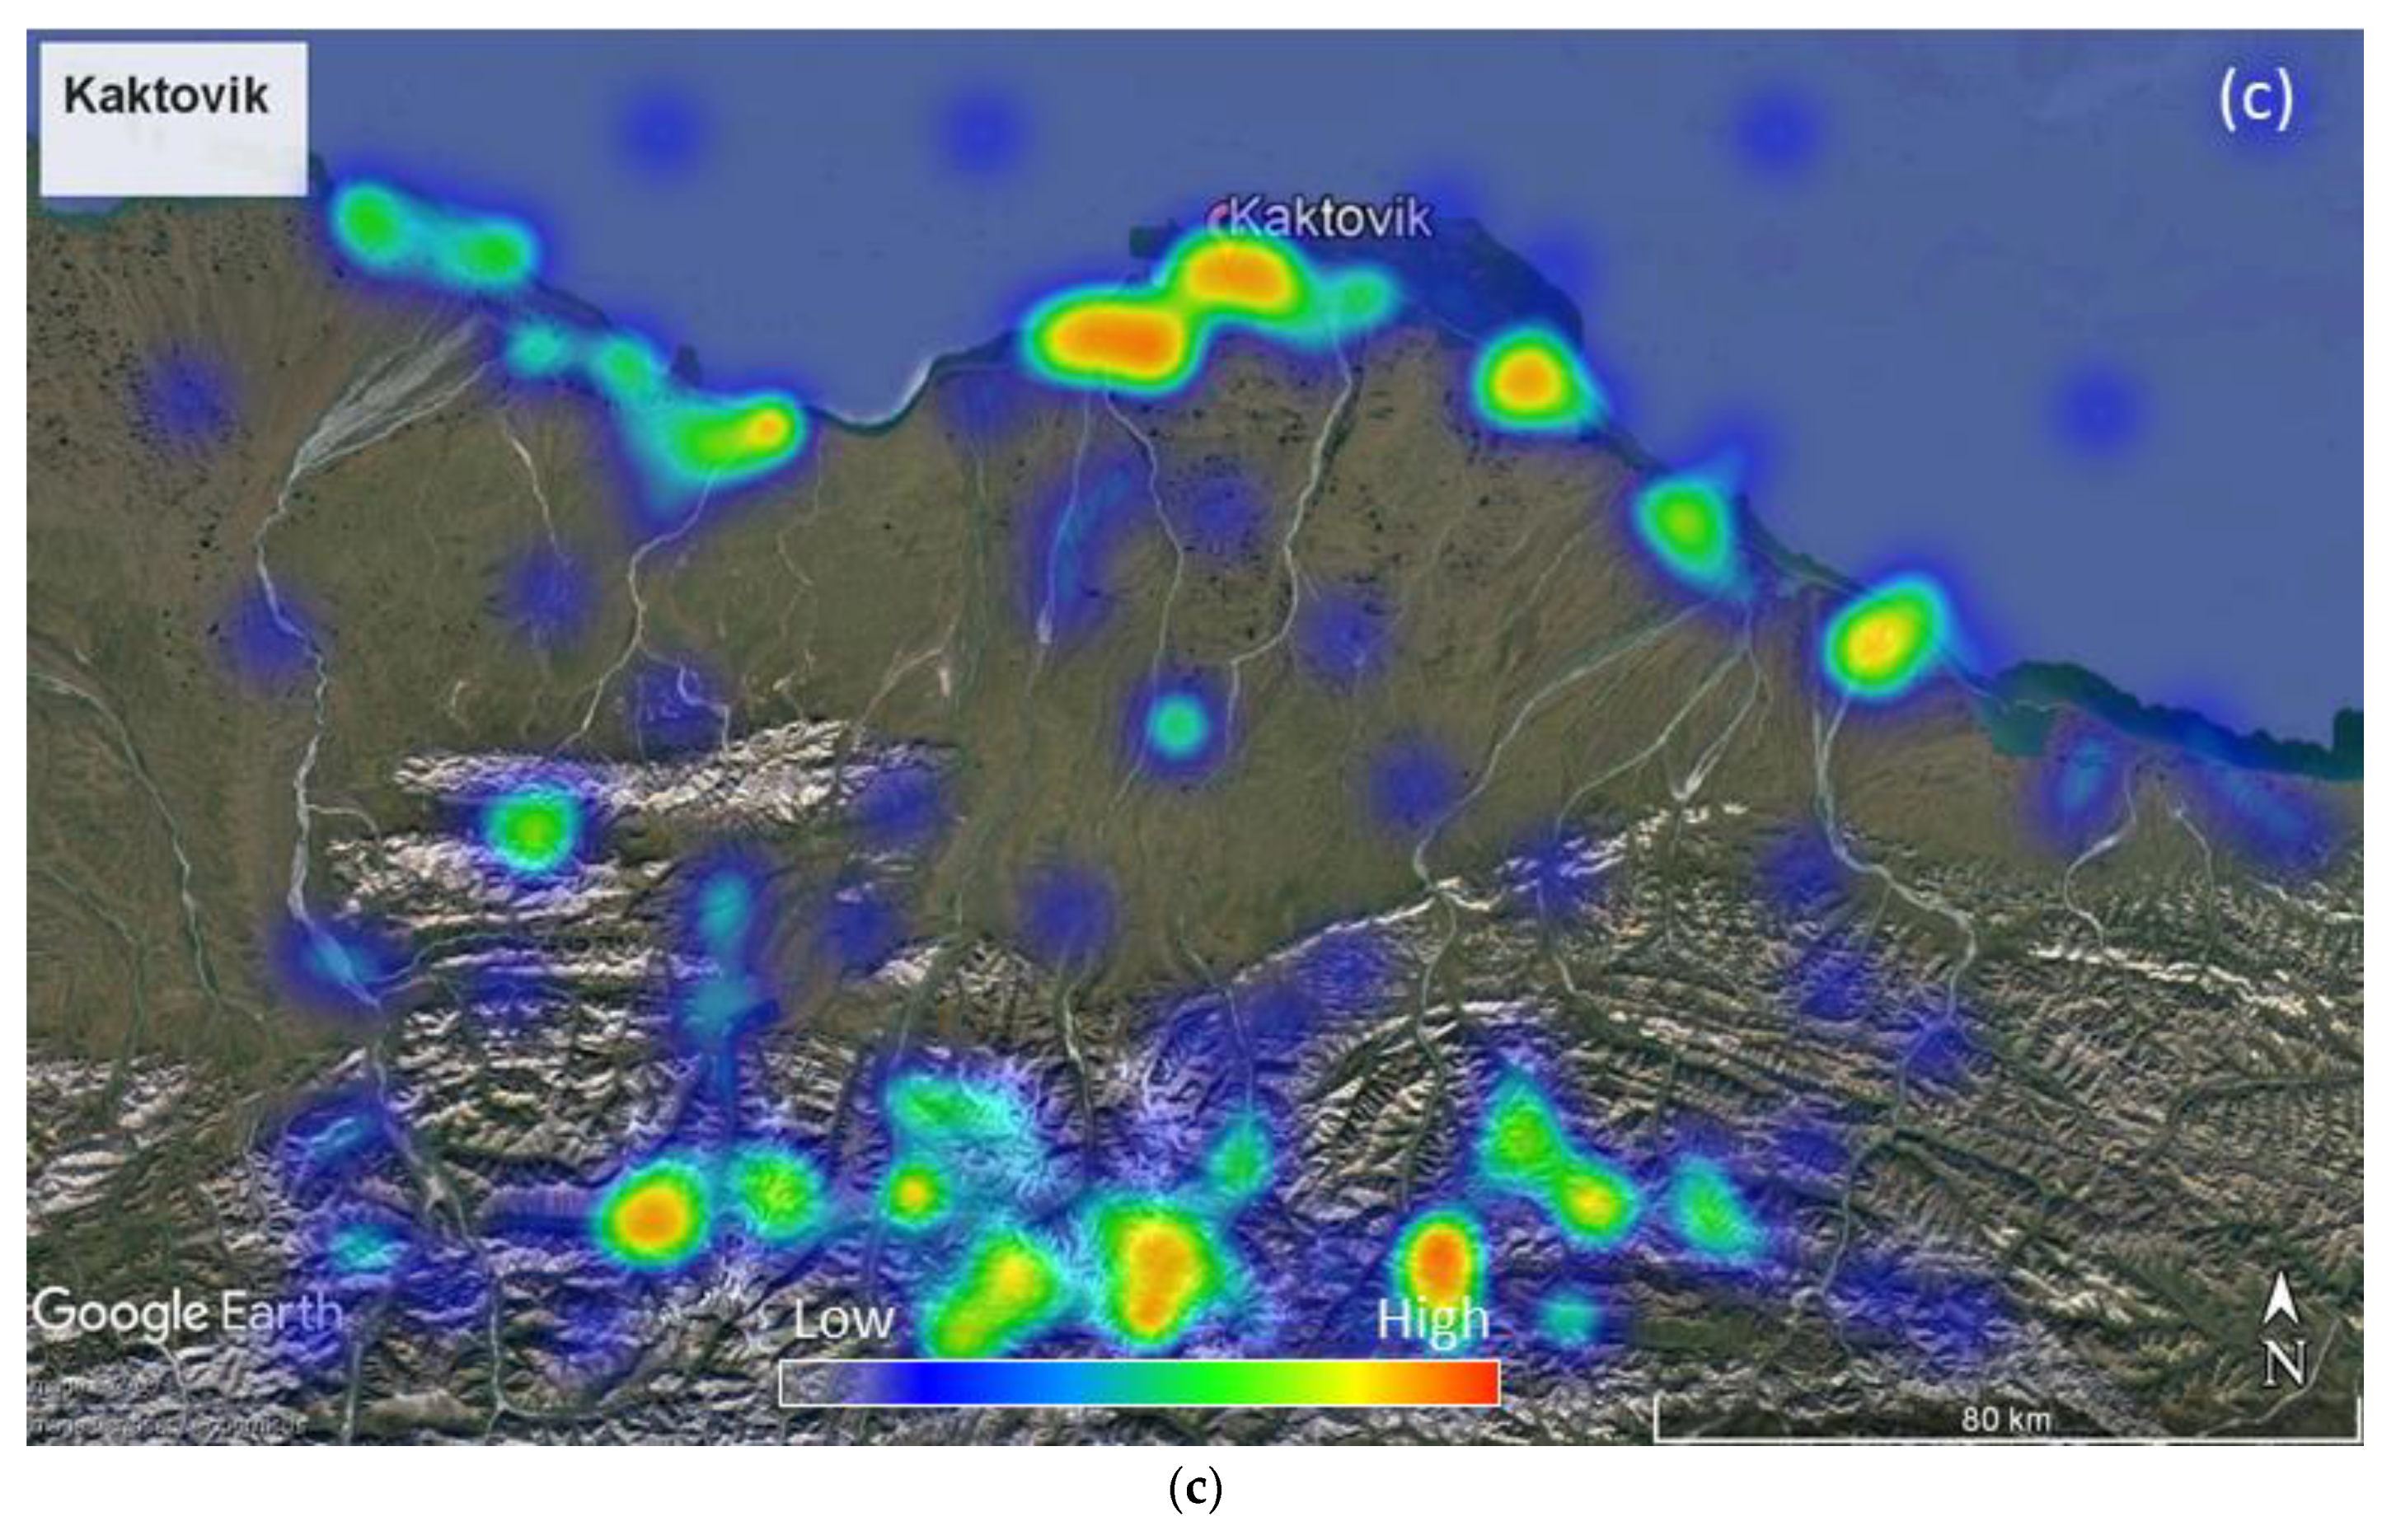
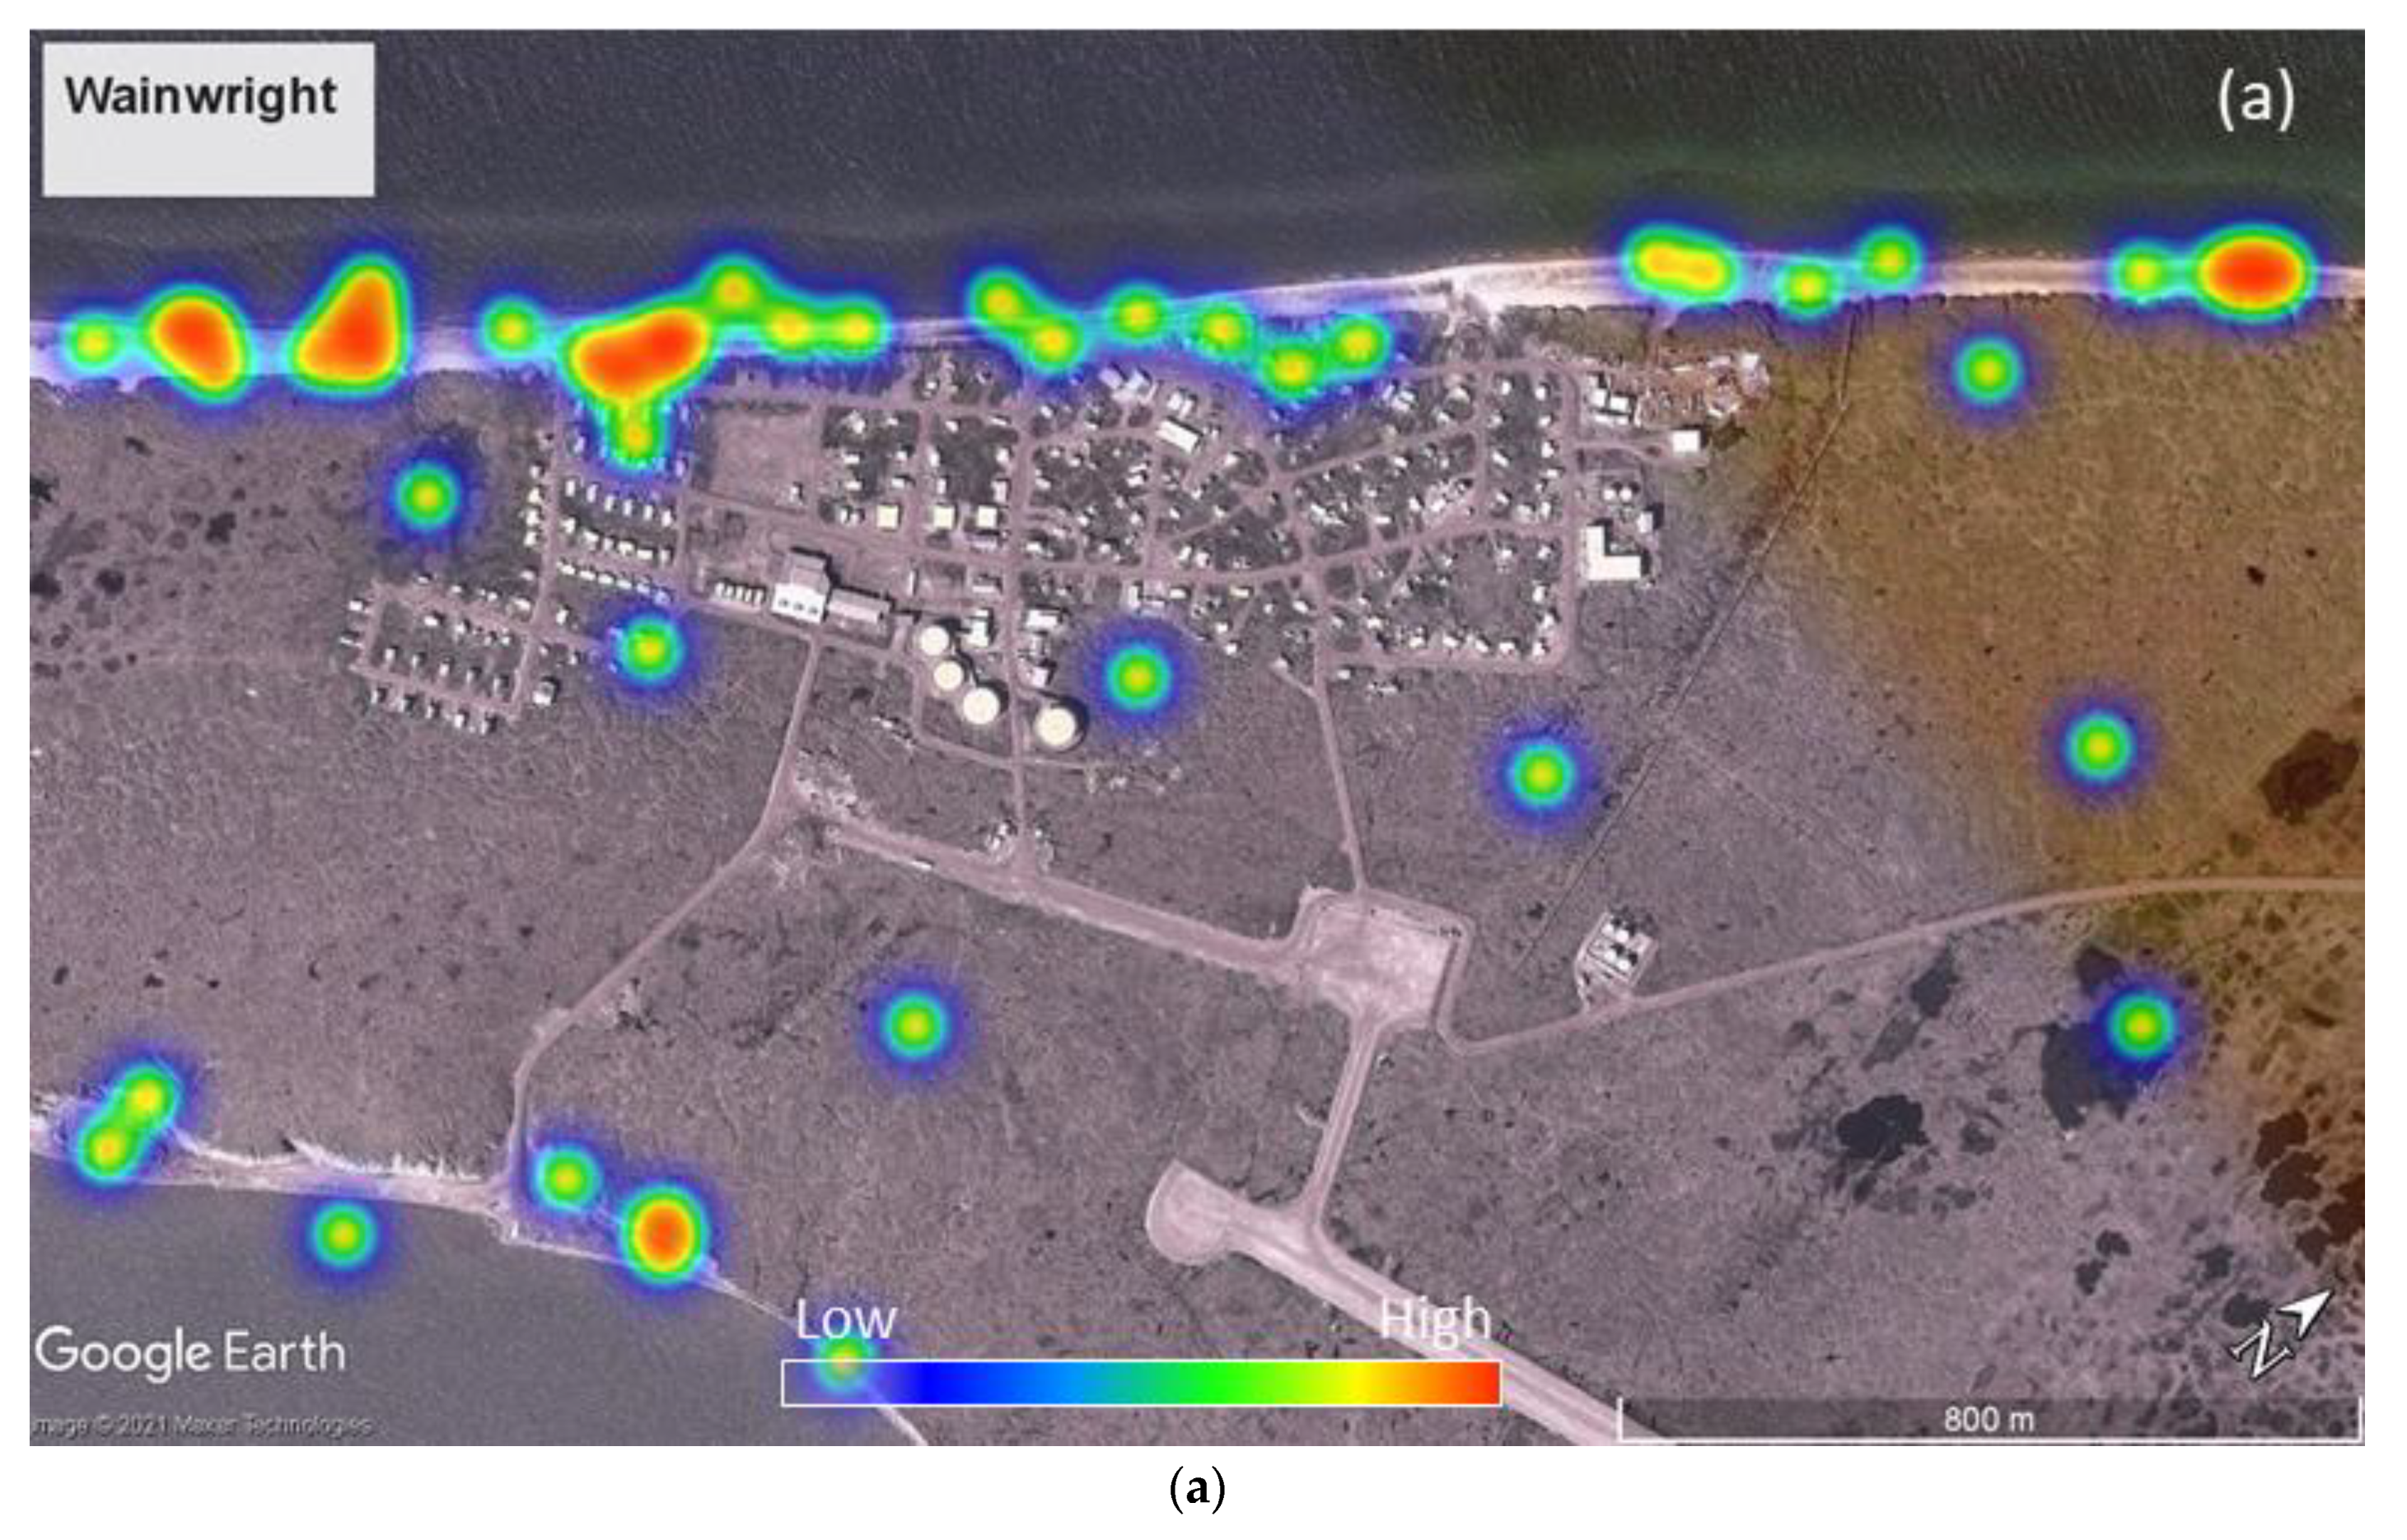
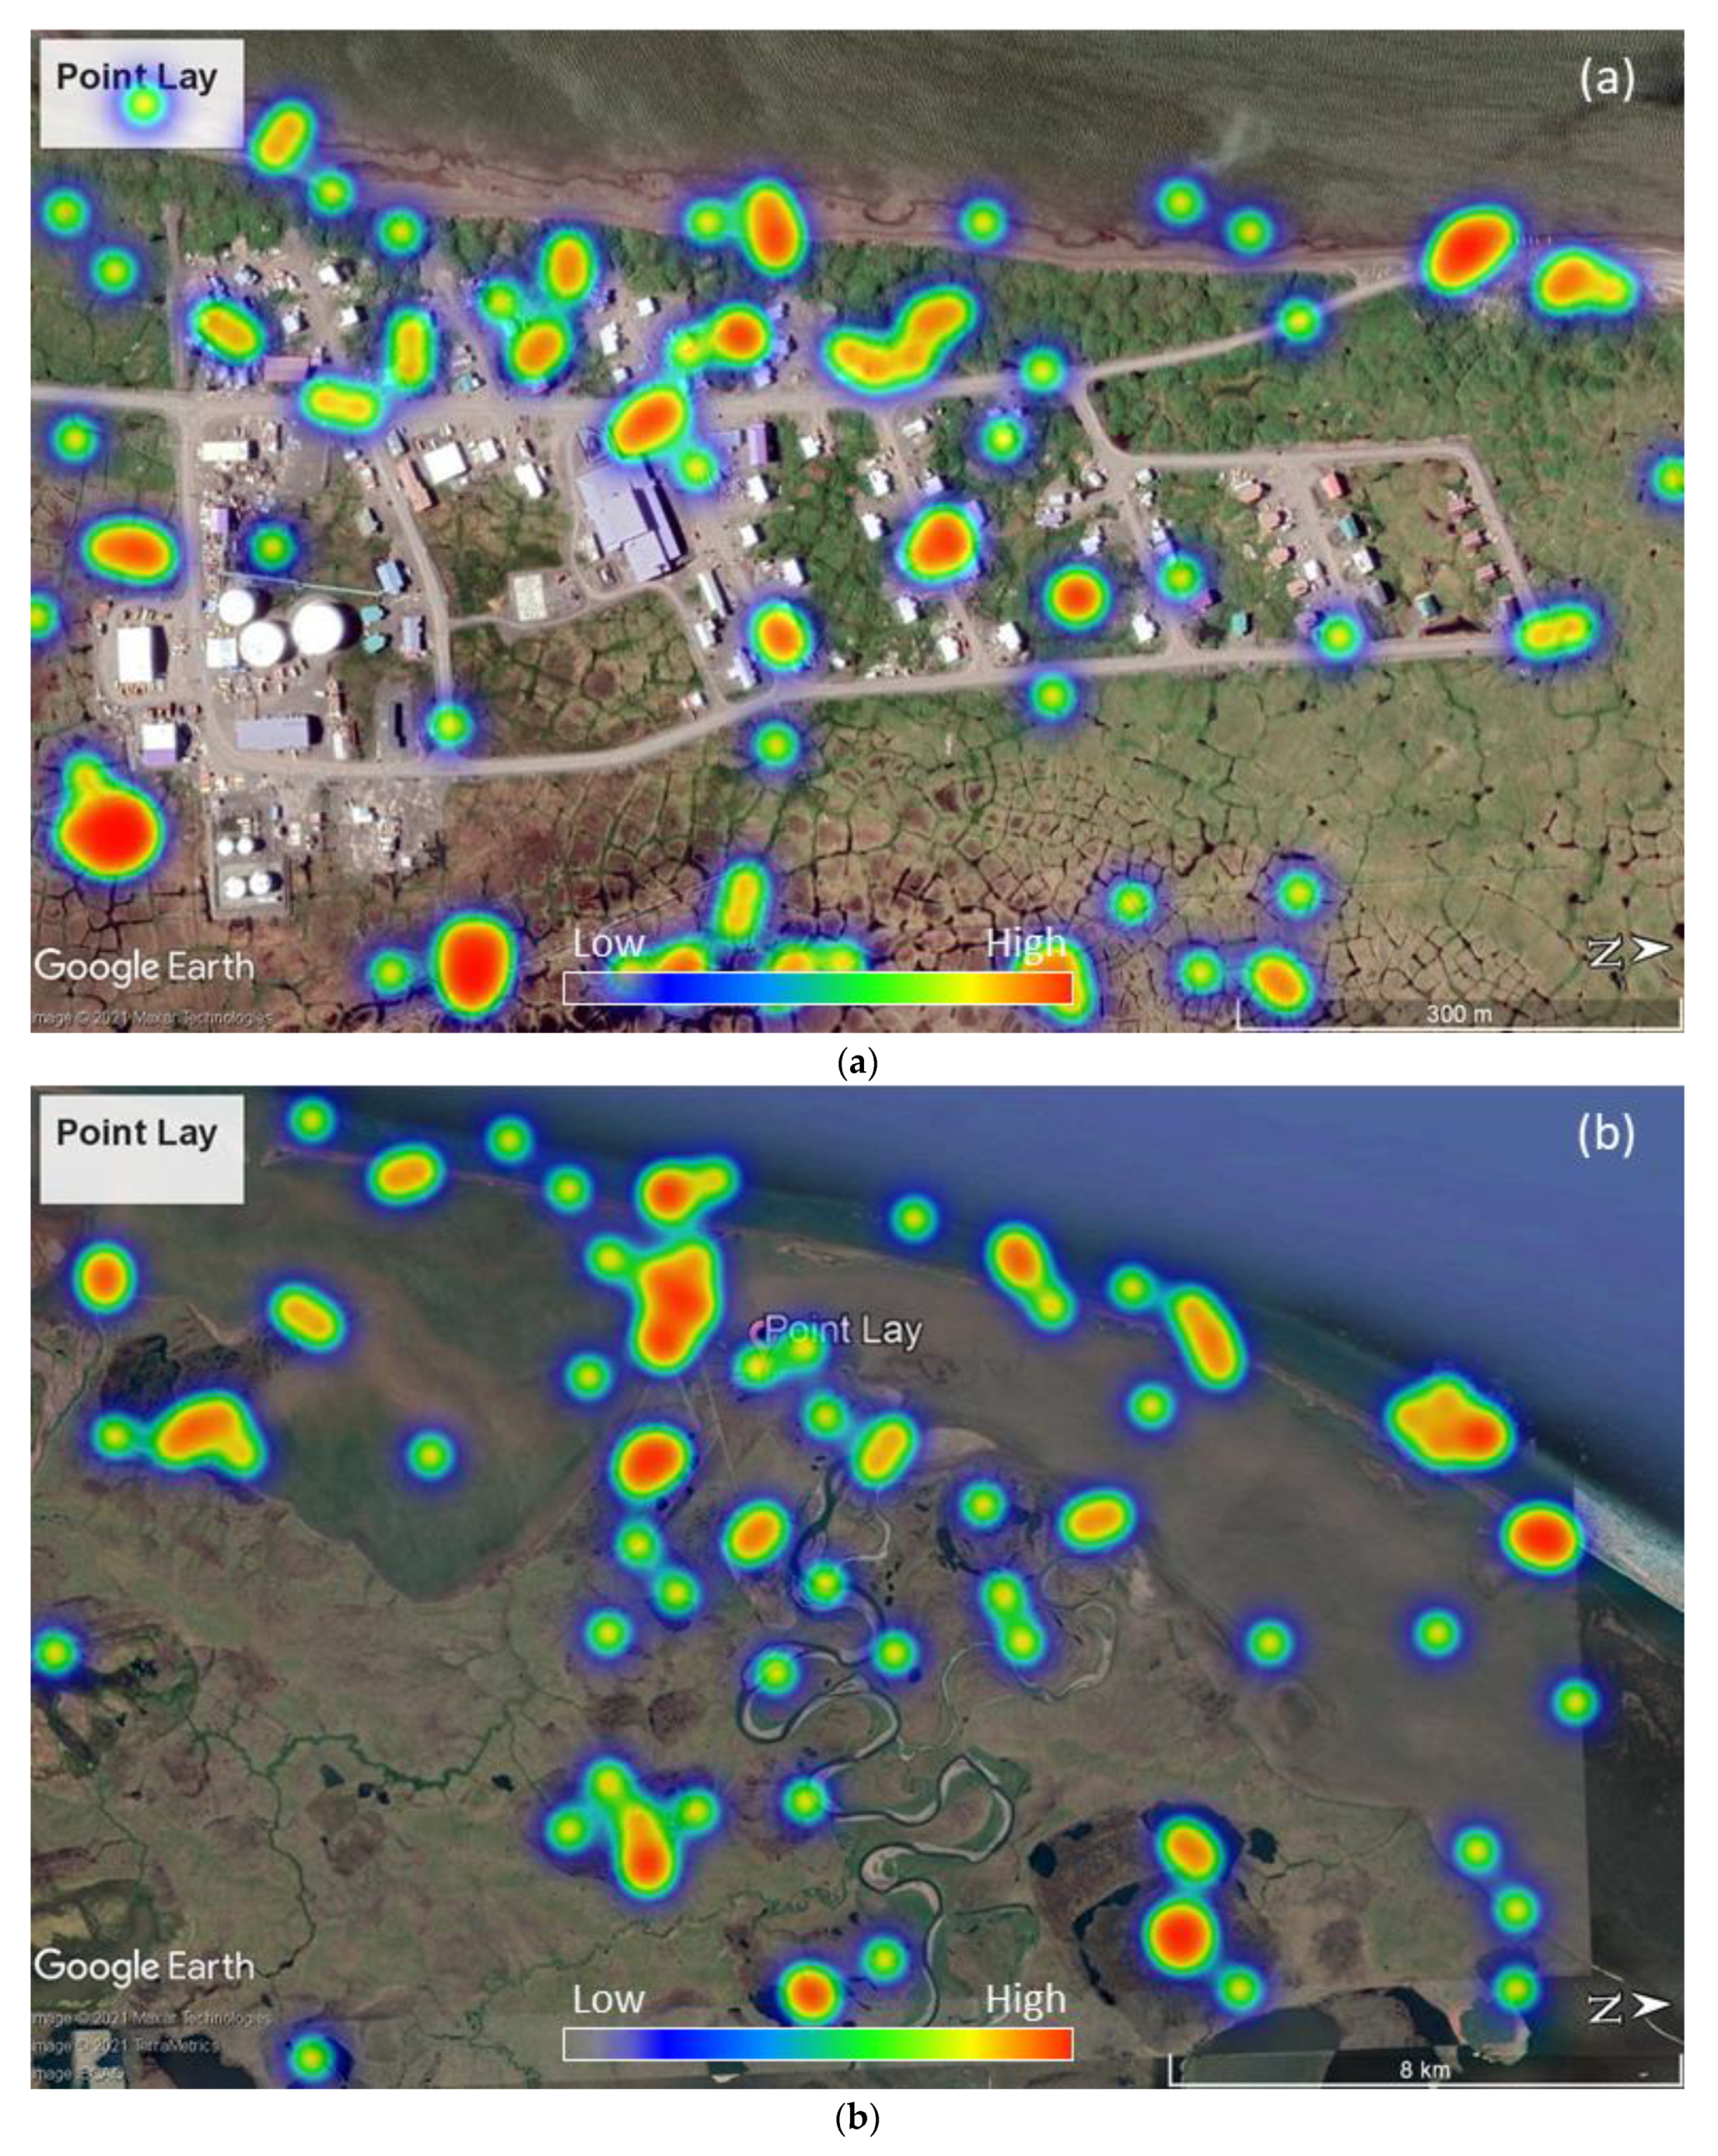
4.3. Heatmap Visualization of Reported Locations of Permafrost Thaw and Coastal Erosion
4.4. Planning in the Events of Continued Permafrost Degradation and Coastal Erosions
5. Discussions
6. Conclusions
- Surface water ponding, ground collapse, and differential settlement are three types of permafrost-thaw-induced changes most reported by the participants.
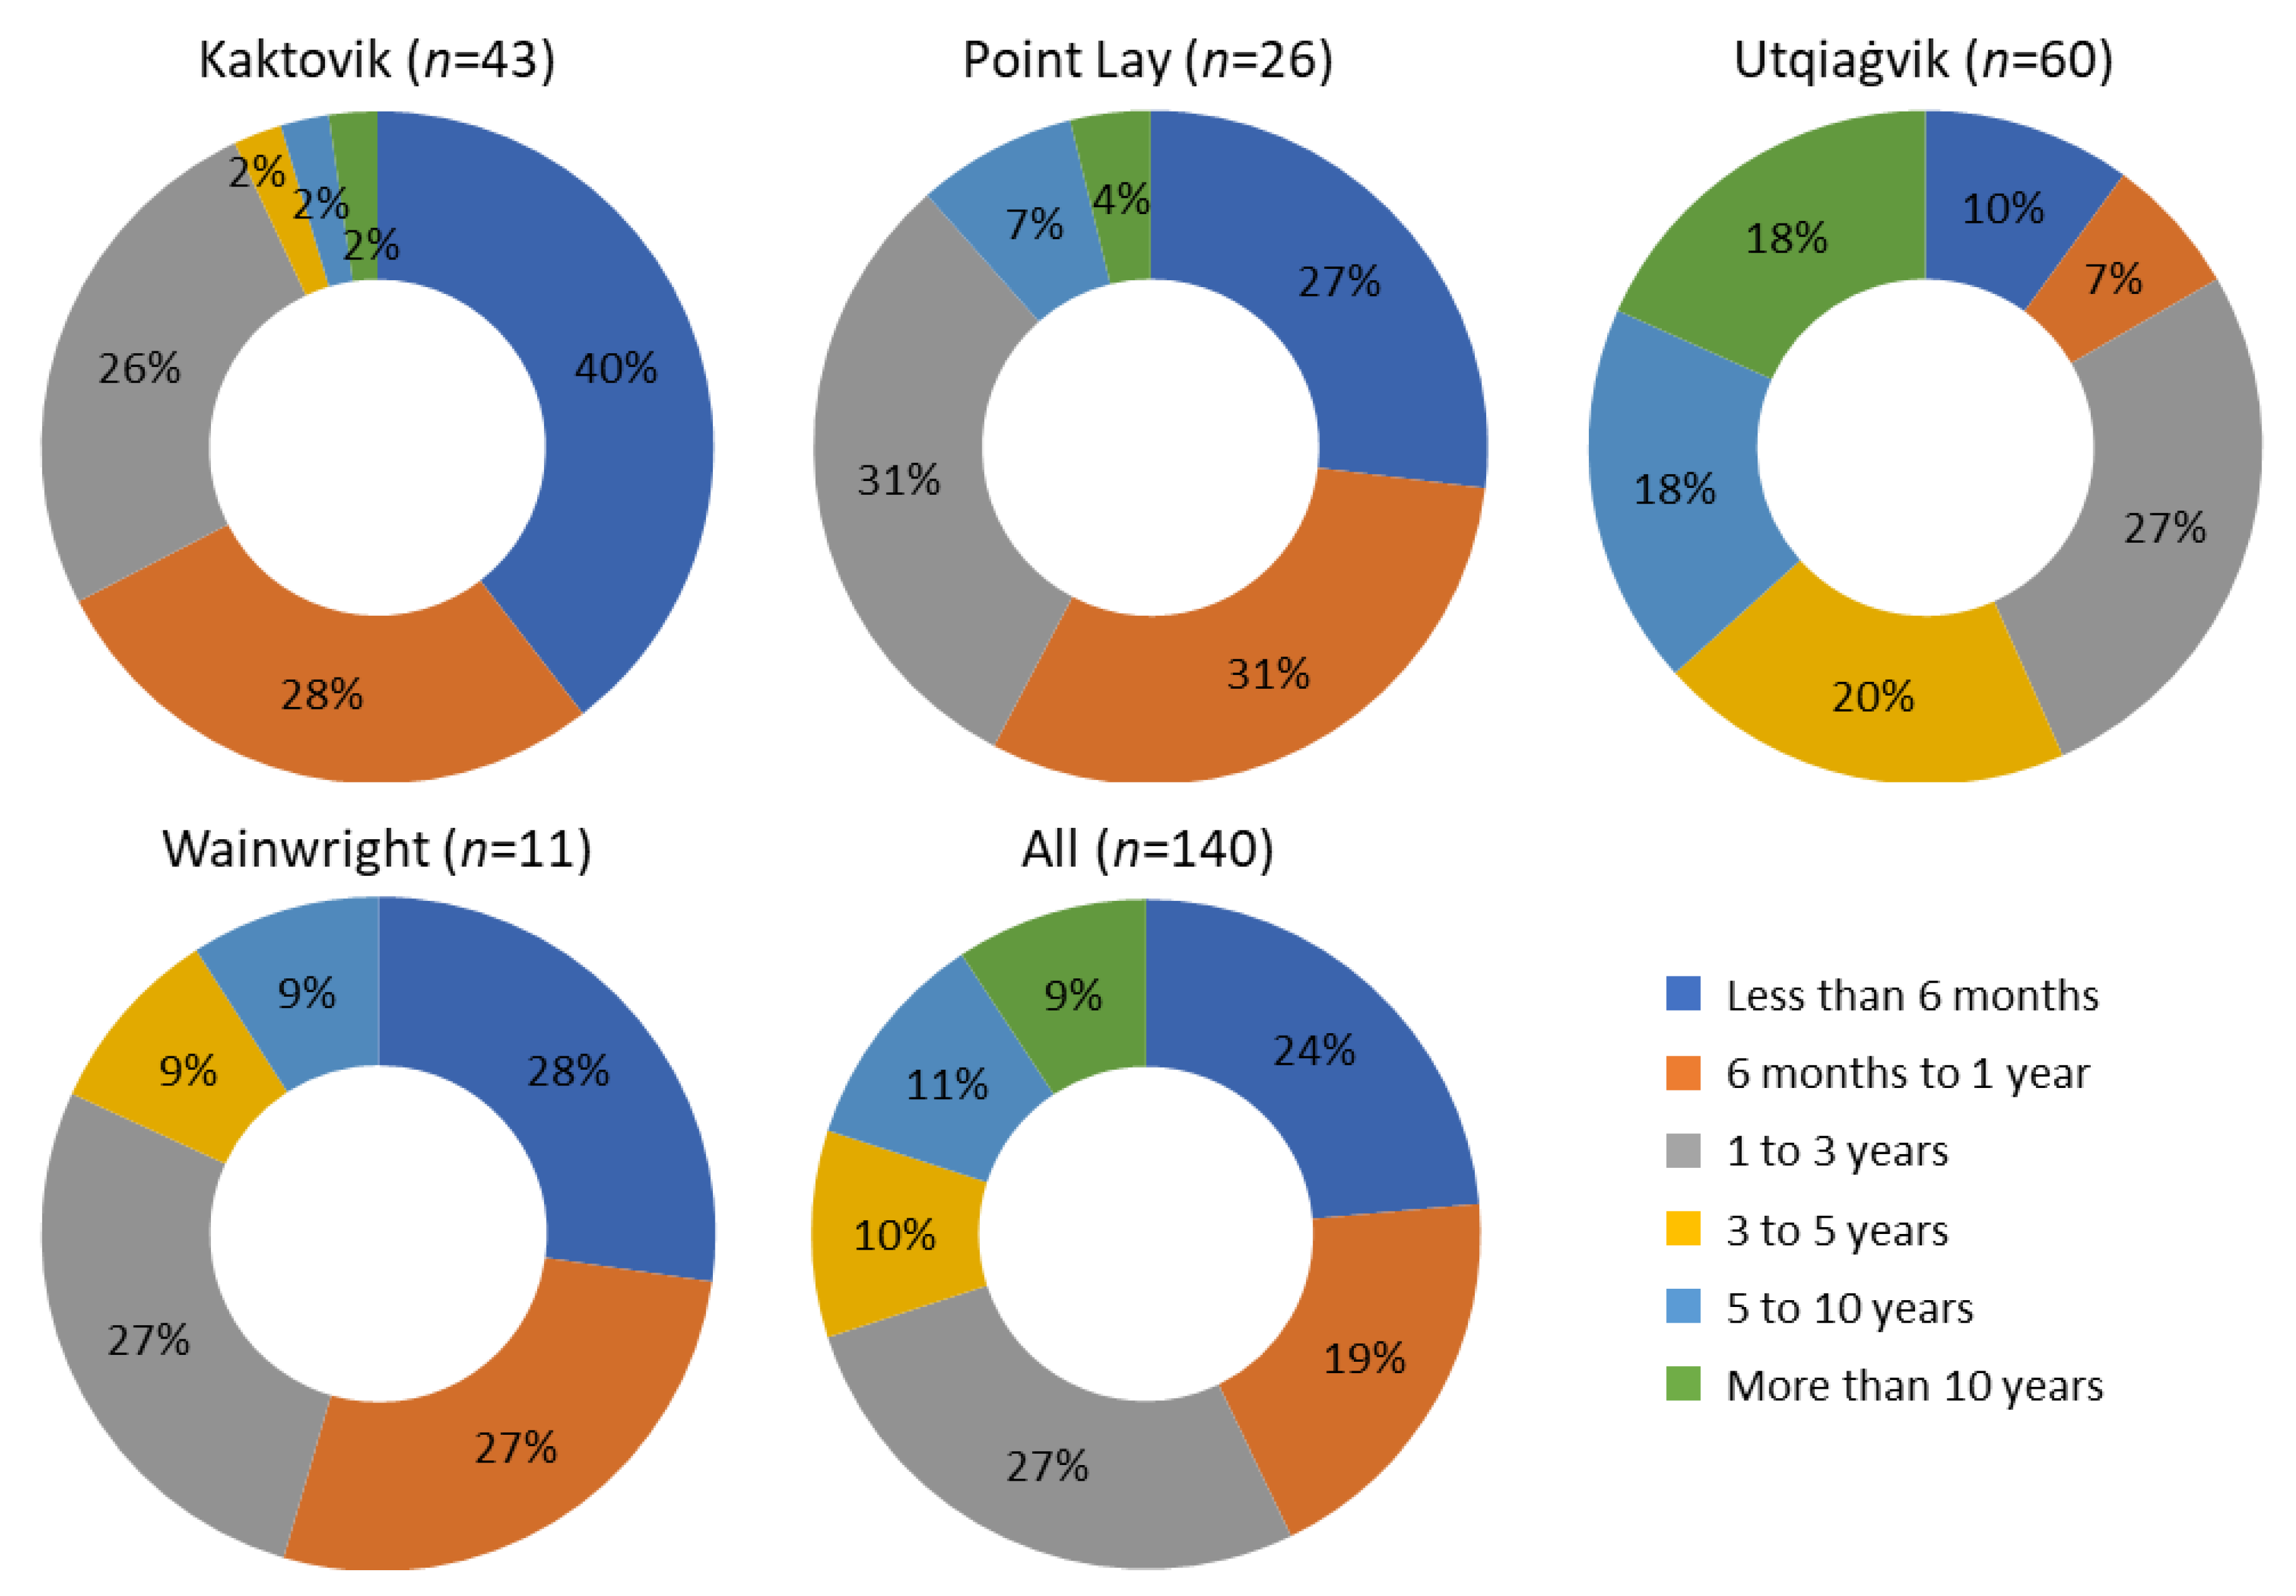
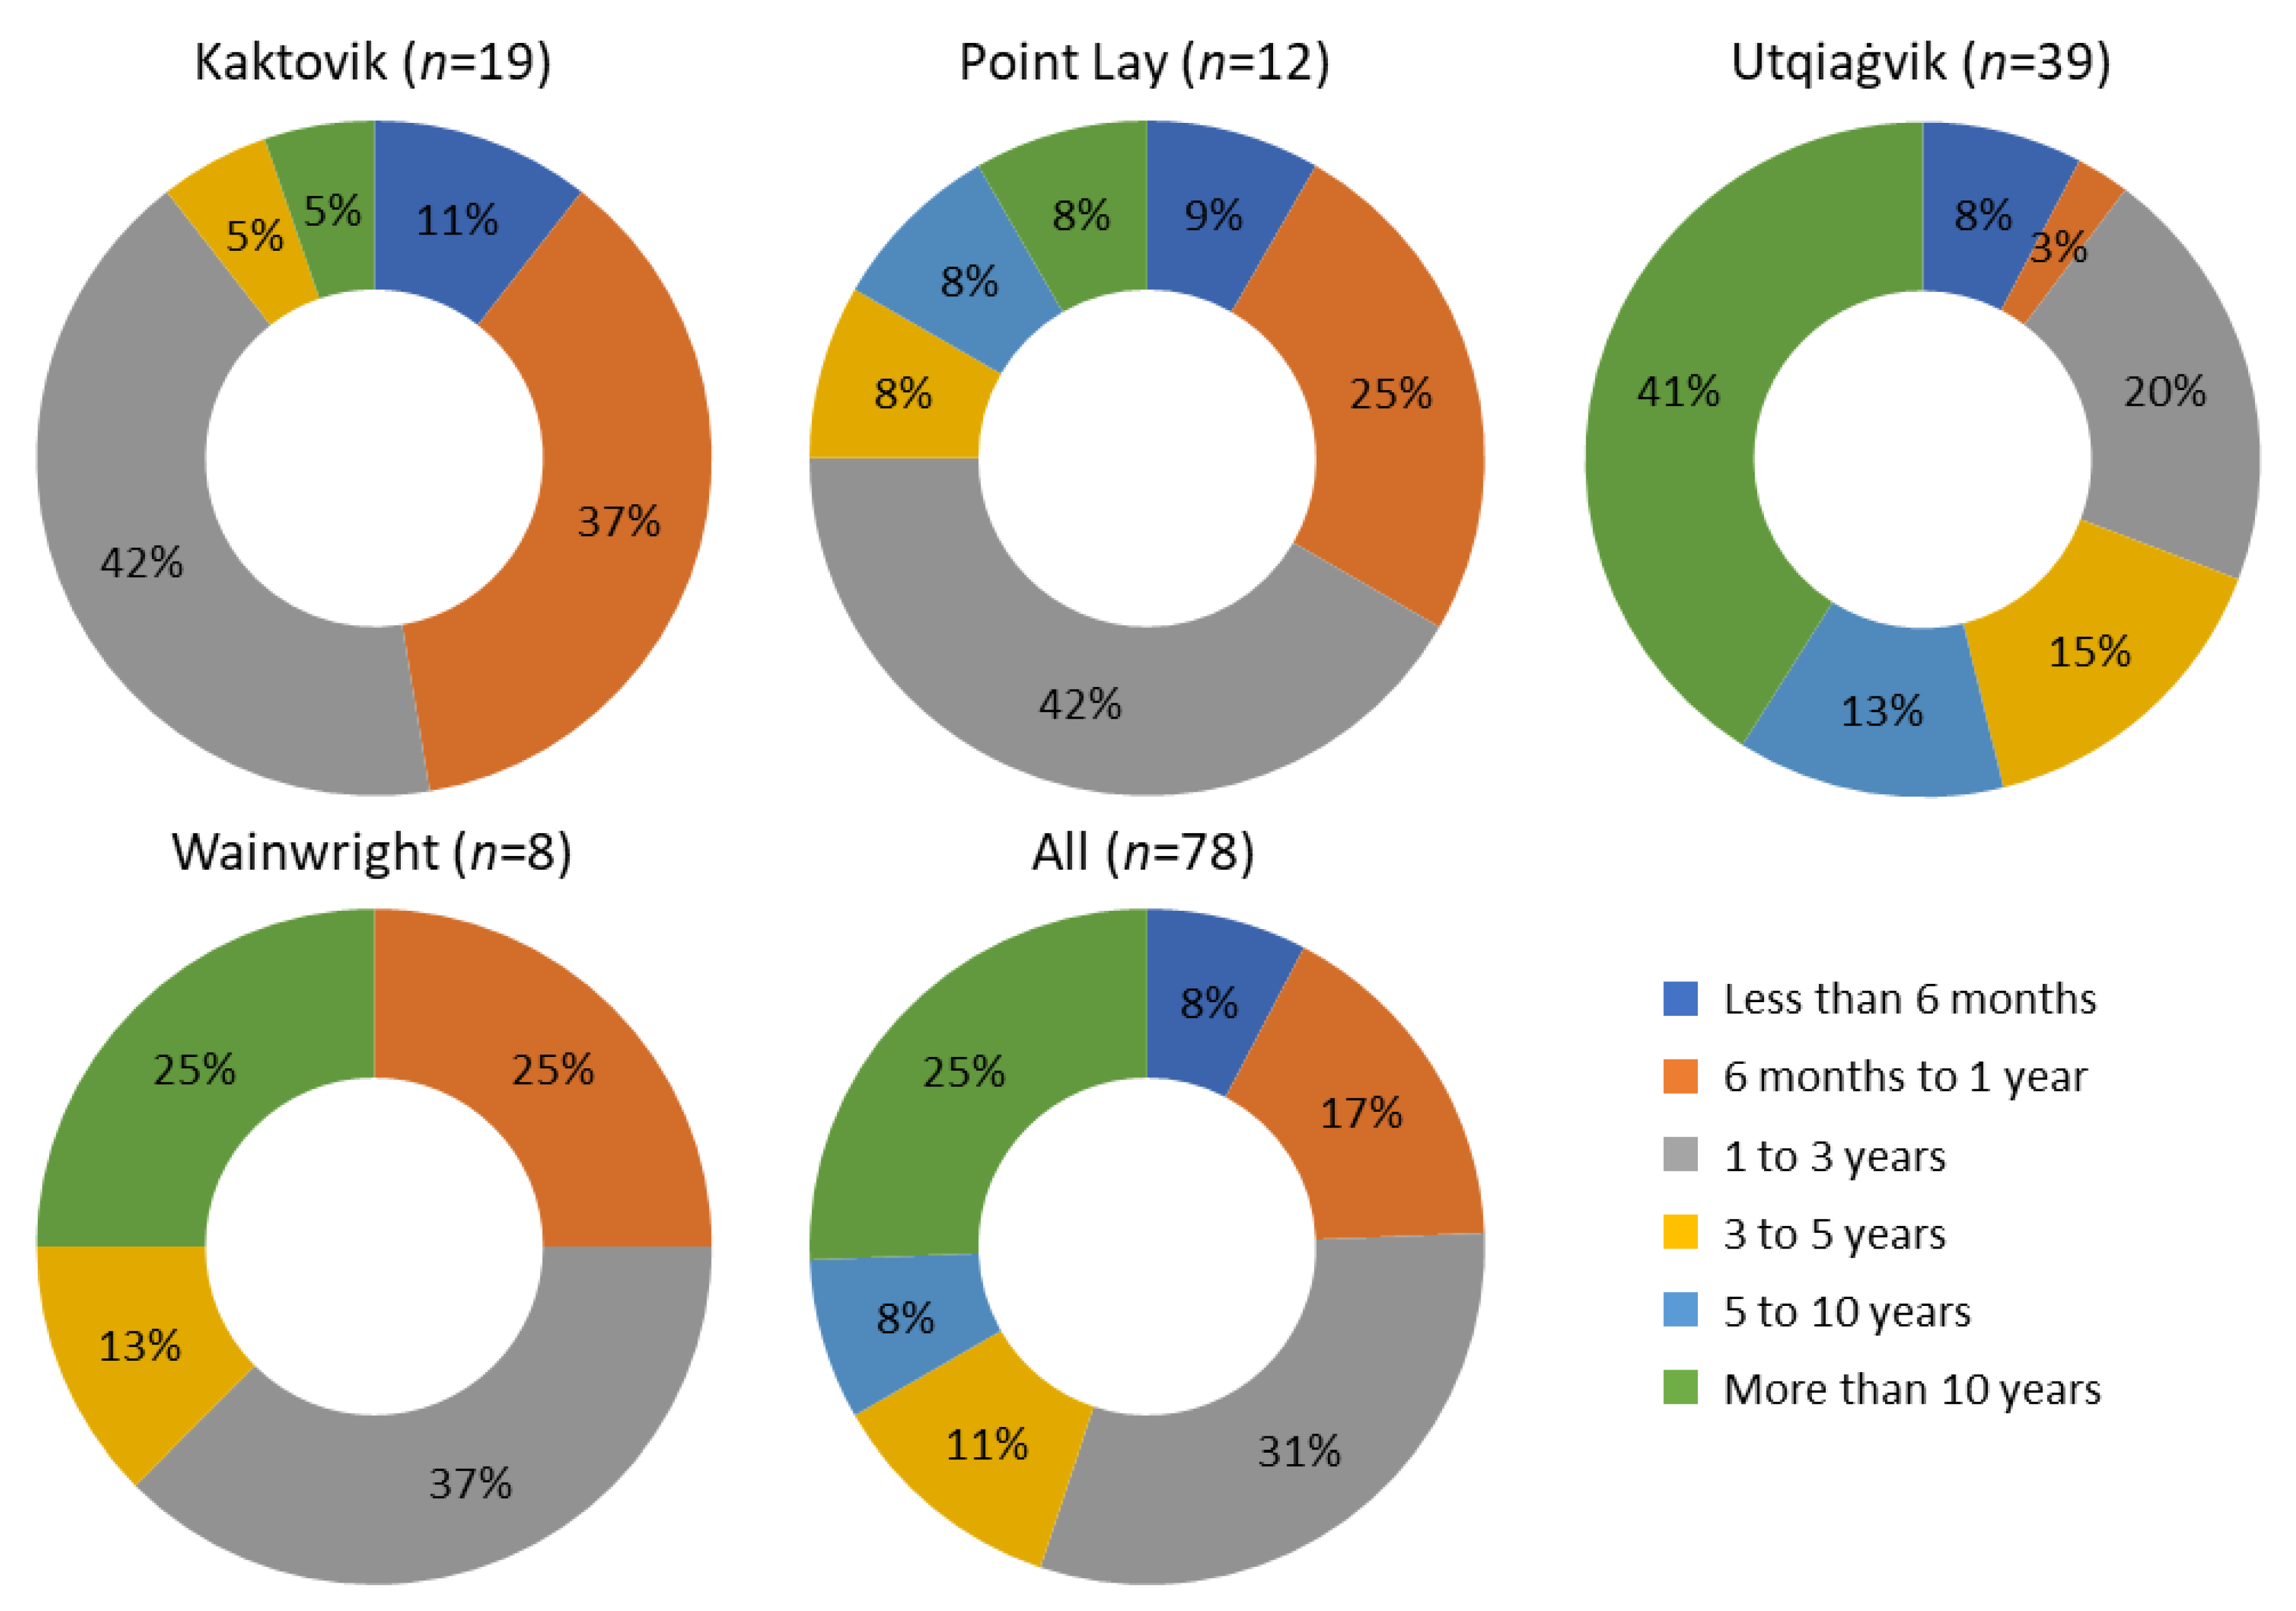
- Most participants have observed shorter periods (i.e., <0.5 year; 0.5–1 year; 1–3 years) of permafrost thaw but longer periods (i.e., 1–3 years; >10 years) of coastal erosion in their communities, indicating coastal erosion has been happening for a longer period than permafrost thaw and there is increased awareness of permafrost degradation in recent years.
- Houses are the most reported type of infrastructure affected by both permafrost thaw and coastal erosion.
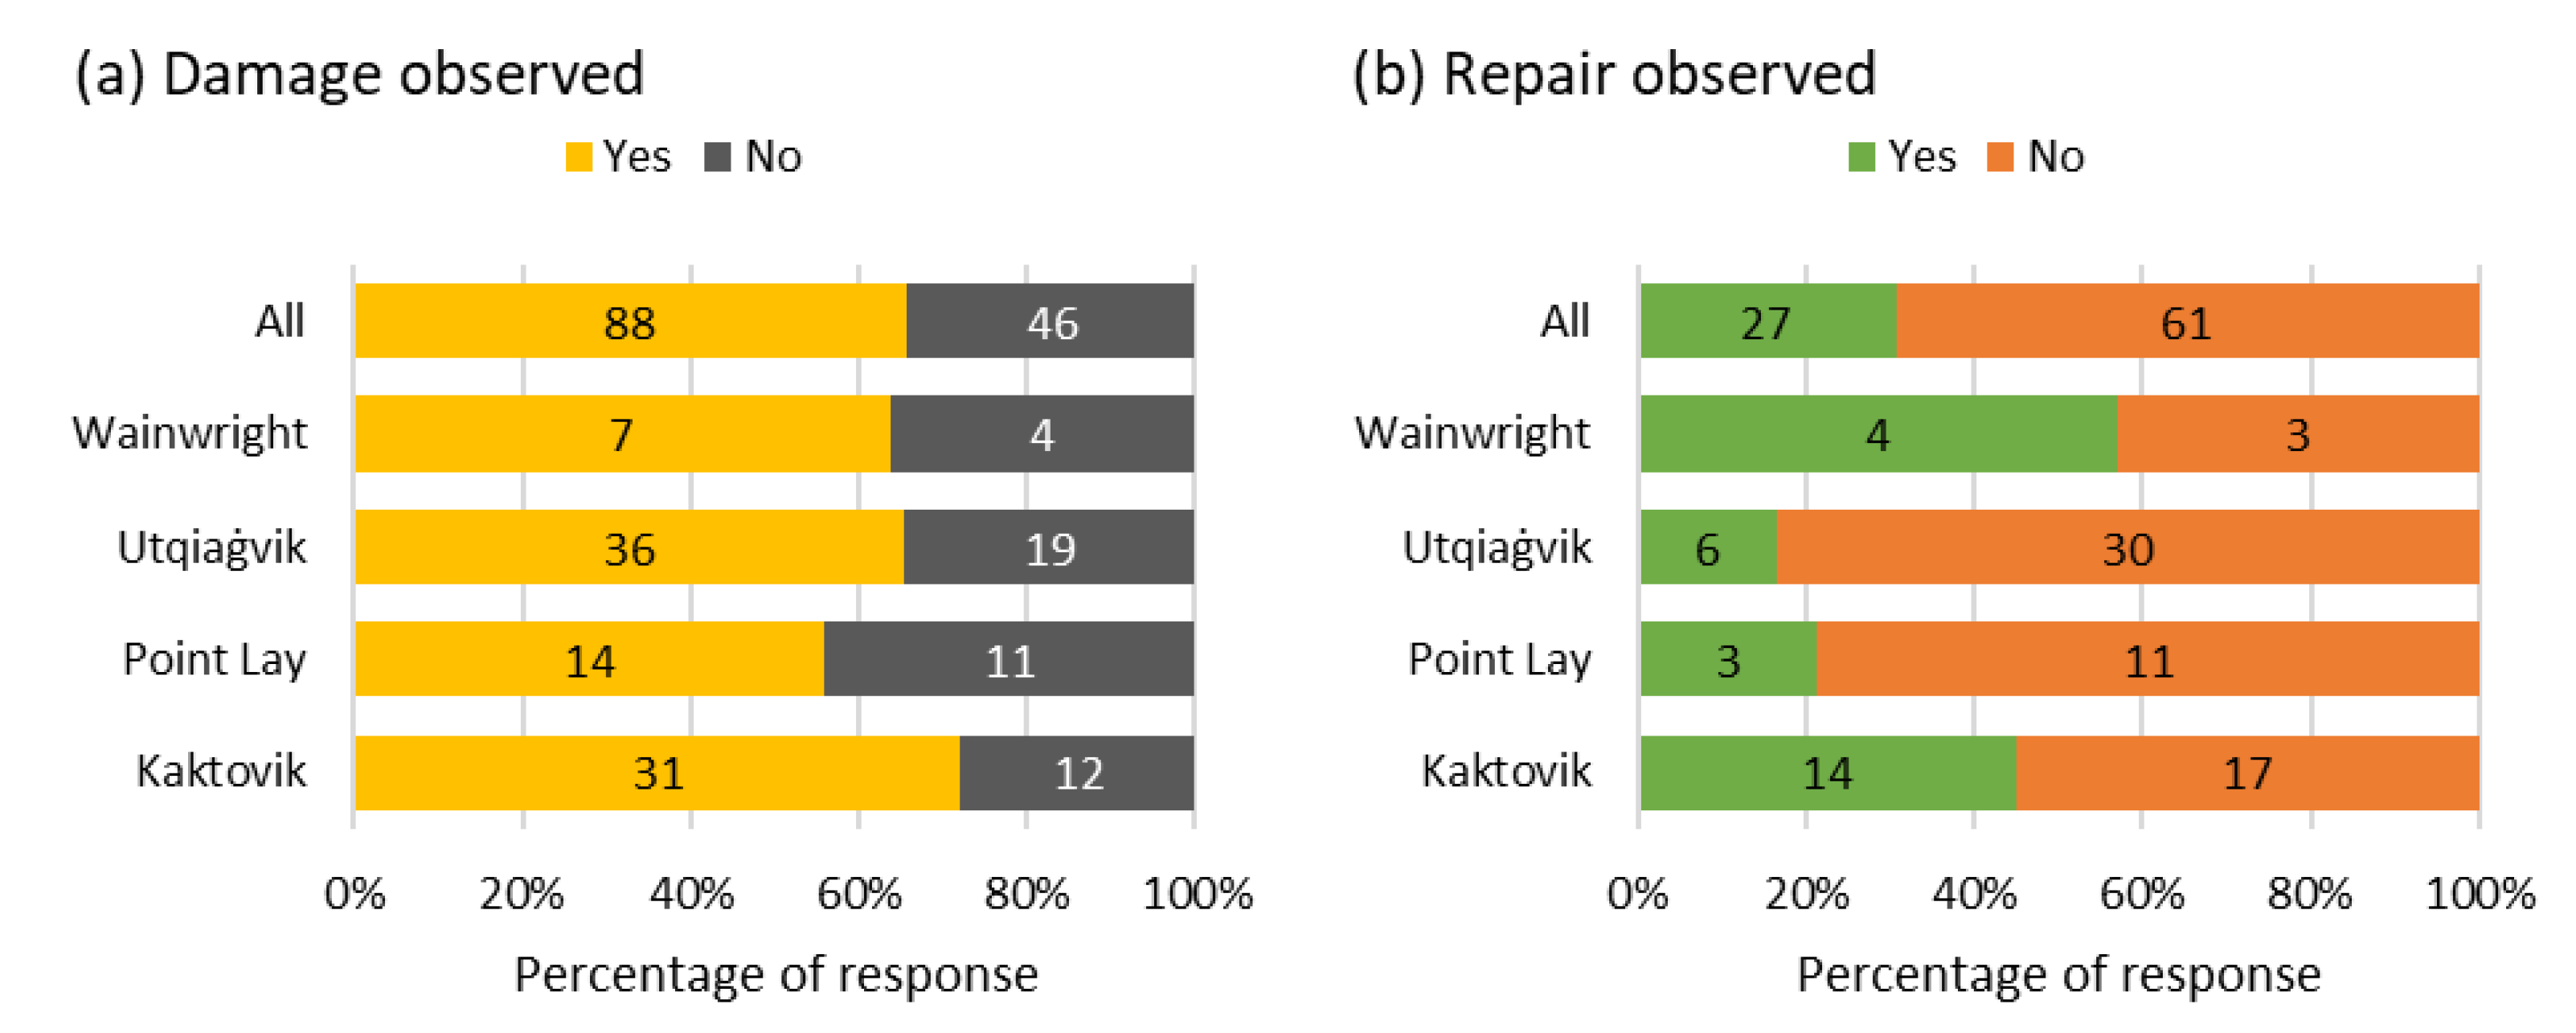
- Wall cracking and house tilting are two types of damages to residential buildings most reported by survey participants.
- 66% of the participants reported that they have seen damages to residential buildings, but only 31% of them have seen repair to the damages.
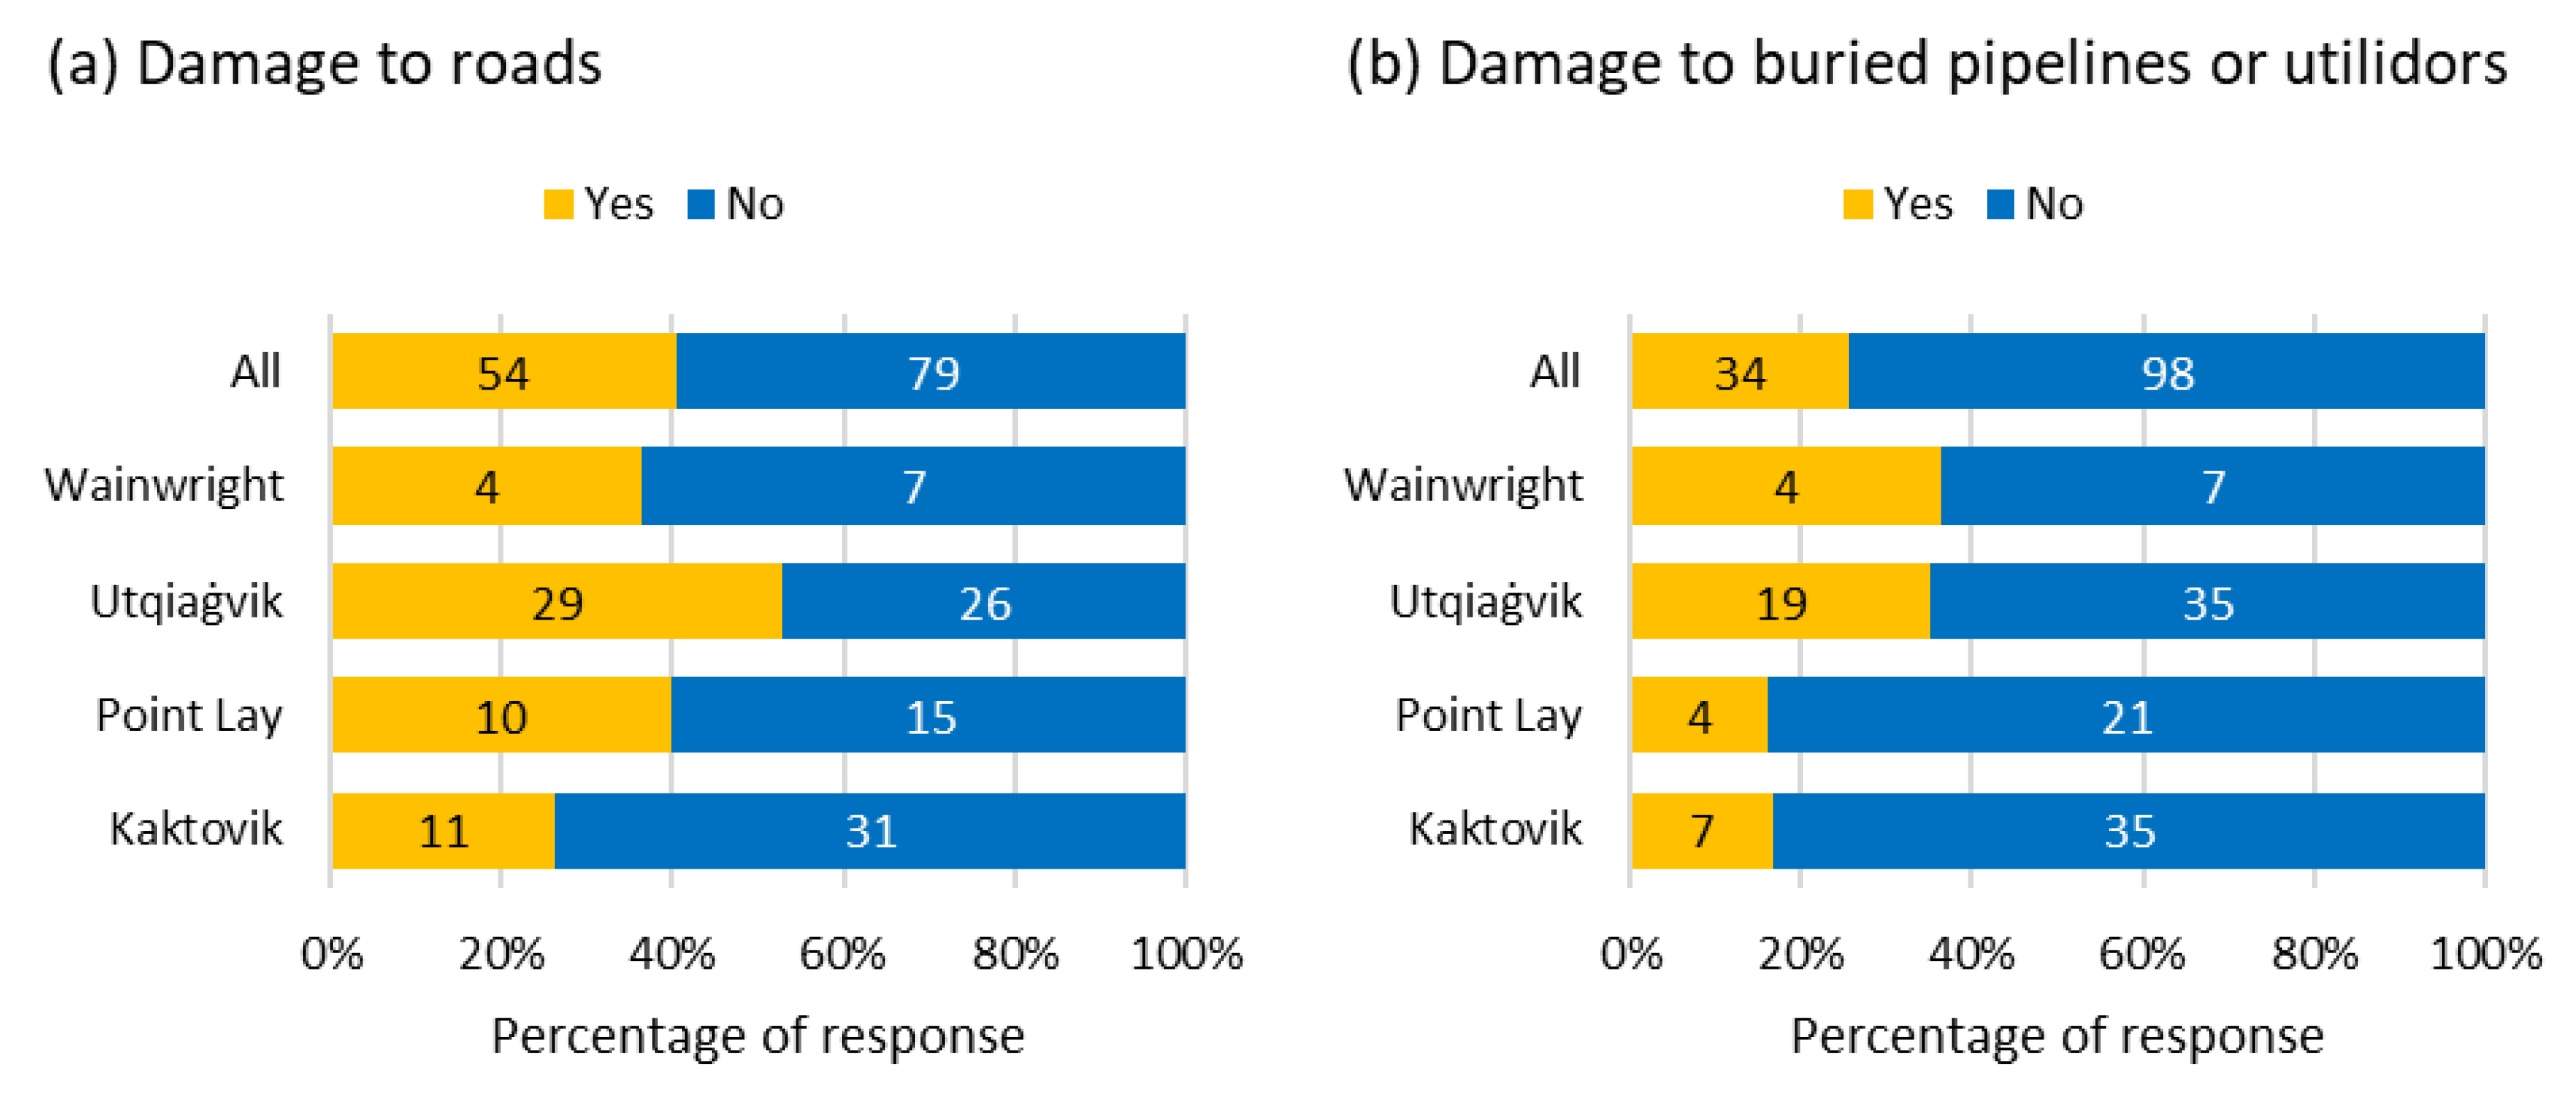
- 41% of the participants reported that they have seen damages to roads, while 26% of them have seen damages to buried pipelines and utilidors. There are more reported cases of damage to roads than to buried pipelines and utilidors.
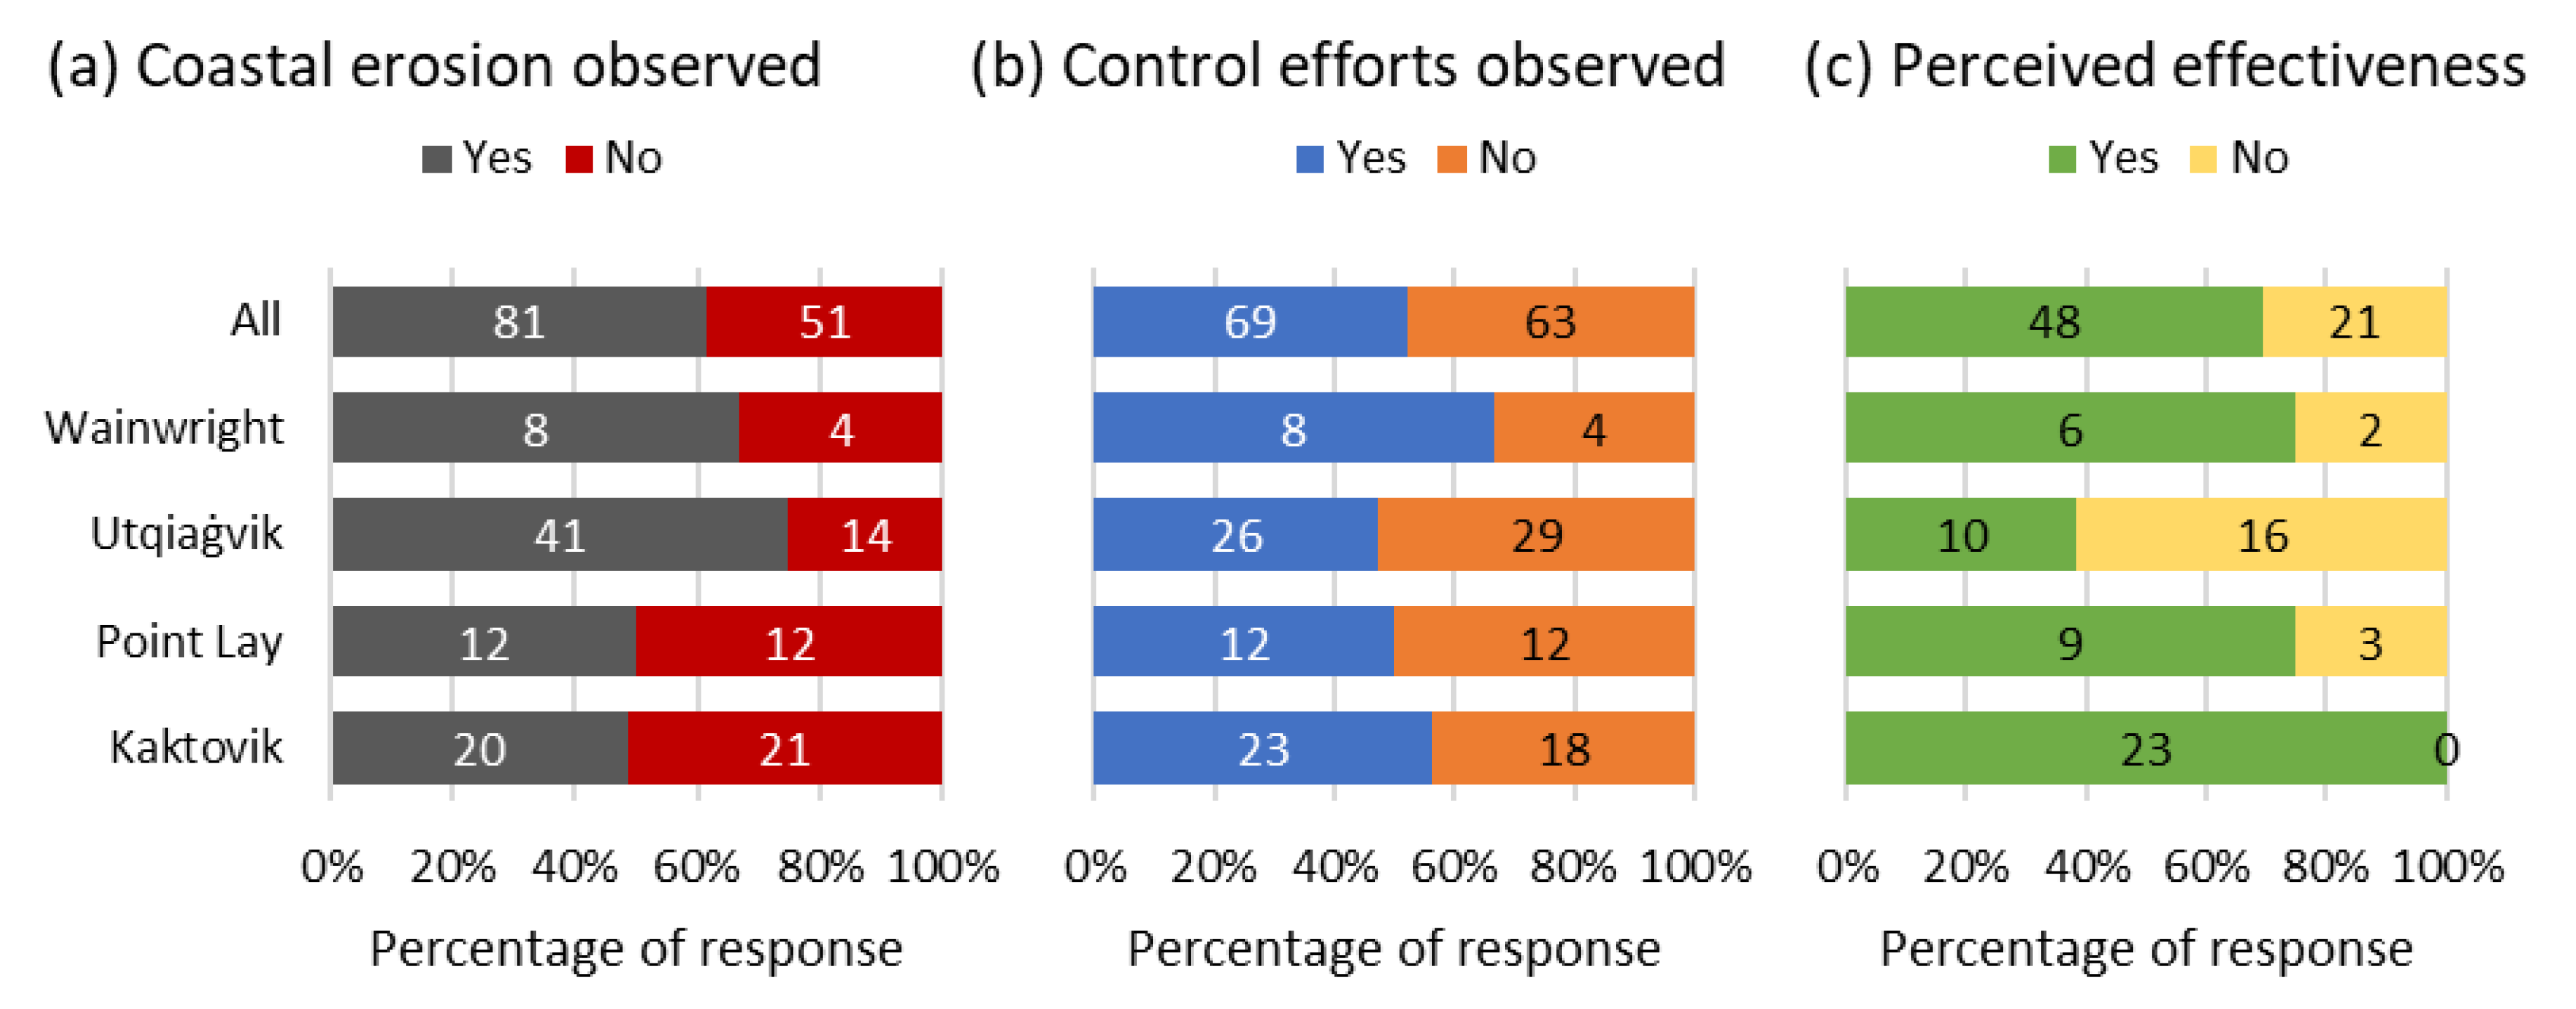
- 61% of the survey participants reported observations of coastal erosion. 52% of the survey participants reported that measures have been implemented to control coastal erosion, but only 70% considered the implemented measures effective. The results indicate that not all areas affected by coastal erosion have the issues mitigated and some implemented measures are ineffective.
- Survey participants deemed the information in the following five aspects as crucial for their community planning for continued climate warming: natural environment, built environment, cultural awareness, education and communication, and policy.
Supplementary Materials
Author Contributions
Funding
Institutional Review Board Statement
Informed Consent Statement
Data Availability Statement
Acknowledgments
Conflicts of Interest
References
- Box, J.E.; Colgan, W.T.; Christensen, T.R.; Schmidt, N.M.; Lund, M.; Parmentier, F.-J.W.; Brown, R.; Bhatt, U.S.; Euskirchen, E.S.; Romanovsky, V.E.; et al. Key indicators of Arctic climate change: 1971–2017. Environ. Res. Lett. 2019, 14, 045010. [Google Scholar] [CrossRef]
- Romanovsky, V.; Isaksen, K.; Drozdov, D.; Anisimov, O.; Instanes, A.; Leibman, M.; McGuire, A.D.; Shiklomanov, N.; Smith, S.; Walker, D. Changing permafrost and its impacts. In Snow, Water, Ice and Permafrost in the Arctic (SWIPA) 2017; Arctic, Monitoring and Assessment Programme (AMAP): Oslo, Norway; Narayana Press: Odder, Denmark, 2017; pp. 65–102. [Google Scholar]
- Nicolsky, D.J.; Romanovsky, V.E.; Panda, S.K.; Marchenko, S.; Muskett, R.R. Applicability of the ecosystem type approach to model permafrost dynamics across the Alaska North Slope. J. Geophys. Res. Earth Surf. 2017, 122, 50–75. [Google Scholar] [CrossRef]
- Slater, A.G.; Lawrence, D.M. Diagnosing Present and Future Permafrost from Climate Models. J. Clim. 2013, 26, 5608–5623. [Google Scholar] [CrossRef] [Green Version]
- Overeem, I.; Anderson, R.S.; Wobus, C.W.; Clow, G.D.; Urban, F.E.; Matell, N. Sea ice loss enhances wave action at the Arctic coast. Geophys. Res. Lett. 2011, 38, 17503. [Google Scholar] [CrossRef]
- Cai, L.; Alexeev, V.A.; Arp, C.D.; Jones, B.M.; Romanovsky, V.E. Modelling the impacts of projected sea ice decline on the low atmosphere and near-surface permafrost on the North Slope of Alaska. Int. J. Clim. 2018, 38, 5491–5504. [Google Scholar] [CrossRef]
- Farquharson, L.M.; Mann, D.H.; Swanson, D.K.; Jones, B.M.; Buzard, R.M.; Jordan, J.W. Temporal and spatial variability in coastline response to declining sea-ice in northwest Alaska. Mar. Geol. 2018, 404, 71–83. [Google Scholar] [CrossRef]
- Kwok, R. Arctic sea ice thickness, volume, and multiyear ice coverage: Losses and coupled variability (1958–2018). Environ. Res. Lett. 2018, 13, 105005. [Google Scholar] [CrossRef]
- Costard, F.; Gautier, E.; Brunstein, D.; Hammadi, J.; Fedorov, A.; Yang, D.; Dupeyrat, L. Impact of the global warming on the fluvial thermal erosion over the Lena River in Central Siberia. Geophys. Res. Lett. 2007, 34, 14501. [Google Scholar] [CrossRef]
- Koenig, R. Disaster Declared for North Slope Borough Damage from Fall Storm; KTOO Public Media: Juneau, AK, USA, 2017. [Google Scholar]
- U.S. Global Change Research Program. Global Climate Change Impacts in the United States; Cambridge University Press: Washington, DC, USA, 2009. [Google Scholar]
- Nelson, F.E.; Anisimov, O.A.; Shiklomanov, N.I. Subsidence risk from thawing permafrost. Nature 2001, 410, 889–890. [Google Scholar] [CrossRef]
- Hjort, J.; Karjalainen, O.; Aalto, J.; Westermann, S.; Romanovsky, V.E.; Nelson, F.E.; Etzelmüller, B.; Luoto, M. Degrading permafrost puts Arctic infrastructure at risk by mid-century. Nat. Commun. 2018, 9, 5147. [Google Scholar] [CrossRef]
- Hjort, J.; Streletskiy, D.; Doré, G.; Wu, Q.; Bjella, K.; Luoto, M. Impacts of permafrost degradation on infrastructure. Nat. Rev. Earth Environ. 2022, 3, 24–38. [Google Scholar] [CrossRef]
- Porfiriev, B.N.; Eliseev, D.O.; Streletskiy, D.A. Economic Assessment of Permafrost Degradation Effects on Road Infrastructure Sustainability under Climate Change in the Russian Arctic. Her. Russ. Acad. Sci. 2019, 89, 567–576. [Google Scholar] [CrossRef]
- Streletskiy, D.A.; Suter, L.J.; Shiklomanov, N.I.; Porfiriev, B.N.; Eliseev, D.O. Assessment of climate change impacts on buildings, structures and infrastructure in the Russian regions on permafrost. Environ. Res. Lett. 2019, 14, 025003. [Google Scholar] [CrossRef]
- Schneider von Deimling, T.; Lee, H.; Ingeman-Nielsen, T.; Westermann, S.; Romanovsky, V.; Lamoureux, S.; Walker, D.A.; Chadburn, S.; Trochim, E.; Cai, L.; et al. Consequences of permafrost degradation for Arctic infrastructure–bridging the model gap between regional and engineering scales. Cryosphere 2021, 15, 2451–2471. [Google Scholar] [CrossRef]
- Irrgang, A.M.; Lantuit, H.; Gordon, R.R.; Piskor, A.; Manson, G.K. Impacts of past and future coastal changes on the Yukon coast—threats for cultural sites, infrastructure, and travel routes. Arct. Sci. 2019, 5, 107–126. [Google Scholar] [CrossRef] [Green Version]
- Raynolds, M.K.; Walker, D.A.; Ambrosius, K.J.; Brown, J.; Everett, K.R.; Kanevskiy, M.; Kofinas, G.P.; Romanovsky, V.E.; Shur, Y.; Webber, P.J. Cumulative geoecological effects of 62 years of infrastructure and climate change in ice-rich permafrost landscapes, Prudhoe Bay Oilfield, Alaska. Glob. Chang. Biol. 2014, 20, 1211–1224. [Google Scholar] [CrossRef]
- Radosavljevic, B.; Lantuit, H.; Pollard, W.; Overduin, P.; Couture, N.; Sachs, T.; Helm, V.; Fritz, M. Erosion and flood-ing—threats to coastal infrastructure in the Arctic: A case study from Herschel Island, Yukon Territory, Canada. Estuaries Coasts 2016, 39, 900–915. [Google Scholar] [CrossRef] [Green Version]
- Nelson, F.E.; Anisimov, O.A.; Shiklomanov, N.I. Climate change and hazard zonation in the circum-Arctic permafrost regions. Nat. Hazards 2002, 26, 203–225. [Google Scholar] [CrossRef]
- Sinitsyn, A.O.; Guegan, E.; Shabanova, N.; Kokin, O.; Ogorodov, S. Fifty four years of coastal erosion and hydrometeorological parameters in the Varandey region, Barents Sea. Coast. Eng. 2020, 157, 103610. [Google Scholar] [CrossRef]
- Lantuit, H.; Overduin, P.; Couture, N.; Wetterich, S.; Aré, F.; Atkinson, D.; Brown, J.; Cherkashov, G.; Drozdov, D.; Forbes, D.L.; et al. The Arctic Coastal Dynamics Database: A New Classification Scheme and Statistics on Arctic Permafrost Coastlines. Estuaries Coasts 2011, 35, 383–400. [Google Scholar] [CrossRef] [Green Version]
- Zurba, M.; Petriello, M.A.; Madge, C.; McCarney, P.; Bishop, B.; McBeth, S.; Denniston, M.; Bodwitch, H.; Bailey, M. Learning from knowledge co-production research and practice in the twenty-first century: Global lessons and what they mean for col-laborative research in Nunatsiavut. Sustain. Sci. 2021, 1–19. [Google Scholar] [CrossRef]
- Degai, T.; Petrov, A.N.; Badhe, R.; Egede Dahl, P.P.; Döring, N.; Dudeck, S.; Herrmann, T.M.; Golovnev, A.; Mack, L.; Omma, E.M.; et al. Shaping Arctic’s Tomorrow through Indigenous Knowledge Engagement and Knowledge Co-Production. Sustainability 2022, 14, 1331. [Google Scholar] [CrossRef]
- Davis, K.; Ford, J.D.; Quinn, C.; IHACC Research Team; Harper, S.L. From participatory engagement to co-production: Modelling climate-sensitive processes in the Arctic. Arct. Sci. 2021, 7, 699–722. [Google Scholar] [CrossRef]
- Bronen, R.; Pollock, D.; Overbeck, J.; Stevens, D.; Natali, S.; Maio, C. Usteq: Integrating indigenous knowledge and social and physical sciences to coproduce knowledge and support community-based adaptation. Polar Geogr. 2019, 43, 188–205. [Google Scholar] [CrossRef]
- Osterkamp, T.E.; Payne, M.W. Estimates of permafrost thickness from well logs in northern Alaska. Cold Reg. Sci. Technol. 1981, 5, 13–27. [Google Scholar] [CrossRef]
- Kanevskiy, M.; Shur, Y.; Jorgenson, M.T.; Ping, C.-L.; Michaelson, G.J.; Fortier, D.; Stephani, E.; Dillon, M.; Tumskoy, V. Ground ice in the upper permafrost of the Beaufort Sea coast of Alaska. Cold Reg. Sci. Technol. 2013, 85, 56–70. [Google Scholar] [CrossRef]
- Jorgenson, M.T.; Yoshikawa, K.; Kanevskiy, M.; Shur, Y.; Romanovsky, V.; Marchenko, S.; Grosse, G.; Brown, J.; Jones, B. Permafrost characteristics of Alaska. In Proceedings of the Ninth International Conference on Permafrost, Fairbanks, AK, USA, 29 June–3 July 2008; Volume 3, pp. 121–122. [Google Scholar]
- USACE (U.S. Army Corps of Engineers). Alaska Baseline Erosion Assessment; Study findings and technical report; USACE: Elmendorf Air Force Base, AK, USA, 2009. [Google Scholar]
- Wiltse, N.; Madden, D. 2017 Alaska Housing Assessment: North Slope Borough; Alaska Housing Finance Corporation: Anchorage, AK, USA; Cold Climate Housing Research Center: Fairbanks, AK, USA, 2018. [Google Scholar]
- Gutierrez-Edwards, T.; Rowe, M.; Green, E.; McDonald, E.; Bergerson, J.; Callaway, D.; Utermohle, C. North Slope Borough: 2019 Economic Profile and Census Report; North Slope Borough of Alaska: Utqiagvik, AK, USA, 2020. [Google Scholar]
- OpenStreetMap. Available online: https://www.openstreetmap.org/ (accessed on 3 March 2022).
- Oliver, S.G. Kaktovik hopes a mix of technology and tradition can give the village an ice cellar that will last. Anchorage Daily News 2017. [Google Scholar]
- Naiden, A. Alaska scientists study accelerating land subsidence affecting coastal North Slope communities. Anchorage Daily News 2022. [Google Scholar]
- Nyland, K.E.; Klene, A.E.; Brown, J.; Shiklomanov, N.I.; Nelson, F.E.; Streletskiy, D.A.; Yoshikawa, K. Traditional Iñupiat ice cellars (SIĠḷUAQ) in Barrow, Alaska: Characteristics, temperature monitoring, and distribution. Geogr. Rev. 2017, 107, 143–158. [Google Scholar] [CrossRef]
- Brubaker, M.; Bell, J.; Dingman, H.; Morales, R.; Tagarook, C.; Drake, R.; Ramstad, K. Climate Change in Wainwright, Alaska, Strategies for Community Health; ANTHC Center for Climate and Health: Anchorage, AK, USA, 2014. [Google Scholar]
- Liew, M.; Xiao, M.; Jones, B.M.; Farquharson, L.M.; Romanovsky, V.E. Prevention and control measures for coastal erosion in northern high-latitude communities: A systematic review based on Alaskan case studies. Environ. Res. Lett. 2020, 15, 093002. [Google Scholar] [CrossRef]


| Categories | Survey Questions |
|---|---|
| Permafrost thaw |
|
| Coastal erosion |
|
| Infrastructure damage and repair |
|
| Community | Population | Number of Survey Responses | Survey Participation Rate (% of Adult Population) | |||
|---|---|---|---|---|---|---|
| Total | Adult 1 | Total 2 | Complete | Total 2 | Complete | |
| Kaktovik | 178 | 118 | 46 | 40 | 39.0 | 33.9 |
| Point Lay | 227 | 119 | 26 | 23 | 21.8 | 19.3 |
| Utqiaġvik | 4467 | 2836 | 66 | 51 | 2.3 | 1.8 |
| Wainwright | 494 | 312 | 15 | 12 | 4.8 | 3.8 |
| All community | 5366 | 3385 | 153 | 126 | 4.5 | 3.7 |
| Community | Active Layer in 2020 (m) | Active Layer in 2100 (m) | Talik Thickness by 2100 (m) | |||
|---|---|---|---|---|---|---|
| Natural | Gravel | Natural | Gravel | Natural | Gravel | |
| Kaktovik | 0.26–0.7 | 1.0–1.2 | 1.3–1.4 | 1.6–1.7 | 0–5.5 | 1.3–7.3 |
| Point Lay | 0.8–1.5 | 1.3–1.9 | 0.7–0.9 | 1.0–1.2 | 13.0–13.0 | 16.0–16.0 |
| Utqiaġvik | 0.3–0.8 | 1.1–1.2 | 1.0–1.0 | 1.3–1.7 | 0.3–7.3 | 1.7–9.0 |
| Wainwright | 0.6–0.9 | 1.2–1.4 | 0.8–1.7 | 0.8–1.7 | 0–9.4 | 0.4–11.5 |
| Towns | Most Reported Types of Civil Infrastructure | Most Reported Time Periods | ||
|---|---|---|---|---|
| Affected by Permafrost Thaw | Affected by Coastal Erosion | Permafrost Thaw | Coastal Erosion | |
| Kaktovik | Houses (31%) | Houses (23%) | <6 months (40%) | 1–3 years (42%) |
| Point Lay | Runways (26%) | Ice cellars (27%) | 0.5–1 year (31%) 1–3 years (31%) | 1–3 years (42%) |
| Utqiaġvik | Houses (28%) | Houses (31%) | 1–3 years (27%) | >10 years (41%) |
| Wainwright | Water and sewer lines (36%) | Houses (25%) | <6 months (28%) 0.5–1 year (27%) 1–3 years (27%) | 1–3 years (37%) |
| All | Houses (27%) | Houses (27%) | 1–3 years (27%) | 1–3 year (31%) |
| Types of Damage | Communities | ||||
|---|---|---|---|---|---|
| Kaktovik (n = 135) | Point Lay (n = 72) | Utqiaġvik (n = 181) | Wainwright (n = 18) | All (n = 406) | |
| Cracking of walls | 17% | 11% | 14% | 22% | 15% |
| Tilting of houses | 12% | 11% | 14% | 17% | 13% |
| Doors that could not close | 9% | 14% | 12% | 11% | 11% |
| Surrounding water accumulation | 9% | 10% | 10% | 6% | 10% |
| Broken windows | 11% | 7% | 7% | 22% | 9% |
| Nearby ground subsidence | 6% | 8% | 5% | 0% | 6% |
| Jacking up of piles | 4% | 4% | 7% | 6% | 6% |
| Sinking of piles or post-on-pad | 3% | 4% | 4% | 6% | 4% |
| Breaking of pipes | 6% | 6% | 5% | 6% | 5% |
| Failure of adjustable supports for elevated foundation | 6% | 1% | 7% | 6% | 5% |
| Breaking of post-on-pad for elevated foundation | 7% | 8% | 3% | 0% | 5% |
| Heaving or sinking of soil underneath slab-on-grade | 10% | 14% | 8% | 0% | 9% |
| Others | 0% | 1% | 2% | 0% | 1% |
| Community | Community Prioritization (USACE 2009) | Percentage of Residents Who Observed Coastal Erosion | Consistency with USACE |
|---|---|---|---|
| Kaktovik | Monitoring | 49% | Inconsistent |
| Point Lay | Minimal erosion | 50% | Consistent |
| Utqiaġvik | Priority action | 75% | Consistent |
| Wainwright | Minimal erosion | 67% | Consistent |
| Category | Important Information or Action for Planning in the Events of Continued Permafrost Degradation and Coastal Erosion |
|---|---|
| Natural environment |
|
| Built environment |
|
| Cultural awareness |
|
| Education and communication |
|
| Policy |
|
| Indigenous Investigation | Scientific Investigation | Knowledge Coproduction |
|---|---|---|
| Observe and report locations experiencing permafrost degradation (e.g., active layer thickening and talik formation) and coastal erosion, and produce heatmaps using survey data | Produce high-resolution (i.e., 1 m) permafrost degradation and coastal erosion maps using physically based models or remote sensing | Compare heatmaps with permafrost degradation maps to investigate whether areas of highly reported cases of permafrost degradation and coastal erosion correlate with areas most severely impacted by climate warming |
| Observe environmental changes (e.g., snow distribution and thickness in undisturbed tundra and near residential areas and storm events) in different communities impacted by various degrees of permafrost degradation and coastal erosion | Produce high-resolution (i.e., 1 m) permafrost degradation and coastal erosion maps for different communities impacted by various degrees of permafrost degradation and coastal erosion | Compare results of indigenous and scientific investigations across communities to investigate the individual and collective effects of site selection (e.g., site topography and geology), snow distribution, and anthropogenic disturbance on permafrost degradation and coastal erosion |
| Observe and report infrastructure damage and maintenance and repair for different types of civil infrastructure and foundation systems, and advise effective adaptations of civil infrastructure and foundation systems based on personal experience | Investigate the failure mechanisms of various types of civil infrastructure and foundation systems using physically based numerical models | Evaluate the performance of different types of foundations and compare scientific results with the experience of Arctic residents to coproduce knowledge for adapting foundations of civil infrastructure |
Publisher’s Note: MDPI stays neutral with regard to jurisdictional claims in published maps and institutional affiliations. |
© 2022 by the authors. Licensee MDPI, Basel, Switzerland. This article is an open access article distributed under the terms and conditions of the Creative Commons Attribution (CC BY) license (https://creativecommons.org/licenses/by/4.0/).
Share and Cite
Liew, M.; Xiao, M.; Farquharson, L.; Nicolsky, D.; Jensen, A.; Romanovsky, V.; Peirce, J.; Alessa, L.; McComb, C.; Zhang, X.; et al. Understanding Effects of Permafrost Degradation and Coastal Erosion on Civil Infrastructure in Arctic Coastal Villages: A Community Survey and Knowledge Co-Production. J. Mar. Sci. Eng. 2022, 10, 422. https://doi.org/10.3390/jmse10030422
Liew M, Xiao M, Farquharson L, Nicolsky D, Jensen A, Romanovsky V, Peirce J, Alessa L, McComb C, Zhang X, et al. Understanding Effects of Permafrost Degradation and Coastal Erosion on Civil Infrastructure in Arctic Coastal Villages: A Community Survey and Knowledge Co-Production. Journal of Marine Science and Engineering. 2022; 10(3):422. https://doi.org/10.3390/jmse10030422
Chicago/Turabian StyleLiew, Min, Ming Xiao, Louise Farquharson, Dmitry Nicolsky, Anne Jensen, Vladimir Romanovsky, Jana Peirce, Lilian Alessa, Christopher McComb, Xiong Zhang, and et al. 2022. "Understanding Effects of Permafrost Degradation and Coastal Erosion on Civil Infrastructure in Arctic Coastal Villages: A Community Survey and Knowledge Co-Production" Journal of Marine Science and Engineering 10, no. 3: 422. https://doi.org/10.3390/jmse10030422
APA StyleLiew, M., Xiao, M., Farquharson, L., Nicolsky, D., Jensen, A., Romanovsky, V., Peirce, J., Alessa, L., McComb, C., Zhang, X., & Jones, B. (2022). Understanding Effects of Permafrost Degradation and Coastal Erosion on Civil Infrastructure in Arctic Coastal Villages: A Community Survey and Knowledge Co-Production. Journal of Marine Science and Engineering, 10(3), 422. https://doi.org/10.3390/jmse10030422