Article

A Fish and Dolphin Biophony in the Boat Noise-Dominated Soundscape of the Cres-Lošinj Archipelago (Croatia)

1
Blue World Institute of Marine Research and Conservation, Kaštel 24, 51551 Veli Losinj, Croatia
2
CNR-National Research Council, ISMAR—Institute of Marine Sciences in Venice, Castello 2737/f, 30122 Venice, Italy
3
Laboratory of Functional and Evolutionary Morphology (Freshwater and Oceanic Science Unit of Research), Institut de Chimie B6c, University of Liège, 4000 Liege, Belgium
*
Author to whom correspondence should be addressed.
J. Mar. Sci. Eng. 2022, 10(2), 300; https://doi.org/10.3390/jmse10020300
Submission received: 21 November 2021 / Revised: 3 February 2022 / Accepted: 17 February 2022 / Published: 21 February 2022
(This article belongs to the Special Issue Passive Acoustics to Study Marine and Freshwater Ecosystems)

Abstract

:
Spatio-temporal variability of marine soundscapes reflects environmental dynamics and local habitat health. This study characterizes the coastal soundscape of the Cres-Lošinj Natura 2000 Site of Community Importance, encompassing the non-tourist (11–15 March 2020) and the tourist (26–30 July 2020) season. A total of 240 h of continuous recordings was manually analyzed and the abundance of animal vocalizations and boat noise was obtained; sound pressure levels were calculated for the low (63–2000 Hz) and high (2000–20,000 Hz) frequency range. Two fish sound types were drivers of both seasonal and diel variability of the low-frequency soundscape. The first is emitted by the cryptic Roche’s snake blenny (Ophidion rochei), while the second, whose emitter remains unknown, was previously only described in canyons and coralligenous habitats of the Western Mediterranean Sea. The high-frequency bands were characterized by bottlenose dolphin (Tursiops truncatus) vocalizations, indicating dolphins’ use of area for various purposes. Boat noise, however, dominated the local soundscape along the whole considered periods and higher sound pressure levels were found during the Tourist season. Human-generated noise pollution, which has been previously found 10 years ago, is still present in the area and this urges management actions.

1. Introduction

The soundscape is the result of all biological, physical, and anthropogenic sound sources integrated across a given habitat or area [1]. The study of the soundscape aims to characterize the spatial and temporal acoustic variation in an environment and uses soundscape characteristics to infer habitat quality [2,3,4]. Marine acoustic diversity patterns, measured as the richness and diversity of sound types emitted by vocal animals, have been proved to provide multi-level information on biodiversity, environmental status, protection level, community stability and habitat functionality, even in cases in which the identity of the emitting species has not been yet identified [5,6]. As a result, underwater soundscapes, monitored by non-invasive and relatively low-cost passive acoustics sensors (PAM: passive acoustic monitoring), are now recognized as fundamental features for obtaining ecologically relevant information, supporting its use instead and/or together with other approaches.
So far, the soundscapes of different marine coastal habitats have been investigated worldwide, where special attention has been given to biophony and human-made components; multi-species data has been collected, including cryptic and free-ranging vocal species [7,8,9,10,11,12,13]. Man-made noise has been proven to be pervasive in coastal habitats, mainly due to ship and recreational traffic, as well as port activities [14]. Anthropogenic underwater noise is nowadays recognized as a pollutant that is changing underwater soundscapes, imposing new constraints on animals [15,16,17]; in its turn, this leads to the legislative requirement for its monitoring (Marine Strategy Framework Directive—MSFD).
Given their high ecological value [18] and the severe degradation [19,20,21], many coastal areas, including portions of the Northern Adriatic Sea, have been identified as areas of conservation concern [22]. This is the case of the Eastern coast of the Cres-Lošinj archipelago (Northeastern Adriatic Sea, Croatia), an area of approximately 545 km2, which includes steep rocky shores and a seabed patched with muddy areas and sea grass flats. The archipelago represents a very important marine habitat, being a feeding and nursing ground for a resident bottlenose dolphin (Tursiops truncatus) population [23,24,25] and part of the home range for about 200 individuals [25]. The Mediterranean bottlenose dolphin subpopulation is believed to be declining in size and has been listed as ‘Vulnerable’ by the IUCN [26]. As a result, the Cres-Lošinj area was designated as a Site of Community Importance (SCI) in 2014, and as part of the European Union NATURA 2000 ecological network (Cres-Lošinj SCI, HR3000161; [27]). This area, however, is also a well-known tourist destination. Due to the high traffic of recreational boats related to the intense nautical tourism during summer months, various studies have been undertaken, proving that boat presence negatively affects distribution of the dolphin population, and their related noise induces significant shifts in animal vocalization frequencies [28,29]. Despite this, no regulatory measures have been yet set.
Although the diurnal relationship between anthrophony and bottlenose dolphins’ distribution and vocalizations has been investigated at the Cres-Lošinj area, a more extensive analysis of the local soundscape is lacking, with special reference to the contribution of the other vocal species in a continuous acoustic monitoring frame, i.e., including nocturnal hours. Besides marine mammals, two major marine animal taxa are known to contribute to coastal areas biophonies, i.e., invertebrates and fish, encompassing a wide spectral range (from 10 Hz to over 20 kHz). Various crustaceans produce mechanical sounds, such as lobsters or snapping shrimp (Synalpheus sp.) [30,31], or sea urchins and mussels [32,33]. Evidence for soniferous behavior has been found in more than 150 fish families, where soniferous abilities have evolved independently many times, mostly in association with biodiverse communities [34]. In fish, sound production employs a vast variety of mechanisms based on existing anatomical structures (as swim bladder, bone, teeth, etc.), which often evolved into sophisticated sonic organs [35]. Fish vocal activity is related to different behavioral contexts such as reproduction, territorial defense and food competition [36].
This study aims to perform acoustic monitoring of the Cres-Lošinj archipelago in order to characterize the community of soniferous fauna and the anthrophony. Since the presence of human activities is higher during summer due to tourism [37], this research describes the soundscape of the Cres-Lošinj archipelago along two continuously recorded five-days periods, encompassing the Non-Tourist and the Tourist seasons. Further, for the first time, the knowledge of the local soundscape is expanded to the nocturnal hours by using 24 h recordings, looking for nychthemeral cycles. Animals’ vocalization and boat noise were detected by the aural and visual inspection of the acoustic files, in accord with many other studies [6,38,39,40]. Local soundscape characteristics were also described in terms of broadband and one-third octave band levels. The relationship between the abundance of the biological and man-made acoustic signals and the underwater noise levels was explored.

2. Materials and Methods

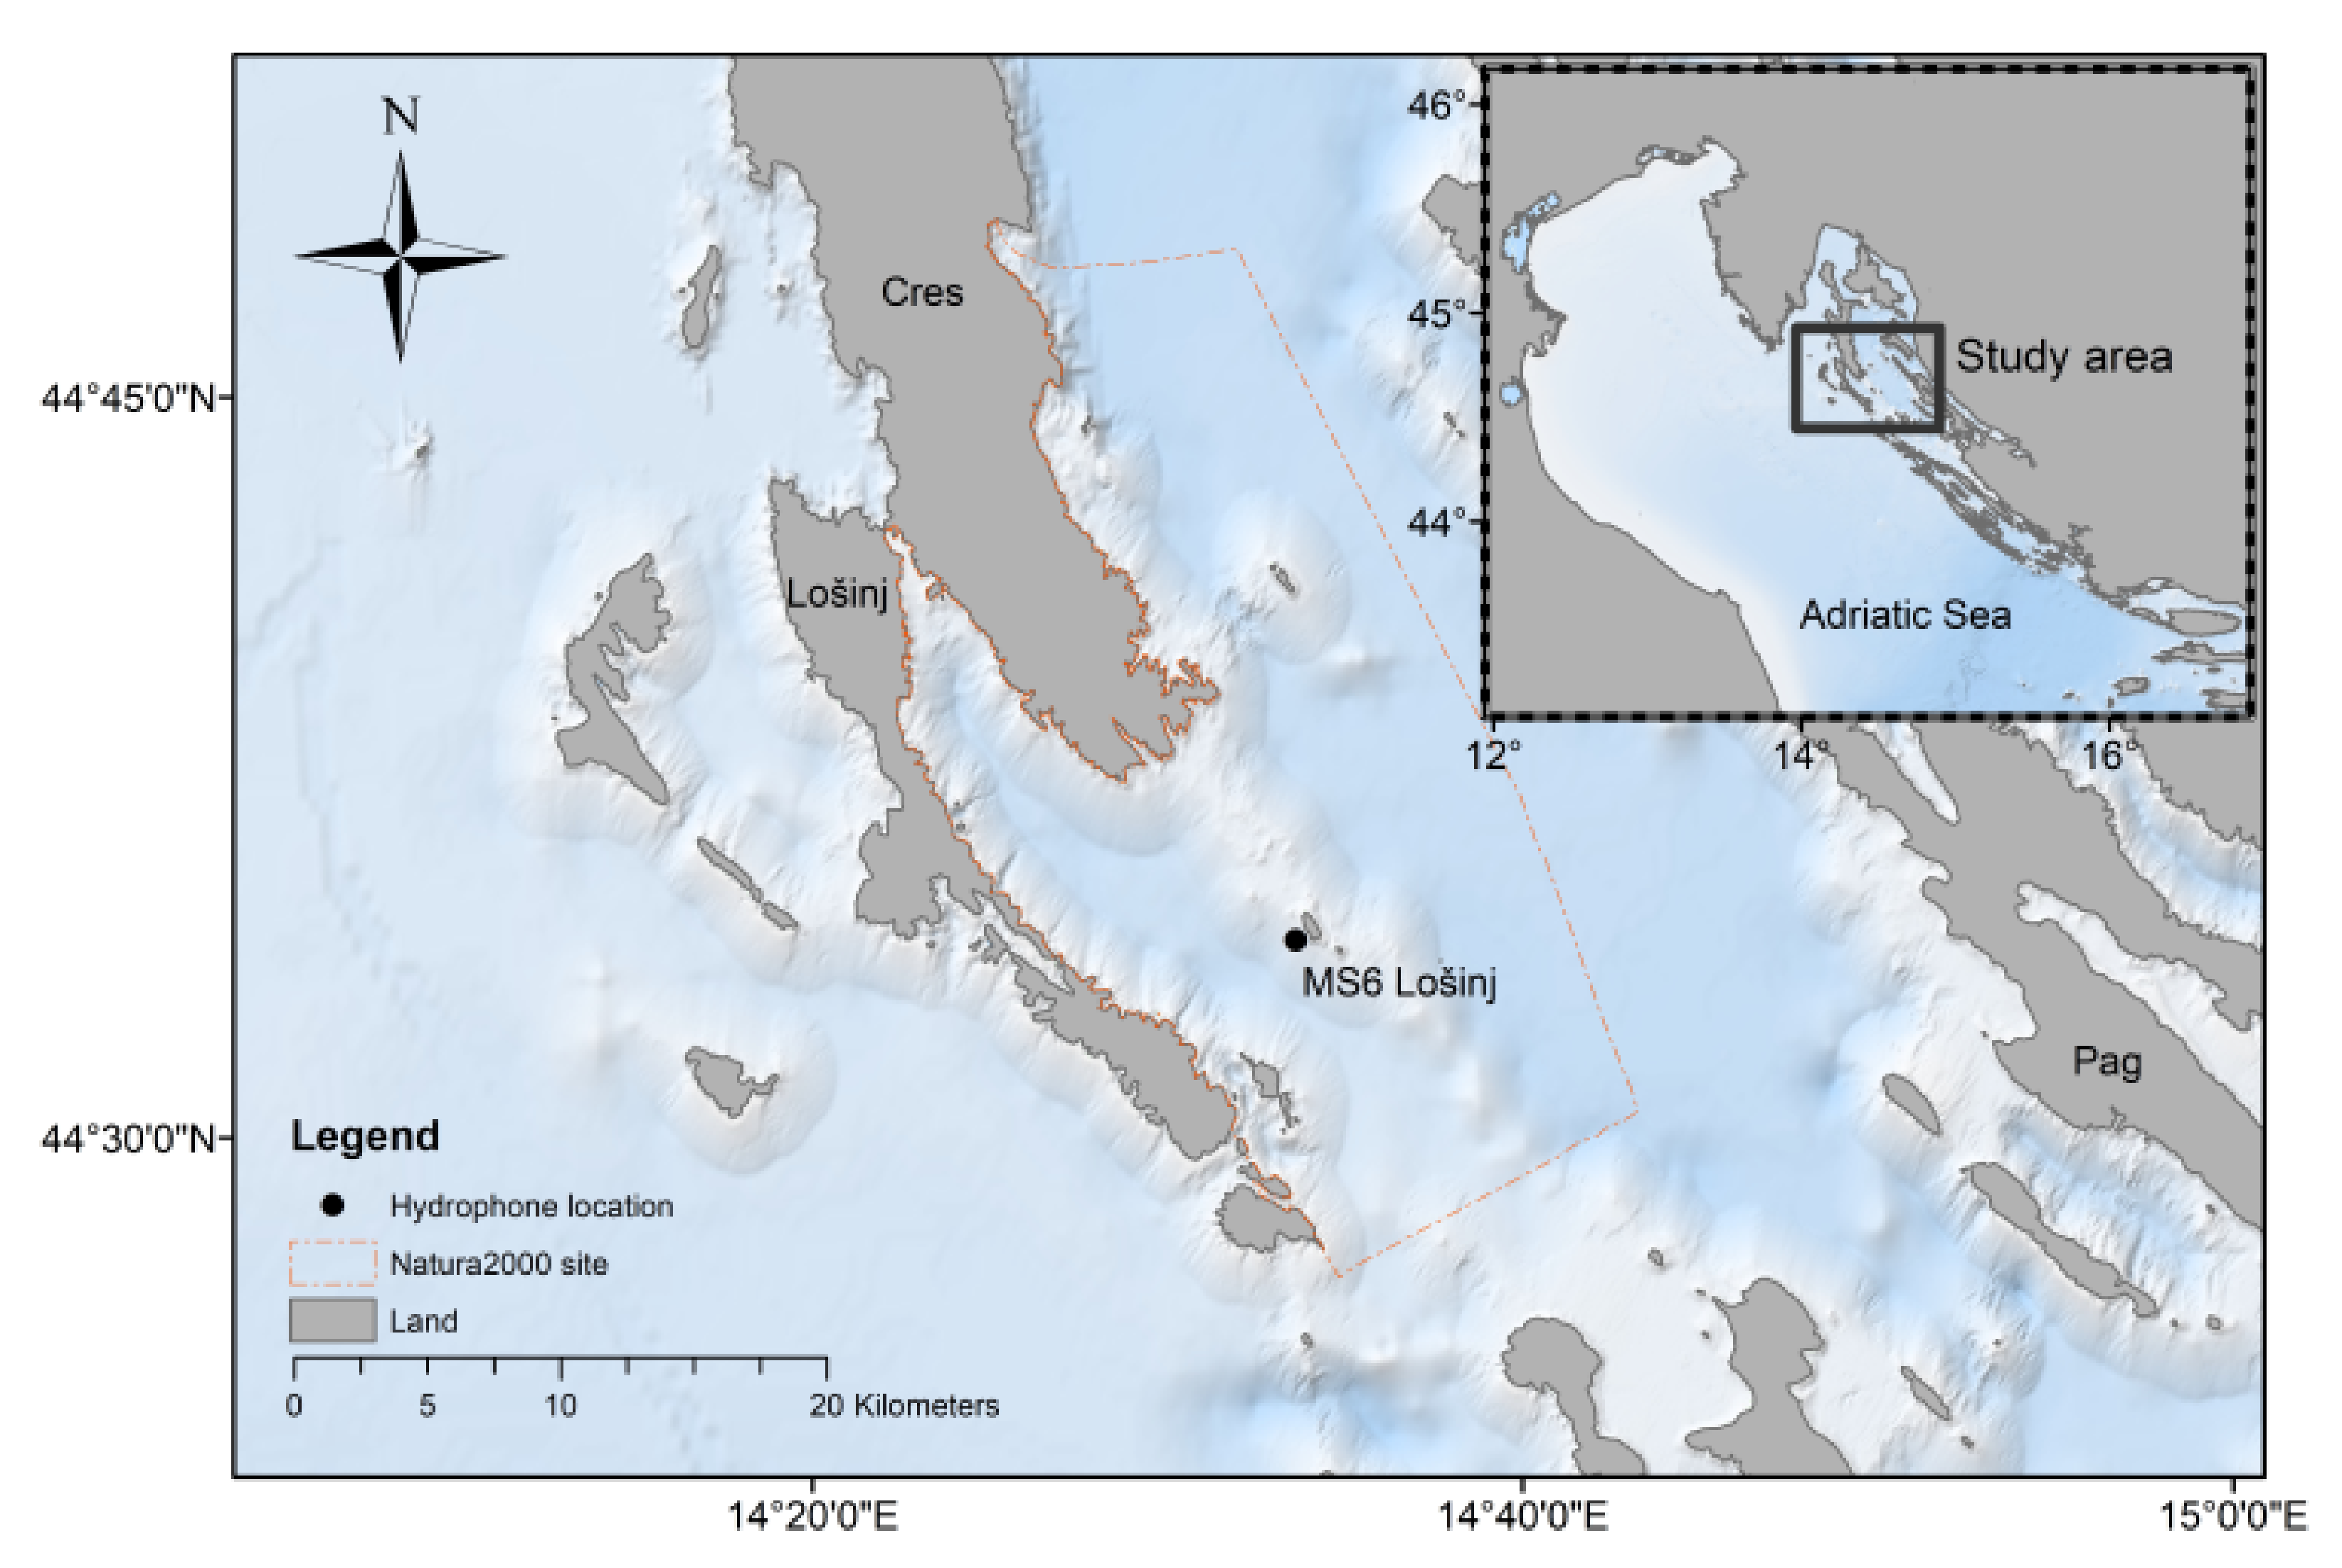
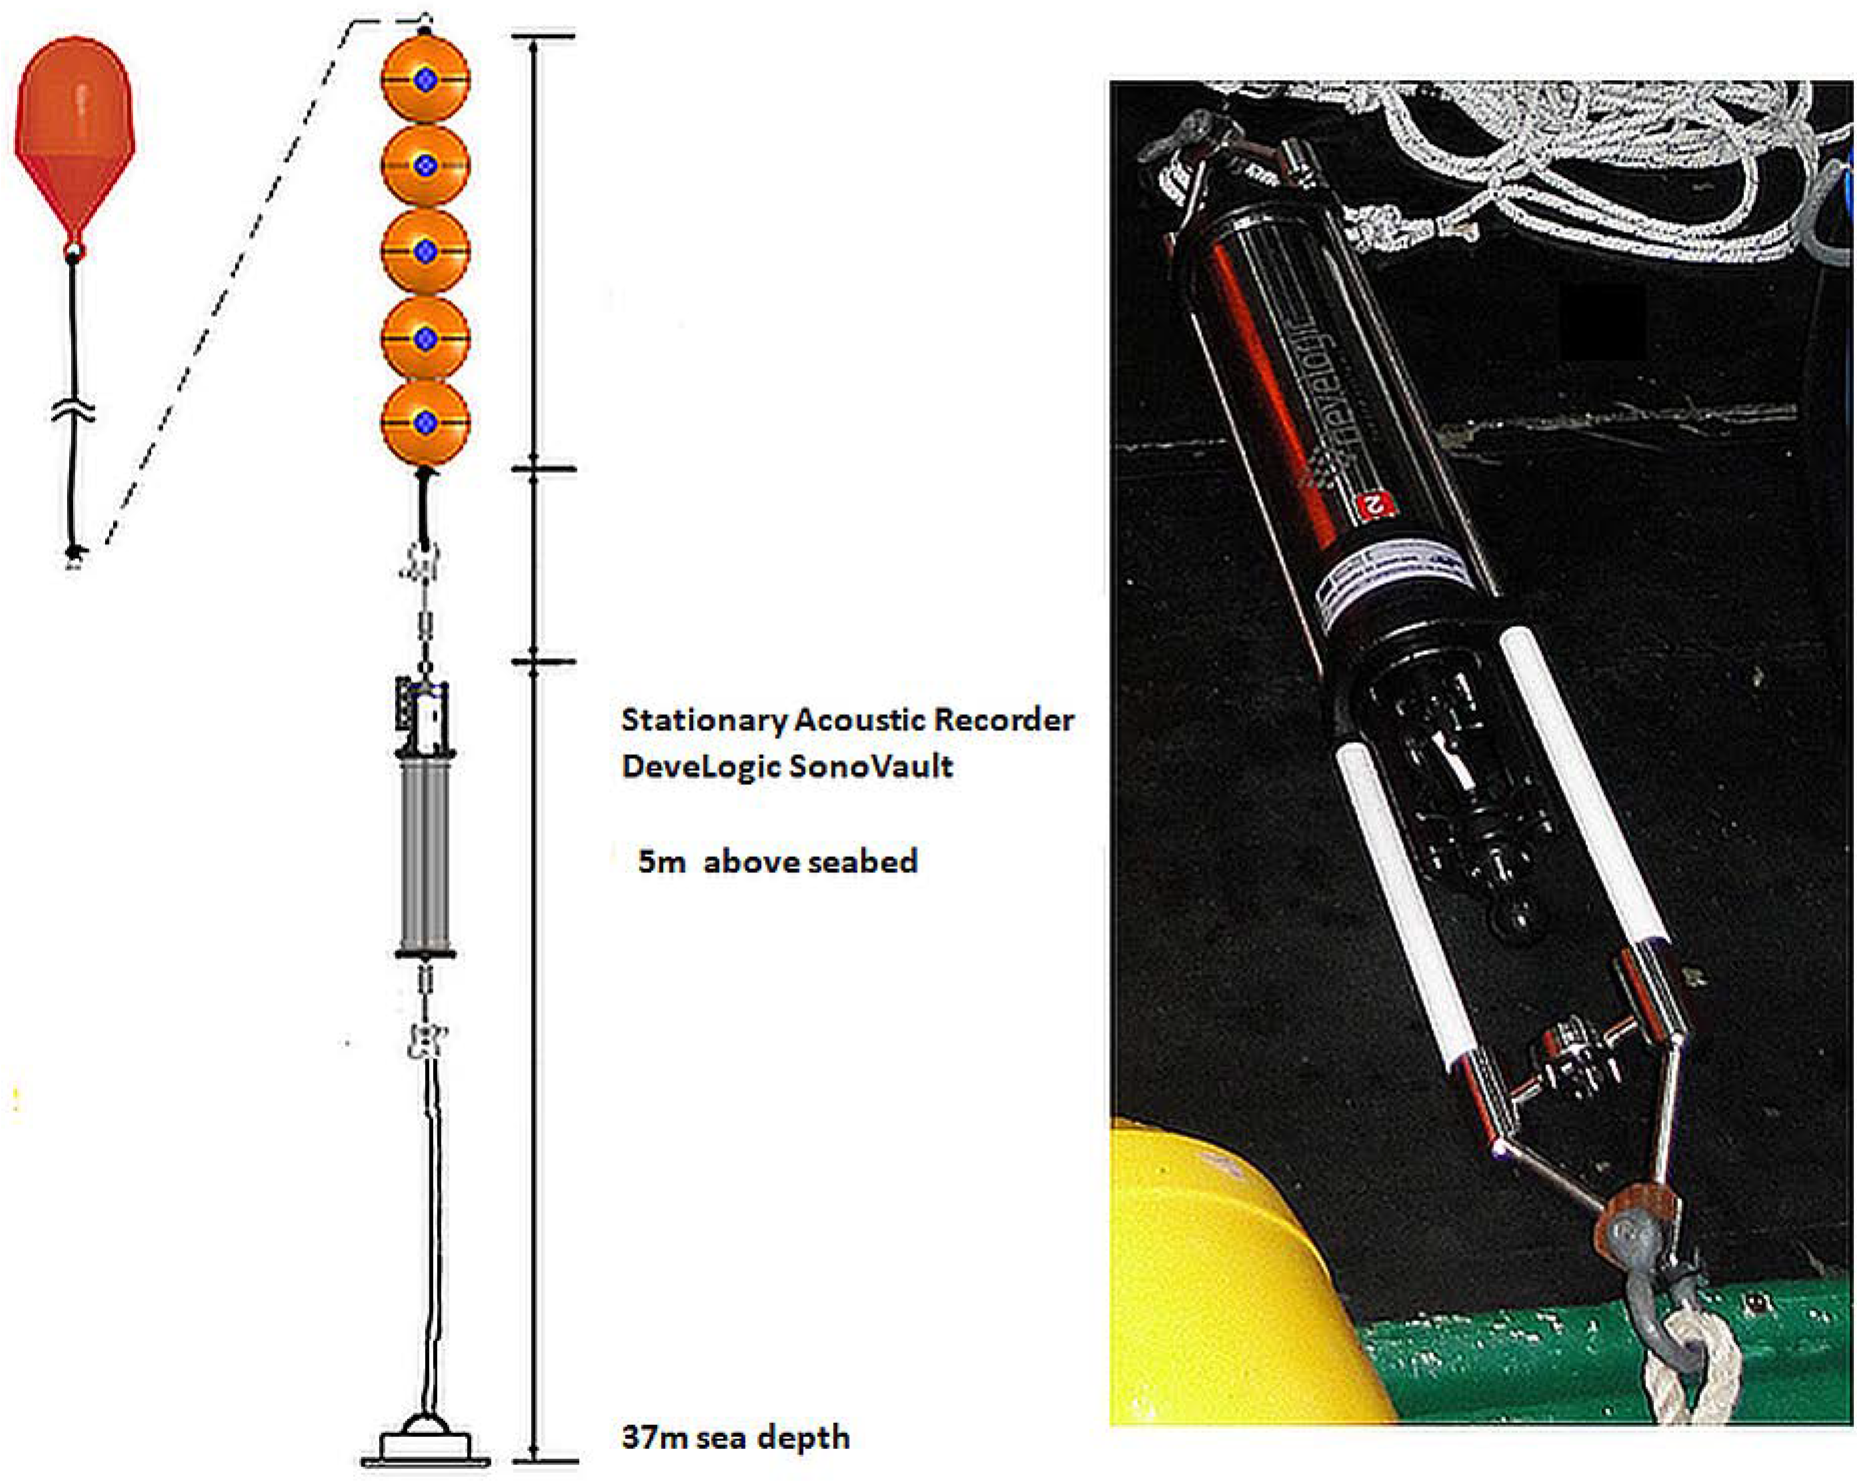
2.1. The Study Site and Data Collection

The presented data were collected in the larger frame of the SOUNDSCAPE Interreg Italy-Croatia project, running a transnational assessment of the underwater noise by a year-round passive acoustic monitoring on 9 different locations distributed along the Northern Adriatic Sea.
The monitoring station MS6 Lošinj (14.57469° E, 44.54597° N) was located within the coastal area of the Cres-Lošinj archipelago near the island of Oruda (Figure 1). The channel area between the island is subject to intense recreational boating between June and September (the Tourist Season—TS; [28]) but it is isolated from major shipping lanes; there are commercial fishing activities in the area.
Acoustic recordings were made with a stationary acoustic recorder (Develogic SonoVault SN1106) equipped with an omnidirectional Neptune Sonar D60 Hydrophone (Sensitivity around −193 dB re 1 V/µPa with flat frequency response within ±3 dB), a programmable recorder with variable gain.
The recorder was fully calibrated (hydrophone sensitivity and directivity, gain and self noise). The recorder was set to record continuously at a sampling rate of 48 kHz, providing a recording bandwidth of approximately 22 kHz with 16-bit resolution. Twenty-four 1 h-files (in wav format) were obtained per day.
The recorder was anchored to the bottom with a rig design consisting of an anchor and the logger itself secured by polypropylene rope and extra flotations, as illustrated in Figure 2. The rig design above the anchor was positively buoyant, which ensured that the logger was suspended at 32 m depth, 5 m above the sandy bottom characterized by a gentle slope.

2.2. Data Analysis

2.2.1. Manual Scrolling

During 2020, two different periods were considered: a period in March (11–15 March, hereafter called Non-Tourist Season NTS), and a period in July (26–30 July, hereafter called Tourist Season TS). Continuous recordings were analyzed, rendering a total of 240 1 h-files, that were manually analyzed minute by minute by aural and visual assessment of spectrograms (Hanning window, FFT = 512, 50% overlap), using Adobe Audition (Adobe Systems, San Jose, CA, USA).
Fish and dolphin sounds as well as the signals produced by the snapping shrimps were recognized in the recordings following the sound type description and classification given in previous studies [5,39,41,42,43,44,45,46,47,48]. Although the sounds produced by snapping shrimps were identified in all the acoustic files, a quantitative analysis of these sounds was not included in the present paper.
Spectrograms were first inspected at the wideband level in order to highlight the presence of dolphin vocalizations at high frequency (above 2 kHz). Subsequently, all files were resampled at 6 kHz and the spectrograms were again manually inspected to detect the presence of low-frequency sound sources, i.e., boat noise, fish vocalizations and low-frequency (below 2 kHz) dolphin sounds.
The noise produced by close-by boat passages was identified by visual and aural assessment of spectrograms [49]. With this analysis framework, the “boat noise” category can be considered only as a presence/absence indicator of close-by boat passages. In fact, information about (i) type of boat noise (i.e., burst broadband, variable broadband, and continuous low-frequency energy inputs) and (ii) boat noise intensity is not depicted. In a similar fashion, the relative abundance of dolphins and fish sound types was not considered at the sound type level, but rather at the sound category level (i.e., fish, dolphin LF sounds and dolphin HF sounds).
Each target signal (i.e., fish sounds, dolphin sounds, boat noises) was scored as presence/absence per each minute of the 1 h-file; the number of minutes containing each category of target signals (i.e., fish, dolphins, boat) was converted into a percentage. This percentage was used as a proxy of their relative abundance per hour of recording. The exact number of signals present inside each minute sample was not evaluated.
A limited number of dolphin vocalizations characterized by a good signal-to-noise ratio was found throughout the recordings. These vocalizations were counted and further reported per survey period (TS vs. NTS) and circadian period (night vs. day), separated per sound type.

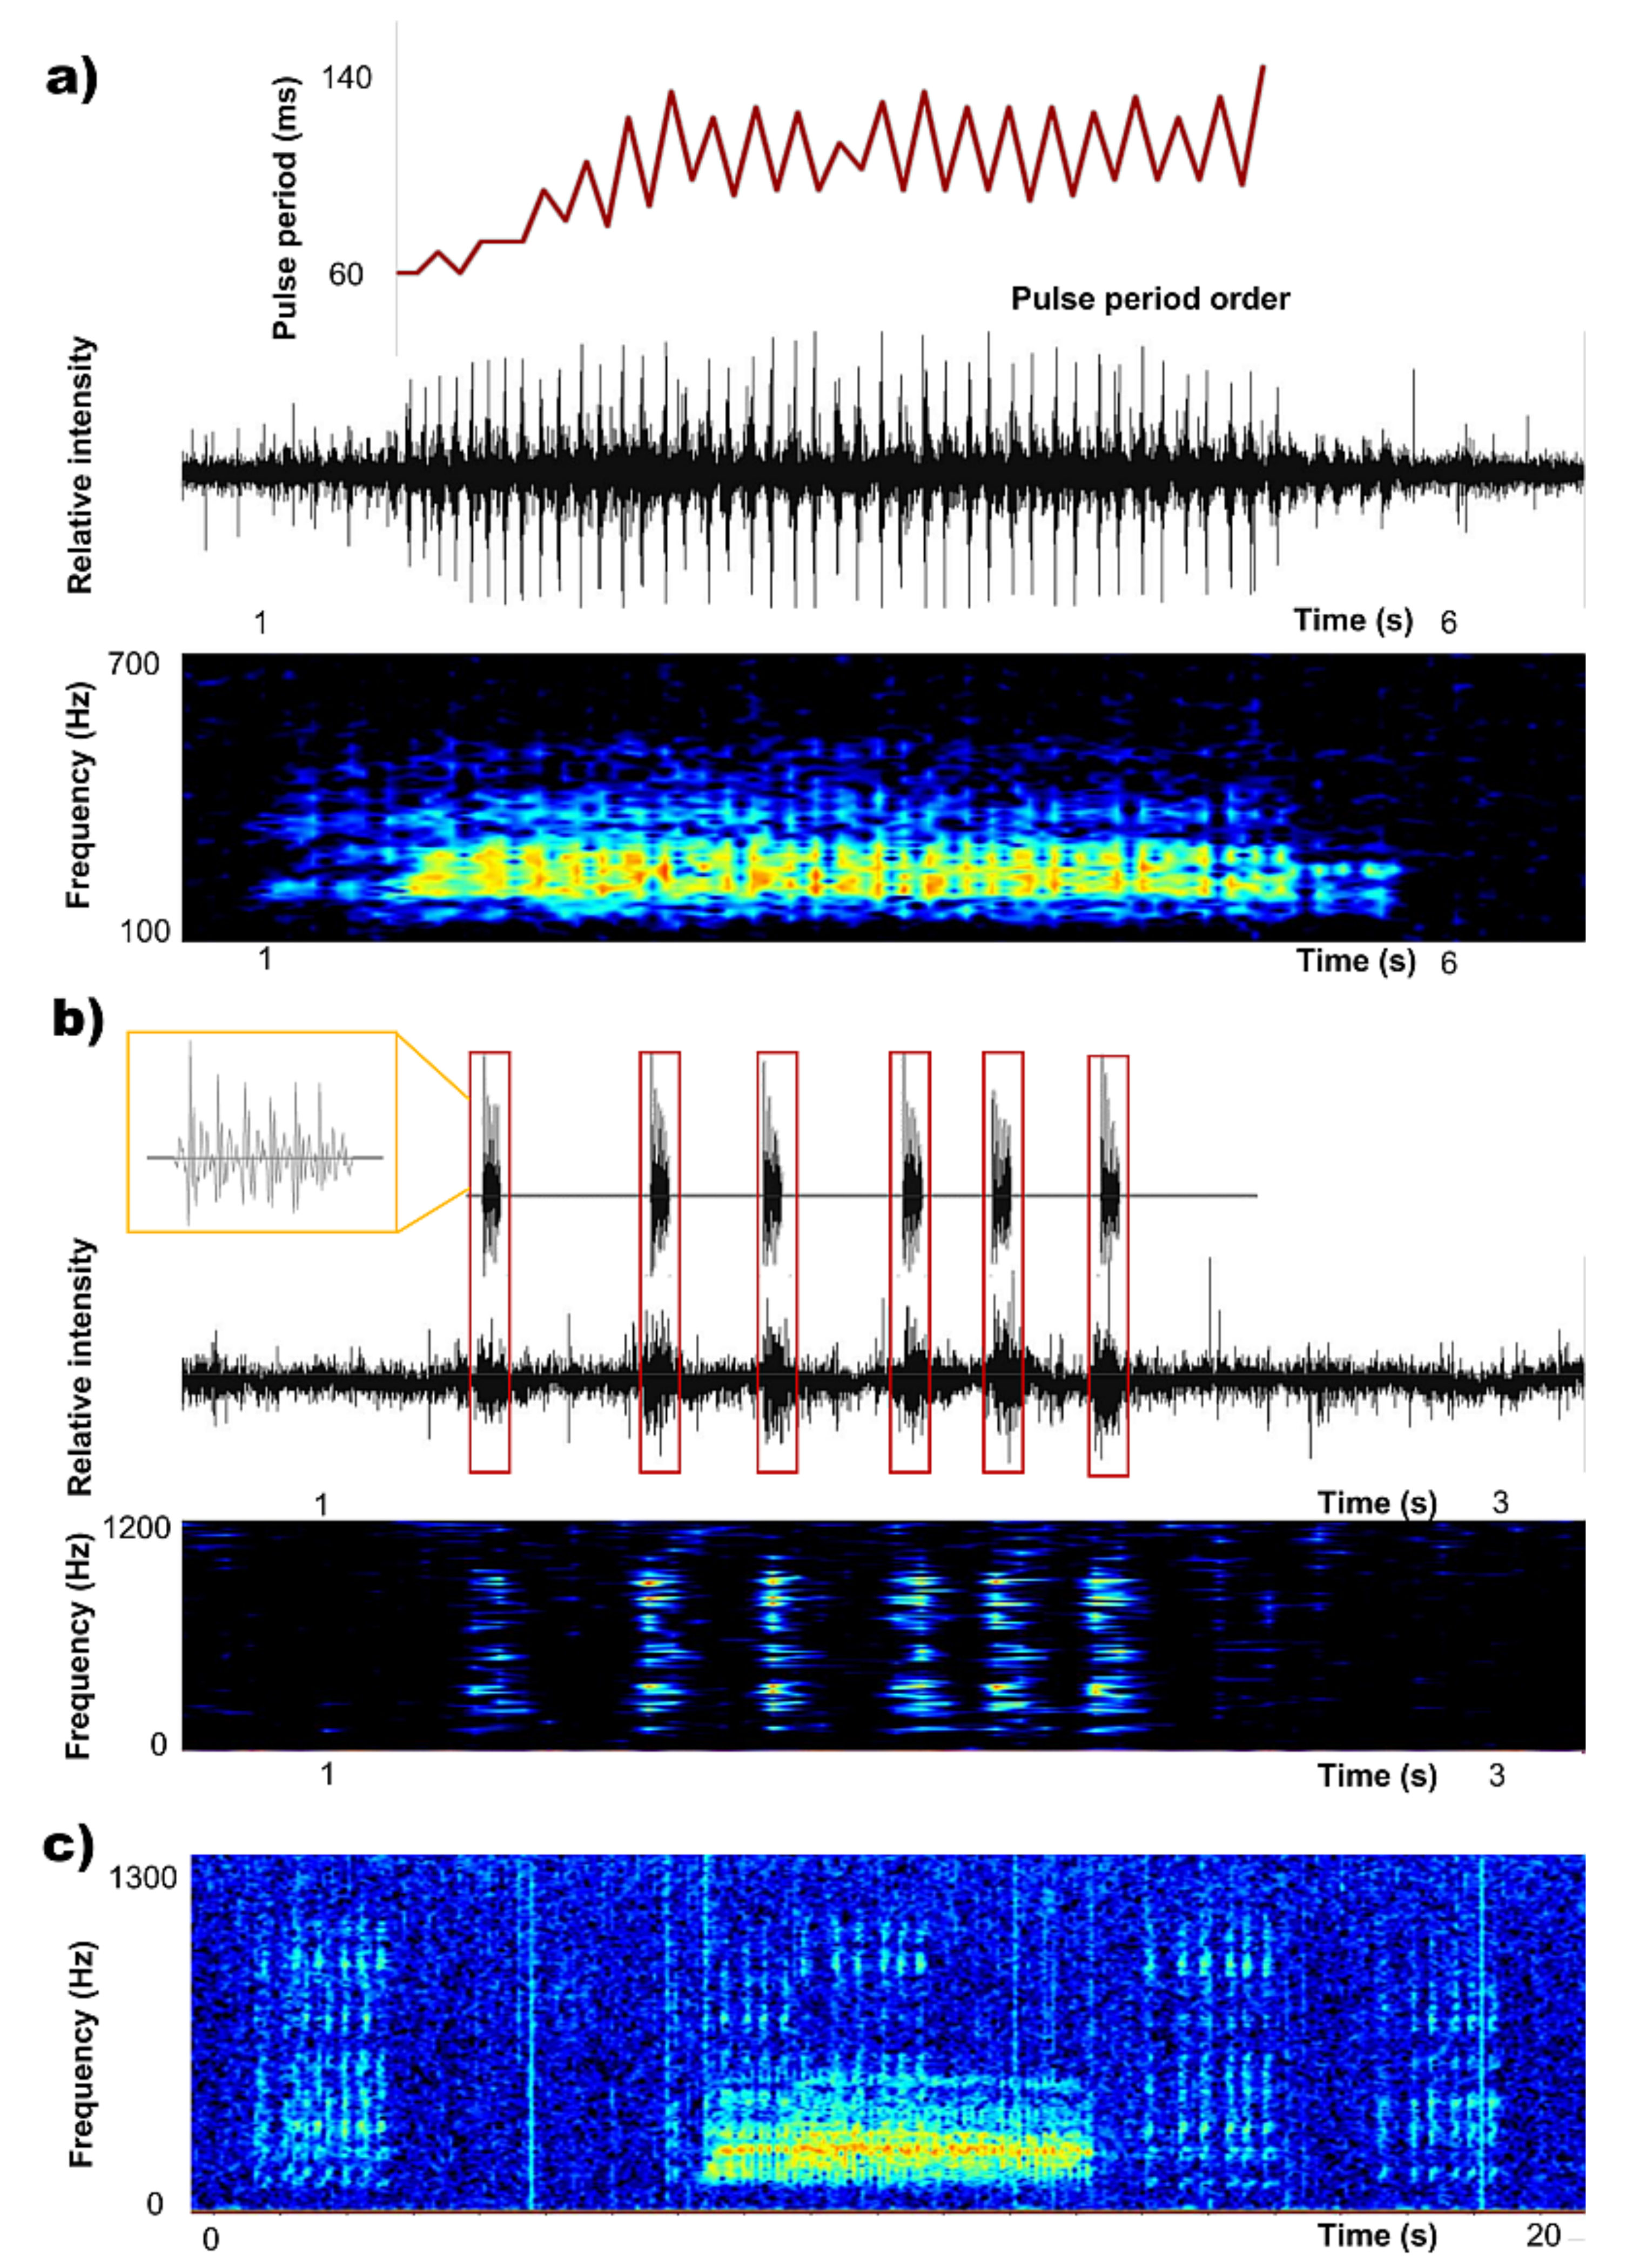
2.2.2. Fish Sound Analysis

Descriptive statistics (mean, standard deviation, SD, and coefficient of variation, c.v., %) of sound features characterizing the dominant fish sound types recorded in the Lošinj area were calculated and used for comparisons with the literature [11,39].
Temporal features were measured from oscillograms, while spectral features were obtained from power spectra. Measurements were done by using Raven Pro 1.4. acoustic software (Bioacoustic Research Program, Cornell Laboratory of Ornithology, Ithaca, NY, USA).
Ophidion rochei sounds ([11] sample size N = 20), were characterized by measuring the following acoustic features: (i) number of pulses, (ii) sound duration (ms, measured from the onset of the first pulse to the onset of the last pulse), (iii) first peak frequency of the call (Hz, frequency with the highest energy); (iv) second peak frequency of the call (Hz, frequency with the second highest energy); (v) alternation start (the pulse number where the pulse period alternation pattern begins); (vi) long pulse period (ms, time between two consecutive pulses after the alternation start characterized by long pulse period); and (vii) short pulse period (ms, time between two consecutive pulses after the alternation start characterized by short pulse period).
The Stereotyped Trains of Fast Repeated Pulses (STFRP; [39]; sample size N = 15) were characterized by measuring the following acoustic features: (i) sound duration (ms), (ii) peak frequency of the call (Hz); (iii) 5% frequency (Hz, the frequency that divides the spectral content into two intervals containing 5% and 95% of the energy); (iv) center frequency (Hz, the frequency that divides the spectral content into two intervals of equal energy), and (v) 95% frequency (Hz). Additional measured features were (i) number of trains, (ii) single train duration (ms, measured from the onset of the first pulse to the onset of the last pulse of each train), (iii) train period (ms, interval between the onset of the last pulse of one train and the onset of the first pulse of the consecutive train).

2.2.3. Sound Pressure Levels Analysis

According to ISO standards [50], the Sound Pressure Level (SPL) is defined as the mean-square sound pressure averaged over a specified time interval and it is expressed as a level in decibels relative to a reference sound pressure value, namely of 1 μPa in water; it can be measured as:
S P L = 10 · l o g 10 1 T 0 T p ( t ) 2 d t p 0 2 = 10 · l o g 10 p r m s p 0 2 = 20 · l o g 10 p r m s p 0 dB   re   1   µ Pa
where T is integration time,
  • p is the pressure recorded by hydrophone,
  • p0 is the reference pressure.
Sound pressure levels (SPLs) were calculated using a Python code developed within the SOUNDSCAPE Project (https://anp.soundscape.ve.ismar.cnr.it/; accessed on 1 February 2022), according to [51,52]. For each wav 1 h-file, 1-sec segments were read and processed recursively (i.e., 48,000-digit data, being the Sample Rate equal to 48,000) with a Discrete Fourier Transform (DFT) analysis. Then, for each 1/3-octave band, the SPL averaged over 1 s was calculated. Furthermore, a frequency-dependent sensitivity was applied. Twenty seconds averaged SPLs were then calculated from 1 s averaged SPLs and they were used as base to obtain other statistics, such as hourly averages, following the recommendations in [52].
To better compare different periods, single SPL values were calculated per each 1 h-file corresponding to (i) the low-frequency range (SPLsLF, range: 55–2245 Hz), and to (ii) the high-frequency range (SPLsHF, range: 2245–22,627 Hz) by summing the energy of the corresponding 1/3 octave bands by a log-sum in the dB domain.

2.2.4. Statistical Analysis

For comparing the collected data, statistical analyses were performed with non-parametric tests, with an alpha level of 0.05: (1) Mann–Whitney U-Test was used for temporal comparisons of biophony or anthrophony abundance between the two survey periods (NTS vs. TS) and between different circadian periods (day vs. night, calculated per each season in correspondence of the sunset and sunrise time) along with the same survey; (2) Spearman rank correlation was used to correlate the biophony abundance with the corresponding SPLs values. The percentage of each 1-h recorded file containing the target signals (fish, dolphin, boat) was used as a proxy of their relative abundance (refer to paragraph 2.2.1 for full explanation).
All statistical tests were run using SPSS 17.0 for Windows (SPSS, Inc., Chicago, IL, USA).

3. Results

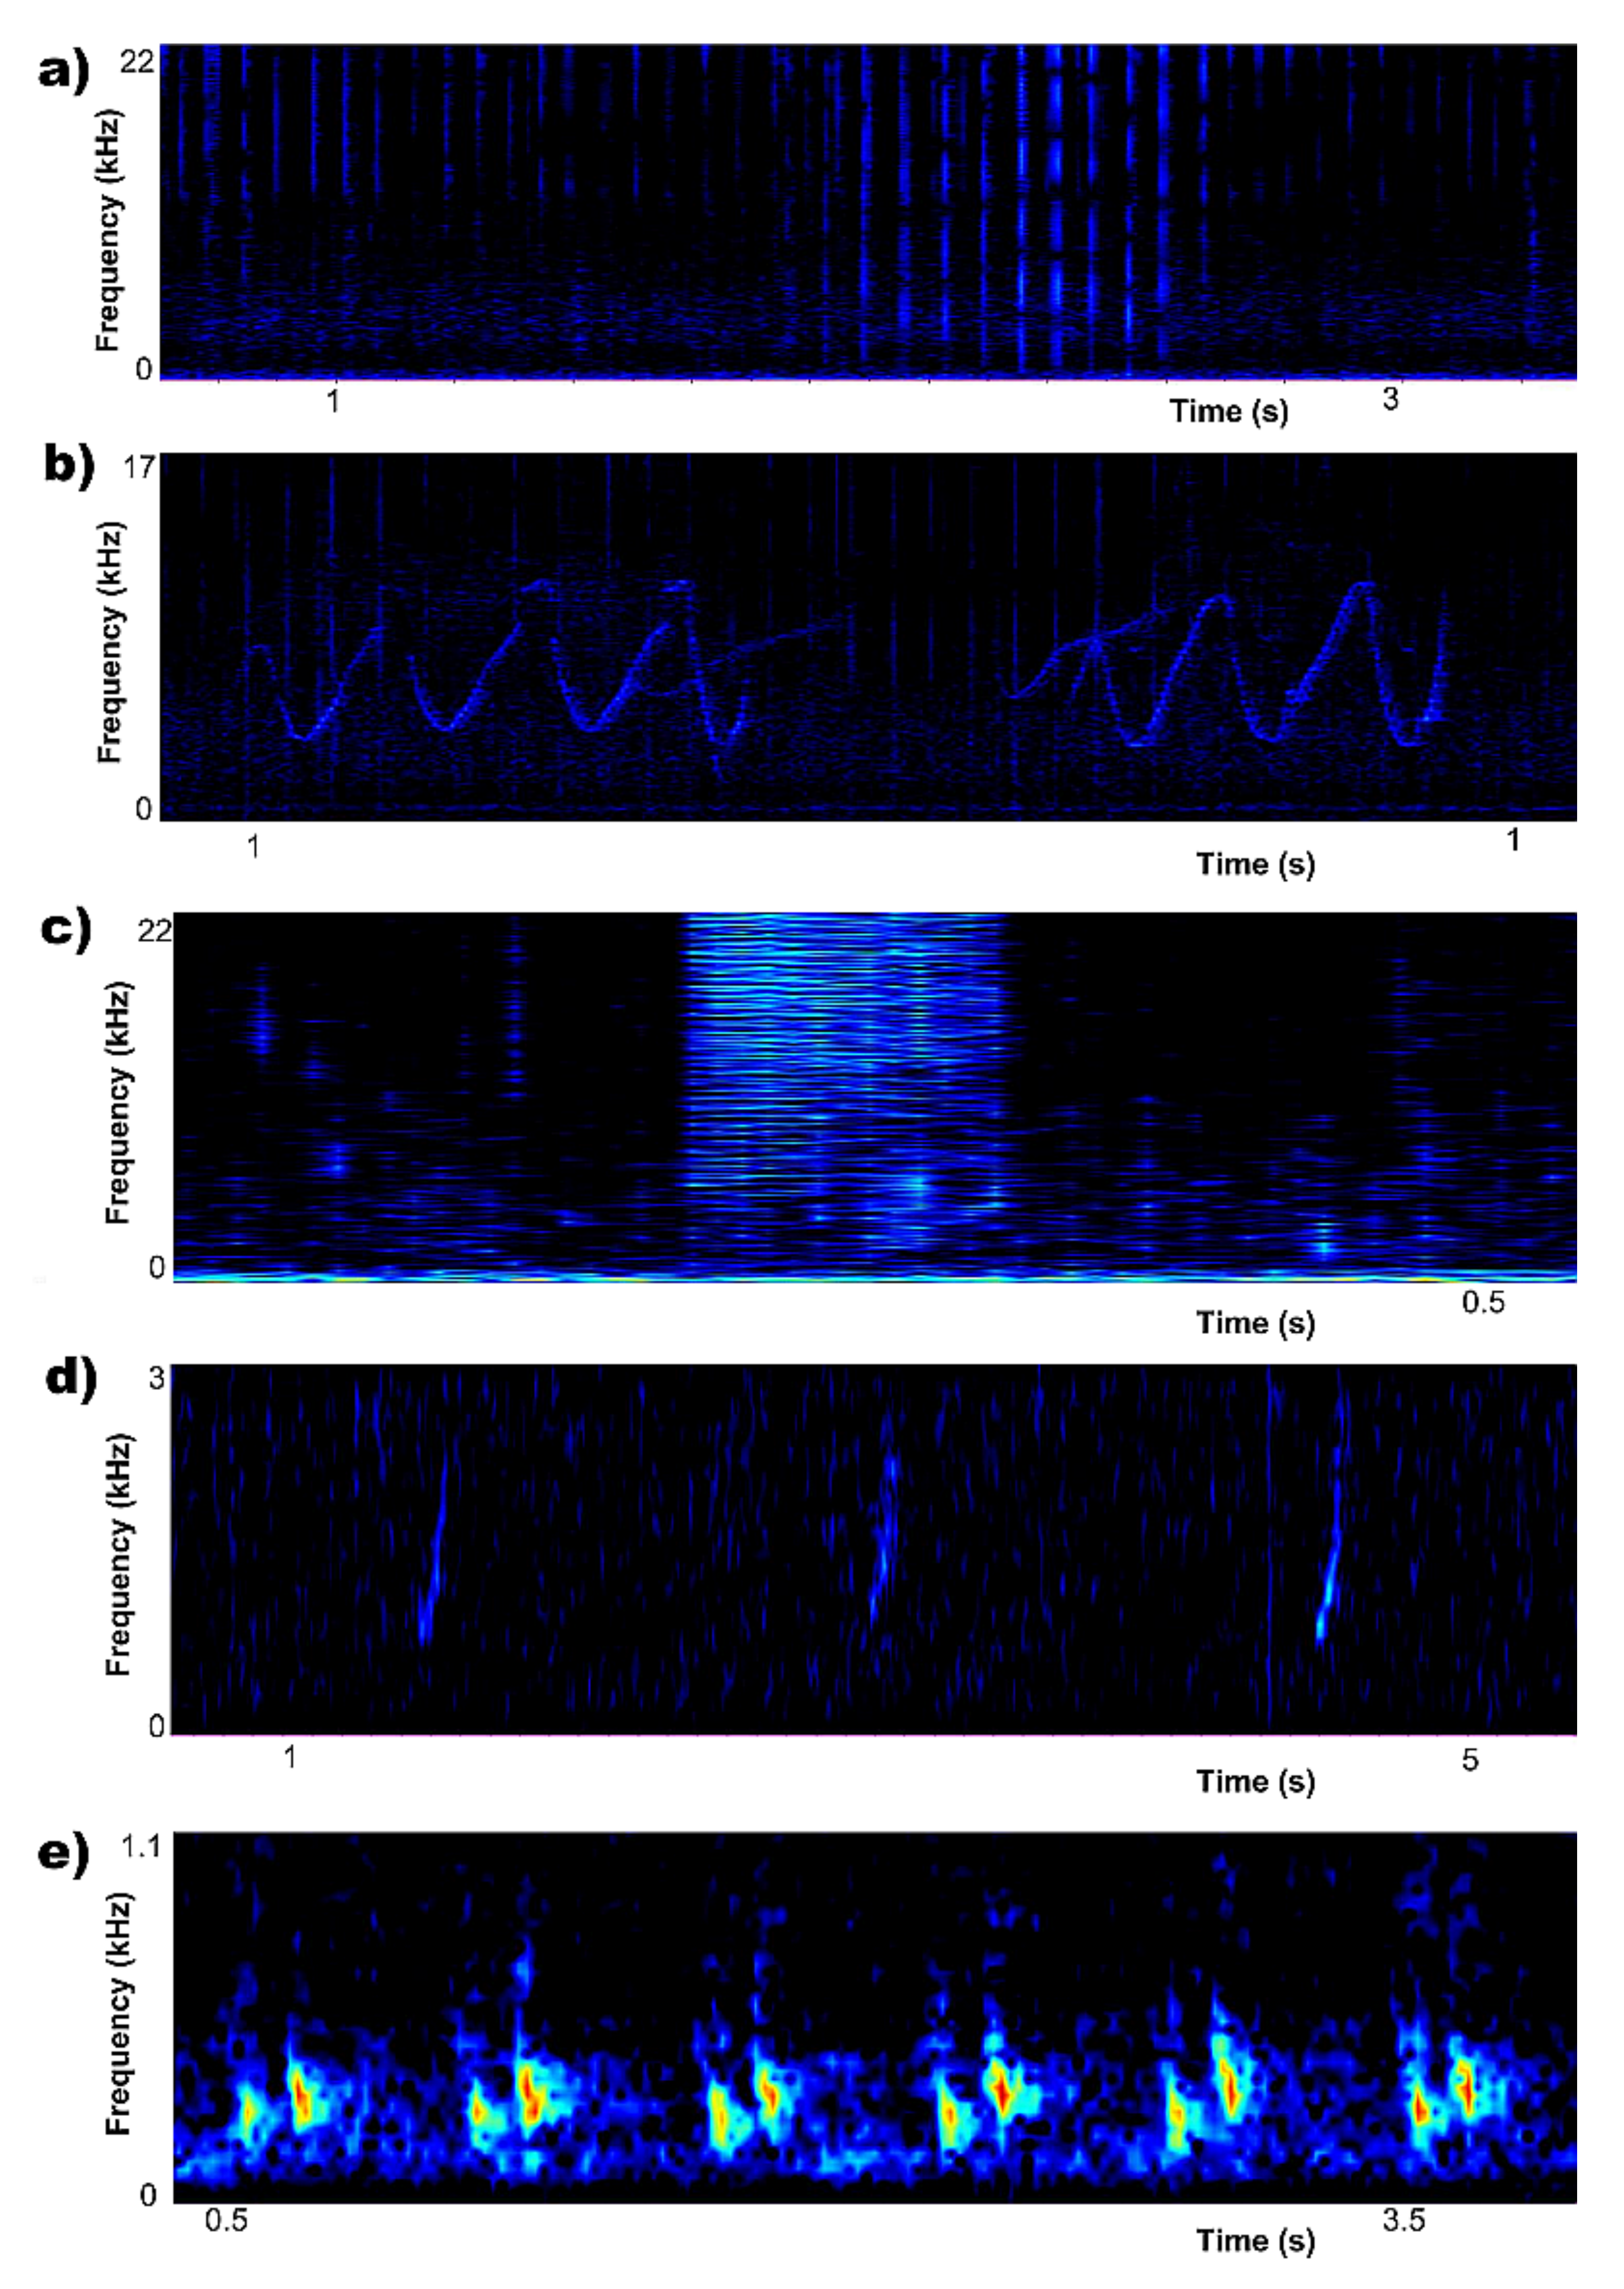
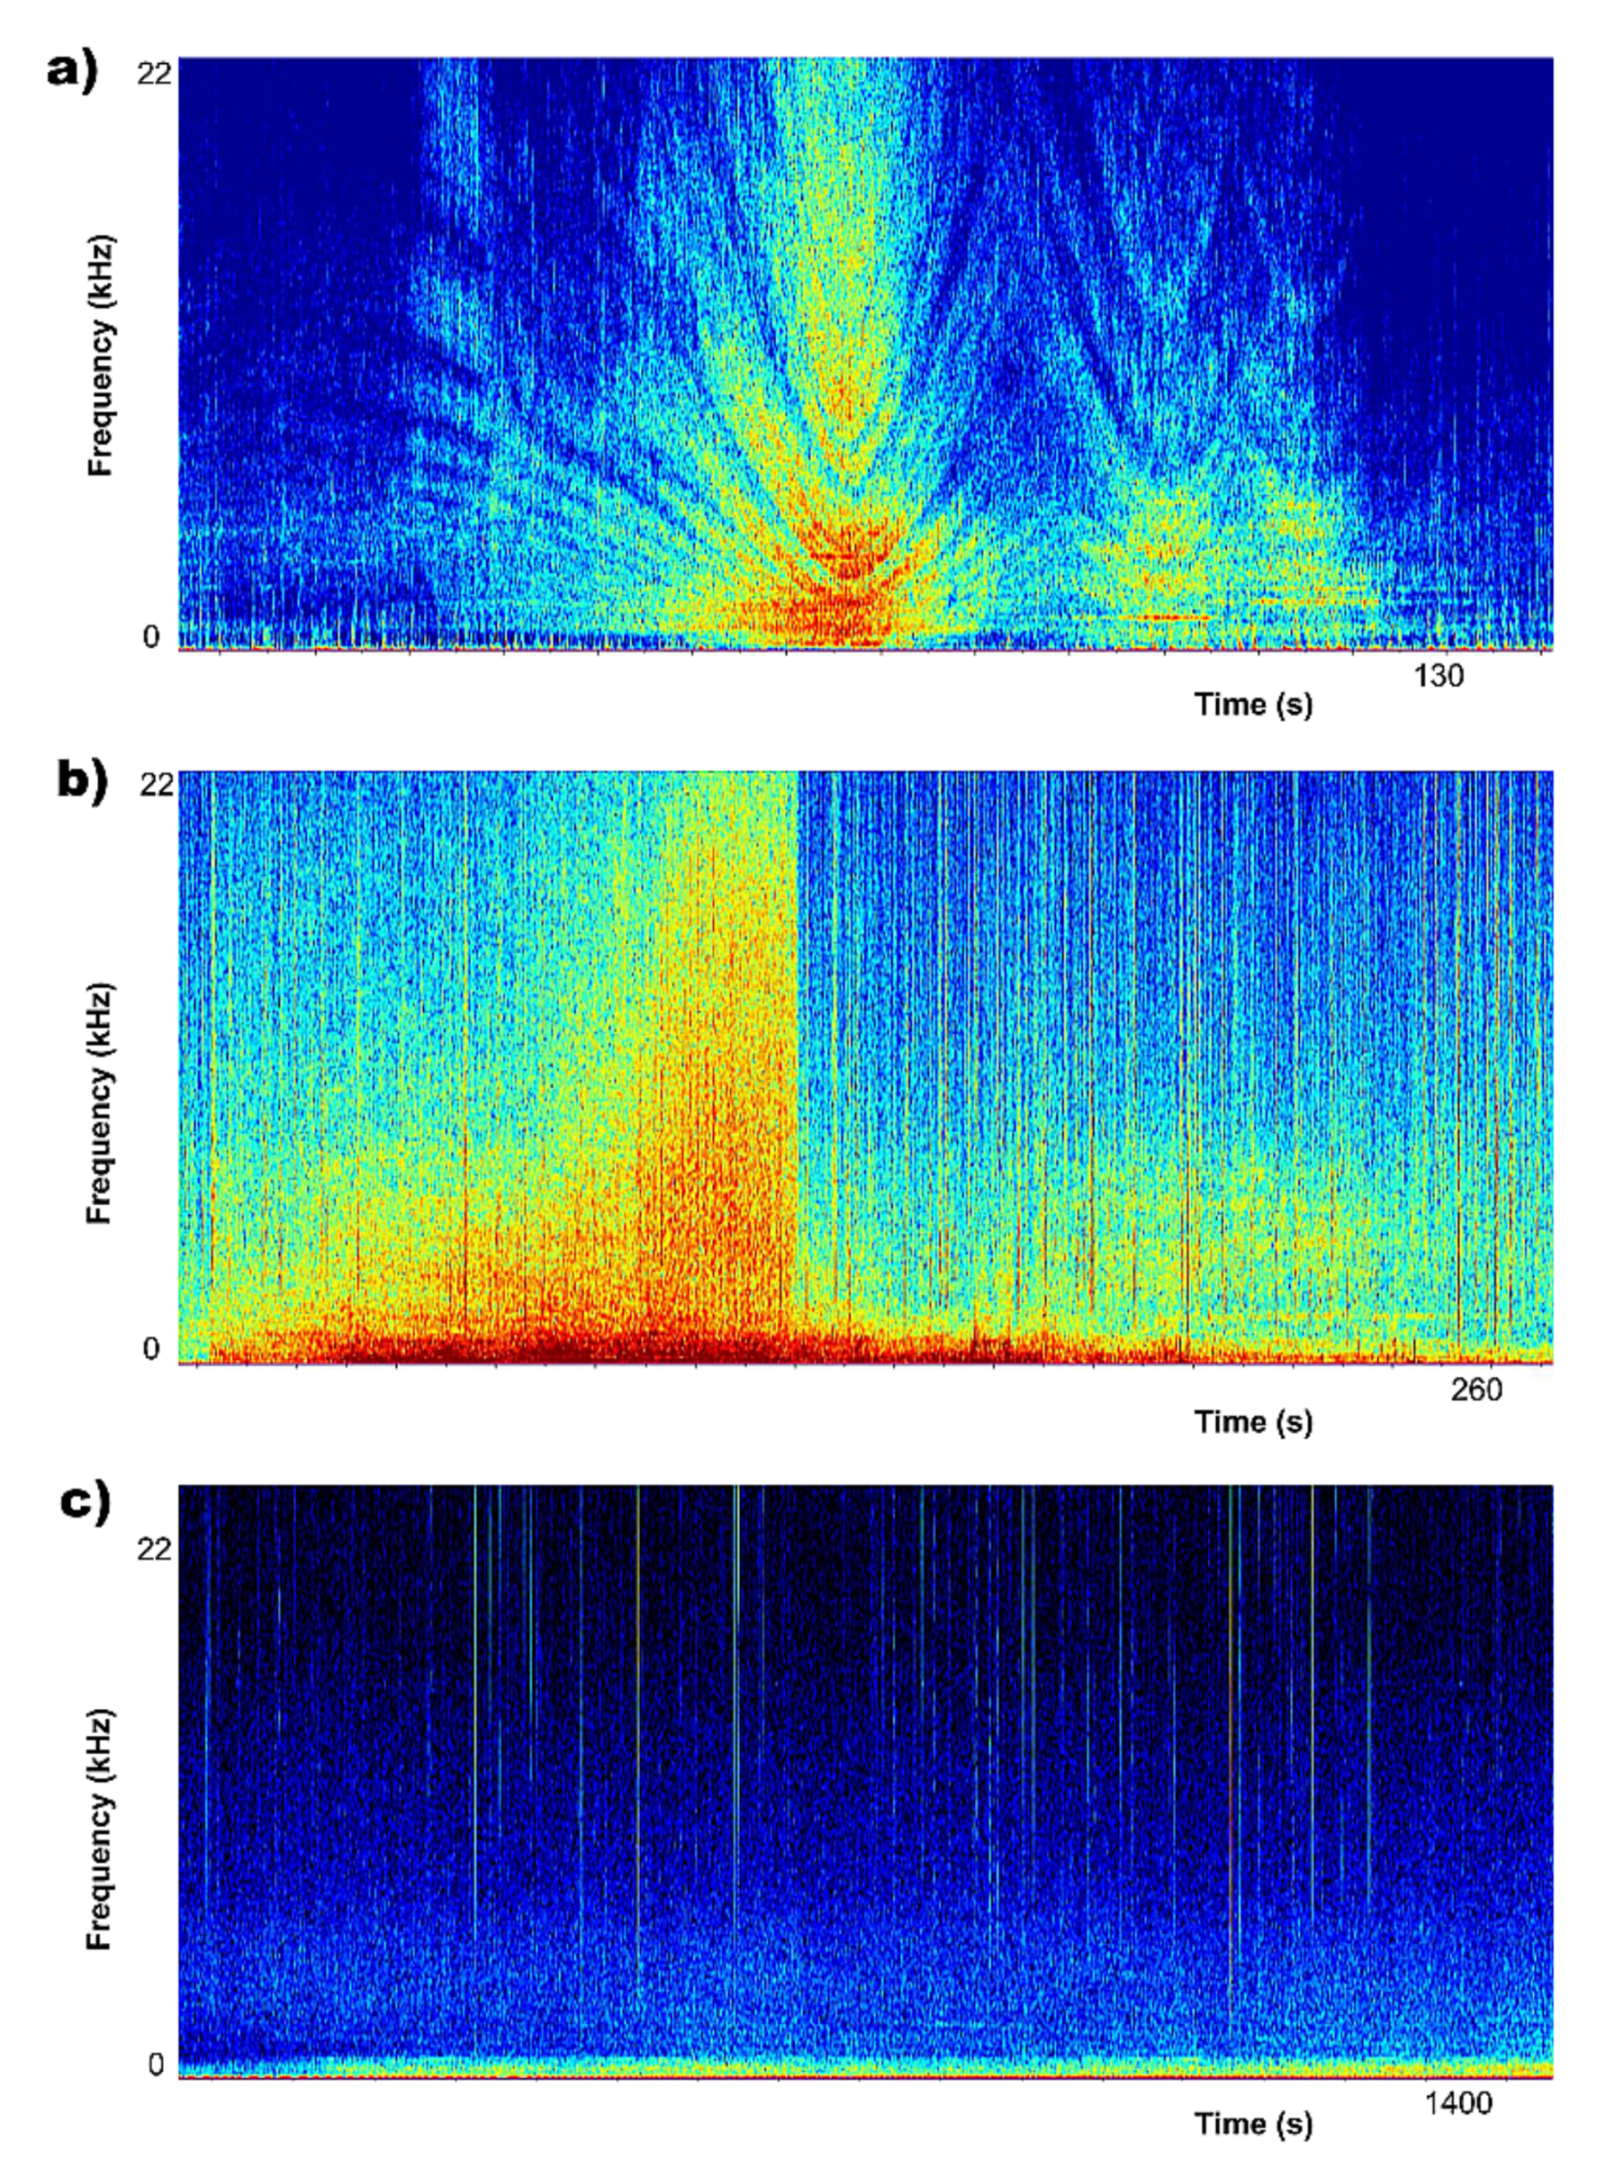
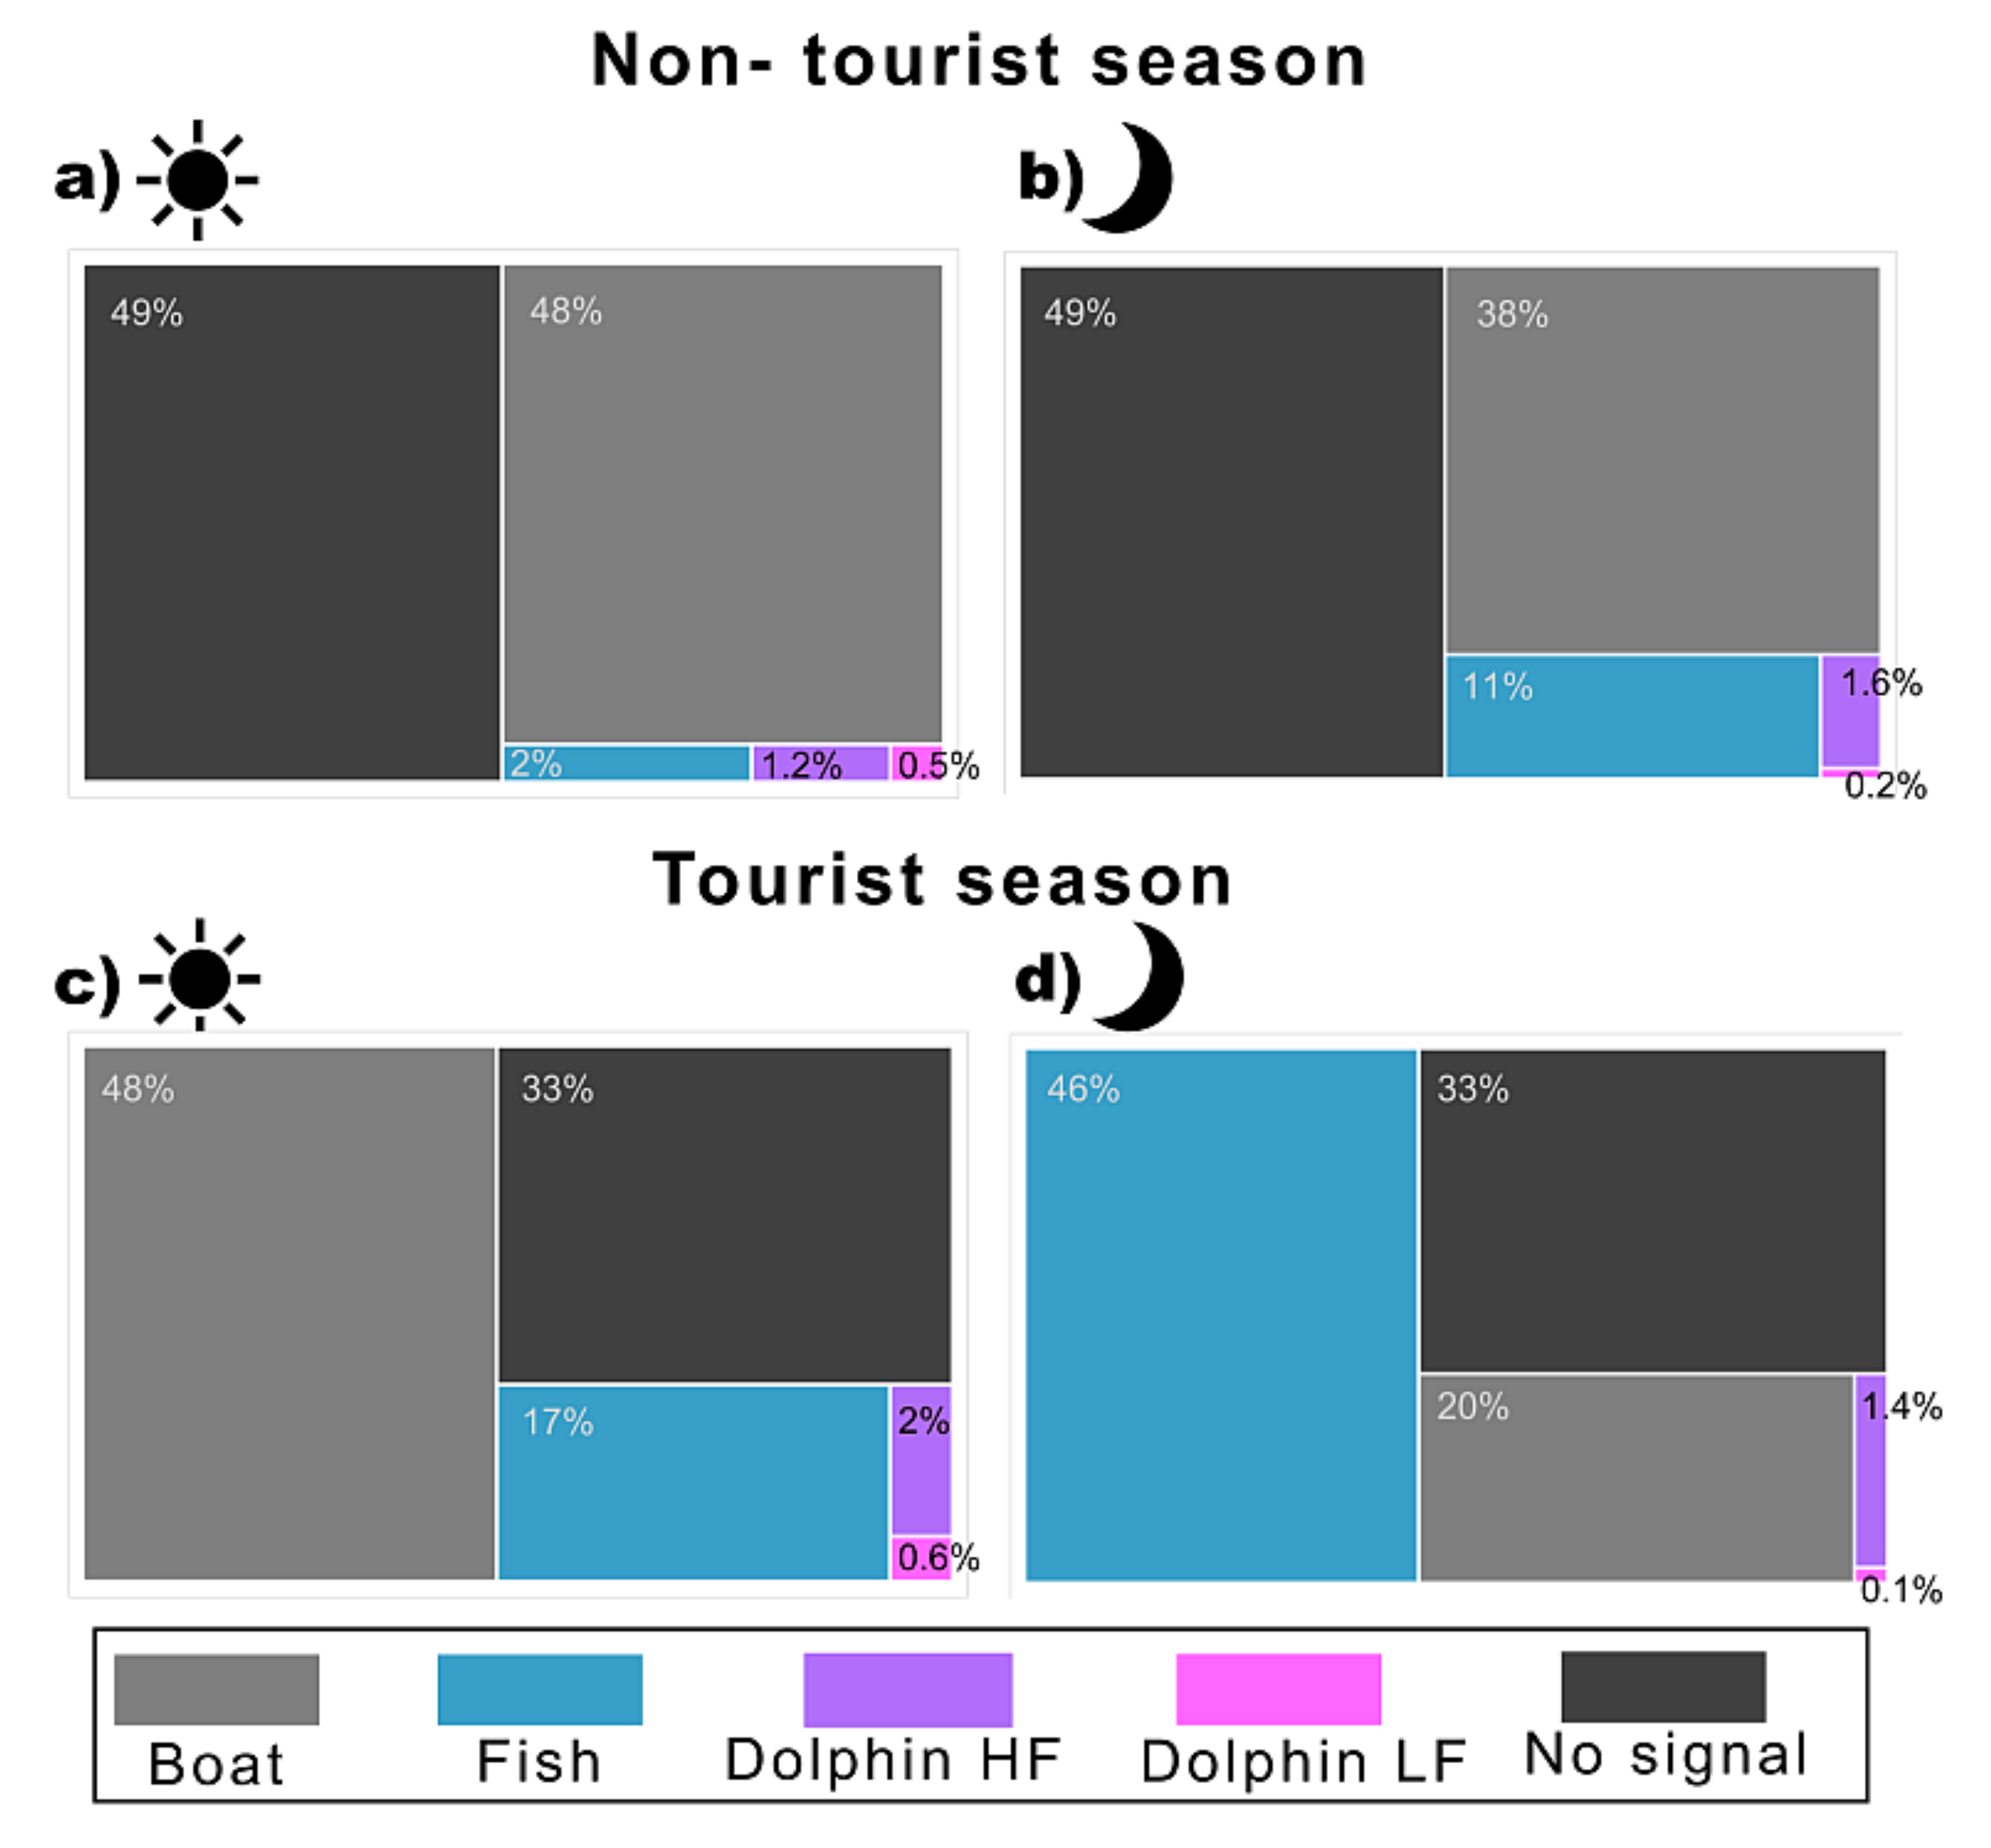
3.1. Biophony and Anthrophony Characterizing the Local Soundscape
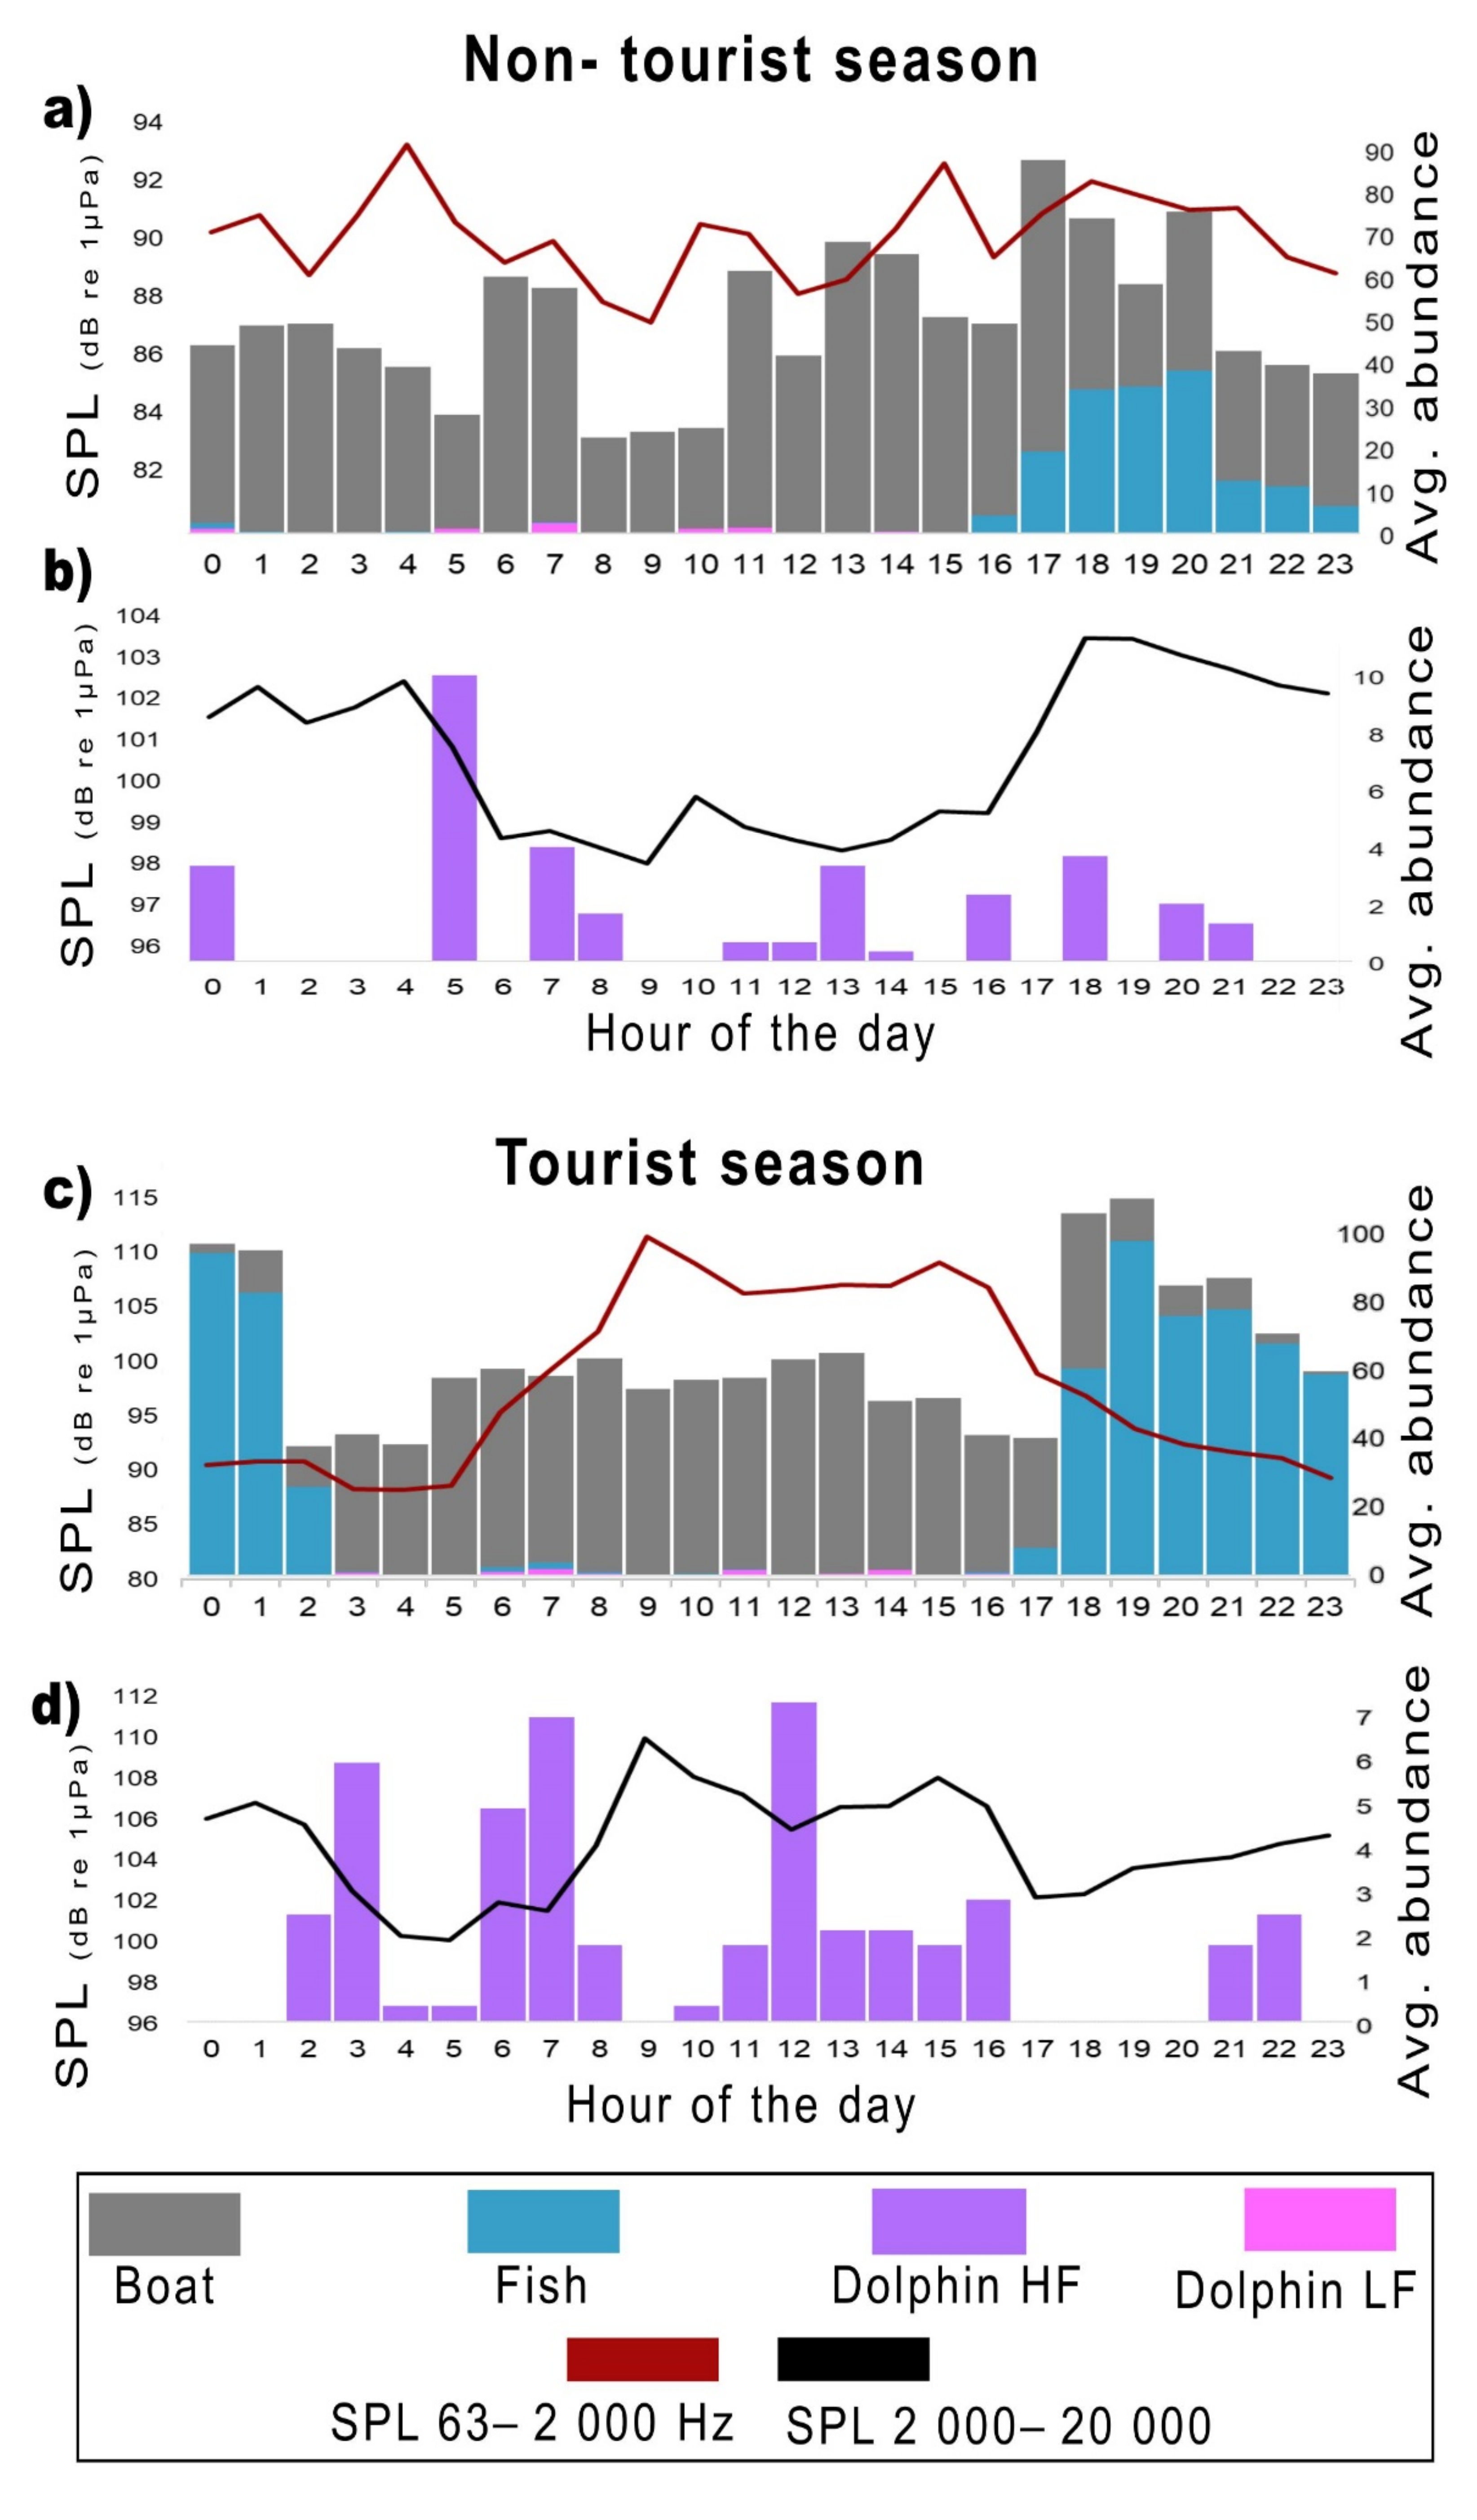
The most abundant sources of biophonical sounds were impulsive invertebrate sounds and fish sounds, with a smaller contribution given by dolphins. At an aural and visual inspection of the recordings, snapping shrimps (genera Alpheus and Synalpheus) were found to saturate the high-frequency soundscape all day long, in both NTS and TS.
Two fish sound types dominated the local soundscape at the low-frequency band (below 2 kHz) (Figure 3). The first is characterized by a rhythmical alternation of short and long pulse periods (Figure 3a); this rhythmical alternation of pulse intervals can be considered as an acoustic tag for the Roche’s snake blenny (Ophidion rochei) males, as it is related to sonic mechanism dynamics and was never described in any other Mediterranean fish species [11,53,54]. In some files, sounds with different intensities partially overlapped, indicating the presence of more than one vocalizing individual. Table 1 reports the descriptive statistics (mean, SD and c.v. %) of features characterizing the Ophidion rochei sounds recorded in the Lošinj area, which could be used for comparisons with [11].
The second sound type also presents a highly stereotyped temporal structure: it is indeed a stereotypical train of 6 bursts of fast repeated pulses (i.e., pulse period < 4 ms; see Figure 3b). Although this fish sound type has yet to be identified at the species level, its unique temporal structure matches with that reported in a Western Mediterranean canyon by [39] and labeled as Stereotyped Trains of Fast Repeated Pulses (STFRP). Table 2 can be used for comparisons with [39].
Many STFRP and Ophidion rochei sounds were produced simultaneously and they partially overlap (Figure 3c), showing the simultaneous presence of both species at the study site.
A dolphin sound type was also found in the low-frequency band, i.e., the low-frequency narrow-band calls (LFN), here defined as short tonal signals (<1 s) with frequency range usually being under 1 kHz (Figure 4e; [44,55]; hereafter also labeled as ‘Dolphin Low Frequency’). Further, many other sound types attributable to bottlenose dolphins according to literature have been detected in the higher frequency band (above 2 kHz; Figure 4a–d; hereafter also labeled as ‘Dolphins High Frequency’), including
(a)
echolocation click trains (Figure 4a), i.e., short and intense broadband sounds with ultrasonic frequencies, generated in rapid succession [41];
(b)
whistles (Figure 4b), i.e., frequency-modulated narrow-band tonal sounds which were longer than 0.1 s in duration and had at least part of their fundamental frequency above 3 kHz [42,56,57];
(c)
burst pulse (BP; Figure 4c), i.e., horizontal harmonic banded sounds in which clicks were aurally and visually indiscernible in the spectrogram display to the human observer with an inter-click-intervals (ICI) lower than 10 ms [43,58];
(d)
chirps (Figure 4d), i.e., short tonal sounds that occurred over a large frequency with a maximum allowable length of 0.1 s [47].
Figure 4. Spectrograms of (a) broadband echolocation clicks, (b) whistles, (c) burst pulses (BP), (d) chirps and spectrogram of (e) low-frequency narrow-band calls (LFN) recorded in the study area. (Hanning window, FFT1024, frequency resolution 23.4 Hz).
Jmse 10 00300 g004
Brays, i.e., distinct vocal units consisting of two sound types such as a BP sound followed by a short LFN sound [42,47,59], were never found in the analyzed acoustic recording although present in the literature. Echolocation clicks types were the most detected signals.
Table 3 summarizes the number of vocalizations characterized by a good signal to noise ratio, separated per sound type, that were found per tested period during night and day.
The acoustic data collected in the Lošinj archipelago inlets were dominated by mechanical noise generated by local man-made activities, being the boat noise present on average in at least one-third of the recordings (see also Table 4). The irregular transit of boats (Figure 5) contributes to both the high and low-frequency bands: their noise consisted of low-frequency tonal signals but also broadband cavitation sounds, showing the Lloyd mirror effect [49] when vessels passed near the recorder.

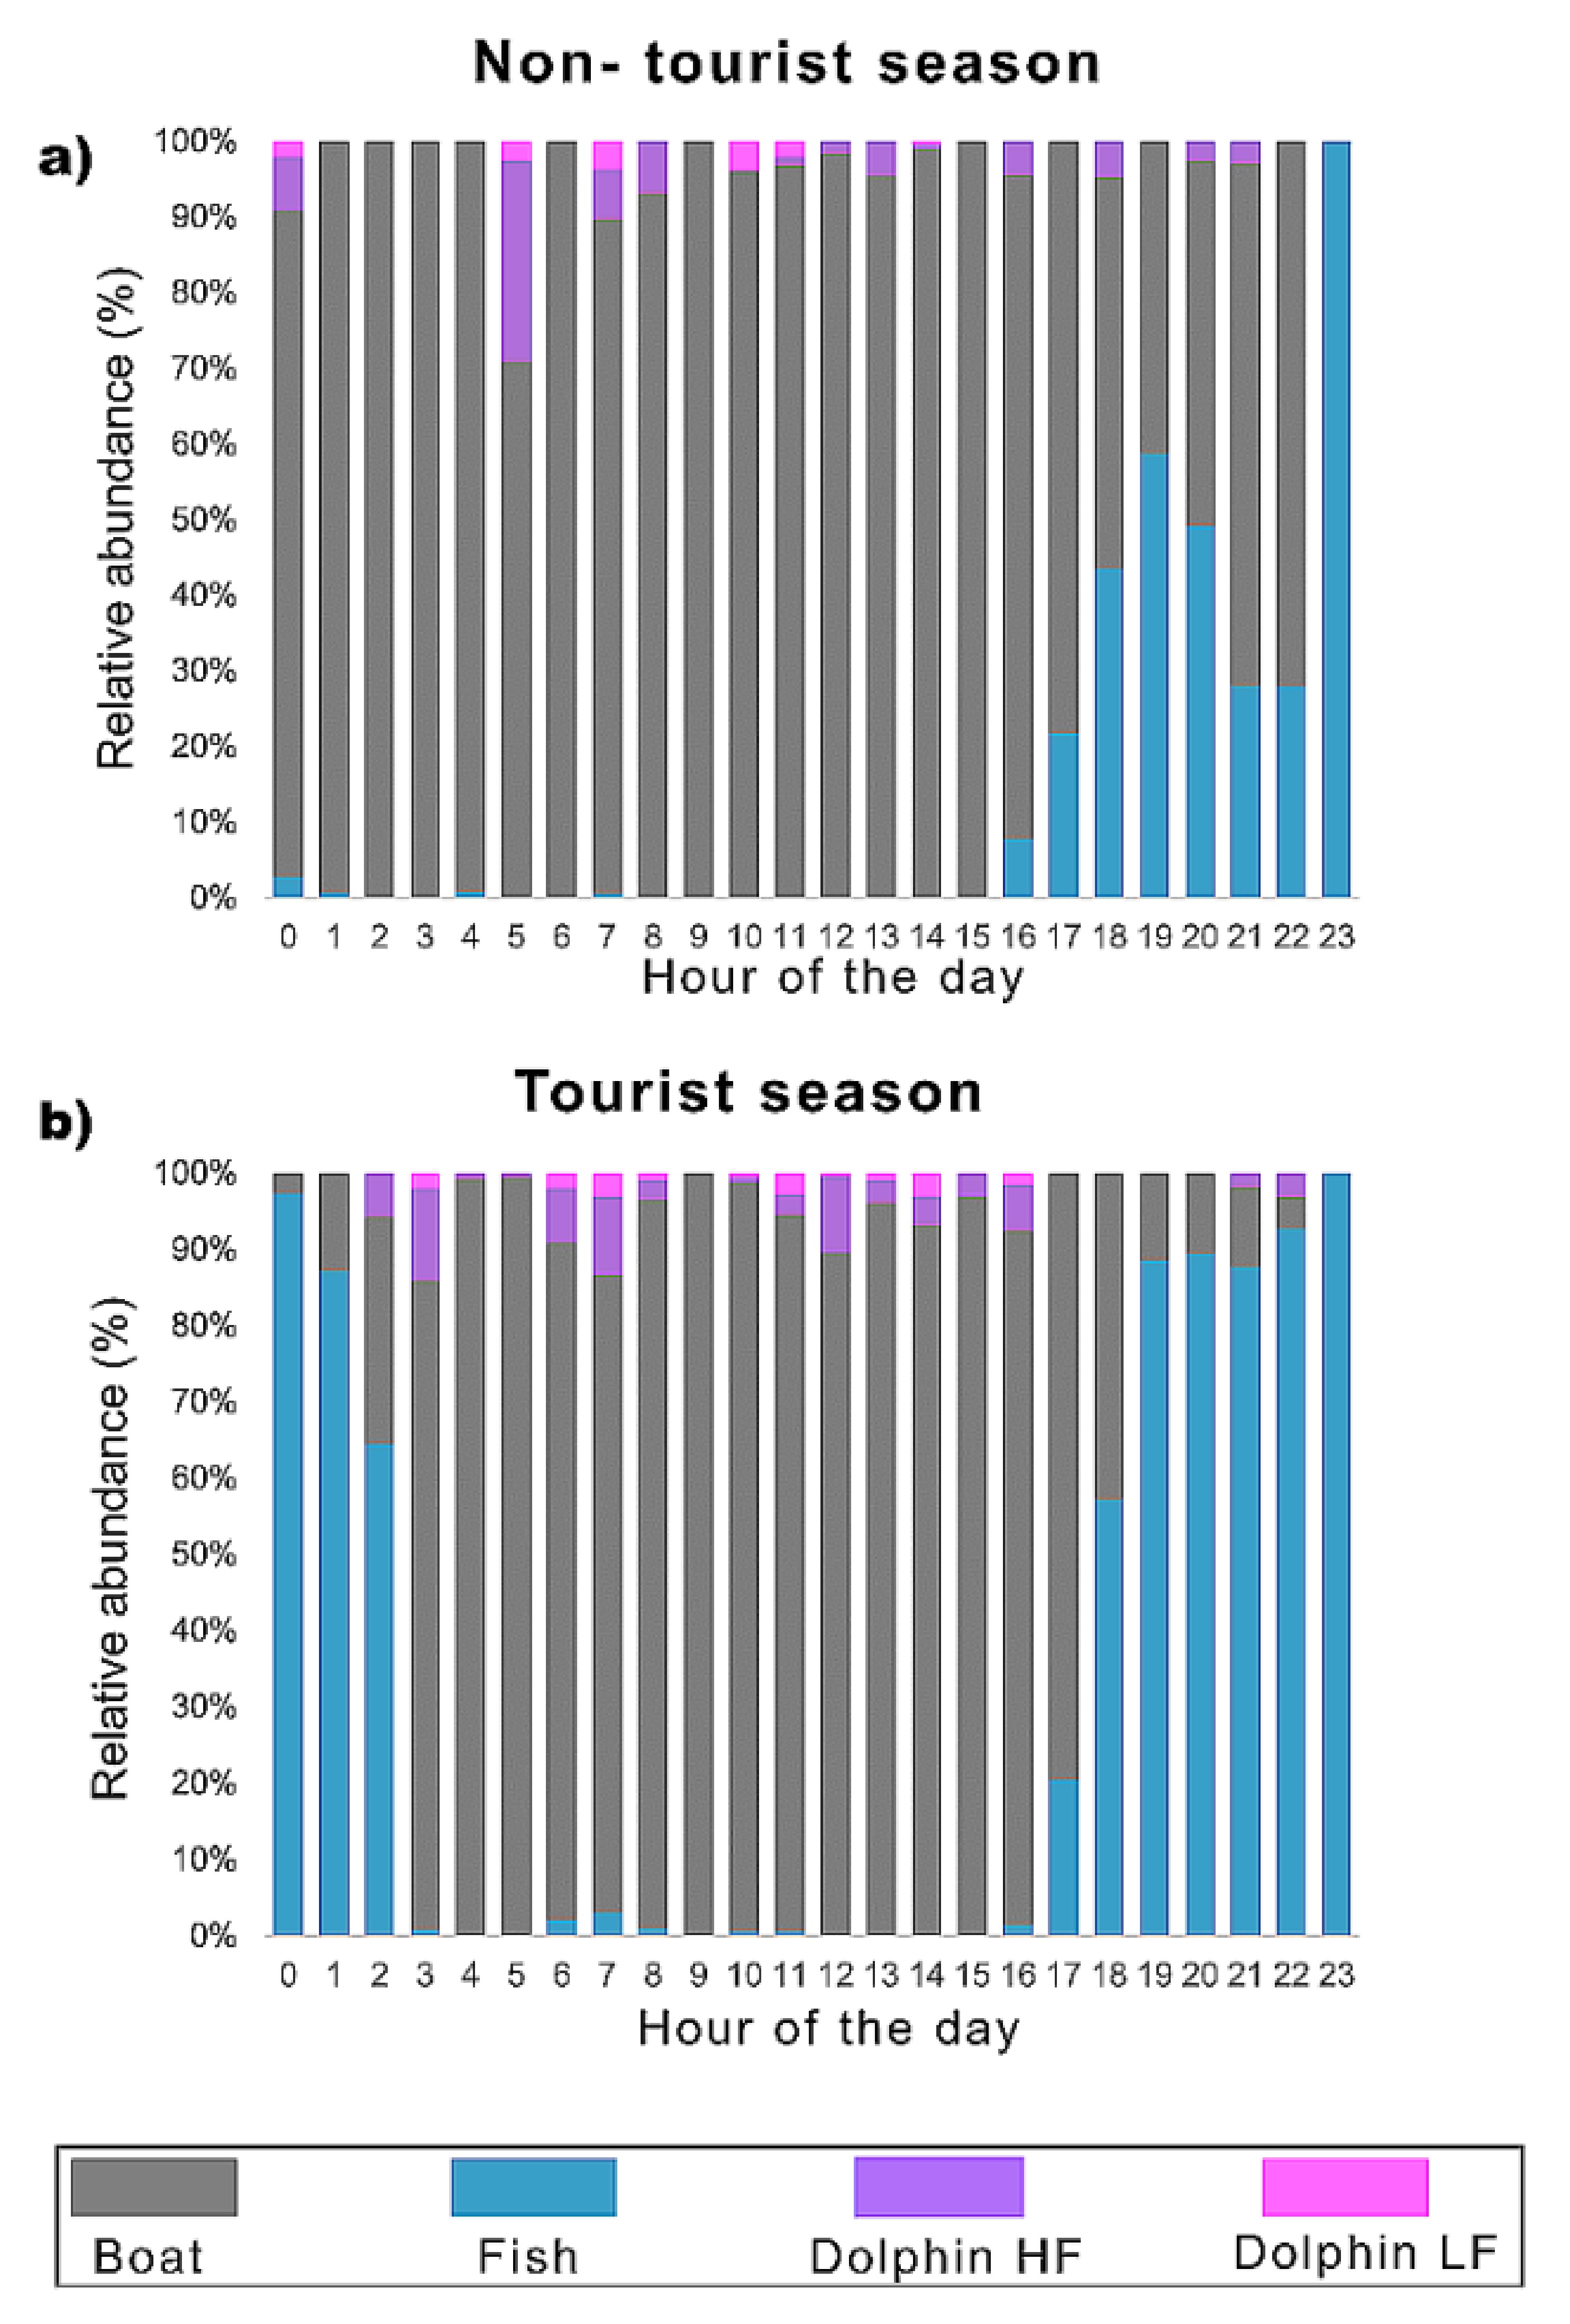
3.2. Temporal Distribution of the Biophony and Anthrophony of the Local Soundscape

Fish sounds were responsible for major seasonal and daily changes in the biophony of the local soundscape. As shown in Table 4, there is a variation between the Non-Tourist and Tourist Season in the abundance of fish but not of dolphin vocalizations. This is particularly evident during the night period, as it is visualized in Figure 6: here it is clearly visible that fish sounds were produced mainly after the sunset whereas dolphin vocalizations were more randomly distributed along the 24 h.
More in detail, during NTS the presence of fish sounds changed significantly according to the recording time (Mann–Whitney, U = 1190, p = 0.004), with fish sound relative abundance increasing from an average of 2.3% of the sample (min per hour) during the day (7 a.m.–5 p.m.) to 10.5% of the sample (min per hour) during the night (6 p.m.–6 a.m.). This was not the case for dolphin LFN vocalizations (0.5 vs. 1.9%, Mann–Whitney, U = 3689, p = 0.236) nor for their other dolphin vocalizations (1.3 vs. 3.8%, Mann–Whitney, U = 1583, p = 0.73).
During the TS, fish sounds became even more common along the whole 24 h; their relative abundance increased significantly from an average of 16.6% of the sample (min per hour) during the day (6 a.m.–8 p.m.) to 45.6% of the sample (min per hour) during night (9 p.m.–5 a.m.) recordings (Mann–Whitney, U = 3887.5, p = 0.000). The high-frequency dolphin vocalizations were still randomly distributed (2% during the day vs. 1.4% during the night; Mann-Whitney, U = 1639, p = 0.691); the dolphin LFN vocalizations that were significantly lower during the day than during the night recordings (0.6% vs. 1.9%, Mann-Whitney, U = 1501, p = 0.043).
Figure 7 summarizes the average distribution of relative abundances of biophonical and anthrophonical categories of interest per clock hour. The daily representations of community composition and of boat noise relative presence related to TS and NTS are further displayed in Figure S1 in the Supplementary, in order to visualize the intra-period variability of the biophony relative abundance.
As shown in Figure 6 and Figure 7, boat noise was found to be extremely common in the acoustic files not only during the TS, as expected, but also during the NTS, with no significant difference between these two periods (see Table 4). It has to be noticed, however, that boat noise abundance was comparable between daytime and night-time during NTS (47.2 vs. 38.3% on average, respectively) but it was predominant during the daytime in TS (47.6 vs. 19.5% on average, respectively). The temporal overlap between boat noise and fish vocalizations was generally low (Figure 7), with particular regard to the Tourist season, due to the fish sounds being mostly produced during the night.

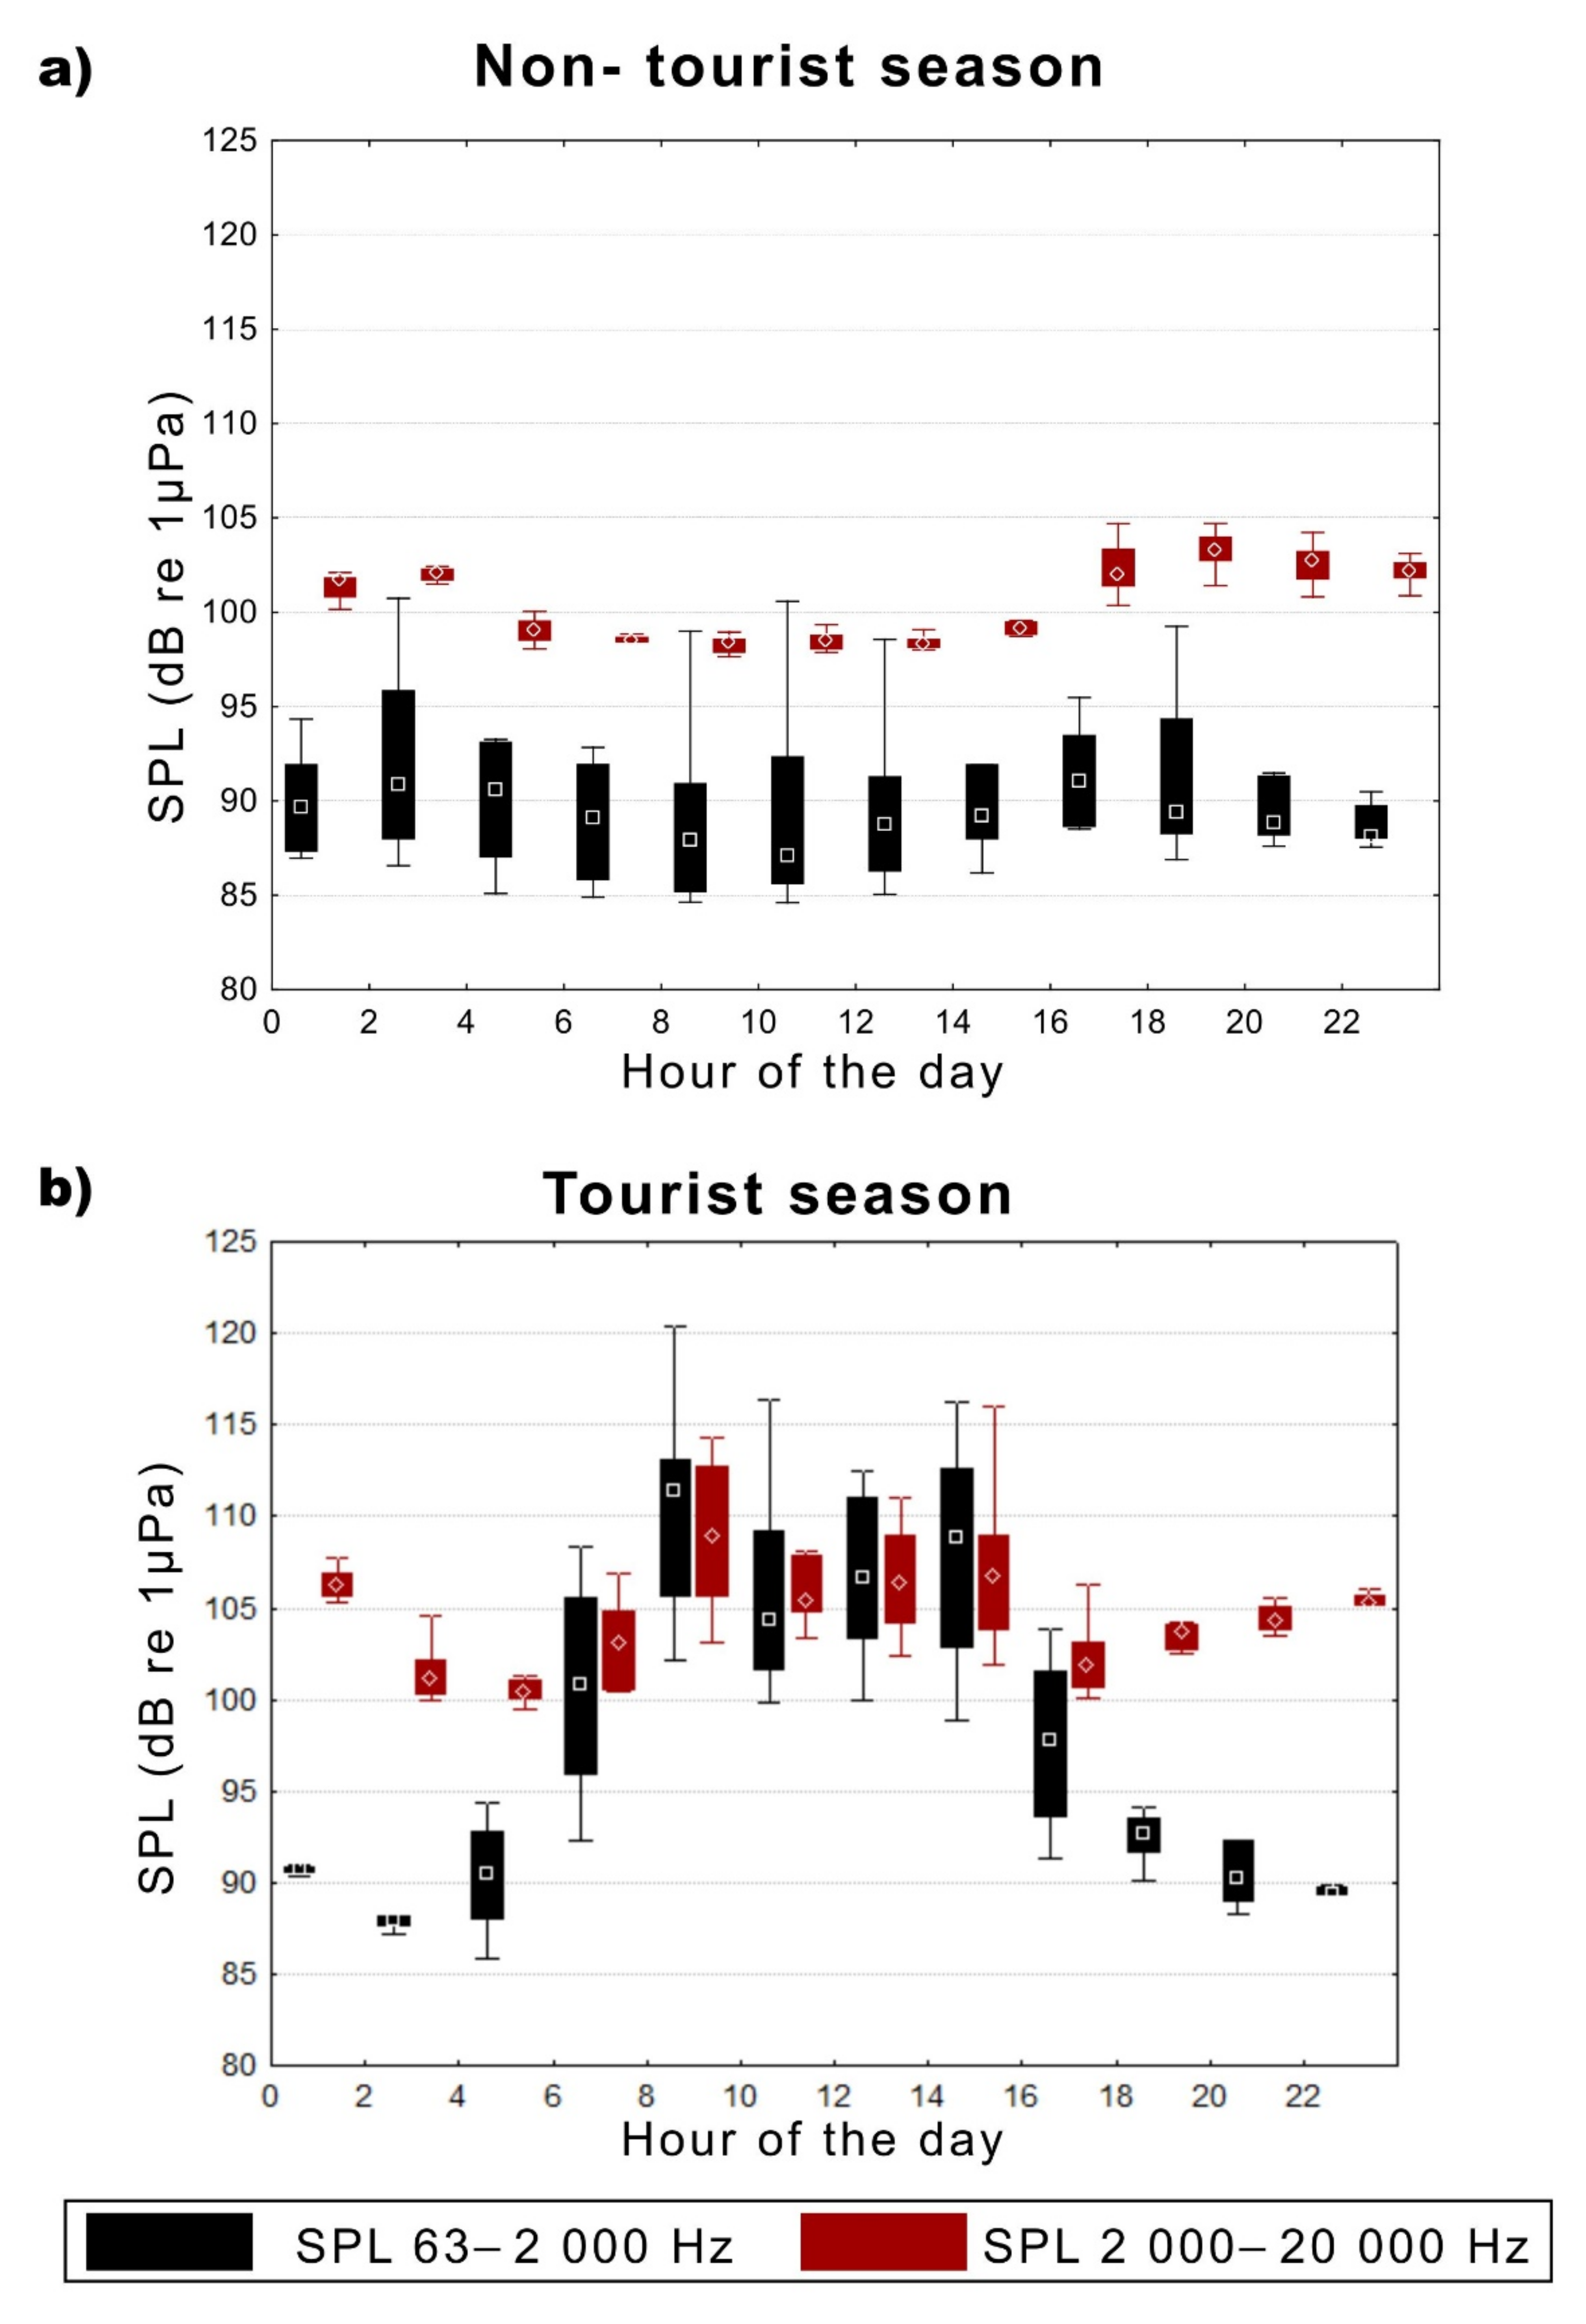
3.3. Sound Pressure Levels (SPLs) in the Study Area

The soundscape at the Lošinj area is here described also through the SPL values, calculated for both the low frequency (63–2000 Hz; SPLsLF) and high frequency (2000–20,000 Hz; SPLsHF). Seasonal variation is highlighted by the SPLsLF values in most of the diurnal hours: they were found mostly below 95 dB re 1 µPa during NTS but they raised clearly above this value during the TS (Figure 8); similarly, the HF sound levels were above 105 dB re 1 µPa during the central part of the day during the TS.
Figure 9 shows the average relative abundance of fish vocalizations and boat noise and the corresponding average SPLs values calculated for NTS and TS over a 24-h cycle. It appears clear that the SPLs values were generally poorly responsive to the considered inputs during NTS, being influenced by anthrophony during TS.
The correlations between the SPLsLF and the percentage of minutes containing (i) fish sounds, (ii) boat noise and (iii) LFN dolphin sounds were not significant during NTS (Table 5). Similarly, no correlation was found between SPLHF and the percentage of minutes containing HF dolphin sounds during both seasons (Spearman rank correlations, rs  =  0.07, p-value  =  0.44 for TS; rs  =  0.13, p-value = 0.13 for NTS).
During TS SPLsLF were positively correlated to the boat noise and LFN dolphin sound abundance and negatively correlated to fish sound abundance, as visualized in Figure 9c.
During TS a clear dichotomous pattern can be observed with biophony being abundant at night and anthrophony distributed mostly during the day. The higher SPL values found during the day vs. the night (Figure 9) can likely be explained by boats producing noise whose intensity is far higher than the fish sounds. In its turn, this results in a negative correlation between SPLsLF and fish sound relative abundance (Table 5).

4. Discussion

This study provides the first snapshot of the marine soundscape in a resident bottlenose dolphin community’s habitat, Cres-Lošinj Natura 2000 SCI, informing on the presence of the vocally active marine species. The overall results highlighted two dominant sources of acoustic activity, identified mainly across the low-frequency range (below 2 kHz), i.e., fish vocalizations and the noise input generated by the passing boats, whereas the high-frequency range (above 2 kHz) was saturated by the snapping shrimps sounds. Although fish sounds were recorded both during the Non-Tourist (NTS) and the Tourist Season (TS), they became particularly dominant in the local soundscape during the summer period, being mostly emitted after sunset and during the nocturnal hours. Similar temporal variations of biophony are reported for different coastal habitats [8,60]; they reflect animals’ vocal activity patterns and often depend on the influence of abiotic features (e.g., light levels, tides and lunar cycles; [61]) and/or animals endogenous-related rhythms connected to seasonal and nychthemeral cycles or behaviors [62,63].
Two fish sound types were particularly frequent in the recordings. The analysis of their temporal and spectral features confirms their association with the previously described sound types. In its turn, this allowed (i) to recognize the emitting species in one case and (ii) to report the first record for the Adriatic Sea and more in general for the Eastern Mediterranean Sea in the other case.
The first sound type is produced by a behaviorally cryptic fish species, the cusk-eel Ophidion rochei (Ophidiiformes), an endemic sand-dwelling fish living at depths ranging from a few meters to at least −150 m [64]. O. rochei is classified as Data Deficient in the IUCN Red List and it has been described as uncommon and rare [65,66], possibly due to this psammophilous behavior. During the reproductive period (i.e., June–September [64]), O. rochei males produce highly stereotyped nocturnal courtship calls characterized by a long duration and pulse period alternation between long and short intervals [35,54,67,68]. In accordance with previous studies, in the Lošinj area, O. rochei sounds were emitted at night.
So far, in the North Adriatic Sea, only a few specimens of O. rochei have been caught along the eastern coastline, in particular near Murter Island (middle Adriatic [65]), in the area of River Cetina Estuary (near town Omiš [64]) but also in the Kvarner area (northern Adriatic [69]). The catches were always at night (00 and 04 h), confirming this species to be a nocturnal predator. Along the Italian coast of the Northern Adriatic Sea, collection of O. rochei individuals was never reported. On the other hand, its sounds have been recorded during summer nights at the Natural Marine Reserve of Miramare (Trieste, Italy [11]). Similar to this case, the present study provided sufficient data to describe the Lošinj area as a reproductive site of the species. The high abundance of simultaneous sounds recorded with different intensities indicates that numerous callers were present on site.
The Stereotyped Trains of Fast Repeated Pulses (STFRP) is the second common fish sound type recorded in the study area. So far, this sound type was only reported in the Western Mediterranean Sea [6,39]. Although this sound type has been labeled differently in previous studies (STFRP [39], US, i.e., “upsweeping sound series with harmonics” [6]), the stereotypical nature of its temporal structure allowed for its identification, in previous and present studies. In the Western Mediterranean Sea, this sound type has been recorded in different habitats, ranging from the head of underwater canyons to coralligenous reefs [6,39]. In both studies, STFRP was relatively abundant, when considering the whole fish acoustic community; furthermore, its night-time emission could span several hours and was characterized by a bimodal abundance pattern (maximum abundances detected around sunset and before sunrise, i.e., 8 p.m. and 4 a.m. [39]).
In a Mediterranean canyon located in Corsica (France), STFRP was detected by both Static Acoustic Monitoring (i.e., SAM: hydrophone deployed on the sea bottom) and Mobile Acoustic Monitoring (i.e., MAM: hydrophone integrated into underwater gliders). The depth of the SAM sites ranged from 120 to 157 m, while the glider detected this sound type while moving inside the canyon and over its head at an average depth of 40 m over an average bottom depth of 100 m [39]. In coralligenous reefs located in Corsica and Provence-Alpes-Côte d’Azur, STFRP was found from a minimum depth of 35 m up to a maximum depth of 65 m, being especially abundant at a depth ranging from 55 to 65 m, and in association with structuring species such as red corals and gorgonians [6]. In the present study, this sound type was recorded from 4 p.m. to 1 a.m. in NTS and from 5 p.m. to 2 a.m. in TS, in an environment characterized by a sandy bottom at 46 m with a gentle slope. The emitting taxa of this sound type remain to be determined. However, our results, together with previous studies, suggest that this should be emitted by a relatively abundant taxa which colonize waters ranging from at least 40 to 160 m depth; likely, the emitting taxa are not demersal or source levels are enhanced. Further studies are needed to confirm these hypotheses.
Although fewer in number compared to fish vocalizations, almost all the dolphin sound types previously described in literature [41,42,43,44,46,47] were recorded in the study area. Of the overall dolphin vocalizations, the echolocation clicks were highly common, suggesting that the vocalizing animals were involved in detecting targets [70], likely during foraging. Since the area is inhabited by demersal fish species that local dolphins generally feed on [71], this hypothesis can be reliable. Once excluding the clicks, the number of the sound types characterized by a good signal-to-noise ratio—which indicates the presence of animals close to the hydrophone—was higher during TS than NTS. In this case, whistles and LFN were the most identified sound types. The LFN function in the dolphin acoustic repertoire has yet to be fully resolved, but they are mainly related to social interactions, being produced in heightened emotional contexts such as sexual activity and perhaps aggression [44,55]. Whistles, on the other hand, are known to encode identity information and promote group cohesion [72,73]. The daily distribution of both these sound types suggests that the dolphins’ social communication occurs mainly during the diurnal hours of the TS along the study area.
Generally speaking, the average percentage of abundance of HF and LF dolphin sounds was relatively low, and it did not change with seasons. Although the location where the hydrophone was placed falls inside one of the two hub areas usually shared by the local bottlenose dolphin individuals [74], unpredictable dolphin distribution and generally wide home ranges of the resident animals (mean 95% home range size for the local dolphin population is 1947 km2, [75]) may reflect in the scarcity of their signals across the five-day continuous period considered in this study. Further studies are required to investigate the temporal variability of dolphins’ acoustic presence in the area.
Boat noise was found on average in 37–42% of a 1-h acoustic recorded sample, indicating a massive contribution of the man-made noise input in the local soundscape, which was found to be not seasonal-related. This seems to be in contrast with previous research: [28] shows that the total number of leisure boats within the Lošinj archipelago significantly increased in TS. Nevertheless, the same study indicates a significant presence of vessels related to professional fishing activities (mainly trawlers and gillnetters) during the NTS in comparison with TS. The absence of a circadian pattern in boat noise during NTS and the daily distribution of boat noise during TS supports the hypothesis that anthrophony is mainly related to fishing activity in winter, being generated mainly by nautical tourism during the summer.
Although boat noise relative abundance is comparable between the seasons, background noise levels get clearly higher during the TS, in particular during the day. Source level for recreational boating is higher than for fishing activity, which is reflected by the positive correlation between SPL values and boat abundance found for TS. This is highly relevant since nautical tourism and, more precisely, recreational boating has already been found to have adverse effects on dolphins in the Cres-Lošinj SCI [28,29,71], affecting the animals home range sizes and leading to the adaptation of the emitted whistles to the local background noise, in accord to other cases of study [76,77].
From the methodological point of view, the present study stresses the important role of PAM in the study of a coastal habitat. In this context, approaches based on detection of sound types are the key for obtaining high-resolution information on the species at the community level, in accord to the literature [5,6,38,39,40]. Sound types needed to be detected, classified and counted, a process that can be achieved manually or automatically [5,39]. If automatic detection tools are better developed for marine mammals than for fish sound types, recent advancement in this sense are encouraging and need to be further expanded [78,79,80]. Here, manual analysis is suggested as the best approach for inspecting and characterizing vocal communities of unknown composition, for which the lack of knowledge on sound type diversity makes automatic detection not feasible.
The presented results provide the first description of the overall soundscape characterizing the Cres-Lošinj SCI inside and outside the TS; further studies are required to investigate spatial and seasonal variability.

5. Conclusions

Shallow, coastal areas are key habitats for many marine species, as is the case in the Cres-Lošinj archipelago. The here reported analysis of the local soundscape indicates the presence of many species, including fish and bottlenose dolphins, involved in crucial activities such as reproduction, social interactions and foraging. Additionally, this soundscape is highly affected by mechanical noise generated by boat traffic, resulting in an overlap between boating and biological activity. High underwater noise levels were found which were mainly distributed in the diurnal hours of the summer and likely generated by tourist activity. Such underwater noise pollution has already been identified about 10 years ago [27,28].
Living in noisy conditions involves constant adaptation of animals that on the other hand is energetically consuming and needs to be balanced with a higher food intake which is not always possible. Therefore, local mitigation measures for human-generated noise need to be included when developing future management plans for the Cres-Lošinj Natura 2000 SCI.

Supplementary Materials

The following supporting information can be downloaded at: https://www.mdpi.com/article/10.3390/jmse10020300/s1, Figure S1: Visualization of 5 days acoustic data, referring to the Non-Touristic (NTS; panels a–e) and Touristic Season (TS; panels f–i); daily distribution of the relative abundances of biophonical and anthrophonical categories of interest per clock hour (measured as % min per hour of recording). “Fish” includes fish sounds, irrespective of their sound types; “Dolphin HF” includes echolocation click trains, burst pulses, whistles and chirps; “Dolphin LF” includes low frequency narrow-band calls; “Boat” includes boat noises. The breaks in hours visible in some panels (e.g., a, b, e) represent absence of both presence of boat noise, fish and dolphin vocalization in that hour block.

Author Contributions

M.P. and N.R.-G. conceived and designed the study, the data collection and analysis; R.F. and M.R. collected the data; M.P. and R.F. manually analyzed the acoustic files and performed statistical analyses; A.P. calculated the SPLs values; M.B. identified the STFRT data and provided the graphical visualization of the data; M.R. created the map of the study area; M.P. wrote the original draft and all authors contributed to editing and final reviews of the paper. All authors have read and agreed to the published version of the manuscript.

Funding

SOUNDSCAPE project, funded by the European Union from the European Regional Development Fund through Interreg Italy-Croatia CBC Programme.

Institutional Review Board Statement

Ethical review and approval were waived for this study, due to the use of non-invasive sampling methods. Animals were not collected, and data were achieved by means of underwater records of sounds that are naturally produced.

Informed Consent Statement

Not applicable.

Data Availability Statement

The data presented in this study are available on request from the corresponding author.

Acknowledgments

We are very grateful to Marinela Cukrov Car for her help in data collection and Viliam Antoninić, Tihana Vučur Blazinić, Jeroen Hofs, Marta Laginja for their help in the first scrolling of the dataset. We thank Grgur Pleslić for revising the manuscript.

Conflicts of Interest

The authors declare no conflict of interest. The funders had no role in the design of the study; in the collection, analyses, or interpretation of data; in the writing of the manuscript, or in the decision to publish the results.

References

  1. Pijanowski, B.C.; Villanueva-Rivera, L.J.; Dumyahn, S.L.; Farina, A.; Krause, B.L.; Napoletano, B.M.; Gage, S.H.; Pieretti, N. Soundscape ecology: The science of sound in the landscape. BioScience 2011, 61, 203–216. [Google Scholar] [CrossRef] [Green Version]
  2. Lillis, A.; Eggleston, D.B.; Bohnenstiehl, D.R. Estuarine soundscapes: Distinct acoustic characteristics of oyster reefs compared to soft-bottom habitats. Mar. Ecol. Prog. Ser. 2014, 505, 1–17. [Google Scholar] [CrossRef] [Green Version]
  3. Farina, A.; Gage, S.H. Ecoacoustics: The Ecological Role of Sounds; John Wiley & Sons: Hoboken, NJ, USA, 2017; pp. 95–108. [Google Scholar]
  4. Farina, A. Ecoacoustics: A quantitative approach to investigate the ecological role of environmental sounds. Mathematics 2019, 7, 21. [Google Scholar] [CrossRef] [Green Version]
  5. Desiderà, E.; Guidetti, P.; Panzalis, P.; Navone, A.; Valentini-Poirrier, C.A.; Boissery, P.; Gervaise, C.; Di Iorio, L. Acoustic fish communities: Sound diversity of rocky habitats reflects fish species diversity. Mar. Ecol. Prog. Ser. 2019, 608, 183–197. [Google Scholar] [CrossRef] [Green Version]
  6. Di Iorio, L.; Audax, M.; Deter, J.; Holon, F.; Lossent, J.; Gervaise, C.; Boissery, P. Biogeography of acoustic biodiversity of NW Mediterranean coralligenous reefs. Sci. Rep. 2021, 11, 16991. [Google Scholar] [CrossRef]
  7. McWilliam, J.N.; Hawkins, A.D. A comparison of inshore marine soundscapes. J. Exp. Mar. Biol. Ecol. 2013, 446, 166–176. [Google Scholar] [CrossRef]
  8. Buscaino, G.; Ceraulo, M.; Pieretti, N.; Corrias, V.; Farina, A.; Filiciotto, F.; Maccarrone, V.; Grammauta, R.; Caruso, F.; Giuseppe, A.; et al. Temporal patterns in the soundscape of the shallow waters of a Mediterranean marine protected area. Sci. Rep. 2016, 6, 1–13. [Google Scholar] [CrossRef] [Green Version]
  9. Pieretti, N.; Martire, M.L.; Farina, A.; Danovaro, R. Marine soundscape as an additional biodiversity monitoring tool: A case study from the Adriatic Sea (Mediterranean Sea). Ecol. Indic. 2017, 83, 13–20. [Google Scholar] [CrossRef]
  10. Ceraulo, M.; Papale, E.; Caruso, F.; Filiciotto, F.; Grammauta, R.; Parisi, I.; Mazzola, S.; Farina, A.; Buscaino, G. Acoustic comparison of a patchy Mediterranean shallow water seascape: Posidonia oceanica meadow and sandy bottom habitats. Ecol. Indic. 2018, 85, 1030–1043. [Google Scholar] [CrossRef]
  11. Picciulin, M.; Kéver, L.; Parmentier, E.; Bolgan, M. Listening to the unseen: Passive acoustic monitoring reveals the presence of a cryptic fish species. Aquat. Conserv. 2019, 29, 202–210. [Google Scholar] [CrossRef]
  12. Vieira, M.; Fonseca, P.J.; Amorim, M.C.P. Fish sounds and boat noise are prominent soundscape contributors in an urban European estuary. Mar. Pollut. Bull. 2021, 172, 112845. [Google Scholar] [CrossRef] [PubMed]
  13. Warren, V.E.; McPherson, C.; Giorli, G.; Goetz, K.T.; Radford, C.A. Marine soundscape variation reveals insights into baleen whales and their environment: A case study in central New Zealand. R. Soc. Open Sci. 2021, 8, 201503. [Google Scholar] [CrossRef] [PubMed]
  14. Pieretti, N.; Martire, M.L.; Corinaldesi, C.; Musco, L.; Dell’Anno, A.; Danovaro, R. Anthropogenic noise and biological sounds in a heavily industrialized coastal area (Gulf of Naples, Mediterranean Sea). Mar. Environ. Res. 2020, 159, 105002. [Google Scholar] [CrossRef] [PubMed]
  15. Radford, A.N.; Kerridge, E.; Simpson, S.D. Acoustic communication in a noisy world: Can fish compete with anthropogenic noise? Behav. Ecol. 2014, 25, 1022–1030. [Google Scholar] [CrossRef] [Green Version]
  16. Kunc, H.P.; McLaughlin, K.E.; Schmidt, R. Aquatic noise pollution: Implications for individuals, populations, and ecosystems. R. Soc. Lond. B. Biol. Sci. 2016, 283, 20160839. [Google Scholar] [CrossRef] [Green Version]
  17. Cox, K.; Brennan, L.P.; Gerwing, T.G.; Dudas, S.E.; Juanes, F. Sound the alarm: A meta-analysis on the effect of aquatic noise on fish behavior and physiology. Glob. Chang. Biol. 2018, 24, 3105–3116. [Google Scholar] [CrossRef]
  18. Seitz, R.D.; Wennhage, H.; Bergström, U.; Lipcius, R.N.; Ysebaert, T. Ecological value of coastal habitats for commercially and ecologically important species. ICES J. Mar. Sci. 2014, 71, 648–665. [Google Scholar] [CrossRef] [Green Version]
  19. Airoldi, L.; Beck, M.W. Loss, status and trends for coastal marine habitats of Europe. Oceanogr. Mar. Biol. Annu. Rev. 2007, 45, 345–405. [Google Scholar]
  20. Claudet, J.; Fraschetti, S. Human-driven impacts on marine habitats: A regional meta-analysis in the Mediterranean Sea. Biol. Conserv. 2010, 143, 2195–2206. [Google Scholar] [CrossRef]
  21. Micheli, F.; Halpern, B.S.; Walbridge, S.; Ciriaco, S.; Ferretti, F.; Fraschetti, S.; Lewison, R.; Nykjaer, L.; Rosenberg, A.A. Cumulative human impacts on Mediterranean and Black Sea marine ecosystems: Assessing current pressures and opportunities. PLoS ONE 2013, 8, e79889. [Google Scholar] [CrossRef] [Green Version]
  22. Coll, M.; Piroddi, C.; Albouy, C.; Ben RaisLasram, F.; Cheung, W.W.; Christensen, V.; Karpouzi, V.S.; Guilhaumon, F.; Mouillot, D.; Paleczny, M.; et al. The Mediterranean Sea under siege: Spatial overlap between marine biodiversity, cumulative threats and marine reserves. Glob. Ecol. Biogeogr. 2012, 21, 465–480. [Google Scholar] [CrossRef]
  23. Bearzi, G.; di Sciara, G.; Politi, E. Social ecology of bottlenose dolphins in the Kvarnerić (northern Adriatic Sea). Mar. Mamm. Sci. 1997, 13, 650–668. [Google Scholar] [CrossRef]
  24. Bearzi, G.; Politi, E.; di Sciara, G.N. Diurnal behavior of free-ranging bottlenose dolphins in the Kvarnerić (Northern Adriatic Sea). Mar. Mamm. Sci. 1999, 15, 1065–1097. [Google Scholar] [CrossRef]
  25. Pleslić, G.; RakoGospić, N.; Mackelworth, P.; Wiemann, A.; Holcer, D.; Fortuna, C. The abundance of common bottlenose dolphins (Tursiops truncatus) in the former special marine reserve of the Cres-Lošinj Archipelago, Croatia. Aquat. Conserv. 2015, 25, 125–137. [Google Scholar] [CrossRef]
  26. Bearzi, G.; Fortuna, C.; Reeves, R. Tursiops truncatus (Mediterranean subpopulation). In The IUCN Red List of Threatened Species; IUCN Global Species Programme Red List Unit: Cambridge, UK, 2012; p. e.T16369383A16369386. [Google Scholar]
  27. Mackelworth, P.; Holcer, D.; Fortuna, C.M. Unbalanced governance: The Cres-Lošinj special marine reserve, a missed conservation opportunity. Mar. Policy 2013, 41, 126–133. [Google Scholar] [CrossRef]
  28. Rako, N.; Fortuna, C.M.; Holcer, D.; Mackelworth, P.; Nimak-Wood, M.; Pleslić, G.; Sebastianutto, L.; Vilibić, I.; Wiemann, A.; Picciulin, M. Leisure boating noise as a trigger for the displacement of the bottlenose dolphins of the Cres–Lošinj archipelago (northern Adriatic Sea, Croatia). Mar. Pollut. Bull. 2013, 68, 77–84. [Google Scholar] [CrossRef]
  29. RakoGospić, N.R.; Picciulin, M. Changes in whistle structure of resident bottlenose dolphins in relation to underwater noise and boat traffic. Mar. Pollut. Bull. 2016, 105, 193–198. [Google Scholar] [CrossRef]
  30. Jézéquel, Y.; Chauvaud, L.; Bonnel, J. Spiny lobster sounds can be detectable over kilometres underwater. Sci. Rep. 2020, 10, 7943. [Google Scholar] [CrossRef]
  31. Schmitz, B. Sound Production in Crustacea with Special Reference to the Alpheidae. In The Crustacean Nervous System; Springer: Berlin/Heidelberg, Germany, 2001; pp. 521–533. [Google Scholar]
  32. Radford, C.; Jeffs, A.; Tindle, C.; Montgomery, J.C. Resonating sea urchin skeletons create coastal choruses. Mar. Ecol. Prog. Ser. 2008, 362, 37–43. [Google Scholar] [CrossRef] [Green Version]
  33. Di Iorio, L.; Gervaise, C.; Jaud, V.; Robson, A.A.; Chauvaud, L. Hydrophone detects cracking sounds: Non-intrusive monitoring of bivalve movement. J. Exp. Mar. Biol. Ecol. 2012, 432, 9–16. [Google Scholar] [CrossRef]
  34. Rice, A.N.; Farina, S.C.; Makowski, A.J.; Kaatz, I.M.; Lobel, P.S.; Bemis, W.E.; Bass, A.H. Evolutionary Patterns in Sound Production across Fishes. Ichthyol. Herpetol. 2022, 110, 1–12. [Google Scholar] [CrossRef]
  35. Parmentier, E.; Diogo, R.; Fine, M.L. Multiple exaptations leading to fish sound production. Fish Fish. 2017, 18, 958–966. [Google Scholar] [CrossRef]
  36. Amorim, M.C.P. Diversity of Sound Production in Fish; Communication in fishes; Science Publishers: Enfield, UK, 2006; pp. 71–104. [Google Scholar]
  37. Rako, N.; Picciulin, M.; Vilibić, I.; Fortuna, C.M. Spatial and temporal variability of sea ambient noise as an anthropogenic pressure index: The case of the Cres-Lošinj archipelago, Croatia. J. Mar. Biol. Assoc. U. K. 2013, 93, 27–36. [Google Scholar] [CrossRef]
  38. Putland, R.L.; Constantine, R.; Radford, C.A. Exploring spatial and temporal trends in the soundscape of an ecologically significant embayment. Sci. Rep. 2017, 7, 5713. [Google Scholar] [CrossRef] [PubMed] [Green Version]
  39. Bolgan, M.; Gervaise, C.; Di Iorio, L.; Lossent, J.; Lejeune, P.; Raick, X.; Parmentier, E. Fish biophony in a Mediterranean submarine canyon. J. Acoust. Soc. Am. 2020, 147, 2466–2477. [Google Scholar] [CrossRef] [PubMed]
  40. Carriço, R.; Silva, M.A.; Menezes, G.M.; Fonseca, P.J.; Amorim, M.C.P. Characterization of the acoustic community of vocal fishes in the Azores. PeerJ 2019, 7, e7772. [Google Scholar] [CrossRef] [Green Version]
  41. Au, W.W.L. The Sonar of Dolphins; Springer: New York, NY, USA, 1993. [Google Scholar]
  42. Janik, V.M. Food–related bray calls in wild bottlenose dolphins (Tursiops truncatus). Proc. R. Soc. Lond. B. Biol. Sci. 2000, 267, 923–927. [Google Scholar] [CrossRef] [Green Version]
  43. Lammers, M.O.; Au, W.W.L.; Aubauer, R.; Nachtigall, P.E. A comparative analysis of the pulsed emissions of free-ranging hawaiian spinner dolphins (Stenella longirostris). In Echolocation in Bats and Dolphins; The University of Chicago Press: Chicago, IL, USA, 2003; pp. 414–419. [Google Scholar]
  44. Simard, P.; Lace, N.; Gowans, S.; Quintana-Rizzo, E.; Kuczaj, S.A.; Wells, R.S.; Mann, D.A. Low frequency narrow-band calls in bottlenose dolphins (Tursiops truncatus): Signal properties, function, and conservation implications. J. Acoust. Soc. Am. 2011, 130, 3068–3076. [Google Scholar] [CrossRef]
  45. Picciulin, M.; Calcagno, G.; Sebastianutto, L.; Bonacito, C.; Codarin, A.; Costantini, M.; Ferrero, E.A. Diagnostics of nocturnal calls of Sciaena umbra (L., fam., Sciaenidae) in a nearshore Mediterranean marine riserve. Bioacoustics 2012, 22, 109–120. [Google Scholar] [CrossRef]
  46. Janik, V.M.; King, S.L.; Sayigh, L.S.; Wells, R.S. Identifying signature whistles from recordings of groups of unrestrained bottlenose dolphins (Tursiops truncatus). Mar. Mamm. Sci. 2013, 29, 109–122. [Google Scholar] [CrossRef]
  47. Gridley, T.; Nastasi, A.; Kriesell, H.J.; Elwen, S.H. The acoustic repertoire of wild common bottlenosedolphins (Tursiops truncatus) in Walvis Bay, Namibia. Bioacoustics 2015, 24, 153–174. [Google Scholar] [CrossRef] [Green Version]
  48. Bohnenstiehl, D.R.; Lillis, A.; Eggleston, D.B. The Curious Acoustic Behavior of Estuarine Snapping Shrimp: Temporal Patterns of Snapping Shrimp Sound in Sub-Tidal Oyster Reef Habitat. PLoS ONE 2016, 11, e0143691. [Google Scholar] [CrossRef] [PubMed]
  49. Smott, S.; Monczak, A.; Miller, M.; Montie, E.W. Boat noise in an estuarine soundscape–A potential risk on the acoustic communication and reproduction of soniferous fish in the May River, South Carolina. Mar. Pollut. Bull. 2018, 133, 246–260. [Google Scholar] [CrossRef] [PubMed]
  50. Underwater Acoustics—Terminology, ISO 18405:2017. 2017. Available online: https://www.iso.org/standard/62406.html (accessed on 15 November 2021).
  51. Verfuss, U.K.; Andersson, M.; Folegot, T.; Laanearu, J.; Matuschek, R.; Pajala, J.; Sigray, P.; Tegowski, J.; Tougaard, J. BIAS Standards for Noise Measurements. Background Information, Guidelines and Quality Assurance. Amended Version. 2015. Available online: https://biasproject.files.wordpress.com/2016/04/bias_standards_v5_final.pdf (accessed on 15 November 2021).
  52. Betke, K.; Folegot, T.; Matuschek, R.; Pajala, J.; Persson, L.; Tegowski, J.; Tougaard, J.; Wahlberg, M. BIAS Standards for Signal Processing. Aims, Processes and Recommendations; Amended version; Verfus, U.K., Sigray, P., Eds.; BIAS: 2015. Available online: https://biasproject.files.wordpress.com/2016/01/bias_sigproc_standards_v5_final.pdf (accessed on 15 November 2021).
  53. Kéver, L.; Boyle, K.S.; Dragičević, B.; Dulčić, J.; Casadevall, M.; Parmentier, E. Sexual dimorphism of sonic apparatus and extreme intersexual variation of sounds in Ophidion rochei (Ophidiidae): First evidence of a tight relationship between morphology and sound characteristics in Ophidiidae. Front. Zool. 2012, 9, 1–16. [Google Scholar] [CrossRef] [Green Version]
  54. Parmentier, E.; Bouillac, G.; Dragicevic, B.; Dulcic, J.; Fine, M.L. Call properties and morphology of the sound- producing organ in Ophidion rochei (Ophidiidae). J. Exp. Biol. 2010, 213, 3230–3236. [Google Scholar] [CrossRef] [Green Version]
  55. Schultz, K.W.; Cato, D.H.; Corkeron, P.J.; Bryden, M.M. Low frequency narrow-band sounds produced by bottlenose dolphins. Mar. Mamm. Sci. 1995, 11, 503–509. [Google Scholar] [CrossRef]
  56. Lilly, J.C.; Miller, A.M. Sounds emitted by the bottlenose dolphin: The audible emissions of captive dolphins under water or in air are remarkably complex and varied. Science 1961, 133, 1689–1693. [Google Scholar] [CrossRef]
  57. Gridley, T.; Berggren, P.; Cockcroft, V.G.; Janik, V.M. Whistle vocalizations of Indo-Pacific bottlenosedolphins (Tursiops aduncus) inhabiting the south-west Indian Ocean. J. Acoust. Soc. Am. 2012, 132, 4032–4040. [Google Scholar] [CrossRef] [Green Version]
  58. Watkins, W.A. The harmonic interval: Fact or artifact in spectral analysis of pulse trains. In Marine Bio-Acoustics; Tavolga, W.N., Ed.; Pergamon Press: Oxford, UK, 1967; pp. 15–42. [Google Scholar]
  59. Dos Santos, M.E.; Ferreira, A.J.; Harzen, S. Rhythmic sound sequences emitted by aroused bottlenosedolphins in the Sado Estuary, Portugal. In Sensory Systems of Aquatic Mammals; de Spil: Woerden, NL, USA, 1995; pp. 325–334. [Google Scholar] [CrossRef]
  60. Radford, C.A.; Jeffs, A.G.; Tindle, C.T.; Montgomery, J.C. Temporal patterns in ambient noise of biological origin from a shallow water temperate reef. Oecologia 2008, 156, 921–929. [Google Scholar] [CrossRef]
  61. Staaterman, E.; Paris, C.B.; DeFerrari, H.A.; Mann, D.A.; Rice, A.N.; D’Alessandro, E.K. Celestial patterns in marine soundscapes. Mar. Ecol. Progr. Ser. 2014, 508, 17–32. [Google Scholar] [CrossRef] [Green Version]
  62. Ramcharitar, J.; Gannon, D.; Popper, A. Bioacoustics of fishes of the family Sciaenidae (croackers and drums). Trans. Am. Fish Soc. 2006, 135, 1409–1431. [Google Scholar] [CrossRef]
  63. Gottesman, B.L.; Francomano, D.; Zhao, Z.; Bellisario, K.; Ghadiri, M.; Broadhead, T.; Gasc, A.; Pijanowski, B.C. Acoustic monitoring reveals diversity and surprising dynamics in tropical freshwater soundscapes. Freshw. Biol. 2018, 65, 117–132. [Google Scholar] [CrossRef]
  64. Dulcic, J.; Matic, S.; Kraljevic, M.; Franicevic, M.; Lipej, L. New data on the cuskeel, Ophidion rochei, from the eastern Adriatic. J. Mar. Biol. Assoc. U. K. 2002, 82, 1045–1046. [Google Scholar] [CrossRef]
  65. Pallaoro, A.; Jardas, I. Ichthyological collection of the Institute of Oceanography and Fisheries in split (Croatia). Natura Croatica 1996, 3, 177–219. [Google Scholar]
  66. Nielsen, J.G.; Cohen, D.M.; Markle, D.F.; Robins, C.R. Ophidiiform Fishes of the World (Order Ophidiiformes). An Annotated and Illustrated Catalogue of Pearlfishes, Cusk-eels, Brotulas and Other Ophidiiform Fishes Known to Date; FAO species catalogue. FAO Fisheries Synopsis; Food and Agriculture Organization of the United Nations: Rome, Italy, 1999; Volume 18, ISBN 92-5-104375-2. [Google Scholar]
  67. Kéver, L.; Boyle, K.S.; Parmentier, E. Effects of seawater temperature on sound characteristics in Ophidion rochei (Ophidiidae). J. Fish Biol. 2015, 87, 502–509. [Google Scholar] [CrossRef]
  68. Kéver, L.; Lejeune, P.; Michel, L.N.; Parmentier, E. Passive acoustic recording of Ophidion rochei calling activity in Calvi Bay (France). Mar. Ecol. 2016, 37, 1315–1324. [Google Scholar] [CrossRef]
  69. Kovačic, M. Ichthyological collection (Cyclostomata, Selachii, Osteichthyes) of the Natural History Muesum Rijeka. In Natural History Researches of the Rijeka Region; Arko-Pijevac, M., Kovačić, M., Crnković, D., Eds.; Prirodoslovni Muzej u Rijeci: Rijeka, Croatia, 1998; pp. 685–698. [Google Scholar]
  70. Finneran, J.J. Dolphin “packet” use during long-range echolocation tasks. J. Acoust. Soc. Am. 2013, 133, 1796–1810. [Google Scholar] [CrossRef]
  71. Sprčić, A. Prehrana Dobrog Dupina (Tursiops truncatus, Montagu 1821) u Sjeveroistočnom Jadranu. Doctoral Dissertation, University of Zagreb, Faculty of Science, Department of Biology, Zagreb, Croatia, 2011. [Google Scholar]
  72. Janik, V.M.; Sayigh, L.S.; Wells, R.S. Signature whistle shape conveys identity information to bottlenose dolphins. Proc. Natl. Acad. Sci. USA 2006, 103, 8293–8297. [Google Scholar] [CrossRef] [Green Version]
  73. Janik, V.M.; Slater, P.J.B. Context-specific use suggests that bottlenose dolphin signature whistles are cohesion calls. Anim. Behav. 1998, 56, 829–838. [Google Scholar] [CrossRef] [Green Version]
  74. Rako-Gospić, N.; Radulović, M.; Vučur, T.; Pleslić, G.; Holcer, D.; Mackelworth, P. Factor associated variations in the home range of a resident Adriatic common bottlenose dolphin population. Mar. Pollut. Bull. 2017, 124, 234–244. [Google Scholar] [CrossRef]
  75. Pleslić, G.; Rako-Gospić, N.; Miočić-Stošić, J.; BlazinićVučur, T.; Radulović, M.; Mackelworth, P.; Frleta-Valić, M.; Holcer, D. Social structure and spatial distribution of bottlenose dolphins (Tursiops truncatus) along the Croatian Adriatic coast. Aquat. Conserv. 2019, 29, 2116–2132. [Google Scholar] [CrossRef]
  76. Pirotta, E.; Laesser, B.E.; Hardaker, A.; Riddoch, N.; Marcoux, M.; Lusseau, D. Dredging displaces bottlenose dolphins from an urbanised foraging patch. Mar. Pollut. Bull. 2013, 74, 396–402. [Google Scholar] [CrossRef] [PubMed]
  77. Marley, S.A.; Salgado-Kent, C.P.; Erbe, C.; Parnum, I. Effects of vessel traffic and underwater noise on the movement, behaviour and vocalisations of bottlenose dolphins in an urbanised estuary. Sci. Rep. 2017, 7, 13437. [Google Scholar] [CrossRef] [PubMed] [Green Version]
  78. Malfante, M.; Dalla Mura, M.; Mars, J.I.; Gervaise, C. Automatic fish sounds classification. J. Acoust. Soc. Am. 2018, 139, 2115–2116. [Google Scholar] [CrossRef] [Green Version]
  79. Monczak, A.; Ji, Y.; Soueidan, J.; Montie, E.W. Automatic detection, classification, and quantification of sciaenid fish calls in an estuarine soundscape in the Southeast United States. PLoS ONE 2019, 14, e0209914. [Google Scholar] [CrossRef]
  80. Vieira, M.; Pereira, B.P.; Pousão-Ferreira, P.; Fonseca, P.J.; Amorim, M. Seasonal Variation of Captive Meagre Acoustic Signalling: A Manual and Automatic Recognition Approach. Fishes 2019, 4, 28. [Google Scholar] [CrossRef] [Green Version]
Figure 1. Map showing the study area and the MS6 Lošinj recording position.
Jmse 10 00300 g001
Figure 2. Mooring design (left) and passive acoustic recorder (right) used to continuously monitor underwater soundscape at MS6 Lošinj monitoring station.
Jmse 10 00300 g002
Figure 3. Diacritic acoustic characteristics of (a) Ophidion rochei male sounds (recorded at MS6) and (b) Stereotyped Trains of Fast Repeated Pulses, STFRP, previously described by [11,39,55]): (a) the upper panel depicts the typical and unequivocal pulse period succession characterizing O. rochei male sounds (i.e., pulse period of consecutive pulses was plotted in ordered succession, from the first to the last pulse); the middle panel represents O. rochei male sound waveform and the lower panel its spectrogram (Hanning window, FFT 512, frequency resolution 46.8 Hz). (b) the upper panel depicts the typical temporal organization of STFRP, based on its waveform. Each dark red box represents one “train” of fast repeated pulses, while the orange box depicts an enlarged visualization of one single “train” in which the “fast repeated pulses” can be better appreciated; the middle panel presents the STFPR waveform and the lower panel its spectrogram (Hanning window, FFT 512, frequency resolution 46.8 Hz). (c) spectrogram of the two fish sound types dominating the low-frequency soundscape in the Lošinj area (Croatia) (Hanning window, FFT 512, frequency resolution 46.8 Hz).
Jmse 10 00300 g003
Figure 5. Example spectrograms of boat noise detected in the monitoring station, generating (a) burst broadband, (b) variable broadband, and (c) continuous low-frequency energy inputs to the local soundscape. (Hanning window, FFT 512, frequency resolution 46.8 Hz).
Jmse 10 00300 g005
Figure 6. Treemaps visualizing the average % of acoustic categories of interest (i.e., boat noise, fish sounds, dolphin HF and LF sounds, absence of acoustic signals of interest) during the day (a,c) and the night (b,d) of the Non-Tourist and Tourist seasons (data provided at Table 5). “Fish” includes fish sounds, irrespective of their sound types; “Dolphin HF” includes echolocation click trains, burst pulses, whistles and chirps; “Dolphin LF” includes low-frequency narrow-band calls; “Boat” includes boat noises, “No sounds” indicates the absence of all above mentioned biphonical and anthophonical categories.
Jmse 10 00300 g006
Figure 7. Relative abundances of biophonical and anthrophonical categories (measured as % min per 1 h-file) averaged per clock hour in the Non-Tourist (NTS; (a)) and Tourist Season (TS; (b)). “Fish” includes fish sounds, irrespective of their sound types; “Dolphin HF” includes echolocation click trains, burst pulses, whistles and chirps; “Dolphin LF” includes low-frequency narrow-band calls; “Boat” includes boat noises.
Jmse 10 00300 g007
Figure 8. Averaged Sound Pressure Levels (SPL), based on five-days data, calculated for both the low-frequency (63–2000 Hz; SPLsLF) and high-frequency (2000–20,000 Hz; SPLsHF) from 1 s data intervals during the (a) Non-Tourist (NTS) and (b) Tourist (TS) Seasons.
Jmse 10 00300 g008
Figure 9. Average hourly abundance of (i) fish vocalizations, (ii) dolphin vocalizations at high and low frequency and (ii) boat noises in relation to the corresponding SPLs calculated for the low-frequency range (a,c) and in the high-frequency range (b,d), during the Non-Tourist (a,b) and Tourist (c,d) Seasons.
Jmse 10 00300 g009
Table 1. Descriptive statistics (mean, SD and c.v. %) of sound features characterizing the Ophidion rochei sounds recorded in the Lošinj area.
N. Pulses1 Peak Freq (Hz)2 Peak Freq (Hz)Sound Duration (ms)Alternation StartLong Pulse
Period
(ms)
Short Pulse
Period (ms)
Lošinj data
(N = 20)
mean36.7241.8384.14144.47.9129.4103.1
SD5.826.745.1727.72.613.710.9
c.v. (%)15.811.011.717.533.710.610.6
Table 2. Descriptive statistics (mean, SD and c.v. %) of sound features characterizing the Stereotyped Trains of Fast Repeated Pulses (STFRP) recorded in the Lošinj area.
5% Freq (Hz)Center Freq (Hz)Peak Freq (Hz)95% Freq (Hz)Sound Duration (ms)Number of TrainsTrain
Duration
(ms)
Train
Period
(ms)
Lošinj data
(N = 15)
mean161.4679.6610.4140616985.988.3236.1
SD16.8116.120716.272.80.223.373.2
c.v. (%)10.417.833.91.14.33.426.431.0
Table 3. Total number of the bottlenose dolphin sounds per sound types recorded in the Non-Tourist Season (NTS) and Tourist Season (TS).
WhistleChirpBurst PulseLow Frequency
Narrow-Band Calls
Bray
NTSDay1670410
NTSNight1210190
Total2880600
TSDay412291960
TSNight160100
Total5722101960
Table 4. Signal abundance (average percentage of minutes per hour; average ± standard deviation) per the Tourist (TS) and Non-Tourist (NTS) seasons; statistically significant variation is indicated in bold and by an asterisk (*).
Fish Sounds *Boat NoiseDolphin Sounds (Whistles, Chirp, Burst Pulse, Echolocation Clicks)Dolphin Sounds (Low Frequency Narrow-Band Calls)
NTS6.7% ± 1.442.5% ± 21.4% ± 0.30.3% ± 1.4
TS27.3% ± 3.537% ± 1.41.8% ± 0.50.4% ± 1.5
Mann-Whitney U5623.56586.571566907
P0.0010.2520.9030.221
Table 5. Spearman rank correlations between low-frequency SPL values (63–2000 Hz) and the average percentage of low-frequency signals (fish sounds, boat noises and dolphin LFNs) calculated per hour during the Tourist (TS) and Non-Tourist Season (NTS); statistically significant correlation is indicated in bold.
Fish SoundsBoat NoisesLFN Dolphin Sounds
SPLsLF—TSrs  =  −0.40, p-value  =  0.00rs  =  0.43, p-value  =  0.00rs  =  0.18, p-value  =  0.04
SPLsLF—NTSrs  =  0.023, p-value  =  0.79rs  =  0.039, p-value  =  0.67rs  =  −0.06, p-value  =  0.45
Publisher’s Note: MDPI stays neutral with regard to jurisdictional claims in published maps and institutional affiliations.

