

On Formulae for Wave Transmission at Submerged and Low-Crested Breakwaters

 ,
,  , and
, and 
Abstract
1. Introduction
- Define the most important hydraulic and structural parameters involved in wave transmission phenomenon.
- Describe the existing formulae and give insight to them by means of an in-depth description of all the involved parameters.
- Produce an up-to-date experimental wave transmission database, with the largest amount of data to date (4144).
- Develop a user-friendly MATLAB script for calculating wave transmission coefficient implementing the existing formulae that consider all the validity limits for which the formulae were derived.
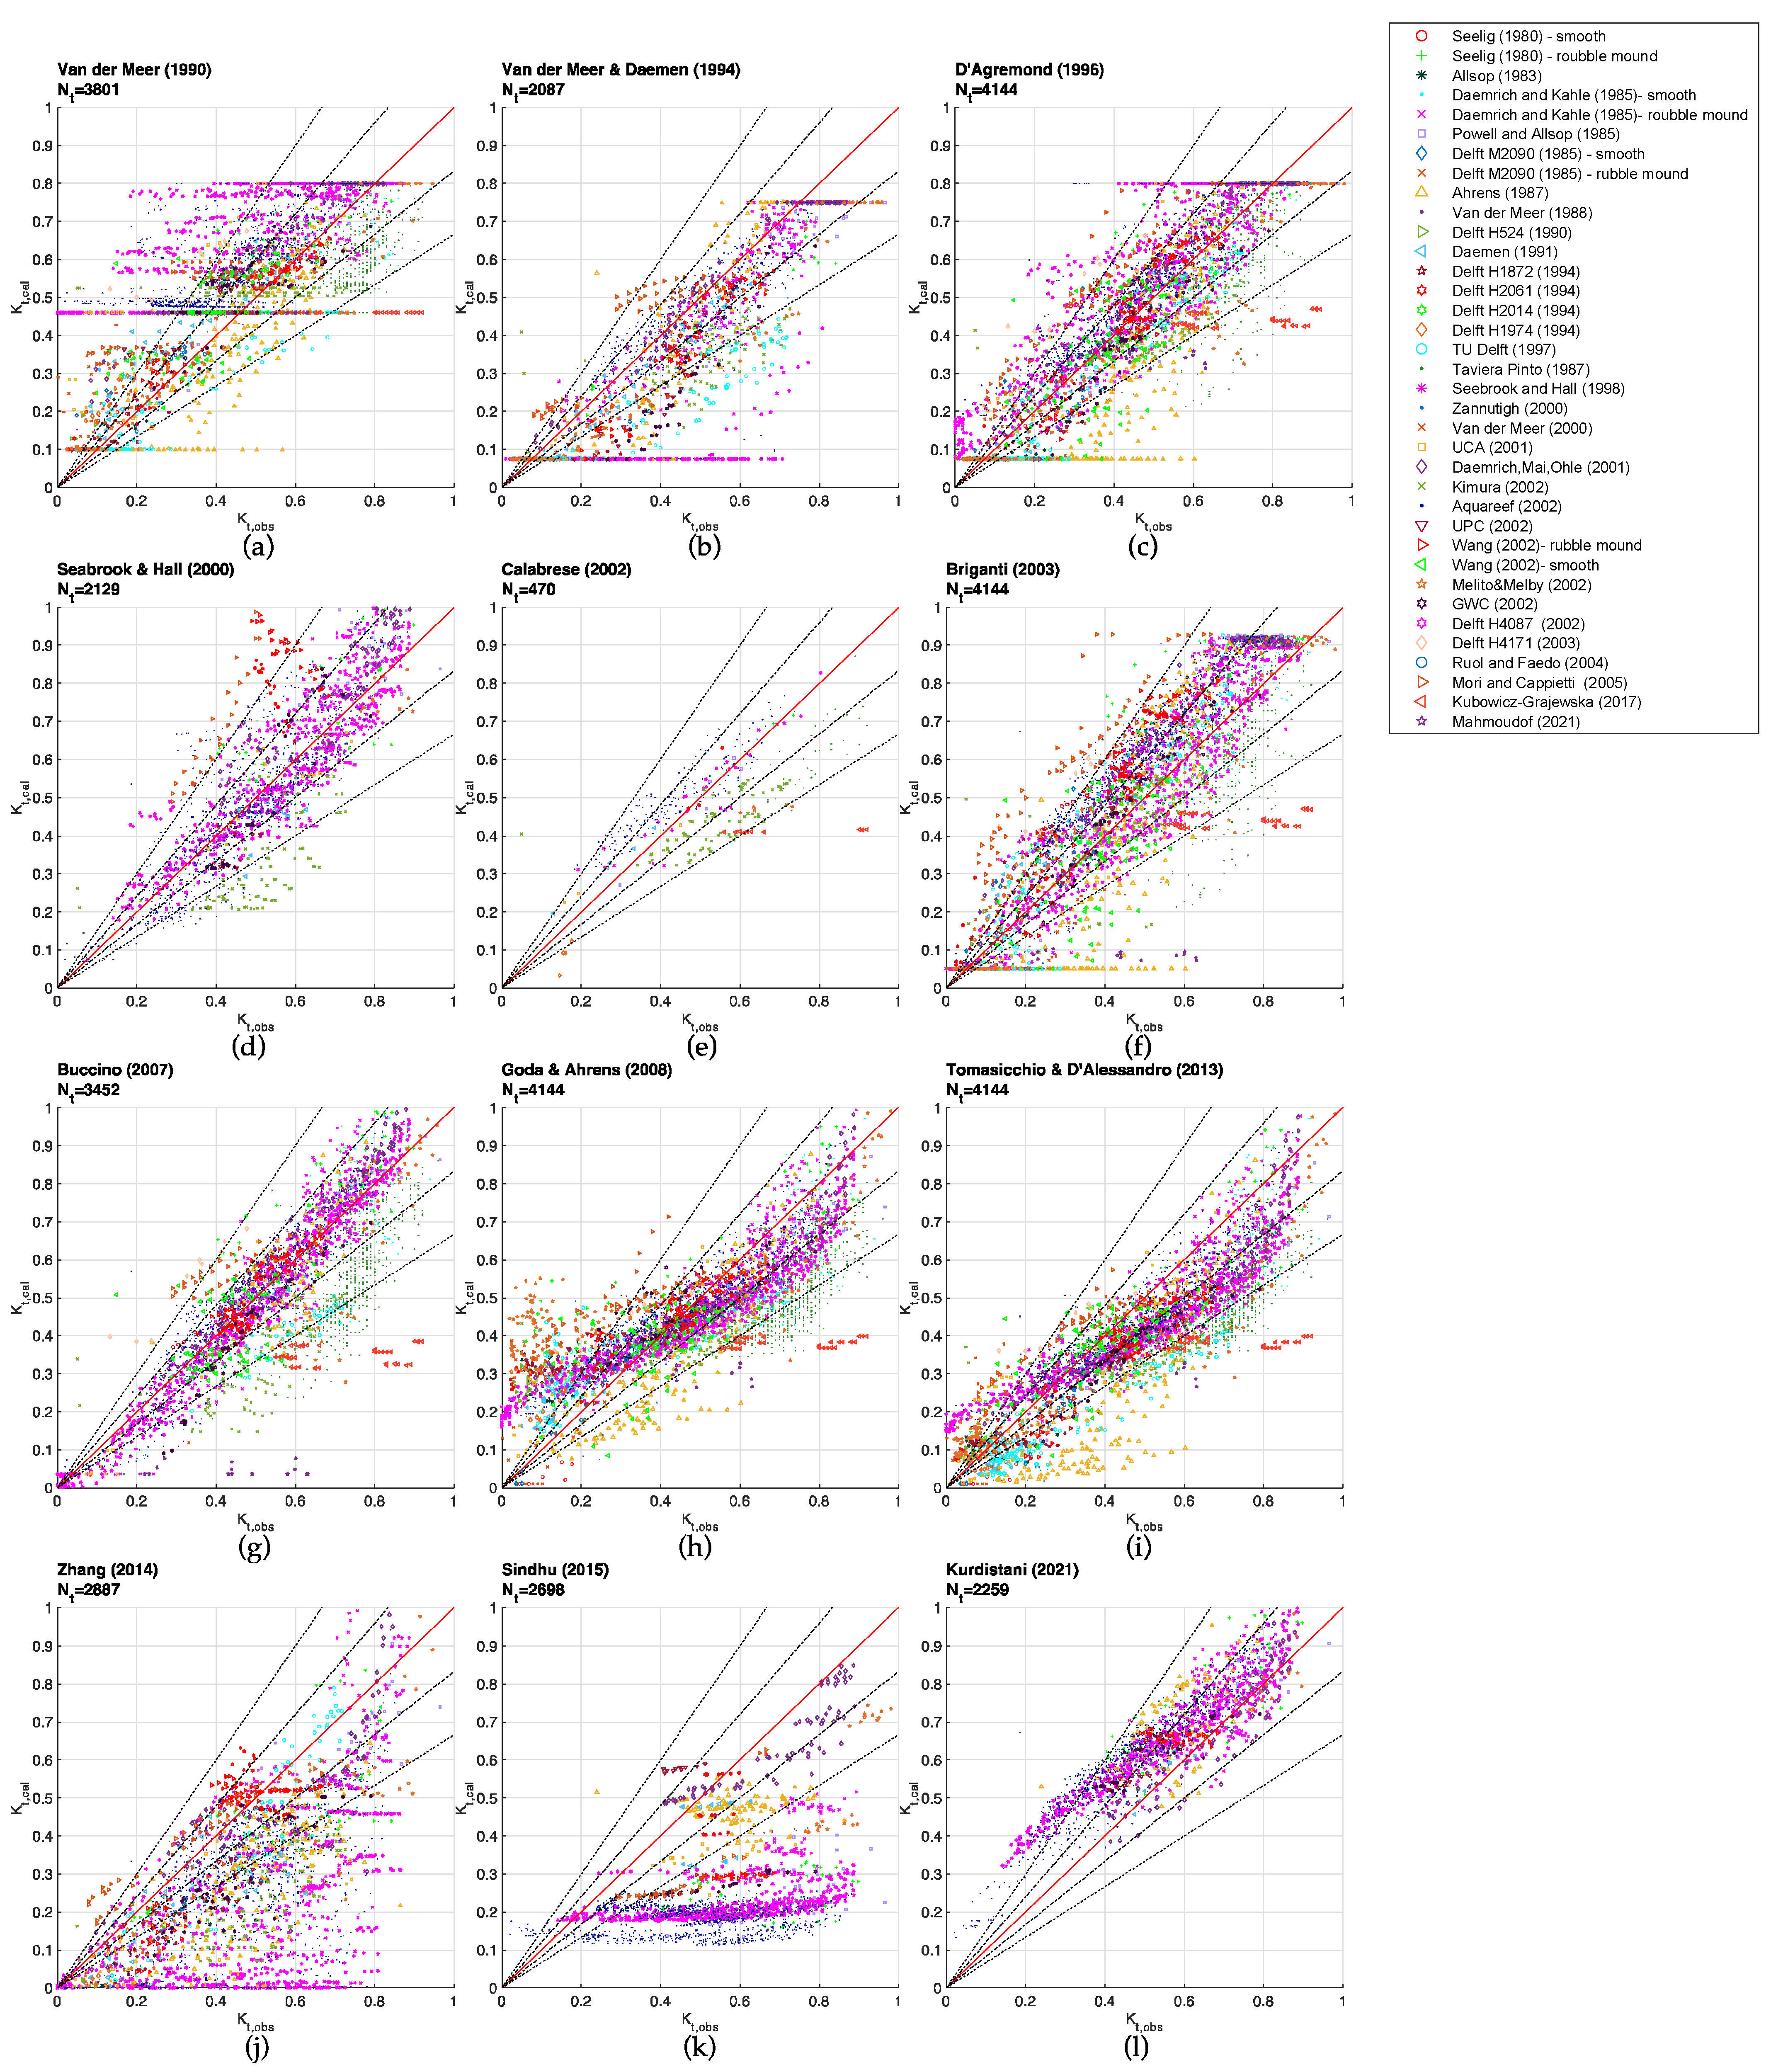
- Use the up-to-date experimental database to assess the validity of the existing formulae for wave transmission prediction.
2. Materials and Methods
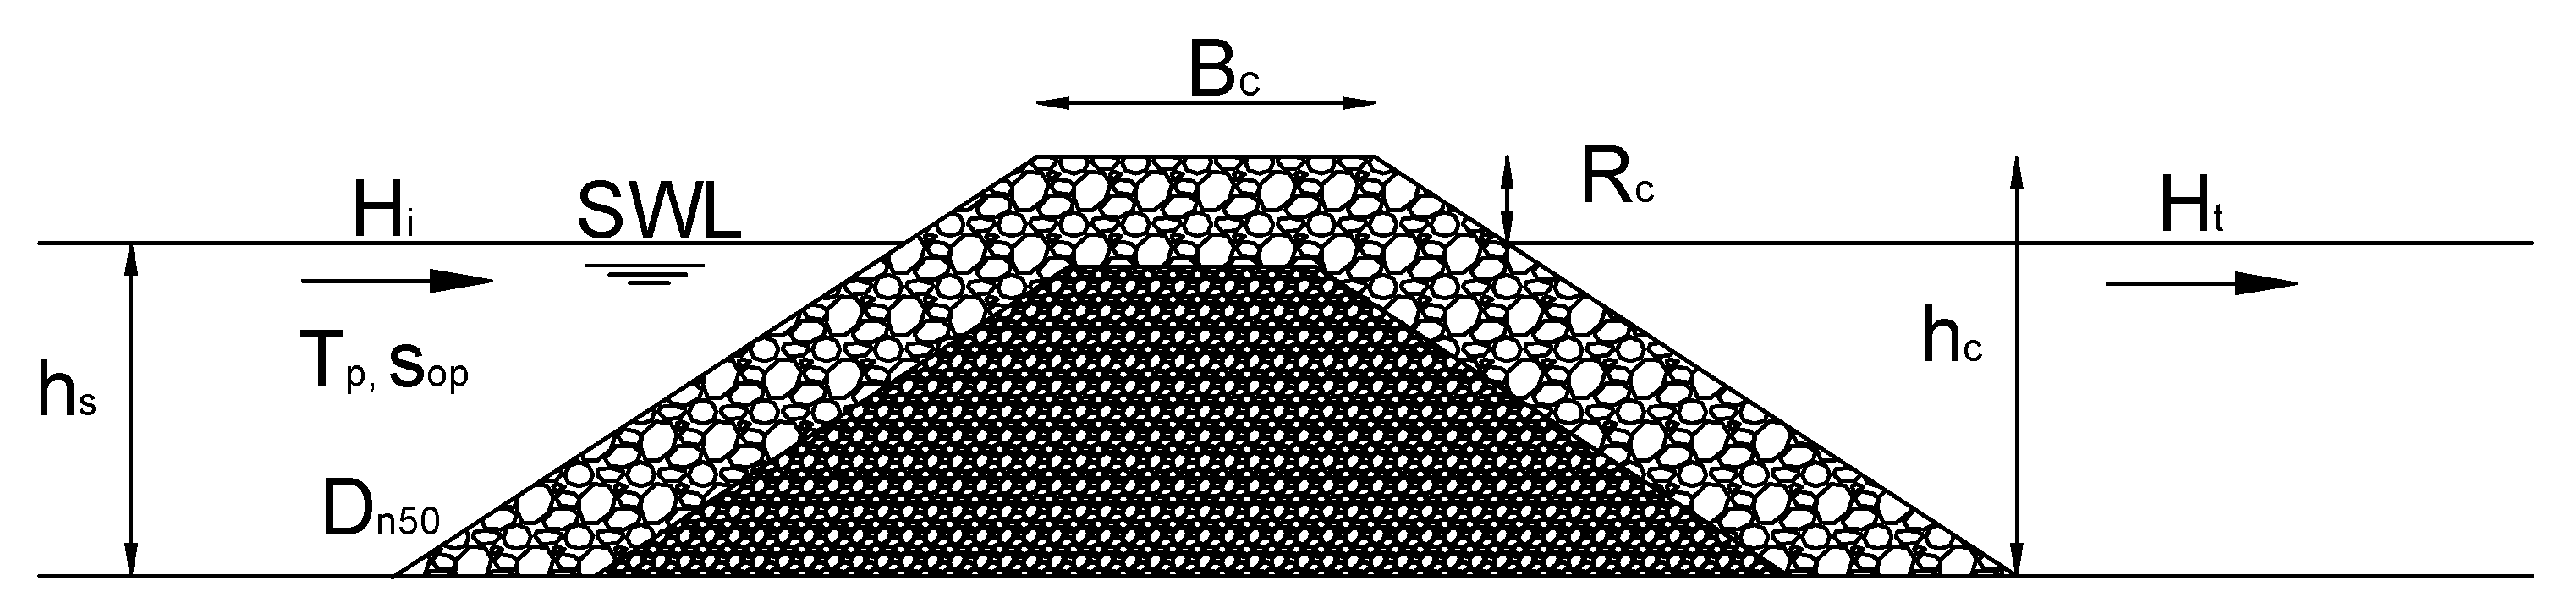
2.1. Governing Parameters
2.2. Existing Transmission Formulae
2.3. Existing Data Sets
3. Analysis
4. Conclusions
Author Contributions
Funding
Institutional Review Board Statement
Informed Consent Statement
Data Availability Statement
Conflicts of Interest
References
- Lamberti, A.; Archetti, R.; Kramer, M.; Paphitis, D.; Mosso, C.; di Risio, M. European Experience of Low Crested Structures for Coastal Management. Coast. Eng. 2005, 52, 841–866. [Google Scholar] [CrossRef]
- CLASH Project. Available online: http://www.clash-eu.org (accessed on 6 August 2021).
- DELOS Project. Available online: http://www.delos.unibo.it (accessed on 6 August 2021).
- van Oosten, R.P.; Marco, J.P.; van der Meer, J.W.; van Gent, M.R.A.; Verhagen, H.J. Wave Transmission at Low-Crested Structures Using Neural Networks. In Coastal Engineering 2006; World Scientific Publishing Company: Singapore, 2007; pp. 4932–4944. [Google Scholar]
- Gao, J.; Ma, X.; Dong, G.; Chen, H.; Liu, Q.; Zang, J. Investigation on the Effects of Bragg Reflection on Harbor Oscillations. Coast. Eng. 2021, 170, 103977. [Google Scholar] [CrossRef]
- Gao, J.; Ma, X.; Zang, J.; Dong, G.; Ma, X.; Zhu, Y.; Zhou, L. Numerical Investigation of Harbor Oscillations Induced by Focused Transient Wave Groups. Coast. Eng. 2020, 158, 103670. [Google Scholar] [CrossRef]
- van der Meer, J.W.; Briganti, R.; Zanuttigh, B.; Wang, B. Wave Transmission and Reflection at Low-Crested Structures: Design Formulae, Oblique Wave Attack and Spectral Change. Coast. Eng. 2005, 52, 915–929. [Google Scholar] [CrossRef]
- van der Meer, J.W. Data on Wave Transmission Due to Overtopping; Delft Hydraulics: Delft, The Netherlands, 1990. [Google Scholar]
- CIRIA; CUR; CETMEF. The Use of Rock in Hydraulic Engineering, 2nd ed.; CIRIA: London, UK, 2007; Volume C683. [Google Scholar]
- Ahrens, J.P. Characteristics of Reef Breakwaters; Coastal Engineering Research Center, Waterways Experiment Station: Charlottesville, VA, USA, 1987. [Google Scholar]
- van der Meer, J.W.; Daemen, I.F.R. Stability and Wave Transmission at Low-Crested Rubble-Mound Structures. J. Waterw. Port. Coast Ocean Eng. 1994, 120, 1–19. [Google Scholar] [CrossRef]
- d’Angremond, K.; van der Meer, J.W.; de Jong, R.J. Wave Transmission at Low-Crested Structures. In Coastal Engineering 1996; American Society of Civil Engineers: New York, NY, USA, 1997; pp. 2418–2427. [Google Scholar]
- Seabrook, S.R.; Hall, K.R. Wave Transmission at Submerged Rubblemound Breakwaters. In Coastal Engineering 1998; American Society of Civil Engineers: Reston, VA, USA, 1999; pp. 2000–2013. [Google Scholar]
- Calabrese, M.; Vicinanza, D.; Buccino, M. Large-Scale Experiments On The Behaviour Of Low Crested And Submerged Breakwaters In Presence Of Broken Waves. In Coastal Engineering 2002; World Scientific Publishing Company: Singapore, 2003; pp. 1900–1912. [Google Scholar]
- Briganti, R.; van der Meer, J.; Buccino, M.; Calabrese, M. Wave Transmission Behind Low-Crested Structures. In Coastal Structures 2003; American Society of Civil Engineers: Reston, VA, USA, 2004; pp. 580–592. [Google Scholar]
- Buccino, M.; Calabrese, M. Conceptual Approach for Prediction of Wave Transmission at Low-Crested Breakwaters. J. Waterw. Port Coast. Ocean Eng. 2007, 3, 213–224. [Google Scholar] [CrossRef]
- Goda, Y.; Ahrens, J.P. New Formulation Of Wave Transmission Over And Through Low-Crested Structures. In Coastal Engineering 2008; World Scientific Publishing Company: Singapore, 2009; pp. 3530–3541. [Google Scholar]
- Tomasicchio, G.R.; D’Alessandro, F. Wave Energy Transmission through and over Low Crested Breakwaters. J. Coast. Res. 2013, 65, 398–403. [Google Scholar] [CrossRef]
- Zhang, S.X.; Li, X. Design Formulas of Transmission Coefficients for Permeable Breakwaters. Water Sci. Eng. 2014, 7, 457–467. [Google Scholar]
- Sindhu, S.; Shirlal, K.G.; Manu. Prediction of Wave Transmission Characteristics at Submerged Reef Breakwater. Procedia Eng. 2015, 116, 262–268. [Google Scholar] [CrossRef][Green Version]
- Kurdistani, S.M.; Tomasicchio, G.R.; D′Alessandro, F.; Francone, A. Formula for Wave Transmission at Submerged Homogeneous Porous Breakwaters. Ocean. Eng. 2022, 266, 113053. [Google Scholar] [CrossRef]
- Tomasicchio, G.R.; Mahmoudi Kurdistani, S. New Prediction Formula for Pore Pressure Distribution inside Rubble-Mound Breakwater Core. J. Waterw. Port Coast. Ocean Eng. 2020, 146, 04020005. [Google Scholar] [CrossRef]
- Seelig, W.N. Two-Dimensional Tests of Wave Transmission and Reflection Characteristics of Laboratory Breakwaters; Fort Belvoir: Fairfax, VA, USA, 1980. [Google Scholar]
- Allsop, N.W.H. Low-Crest Breakwaters, Studies in Random Waves. Coast. Struct. 1983, 83, 94–107. [Google Scholar]
- Daemrich, K.F.; Kahle, W.; Partenscky, H.W. Schutzwirkung von Unterwasserwellenbrechern Unter Dem Einfluß Unregelmäßiger Seegangswellen; University Hannover: Hannover, Germany, 1985. [Google Scholar]
- Powell, K.A.; Allsop, W. Low-Crest Breakwaters, Hydraulic Performance and Stability; Report 57 Hydraulics Research Wallingford; Hydraulics Research Wallingford: Wallingford, UK, 1985. [Google Scholar]
- van der Meer, J.W. Deterministic and Probabilistic Design of Breakwater Armor Layers. J. Waterw. Port Coast. Ocean Eng. 1988, 114, 66–80. [Google Scholar] [CrossRef]
- Daemen, I.F.R. Wave Transmission at Low Crested Structures; Delft Hydraulics Report H 462; Delft University of Technology: Delft, The Netherlands, 1991. [Google Scholar]
- de Jong, R.J. Wave Transmissions at Low-Crested Structures. Stability of Tetrapods at Front, Crest and Rear of a Low-Crested Breakwater; Delft University of Technology: Delft, The Netherlands, 1996. [Google Scholar]
- Taveira-Pinto, F.; Veloso-Gomes, F.; Avilez Valente, P. Energy Dissipation of Low-Crested Breakwaters. In Ocean Wave Measurement and Analysis, Proceedings of the 1997 3rd International Symposium on Ocean Wave Measurement and Analysis, WAVES, Virginia Beach, VA, USA, 3–7 November 1997; ASCE: Reston, VA, USA; pp. 600–614.
- Vidal, C.; Gironella, X. Wave Channel Experiments. Internal Report, DELOS Deliverable D32, Available from Internet. DELOS Report 2003. Available online: http://www.delos.unibo.it (accessed on 6 August 2021).
- Gironella, X.; Sánchez-Arcilla, A.; Briganti, R.; Sierra, J.P.; Moreno, L. Submerged Detached Breakwaters: Towards a Functional Design. In Coastal Engineering 2002; World Scientific Publishing Company: Singapore, 2003; pp. 1768–1777. [Google Scholar]
- Daemrich, K.-F.; Mai, S.; Ohle, N. Wave Transmission at Submerged Breakwaters. In Ocean Wave Measurement and Analysis (2001); American Society of Civil Engineers: Reston, VA, USA, 2002; pp. 1725–1734. [Google Scholar]
- Hirose, N.; Watanuki, A.; Saito, M. New Type Units for Artificial Reef Development of Eco-Friendly Artificial Reefs and the Effectiveness Thereof. In Proceedings of the 30th International Navigation Congress, PIANC, Sydney, Australia, 1 January 2002. [Google Scholar]
- Wang, Y.; Wang, G.; Li, G. Experimental Study on the Performance of the Multiple-Layer Breakwater. Ocean. Eng. 2006, 33, 1829–1839. [Google Scholar] [CrossRef]
- Melito, I.; Melby, J.A. Wave Runup, Transmission, and Reflection for Structures Armored with CORE-LOC®. Coast. Eng. 2002, 45, 33–52. [Google Scholar] [CrossRef]
- Ruol, P.; Faedo, A.; Paris, A. Physical Model Study Of Water Piling-Up Behind Low-Crested Structures. In Coastal Engineering 2004; World Scientific Publishing Company: Singapore, 2005; pp. 4165–4177. [Google Scholar]
- Kimura, K.; Shimizu, Y.; Taya, T.; Yamamoto, Y.; Doi, Y.; Hanzawa, M. Characteristics of Deformation and Wave Transmission for Wide Submerged Breakwaters with Armor Blocks. In Proceedings of the Coastal Engineering, JSCE 2002, Cardiff, Wales, 7–12 July 2002; Volume 49, pp. 816–820. (In Japanese). [Google Scholar] [CrossRef]
- Mori, E.; Cappietti, L. Wave Flume Experiments on Wave Transmission at Low Crested Breakwaters of Different Berm Width. In Proceedings of the IAHR-II International Short Course and Workshop on Coastal Processes and Port Engineering—SCACR, Cosenza, Italy, 29 May–1 June 2006; pp. 297–306. [Google Scholar]
- Koraim, A.S.; Heikal, E.M.; Abo Zaid, A.A. Hydrodynamic Characteristics of Porous Seawall Protected by Submerged Breakwater. Appl. Ocean. Res. 2014, 46, 1–14. [Google Scholar] [CrossRef]
- Lokesha; Kerpen, N.B.; Sannasiraj, S.A.; Sundar, V.; Schlurmann, T. Experimental Investigations on Wave Transmission at Submerged Breakwater with Smooth and Stepped Slopes. Procedia Eng. 2015, 116, 713–719. [Google Scholar] [CrossRef]
- Teh, H.M. Wave Transmission over a Submerged Porous Breakwater an Experimental Study. Appl. Mech. Mater. 2014, 567, 319–324. [Google Scholar] [CrossRef]
- Kubowicz-Grajewska, A. Experimental Investigation into Wave Interaction with a Rubble-Mound Submerged Breakwater (Case Study). J. Mar. Sci. Technol. 2017, 22, 313–326. [Google Scholar] [CrossRef]
- Koley, S.; Panduranga, K.; Almashan, N.; Neelamani, S.; Al-Ragum, A. Numerical and Experimental Modeling of Water Wave Interaction with Rubble Mound Offshore Porous Breakwaters. Ocean Eng. 2020, 218, 108218. [Google Scholar] [CrossRef]
- Kim, Y.-T.; Lee, J.-I. Wave Transmission Coefficient for Rubble Mound Structures with Superstructures. J. Coast Res. 2018, 85, 1081–1085. [Google Scholar] [CrossRef]
- Metallinos, A.S.; Klonaris, G.T.; Memos, C.D.; Dimas, A.A. Hydrodynamic Conditions in a Submerged Porous Breakwater. Ocean Eng. 2019, 172, 712–725. [Google Scholar] [CrossRef]
- Liu, B.; Cheng, D.; Sun, Z.; Zhao, X.; Chen, Y.; Lin, W. Experimental and Numerical Study of Regular Waves Past a Submerged Breakwater. J. Hydrodyn. 2019, 31, 641–653. [Google Scholar] [CrossRef]
- Mahmoudof, S.M.; Hajivalie, F. Experimental Study of Hydraulic Response of Smooth Submerged Breakwaters to Irregular Waves. Oceanologia 2021, 63, 448–462. [Google Scholar] [CrossRef]


| Symbol | Unit | Definitions |
|---|---|---|
| Hi | [m] | Incident wave height, typically the spectral significant wave height Hmoi, at the toe of the structure |
| Ht | [m] | Transmitted wave height, typically the spectral significant wave height Hmot, at the toe of the structure |
| Tp | [s] | Spectral peak wave period |
| hs | [m] | Water depth at the toe of the structure |
| hc | [m] | Structure height |
| Rc | [m] | Crest freeboard Rc = hc − hs |
| Bc | [m] | Crest width of the structure |
| tan(α) | [-] | Seaward structure slope |
| sop | [-] | Wave steepness, |
| ξop | [-] | Surf similarity parameter, |
| Dn50 | [m] | Nominal diameter of the armor units |
| n | [-] | Porosity of the structure |
| β | [°] | Angle of wave attack |
| Formula | Structure Type | Input Parameters | |||||||||||
|---|---|---|---|---|---|---|---|---|---|---|---|---|---|
| E | S | RM | RT | Sm | Hi | Tp | Rc | Bc | Dn50 | hs | β | n | |
| Van der Meer (1990) | |||||||||||||
| Van der Meer and Deamen (1994) | |||||||||||||
| Ahrens (1987) | |||||||||||||
| d’Angremond et al. (1996) | |||||||||||||
| Seabrook and Hall (1998) | |||||||||||||
| Calabrese et al. (2002) | |||||||||||||
| Briganti et al. (2003) | |||||||||||||
| Van der Meer et al. (2005) | |||||||||||||
| Buccino et al. (2007) | |||||||||||||
| Goda and Ahrens (2008) | |||||||||||||
| Tomasicchio and D’Alessandro (2013) | |||||||||||||
| Zhang et al. (2014) | |||||||||||||
| Sindhu et al. (2015) | |||||||||||||
| Kurdistani et al. (2022) | |||||||||||||
| Dataset | Type of Structure | No | Hi (m) | Tp (s) | sop (-) | Rc (m) | Bc (m) | Dn50 (m) | |||
|---|---|---|---|---|---|---|---|---|---|---|---|
| Seelig (1980) | SI (1)–E (2) | 13 | 0.13∼0.17 | 1.33∼3.32 | 0.01∼0.07 | 0.00∼0.15 | 0.30 | / | / | 0.00∼1.33 | 1.74∼2.65 |
| Seelig (1980) | RMn, RMa–E,S | 69 | 0.08∼0.18 | 0.91∼3.46 | 0.01∼0.08 | −0.42∼0.21 | 0.30∼0.40 | 0.11∼0.16 | 0.64∼1.60 | −4.42∼1.74 | 1.76∼5.00 |
| Allsop (1983) | RMn–E | 21 | 0.05∼0.16 | 1.02∼3.17 | 0.01∼0.04 | 0.08∼0.16 | 0.16 | 0.04∼0.05 | 0.96∼4.03 | 0.50∼3.14 | 0.99∼3.27 |
| Daemrich & Kahle (1985) | SI–S | 147 | 0.02∼0.24 | 1.23∼3.27 | 0.01∼0.04 | −0.20∼0.00 | 0.20 | / | / | −8.11∼0.00 | 0.82∼8.46 |
| Daemrich & Kahle (1985) | Rma–S | 196 | 0.02∼0.22 | 1.23∼3.27 | 0.01∼0.04 | −0.20∼0.00 | 0.20∼1.00 | 0.08 | 0.28∼2.88 | −8.80∼0.00 | 0.89∼45.72 |
| Powell & Allsop (1985) | RMn–S | 42 | 0.09∼0.22 | 1.39∼2.30 | 0.03∼0.04 | −0.28∼0.08 | 0.07∼0.32 | 0.08∼0.09 | 1.16∼2.90 | −2.43∼0.68 | 0.38∼3.61 |
| DH-M2090 (1985) | SI–E | 7 | 0.07∼0.21 | 1.30∼2.28 | 0.02∼0.04 | 0.06∼0.21 | 0.43 | / | / | 0.30∼1.66 | 2.02∼6.16 |
| DH-M2090 (1985) | RMn–E | 31 | 0.05∼0.20 | 1.07∼2.26 | 0.02∼0.04 | 0.05∼0.20 | 0.15 | 0.04 | 1.03∼4.60 | 0.36∼3.39 | 0.75∼3.33 |
| Ahrens (1987) | RTn–E,S | 201 | 0.01∼0.18 | 1.33∼3.64 | 0.001∼0.04 | −0.09∼0.11 | 0.16∼0.36 | 0.02∼0.03 | 0.37∼8.47 | −2.58∼5.91 | 1.35∼25.90 |
| Van der Meer (1988) | RTn–E,S | 31 | 0.08∼0.23 | 1.94∼2.60 | 0.01∼0.05 | −0.10∼0.13 | 0.30 | 0.04 | 2.08∼6.42 | −0.89∼1.68 | 1.30∼4.00 |
| DH-H524 (1990) | RTn–E | 14 | 0.06∼0.14 | 1.83∼2.56 | 0.01∼0.03 | 0.12∼0.20 | 0.08∼0.17 | 0.02∼0.03 | 2.16∼6.53 | 0.90∼2.31 | 0.66∼2.99 |
| Daemen (1991) | RTn–E,S | 53 | 0.03∼0.15 | 0.98∼2.88 | 0.01∼0.05 | −0.06∼0.20 | 0.34 | 0.04∼0.06 | 0.80∼3.70 | −0.65∼4.03 | 2.30∼10.63 |
| DH-H1872 (1994) | Rma–E | 39 | 0.07∼0.17 | 1.02∼2.22 | 0.02∼0.05 | 0.11∼0.19 | 0.14 | 0.04∼0.05 | 1.38∼3.71 | 0.66∼1.82 | 0.83∼2.14 |
| DH-H2061 (1994) | RMn–E,S | 32 | 0.09∼0.25 | 1.24∼2.89 | 0.02∼0.04 | −0.05∼0.20 | 0.20 | 0.04∼0.05 | 2.54∼6.23 | −0.43∼2.25 | 0.82∼2.25 |
| DH-H2014 (1994) | SI–E,S | 11 | 0.14∼0.21 | 1.80∼2.16 | 0.02∼0.05 | −0.16∼0.08 | 0.20 | / | / | −1.00∼0.41 | 0.97∼1.39 |
| DH-H1974 (1994) | Rma–E | 10 | 0.09∼0.19 | 1.57∼2.45 | 0.02∼0.03 | 0.10–0.15 | 0.35 | 0.05 | 1.73∼3.62 | 0.55∼1.65 | 1.90∼3.98 |
| TU Delft (1997) | Rma–E | 137 | 0.05∼0.20 | 1.03∼2.50 | 0.01∼0.05 | 0.00∼0.34 | 0.11∼0.40 | 0.03∼0.05 | 1.24∼5.94 | 0.00∼5.22 | 0.56∼6.45 |
| Taviera Pinto (1997) | SI–S | 552 | 0.02∼0.10 | 0.80∼1.50 | 0.01∼0.12 | −0.04∼0.00 | 0.05∼0.10 | / | / | −1.82∼0.00 | 0.51∼4.55 |
| Seebrook & Hall (1998) | RMn–S | 633 | 0.05∼0.19 | 1.16∼2.13 | 0.01∼0.08 | −0.20∼0.00 | 0.30∼3.50 | 0.06 | 0.78∼3.20 | −3.92∼0.00 | 1.59∼74.47 |
| Zannutigh (2000) | RMn–E,S | 56 | 0.02∼0.15 | 0.74∼1.97 | 0.02∼0.05 | −0.07∼0.03 | 0.20∼0.60 | 0.05 | 0.43∼3.22 | −1.58∼1.53 | 1.44∼30.70 |
| Van der Meer (2000) | SI–E,S | 28 | 0.04∼0.15 | 1.03∼1.75 | 0.01∼0.06 | −0.01∼0.13 | 0.13∼1.33 | / | / | −0.10∼1.10 | 0.99∼33.78 |
| UCA (2001) | RMn–E,S | 53 | 0.03∼0.09 | 1.60∼3.20 | 0.003∼0.03 | −0.05∼0.05 | 0.25∼1.00 | 0.04 | 0.84∼2.40 | −1.50∼1.53 | 2.67∼30.66 |
| Daemrich, Mai, Ohle (2001) | RMn–E,S | 100 | 0.02∼0.15 | 1.00∼1.75 | 0.01∼0.07 | −0.20∼0.05 | 0.20 | 0.04 | 0.48∼3.51 | −9.84∼0.78 | 1.36∼9.95 |
| Kimura (2002) | Rma–S | 90 | 0.10∼0.15 | 1.62∼2.84 | 0.01∼0.04 | −0.02 | 0.24∼1.14 | 0.09 | 1.11∼1.66 | −0.22∼−0.15 | 1.57∼11.38 |
| Aquareef (2002) | Rta–S | 1063 | 0.03∼0.14 | 1.07∼2.39 | 0.004–0.08 | −0.11∼−0.01 | 0.12–2.35 | 0.04 | 0.65–3.55 | −4.09∼−0.05 | 0.93∼90.48 |
| UPC (2002) | RMn–E,S | 20 | 0.28∼0.46 | 2.56∼3.41 | 0.02∼0.04 | −0.11∼0.15 | 1.22∼1.83 | 0.11 | 2.59∼4.27 | −0.37∼0.38 | 2.64∼6.53 |
| Wang (2002) | RMn–E,S | 84 | 0.06∼0.17 | 1.02∼2.33 | 0.02∼0.06 | −0.05∼0.05 | 0.10 | 0.05 | 1.28∼3.51 | −0.66∼0.83 | 0.60∼1.67 |
| Wang (2002) | SI–E,S | 84 | 0.06∼0.20 | 1.02∼2.33 | 0.02∼0.06 | −0.05∼0.05 | 0.20 | / | / | −0.59∼0.83 | 1.00∼3.33 |
| Melito & Melby (2002) | Rma–E,S | 122 | 0.03∼0.23 | 1.07∼3.36 | 0.01∼0.06 | −0.30∼0.30 | 0.243 | 0.05 | 0.69∼4.65 | −8.25∼8.87 | 1.06∼7.19 |
| GWK (2002) | RMn–E,S | 45 | 0.45∼0.96 | 3.50∼6.50 | 0.01∼0.03 | −0.40∼0.30 | 1.00∼4.00 | 0.23 | 2.02∼4.26 | −0.76∼0.66 | 1.06∼8.13 |
| DH-H4087 (2002) | RMn–S | 20 | 0.09∼0.12 | 1.61∼1.80 | 0.026∼0.029 | −0.14∼−0.05 | 1.00∼2.50 | 0.02∼0.03 | 3.50∼4.82 | −1.21∼−0.37 | 8.66∼22.86 |
| DH−4171 (2003) | SI–E,S | 9 | 0.68∼1.36 | 3.38∼4.46 | 0.04∼0.06 | −0.21∼0.50 | 1.75 | / | / | −0.18∼0.73 | 1.29∼2.57 |
| Ruol and Faedo (2004) | RMn–E | 11 | 0.03∼0.15 | 0.97∼2.44 | 0.02∼0.05 | 0.05 | 0.20 | 0.05 | 0.46∼2.70 | 0.34∼2.00 | 1.37∼8.00 |
| Mori and Cappietti (2006) | RMn–E,S | 57 | 0.07∼0.10 | 1.50∼1.80 | 0.03∼0.04 | −0.03∼0.03 | 0.01∼0.21 | 0.03 | 2.31∼3.38 | −0.45∼0.45 | 0.10∼3.13 |
| Koraim (2014) | SI–S | ∼70 | 0.03∼0.10 | 0.80∼1.80 | 0.01∼0.08 | −0.35∼−0.05 | 0.30∼0.90 | / | / | −11.67∼−0.50 | 3.00∼30.00 |
| The (2014) | Rma–S | nd | 0.03∼0.13 | 0.60∼2.00 | 0.001∼0.04 | −0.15∼0.00 | 0.15 | / | / | −5.77∼0.00 | 1.19∼5.77 |
| Lokesha (2015) | SI, Sist–S | 80 | 0.03∼0.09 | 0.55∼0.95 | 0.003∼0.03 | −0.05∼0.00 | 0.10∼0.30 | / | / | −1.67∼0.00 | 1.11∼10.00 |
| Grajewska (2017) | RMn–S | 48 | 0.06∼0.11 | 1.60∼2.14 | 0.01∼0.03 | −0.10∼−0.05 | 0.30 | 0.09 | 0.69∼1.27 | −1.59∼−0.46 | 2.62∼4.81 |
| Kim (2018) | Rma–E | nd | 0.05∼0.15 | 1.13∼1.60 | 0.02∼0.04 | 0.05∼0.20 | 0.3∼0.4 | 0.34 | 0.15∼0.44 | 0.33∼4.00 | 2.00∼8.00 |
| Metallinos (2019) | RMn–S | 8 | 0.05∼0.08 | 1.25∼2.00 | 0.001∼0.005 | −0.05 | 0.50 | 0.05 | 0.90∼1.60 | −1.11∼−0.63 | 6.25∼11.11 |
| Liu (2019) | SI–S | 18 | 0.05∼0.10 | 1.47∼2.94 | 0.001∼0.005 | −0.24∼−0.14 | 1.50 | / | / | −4.80∼−1.40 | 15.00∼30.00 |
| Koley (2020) | RMn–E,S | 30 | 0.05∼0.15 | 0.95∼5.43 | 0.004∼0.11 | −0.10∼0.10 | 0.20 | nd | nd | −2.00∼2.00 | 1.33∼4.00 |
| Mohmoudof (2021) | SI–S | 15 | 0.04∼0.08 | 1.10∼1.90 | 0.01∼0.03 | −0.15∼−0.05 | 0.90 | / | / | −3.44∼−0.65 | 11.63∼20.64 |
| TOT | 4144 | 0.01∼1.36 | 0.55∼6.50 | 0.001∼0.12 | −0.42∼0.34 | 0.01∼4.00 | 0.02∼0.34 | 0.15∼8.47 | −11.67∼8.87 | 0.10∼90.48 |
| Total Data | Van der Meer (1990) | Van der Meer & Daemen (1994) | Seabrook & Hall (1998) | Calabrese (2002) | Buccino (2007) | D’Angremond (1996) | Briganti (2003) | Goda & Ahrens (2008) | Tomasicchio & D’Alessandro (2013) | Zhang (2014) | Sindhu (2015) | Kurdistani (2022) | |
|---|---|---|---|---|---|---|---|---|---|---|---|---|---|
| Seelig (1980)-smooth | 13 | 2 | 0 | 0 | 0 | 3 | 4 | 4 | 5 | 5 | 0 | 0 | 0 |
| Seelig (1980)-rubble mound | 69 | 26 | 25 | 28 | 2 | 30 | 51 | 27 | 32 | 44 | 32 | 0 | 24 |
| Allsop (1983) | 21 | 8 | 3 | 0 | 0 | 0 | 3 | 11 | 3 | 5 | 0 | 0 | 0 |
| Daemrich and Kahle (1985)-smooth | 147 | 73 | 0 | 0 | 0 | 84 | 137 | 111 | 73 | 73 | 0 | 0 | 0 |
| Daemrich and Kahle (1985)- rubble mound | 196 | 114 | 110 | 79 | 4 | 123 | 147 | 109 | 157 | 109 | 59 | 0 | 96 |
| Powell and Allsop (1985) | 42 | 38 | 25 | 20 | 5 | 35 | 37 | 24 | 37 | 26 | 25 | 0 | 29 |
| Delft M2090 (1985)-smooth | 7 | 1 | 0 | 0 | 0 | 0 | 0 | 1 | 4 | 4 | 0 | 0 | 0 |
| Delft M2090 (1985)-rubble mound | 31 | 7 | 8 | 0 | 0 | 0 | 16 | 2 | 0 | 12 | 2 | 0 | 0 |
| Ahrens (1987) | 201 | 124 | 59 | 0 | 0 | 75 | 79 | 82 | 107 | 52 | 14 | 38 | 46 |
| Van der Meer (1988) | 31 | 23 | 20 | 9 | 0 | 13 | 21 | 26 | 17 | 14 | 12 | 0 | 9 |
| Delft H524 (1990) | 14 | 0 | 4 | 0 | 0 | 0 | 7 | 4 | 0 | 2 | 0 | 0 | 0 |
| Daemen (1991) | 53 | 17 | 26 | 10 | 3 | 14 | 35 | 14 | 19 | 21 | 10 | 8 | 11 |
| Delft H1872 (1994) | 39 | 19 | 10 | 0 | 0 | 0 | 21 | 9 | 1 | 8 | 0 | 0 | 0 |
| Delft H2061 (1994) | 32 | 24 | 12 | 3 | 3 | 24 | 23 | 2 | 24 | 10 | 13 | 10 | 6 |
| Delft H2014 (1994) | 11 | 5 | 0 | 0 | 0 | 7 | 7 | 7 | 10 | 10 | 0 | 0 | 0 |
| Delft H1974 (1994) | 10 | 0 | 2 | 0 | 0 | 0 | 4 | 2 | 0 | 2 | 3 | 0 | 0 |
| TU Delft (1997) | 137 | 30 | 1 | 0 | 0 | 0 | 50 | 56 | 29 | 11 | 37 | 0 | 0 |
| Taveira Pinto (1987) | 552 | 224 | 0 | 0 | 13 | 217 | 426 | 399 | 87 | 87 | 0 | 0 | 0 |
| Seebrook and Hall (1998) | 633 | 147 | 107 | 444 | 21 | 538 | 333 | 407 | 376 | 304 | 67 | 34 | 299 |
| Zannutigh (2000) | 56 | 22 | 8 | 12 | 0 | 17 | 28 | 27 | 24 | 20 | 11 | 0 | 9 |
| Van der Meer (2000) | 28 | 5 | 0 | 0 | 0 | 0 | 3 | 2 | 10 | 10 | 0 | 0 | 0 |
| UCA (2001) | 53 | 20 | 21 | 16 | 1 | 25 | 25 | 22 | 29 | 26 | 8 | 3 | 10 |
| Daemrich,Mai,Ohle (2001) | 100 | 43 | 65 | 52 | 0 | 91 | 93 | 36 | 82 | 66 | 45 | 65 | 68 |
| Kimura (2002) | 90 | 58 | 7 | 9 | 35 | 9 | 43 | 78 | 40 | 7 | 0 | 0 | 0 |
| Aquareef (2002) | 1063 | 430 | 444 | 782 | 129 | 902 | 751 | 405 | 830 | 800 | 240 | 53 | 389 |
| UPC (2002) | 20 | 5 | 5 | 5 | 0 | 10 | 14 | 16 | 12 | 5 | 3 | 2 | 5 |
| Wang (2002)-rubble mound | 84 | 76 | 21 | 3 | 0 | 61 | 65 | 26 | 68 | 48 | 55 | 0 | 19 |
| Wang (2002)-smooth | 84 | 44 | 0 | 0 | 0 | 38 | 44 | 44 | 50 | 50 | 0 | 0 | 0 |
| Melito&Melby (2002) | 122 | 42 | 35 | 11 | 0 | 21 | 59 | 41 | 16 | 33 | 10 | 1 | 16 |
| Calabrese and Buccino (2002) | 45 | 23 | 10 | 14 | 0 | 25 | 34 | 44 | 35 | 21 | 5 | 0 | 12 |
| Delft H4087 (2002) | 20 | 1 | 0 | 3 | 0 | 9 | 20 | 6 | 15 | 9 | 0 | 4 | 5 |
| Delft H4171 (2003) | 9 | 0 | 0 | 0 | 0 | 0 | 0 | 0 | 3 | 3 | 0 | 0 | 0 |
| Ruol and Faedo (2004) | 11 | 7 | 0 | 0 | 0 | 0 | 1 | 9 | 11 | 0 | 0 | 0 | 0 |
| Mori and Cappietti (2005) | 57 | 16 | 19 | 0 | 0 | 9 | 0 | 0 | 15 | 22 | 32 | 5 | 0 |
| Kubowicz-Grajewska (2017) | 48 | 4 | 0 | 0 | 0 | 0 | 1 | 1 | 0 | 0 | 0 | 0 | 0 |
| Mahmoudof (2021) | 15 | 5 | 0 | 0 | 0 | 0 | 2 | 0 | 2 | 2 | 0 | 0 | 0 |
| Number of data | 4144 | 3801 | 2087 | 2129 | 470 | 3452 | 4144 | 4144 | 4144 | 4144 | 2887 | 2698 | 2259 |
| N° of calculated data Kt,cal in the interval ±20% Kt,obs | 1683 | 1047 | 1500 | 216 | 2380 | 2584 | 2054 | 2223 | 1921 | 683 | 223 | 1053 | |
| % of calculated data Kt,cal in the interval ±20% Kt,obs | 44% | 50% | 70% | 46% | 69% | 62% | 50% | 54% | 46% | 24% | 8% | 47% |
| Total Data | Van der Meer (1990) | Van der Meer & Daemen (1994) | Seabrook & Hall (1998) | Calabrese (2002) | Buccino (2007) | D’Agremond (1996) | Briganti (2003) | Goda & Ahrens (2008) | Tomasicchio & D’Alessandro (2013) | Zhang (2014) | Sindhu (2015) | Kurdistani (2022) | |
|---|---|---|---|---|---|---|---|---|---|---|---|---|---|
| Seelig (1980)-smooth | 13 | 7 | 0 | 0 | 0 | 6 | 8 | 10 | 6 | 6 | 0 | 0 | 0 |
| Seelig (1980)-rubble mound | 69 | 43 | 33 | 38 | 2 | 41 | 65 | 52 | 43 | 64 | 50 | 8 | 40 |
| Allsop (1983) | 21 | 16 | 12 | 0 | 0 | 0 | 16 | 16 | 5 | 14 | 0 | 0 | 0 |
| Daemrich and Kahle (1985)-smooth | 147 | 123 | 0 | 0 | 0 | 147 | 147 | 147 | 147 | 147 | 0 | 0 | 0 |
| Daemrich and Kahle (1985)- rubble mound | 196 | 149 | 153 | 128 | 5 | 187 | 192 | 183 | 187 | 191 | 112 | 67 | 132 |
| Powell and Allsop (1985) | 42 | 39 | 35 | 26 | 5 | 36 | 41 | 42 | 42 | 41 | 37 | 1 | 33 |
| Delft M2090 (1985)-smooth | 7 | 1 | 0 | 0 | 0 | 0 | 1 | 3 | 4 | 4 | 0 | 0 | 0 |
| Delft M2090 (1985)-rubble mound | 31 | 17 | 24 | 0 | 0 | 0 | 24 | 14 | 0 | 24 | 10 | 0 | 0 |
| Ahrens (1987) | 201 | 165 | 98 | 0 | 0 | 91 | 131 | 150 | 183 | 129 | 111 | 91 | 91 |
| Van der Meer (1988) | 31 | 24 | 27 | 11 | 0 | 13 | 29 | 30 | 22 | 31 | 22 | 11 | 11 |
| Delft H524 (1990) | 14 | 1 | 7 | 0 | 0 | 0 | 8 | 11 | 0 | 7 | 0 | 0 | 0 |
| Daemen (1991) | 53 | 34 | 48 | 15 | 4 | 15 | 50 | 36 | 35 | 43 | 33 | 15 | 15 |
| Delft H1872 (1994) | 39 | 34 | 22 | 0 | 0 | 0 | 37 | 26 | 7 | 25 | 2 | 0 | 0 |
| Delft H2061 (1994) | 32 | 24 | 13 | 9 | 3 | 24 | 24 | 24 | 24 | 25 | 25 | 16 | 16 |
| Delft H2014 (1994) | 11 | 11 | 0 | 0 | 0 | 10 | 11 | 11 | 11 | 11 | 0 | 0 | 0 |
| Delft H1974 (1994) | 10 | 0 | 9 | 0 | 3 | 0 | 10 | 3 | 1 | 8 | 4 | 0 | 0 |
| TU Delft (1997) | 137 | 98 | 66 | 0 | 0 | 34 | 105 | 81 | 86 | 93 | 53 | 0 | 0 |
| Taveira Pinto (1987) | 552 | 552 | 0 | 0 | 42 | 537 | 536 | 536 | 549 | 549 | 0 | 0 | 0 |
| Seebrook and Hall (1998) | 633 | 255 | 117 | 503 | 23 | 586 | 488 | 562 | 532 | 547 | 226 | 93 | 446 |
| Zannutigh (2000) | 56 | 38 | 22 | 16 | 0 | 29 | 47 | 43 | 52 | 48 | 33 | 0 | 16 |
| Van der Meer (2000) | 28 | 14 | 0 | 0 | 0 | 0 | 16 | 14 | 15 | 15 | 0 | 0 | 0 |
| UCA (2001) | 53 | 27 | 25 | 18 | 3 | 32 | 35 | 41 | 35 | 31 | 24 | 17 | 18 |
| Daemrich, Mai, Ohle (2001) | 100 | 66 | 68 | 66 | 0 | 92 | 98 | 94 | 92 | 98 | 82 | 71 | 71 |
| Kimura (2002) | 90 | 86 | 69 | 64 | 71 | 69 | 87 | 82 | 87 | 87 | 31 | 0 | 0 |
| Aquareef (2002) | 1063 | 773 | 593 | 1019 | 192 | 1037 | 971 | 954 | 1008 | 1028 | 693 | 277 | 853 |
| UPC (2002) | 20 | 15 | 14 | 10 | 0 | 10 | 20 | 19 | 15 | 20 | 17 | 10 | 10 |
| Wang (2002)-rubble mound | 84 | 84 | 44 | 10 | 0 | 62 | 80 | 77 | 80 | 80 | 78 | 15 | 26 |
| Wang (2002)-smooth | 84 | 73 | 0 | 0 | 0 | 59 | 72 | 72 | 75 | 75 | 0 | 0 | 0 |
| Melito & Melby (2002) | 122 | 63 | 83 | 11 | 5 | 31 | 98 | 89 | 38 | 79 | 36 | 20 | 22 |
| Calabrese and Buccino (2002) | 45 | 43 | 25 | 25 | 0 | 35 | 44 | 45 | 43 | 44 | 39 | 14 | 25 |
| Delft H4087 (2002) | 20 | 10 | 0 | 20 | 0 | 20 | 20 | 20 | 20 | 20 | 0 | 14 | 15 |
| Delft H4171 (2003) | 9 | 1 | 0 | 0 | 0 | 1 | 2 | 2 | 6 | 6 | 0 | 0 | 0 |
| Ruol and Faedo (2004) | 11 | 10 | 2 | 0 | 0 | 0 | 9 | 9 | 11 | 9 | 9 | 0 | 0 |
| Mori and Cappietti (2005) | 57 | 29 | 39 | 0 | 0 | 23 | 26 | 9 | 28 | 41 | 44 | 33 | 0 |
| Kubowicz-Grajewska (2017) | 48 | 46 | 0 | 0 | 8 | 19 | 45 | 45 | 24 | 24 | 0 | 0 | 0 |
| Mahmoudof (2021) | 15 | 10 | 0 | 0 | 0 | 0 | 12 | 0 | 13 | 13 | 0 | 0 | 0 |
| Number of data | 4144 | 3801 | 2087 | 2129 | 470 | 3452 | 4144 | 4144 | 4144 | 4144 | 2887 | 2698 | 2259 |
| N° of calculated data Kt,cal in the interval ±50% Kt,obs | 2981 | 1648 | 1989 | 366 | 3246 | 3605 | 3552 | 3526 | 3677 | 1771 | 773 | 1840 | |
| % of calculated data Kt,cal in the interval ±50% Kt,obs | 78% | 79% | 93% | 78% | 94% | 87% | 86% | 85% | 89% | 61% | 29% | 81% |
| Van der Meer (1990) | Van der Meer & Daemen (1994) | Seabrook & Hall (1998) | Calabrese (2002) | Buccino (2007) | D’Agremond (1996) | Briganti (2003) | Goda & Ahrens (2008) | Tomasicchio & D’Alessandro (2013) | Zhang (2014) | Sindhu (2015) | Kurdistani (2022) | |
|---|---|---|---|---|---|---|---|---|---|---|---|---|
| Seelig (1980)-smooth | 0.097 | / | / | / | 0.064 | 0.117 | 0.116 | 0.069 | 0.069 | / | / | / |
| Seelig (1980)-rubble mound | 0.110 | 0.091 | 0.120 | 0.015 | 0.122 | 0.086 | 0.155 | 0.179 | 0.111 | 0.144 | 0.468 | 0.171 |
| Allsop (1983) | 0.042 | 0.080 | / | / | / | 0.073 | 0.042 | 0.168 | 0.080 | 0.154 | / | / |
| Daemrich and Kahle (1985)-smooth | 0.157 | / | / | / | 0.150 | 0.076 | 0.118 | 0.171 | 0.171 | / | / | / |
| Daemrich and Kahle (1985)-rubble mound | 0.132 | 0.098 | 0.134 | 0.086 | 0.111 | 0.093 | 0.130 | 0.092 | 0.123 | 0.262 | 0.338 | 0.113 |
| Powell and Allsop (1985) | 0.047 | 0.122 | 0.115 | 0.029 | 0.052 | 0.075 | 0.134 | 0.082 | 0.124 | 0.129 | 0.494 | 0.096 |
| Delft M2090 (1985)-smooth | 0.094 | / | / | / | / | 0.112 | 0.110 | 0.022 | 0.022 | / | / | / |
| Delft M2090 (1985)-rubble mound | 0.068 | 0.054 | / | / | / | 0.039 | 0.087 | 0.202 | 0.048 | 0.085 | / | / |
| Ahrens (1987) | 0.115 | 0.126 | / | / | 0.093 | 0.183 | 0.179 | 0.120 | 0.199 | 0.237 | 0.161 | 0.142 |
| Van der Meer (1988) | 0.055 | 0.058 | 0.119 | / | 0.051 | 0.063 | 0.035 | 0.114 | 0.114 | 0.166 | 0.278 | 0.082 |
| Delft H524 (1990) | 0.079 | 0.027 | / | / | / | 0.024 | 0.035 | 0.226 | 0.035 | 0.064 | / | / |
| Daemen (1991) | 0.098 | 0.056 | 0.097 | 0.050 | 0.053 | 0.041 | 0.093 | 0.090 | 0.081 | 0.139 | 0.137 | 0.078 |
| Delft H1872 (1994) | 0.035 | 0.102 | / | / | / | 0.050 | 0.084 | 0.187 | 0.077 | 0.158 | / | / |
| Delft H2061 (1994) | 0.043 | 0.070 | 0.255 | 0.044 | 0.029 | 0.057 | 0.159 | 0.132 | 0.100 | 0.098 | 0.088 | 0.128 |
| Delft H2014 (1994) | 0.090 | / | / | / | 0.077 | 0.068 | 0.073 | 0.065 | 0.065 | / | / | / |
| Delft H1974 (1994) | 0.102 | 0.050 | / | 0.110 | / | 0.028 | 0.090 | 0.103 | 0.048 | 0.059 | / | / |
| TU Delft (1997) | 0.130 | 0.190 | / | / | 0.206 | 0.091 | 0.096 | 0.136 | 0.168 | 0.123 | / | / |
| Taviera Pinto (1987) | 0.177 | / | / | 0.186 | 0.197 | 0.133 | 0.142 | 0.233 | 0.233 | / | / | / |
| Seebrook and Hall (1998) | 0.279 | 0.262 | 0.076 | 0.043 | 0.040 | 0.132 | 0.084 | 0.114 | 0.122 | 0.368 | 0.399 | 0.116 |
| Zannutigh (2000) | 0.146 | 0.140 | 0.115 | / | 0.123 | 0.105 | 0.121 | 0.095 | 0.129 | 0.216 | 0.406 | 0.119 |
| Van der Meer (2000) | 0.155 | / | / | / | 0.214 | 0.104 | 0.107 | 0.098 | 0.098 | / | / | / |
| UCA (2001) | 0.194 | 0.148 | 0.070 | 0.052 | 0.055 | 0.098 | 0.086 | 0.101 | 0.087 | 0.243 | 0.226 | 0.109 |
| Daemrich, Mai, Ohle (2001) | 0.110 | 0.050 | 0.102 | / | 0.073 | 0.051 | 0.122 | 0.098 | 0.109 | 0.134 | 0.091 | 0.074 |
| Kimura (2002) | 0.123 | 0.204 | 0.220 | 0.130 | 0.205 | 0.131 | 0.104 | 0.145 | 0.194 | 0.302 | / | / |
| Aquareef (2002) | 0.174 | 0.132 | 0.093 | 0.076 | 0.061 | 0.097 | 0.130 | 0.075 | 0.083 | 0.248 | 0.349 | 0.138 |
| UPC (2002) | 0.120 | 0.138 | 0.091 | / | 0.051 | 0.061 | 0.048 | 0.095 | 0.082 | 0.149 | 0.133 | 0.096 |
| Wang (2002)-rubble mound | 0.037 | 0.108 | 0.323 | / | 0.041 | 0.064 | 0.135 | 0.066 | 0.095 | 0.090 | 0.291 | 0.095 |
| Wang (2002)-smooth | 0.116 | / | / | / | 0.106 | 0.120 | 0.121 | 0.096 | 0.096 | / | / | / |
| Melito & Melby (2002) | 0.111 | 0.116 | 0.083 | 0.198 | 0.178 | 0.100 | 0.082 | 0.281 | 0.132 | 0.205 | 0.321 | 0.155 |
| GWK (2002) | 0.104 | 0.188 | 0.098 | / | 0.091 | 0.075 | 0.042 | 0.081 | 0.112 | 0.171 | 0.274 | 0.104 |
| Delft H4087 (2002) | 0.248 | 0.390 | 0.108 | / | 0.096 | 0.039 | 0.108 | 0.085 | 0.112 | 0.401 | 0.221 | 0.145 |
| Delft H4171 (2003) | 0.269 | / | / | / | 0.217 | 0.223 | 0.223 | 0.130 | 0.130 | / | / | / |
| Ruol and Faedo (2004) | 0.045 | 0.159 | / | / | / | 0.101 | 0.068 | 0.026 | 0.096 | 0.107 | / | / |
| Mori and Cappietti (2005) | 0.179 | 0.110 | 0.291 | / | 0.153 | 0.176 | 0.293 | 0.187 | 0.107 | 0.078 | 0.162 | / |
| Kubowicz-Grajewska (2017) | 0.304 | / | / | 0.378 | 0.404 | 0.319 | 0.319 | 0.374 | 0.374 | / | / | / |
| Mahmoudof (2021) | 0.154 | / | / | / | 0.415 | 0.183 | 0.379 | 0.203 | 0.203 | / | / | / |
| RMSE | 0.126 | 0.126 | 0.139 | 0.107 | 0.129 | 0.100 | 0.124 | 0.132 | 0.117 | 0.174 | 0.269 | 0.115 |
Publisher’s Note: MDPI stays neutral with regard to jurisdictional claims in published maps and institutional affiliations. |
© 2022 by the authors. Licensee MDPI, Basel, Switzerland. This article is an open access article distributed under the terms and conditions of the Creative Commons Attribution (CC BY) license (https://creativecommons.org/licenses/by/4.0/).
Share and Cite
Brancasi, A.; Leone, E.; Francone, A.; Scaravaglione, G.; Tomasicchio, G.R. On Formulae for Wave Transmission at Submerged and Low-Crested Breakwaters. J. Mar. Sci. Eng. 2022, 10, 1986. https://doi.org/10.3390/jmse10121986
Brancasi A, Leone E, Francone A, Scaravaglione G, Tomasicchio GR. On Formulae for Wave Transmission at Submerged and Low-Crested Breakwaters. Journal of Marine Science and Engineering. 2022; 10(12):1986. https://doi.org/10.3390/jmse10121986
Chicago/Turabian StyleBrancasi, Alberica, Elisa Leone, Antonio Francone, Giulio Scaravaglione, and Giuseppe Roberto Tomasicchio. 2022. "On Formulae for Wave Transmission at Submerged and Low-Crested Breakwaters" Journal of Marine Science and Engineering 10, no. 12: 1986. https://doi.org/10.3390/jmse10121986
APA StyleBrancasi, A., Leone, E., Francone, A., Scaravaglione, G., & Tomasicchio, G. R. (2022). On Formulae for Wave Transmission at Submerged and Low-Crested Breakwaters. Journal of Marine Science and Engineering, 10(12), 1986. https://doi.org/10.3390/jmse10121986