
Pathways and Hot Spots of Floating and Submerged Microplastics in Atlantic Iberian Marine Waters: A Modelling Approach

 ,
,  , ,
, ,  and
and 
Abstract
1. Introduction
2. Methods
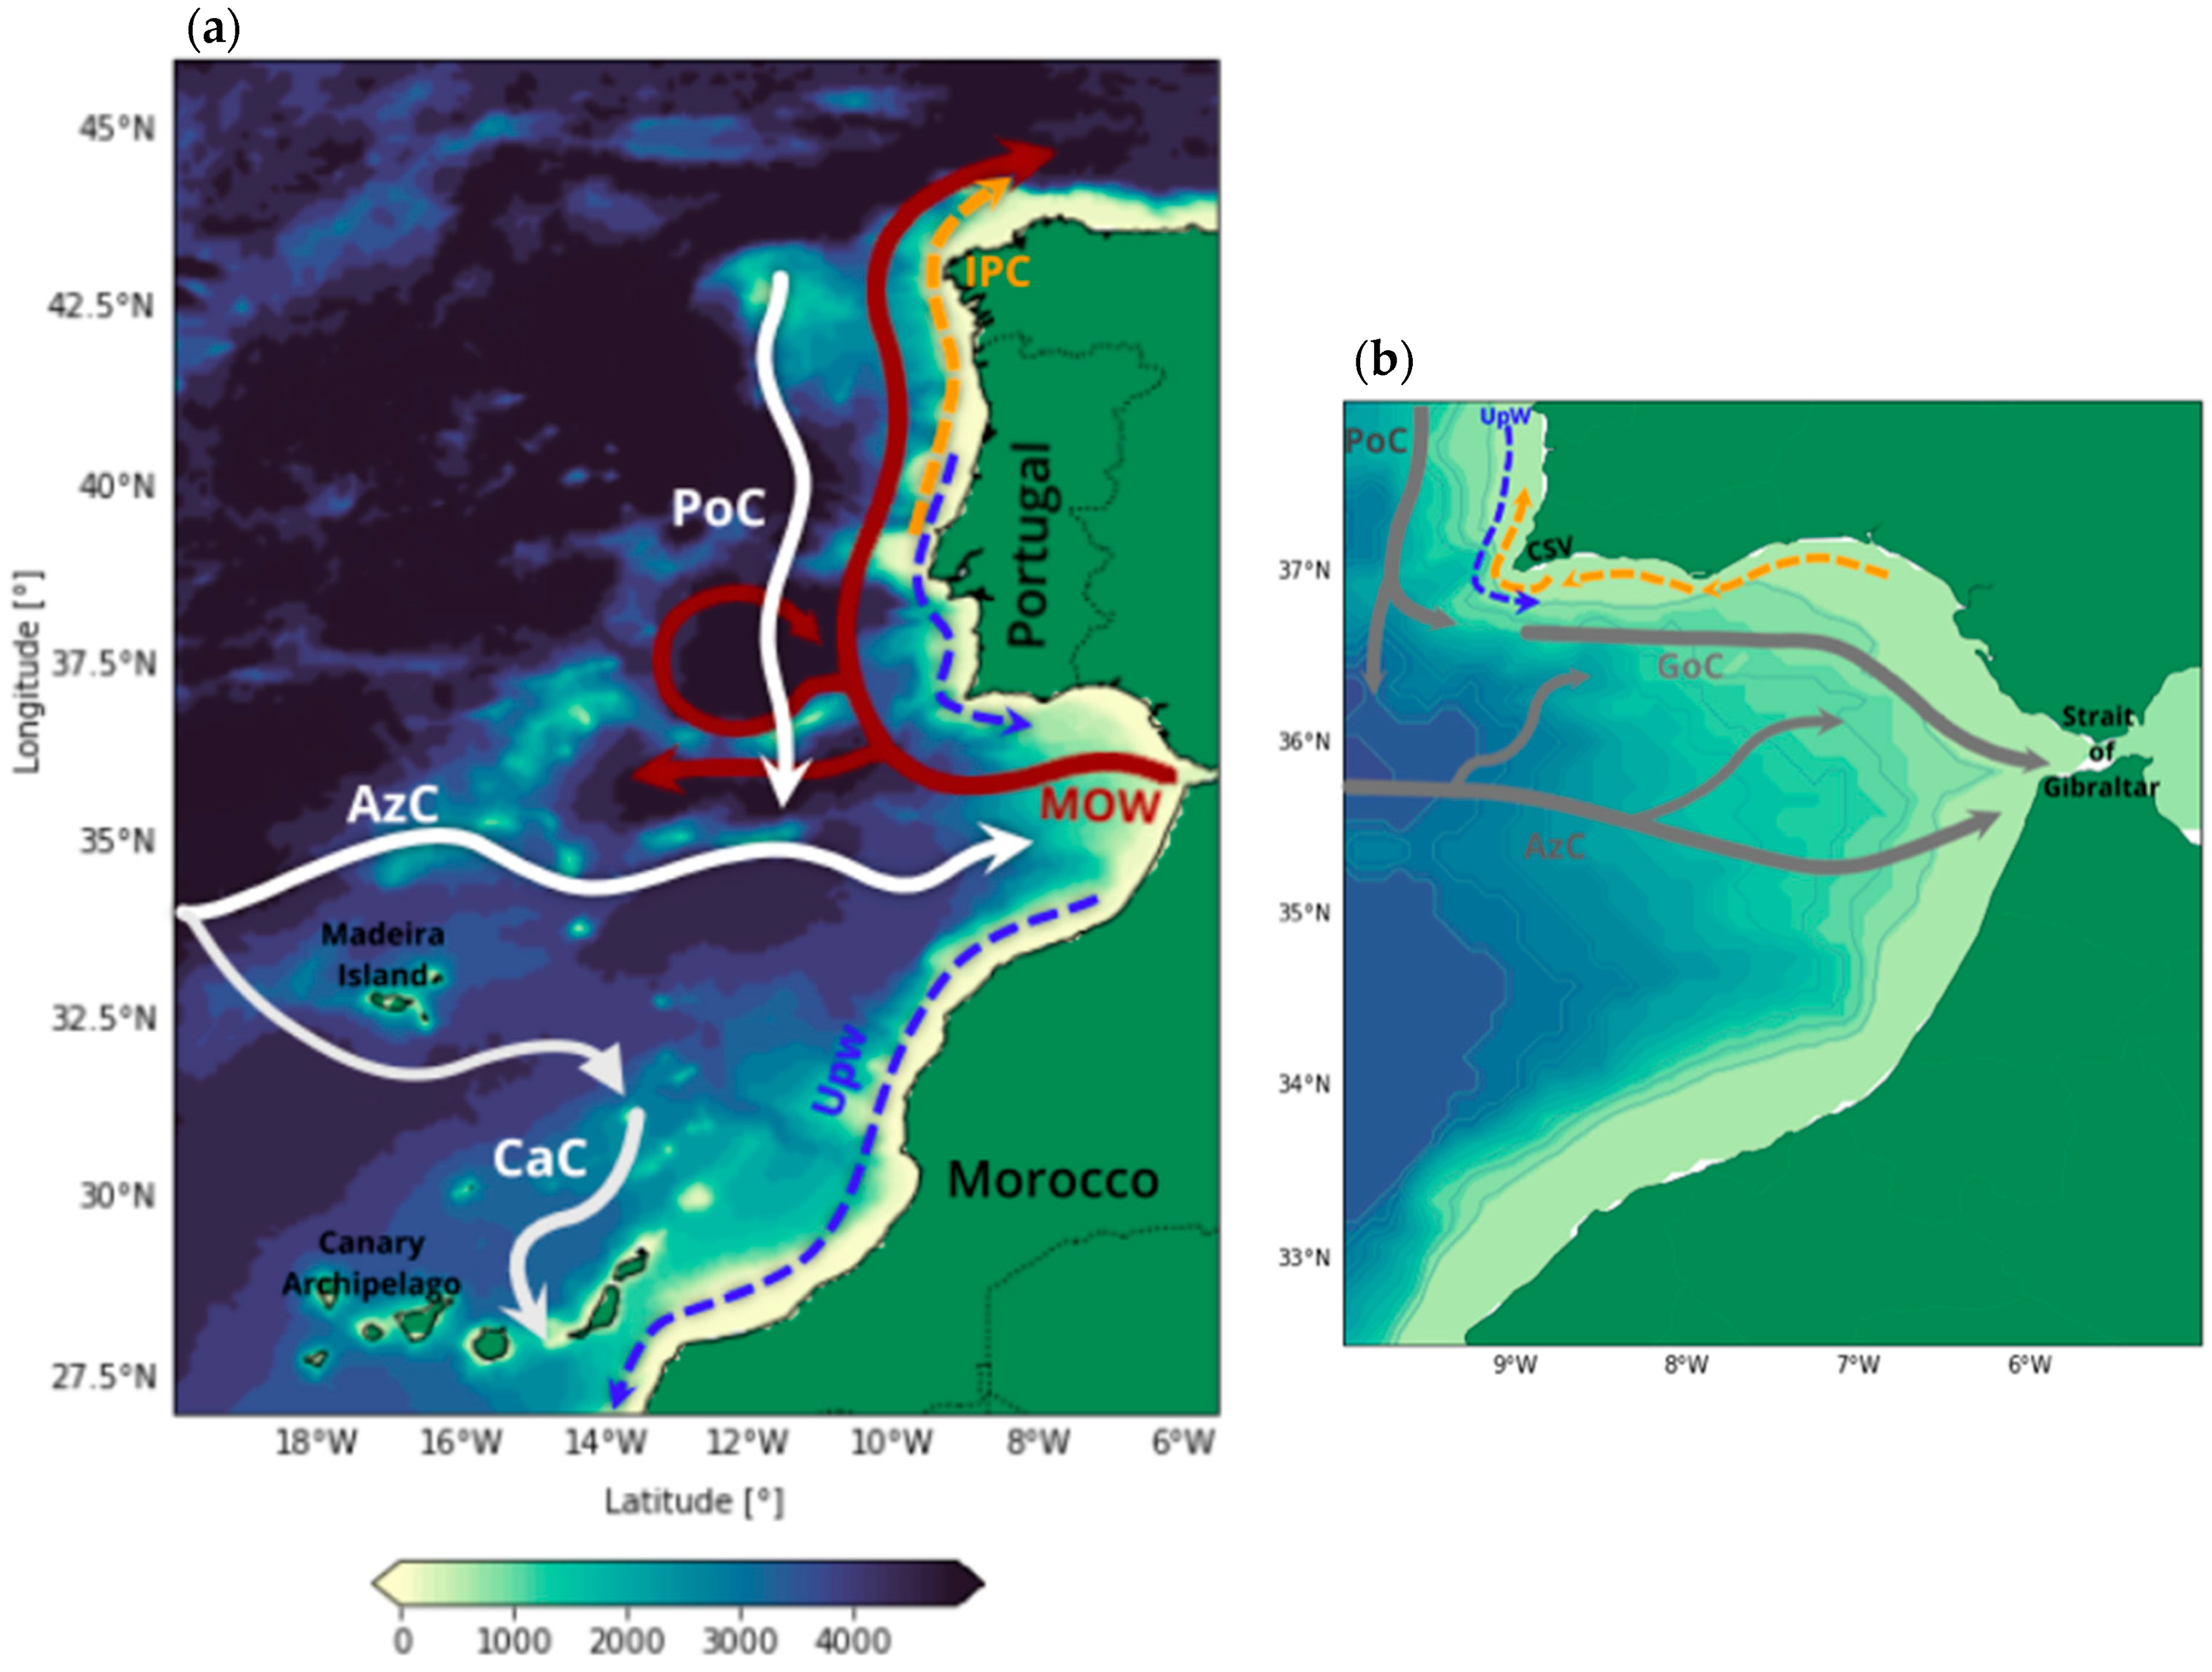
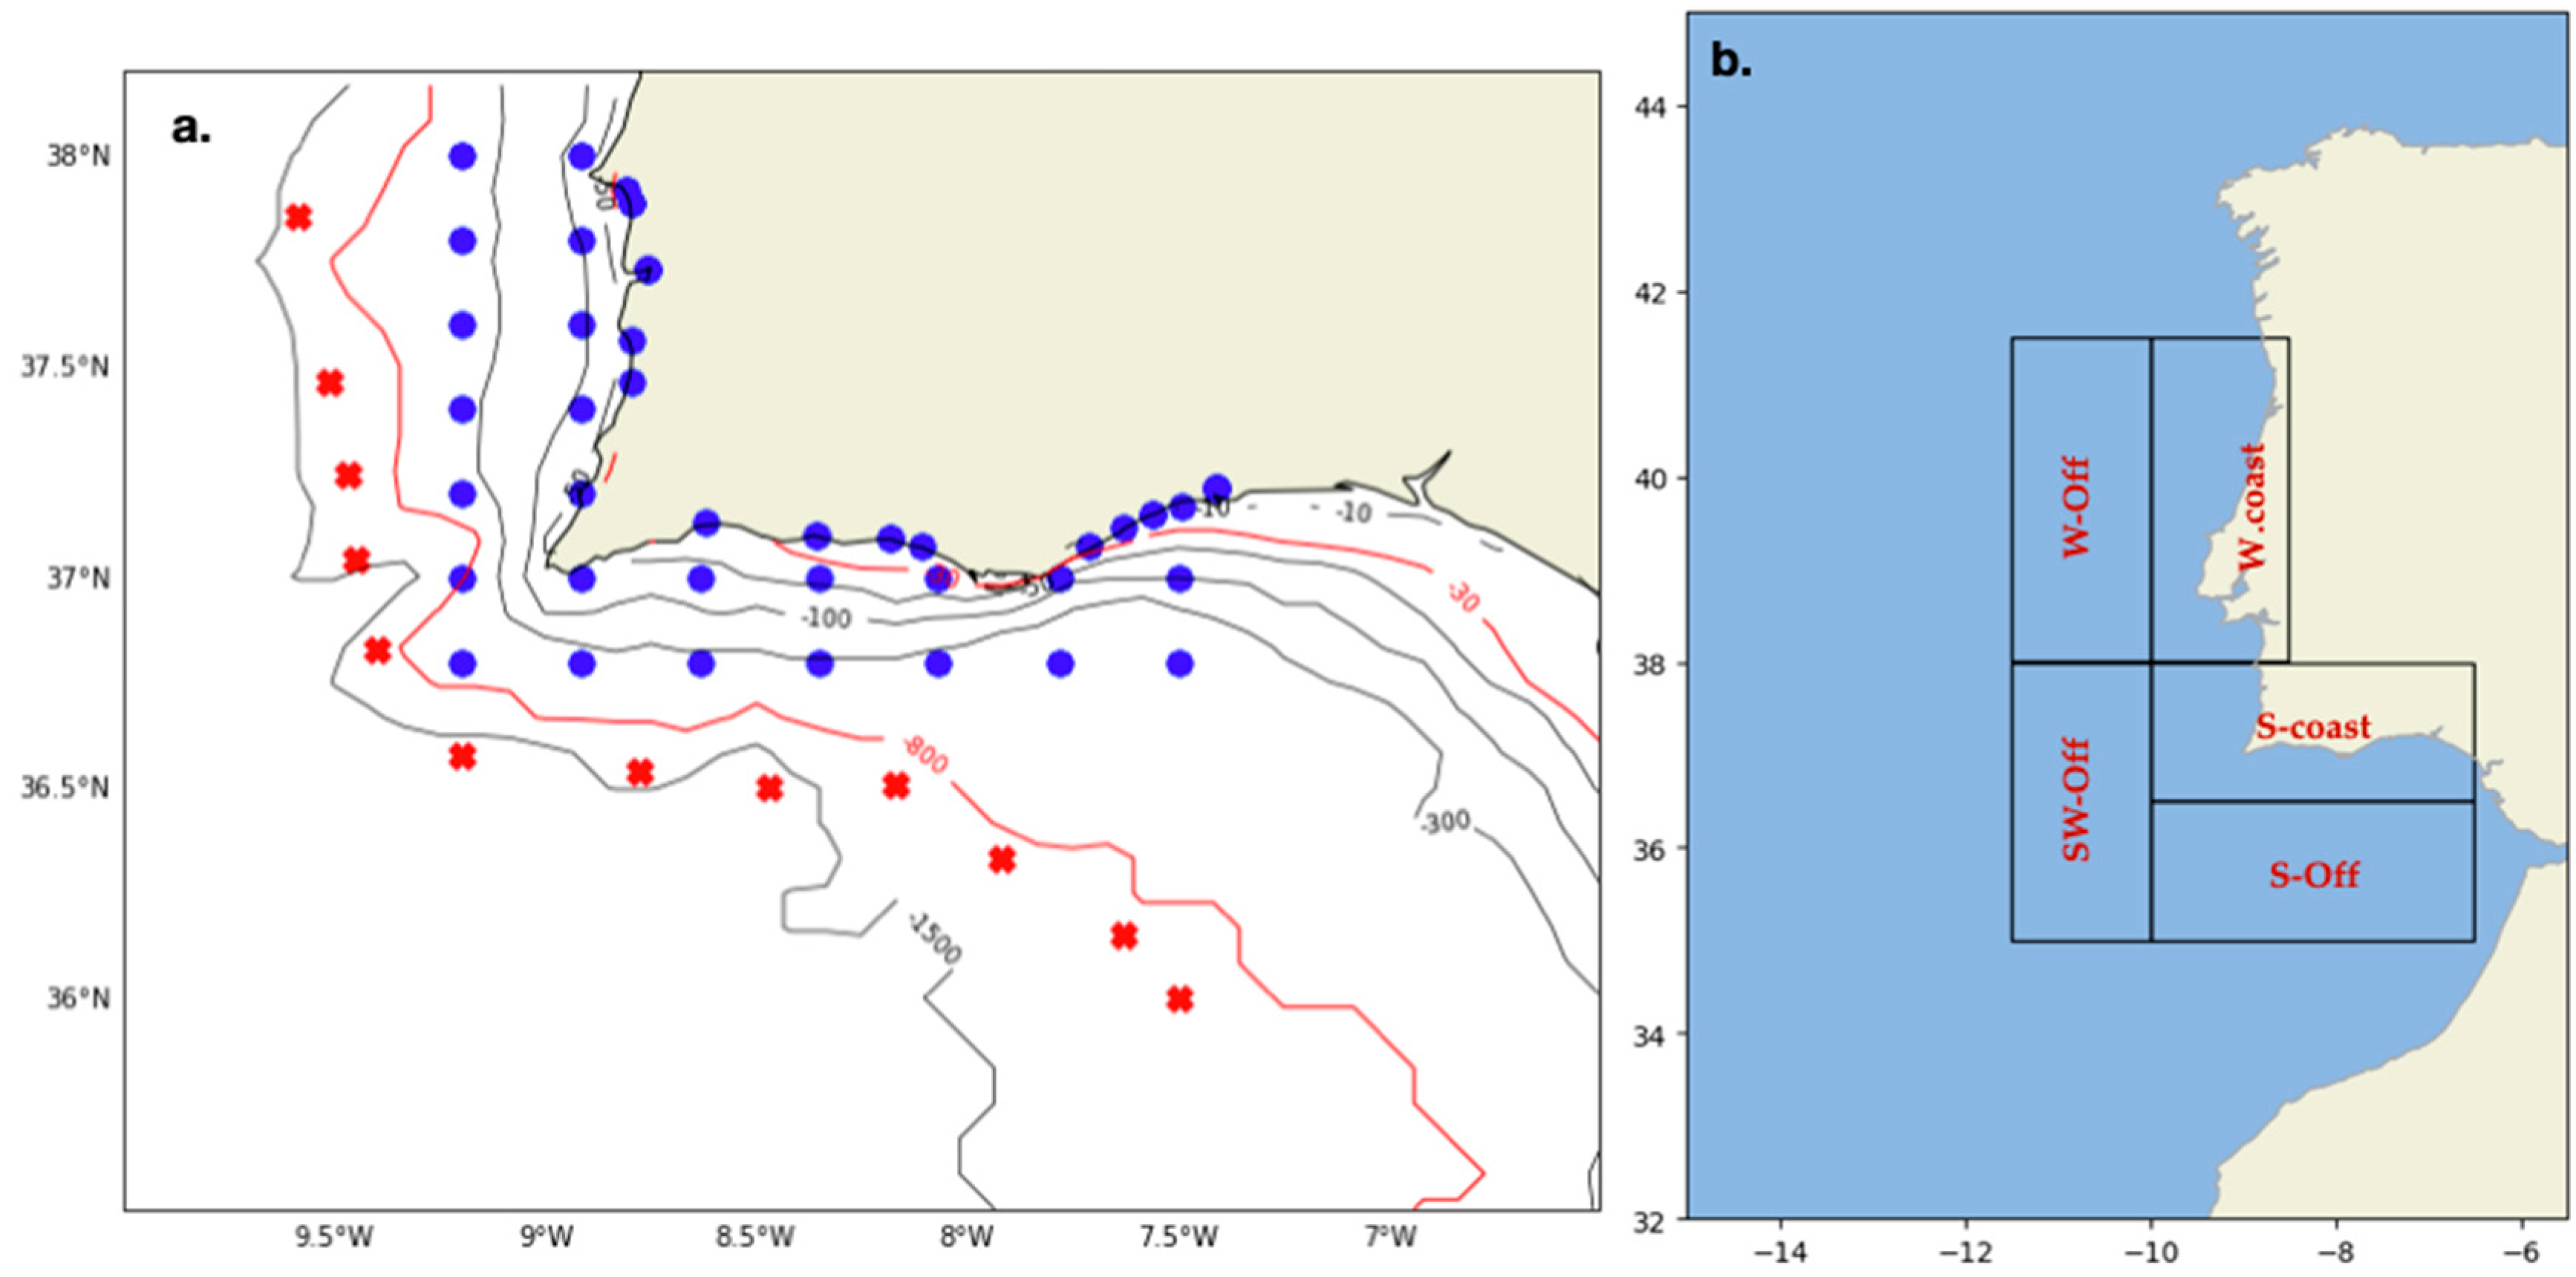
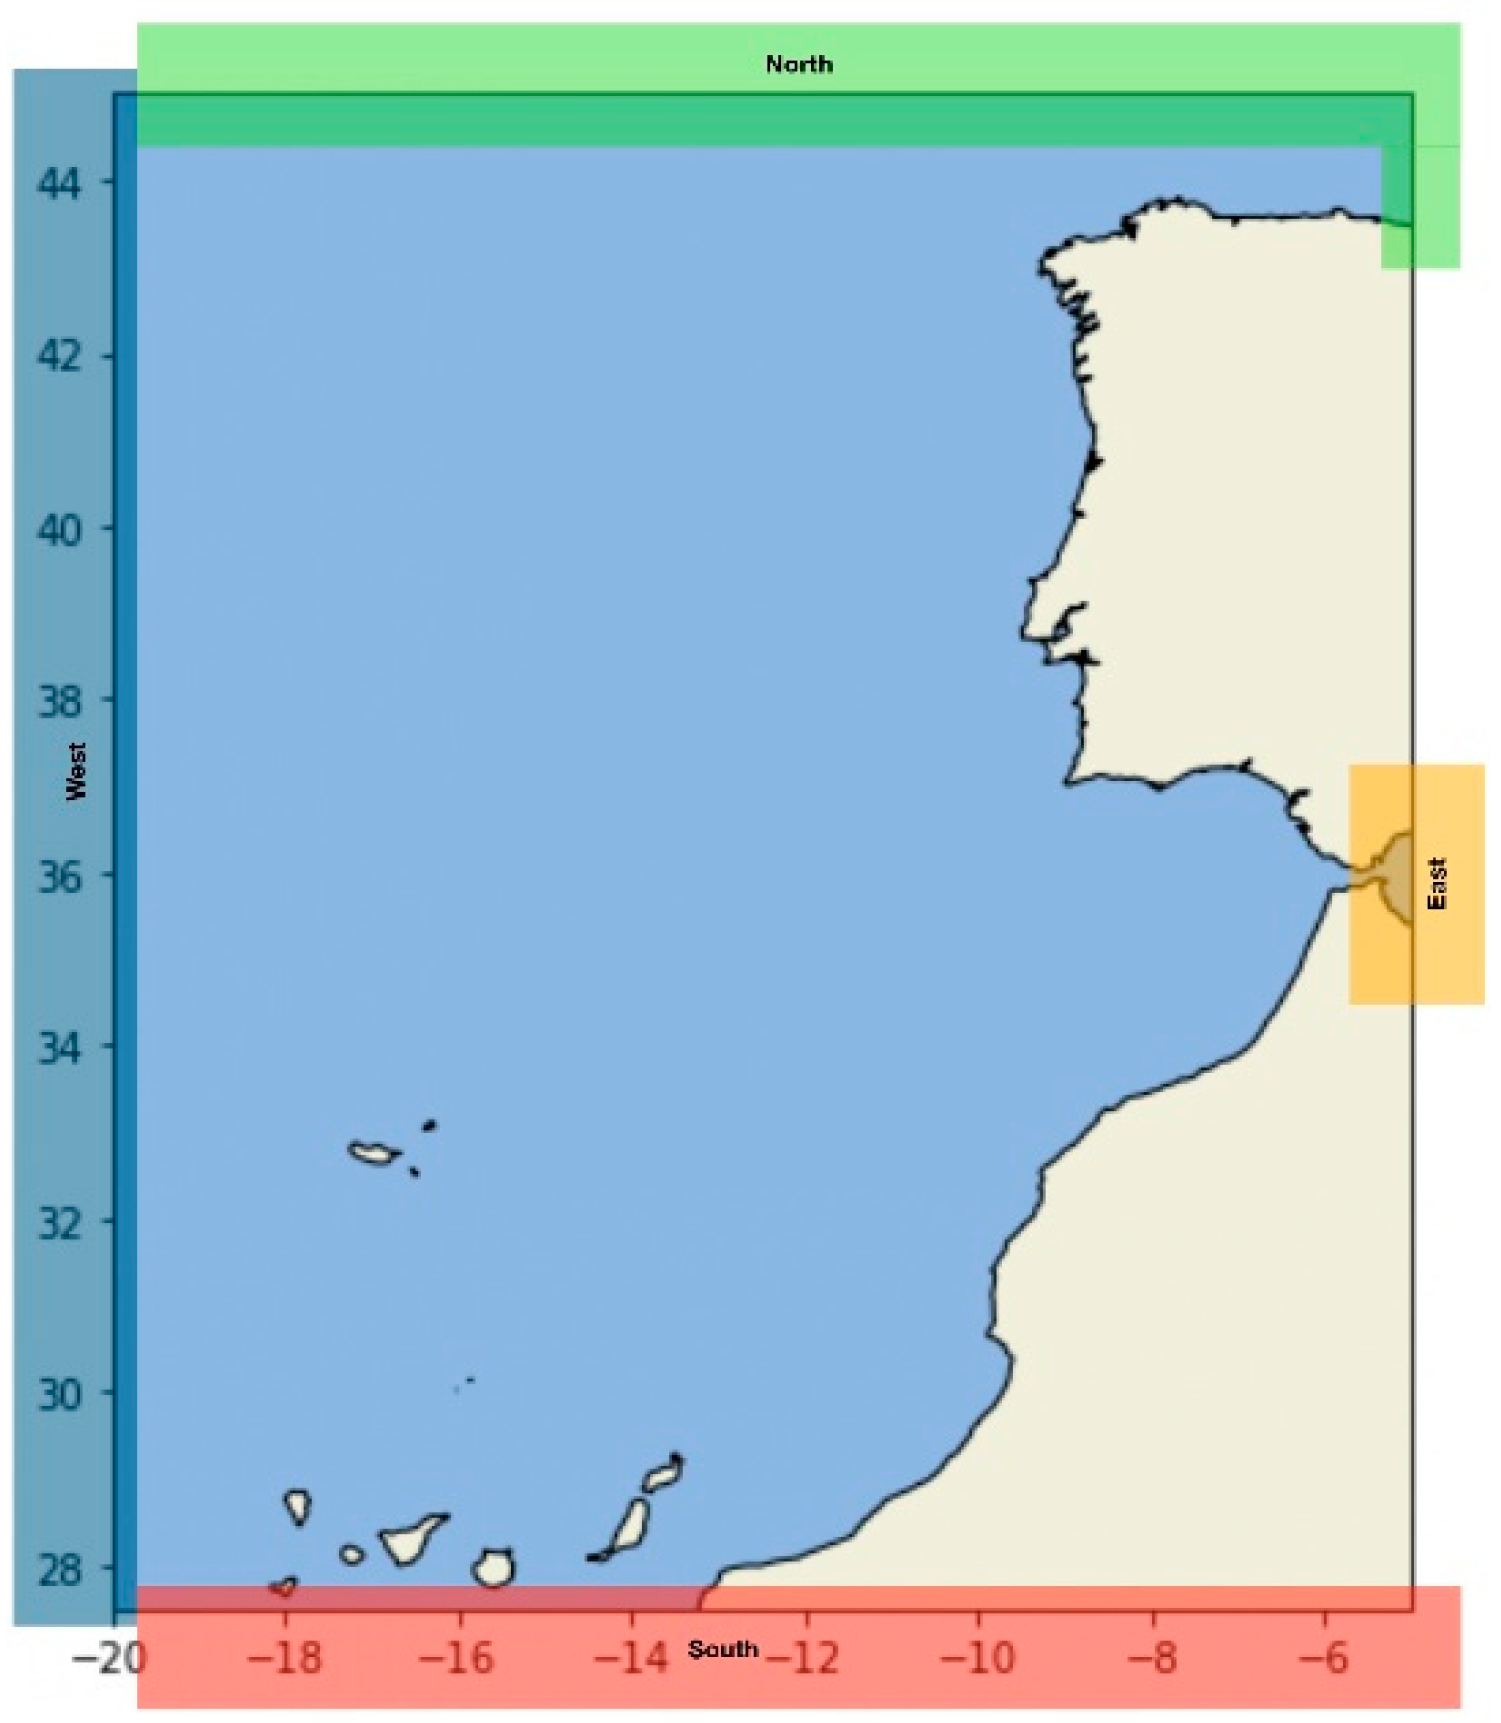
2.1. Study Area
2.2. Marine Microplastic Model
2.2.1. Lagrangian Model and Forcing
2.2.2. Model Settings
3. Result
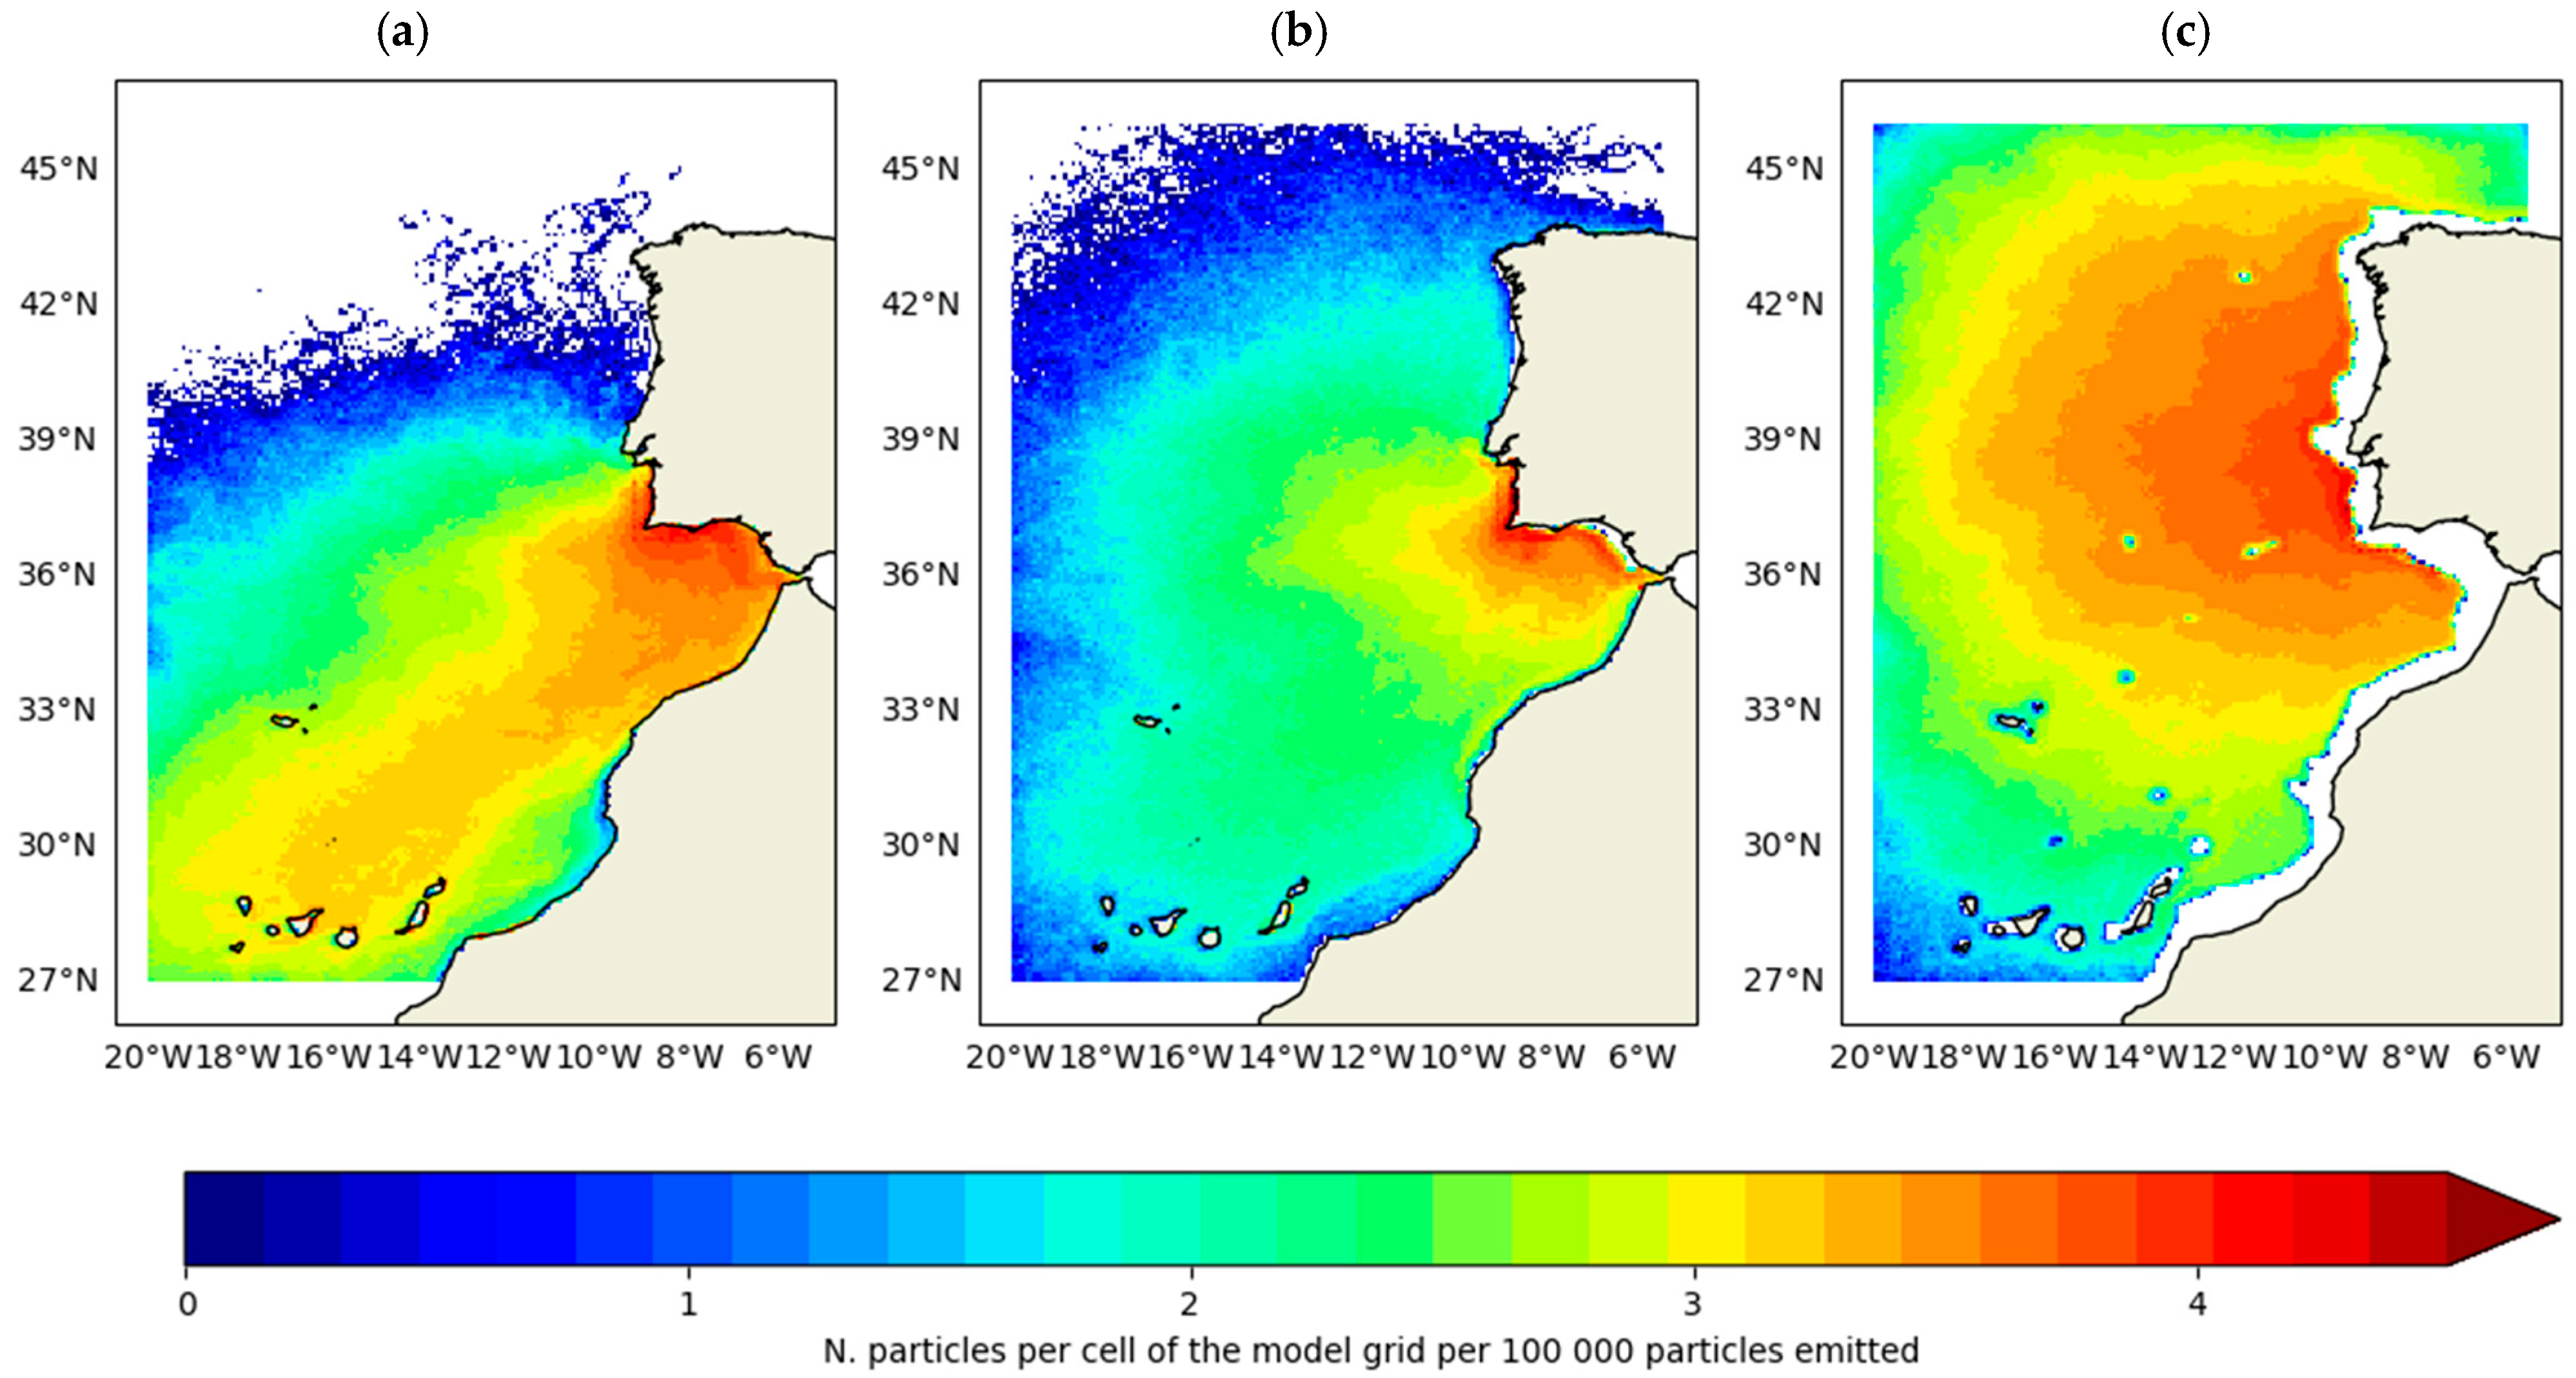
3.1. Pathways and Travel Times of Microplastics in the Water Column
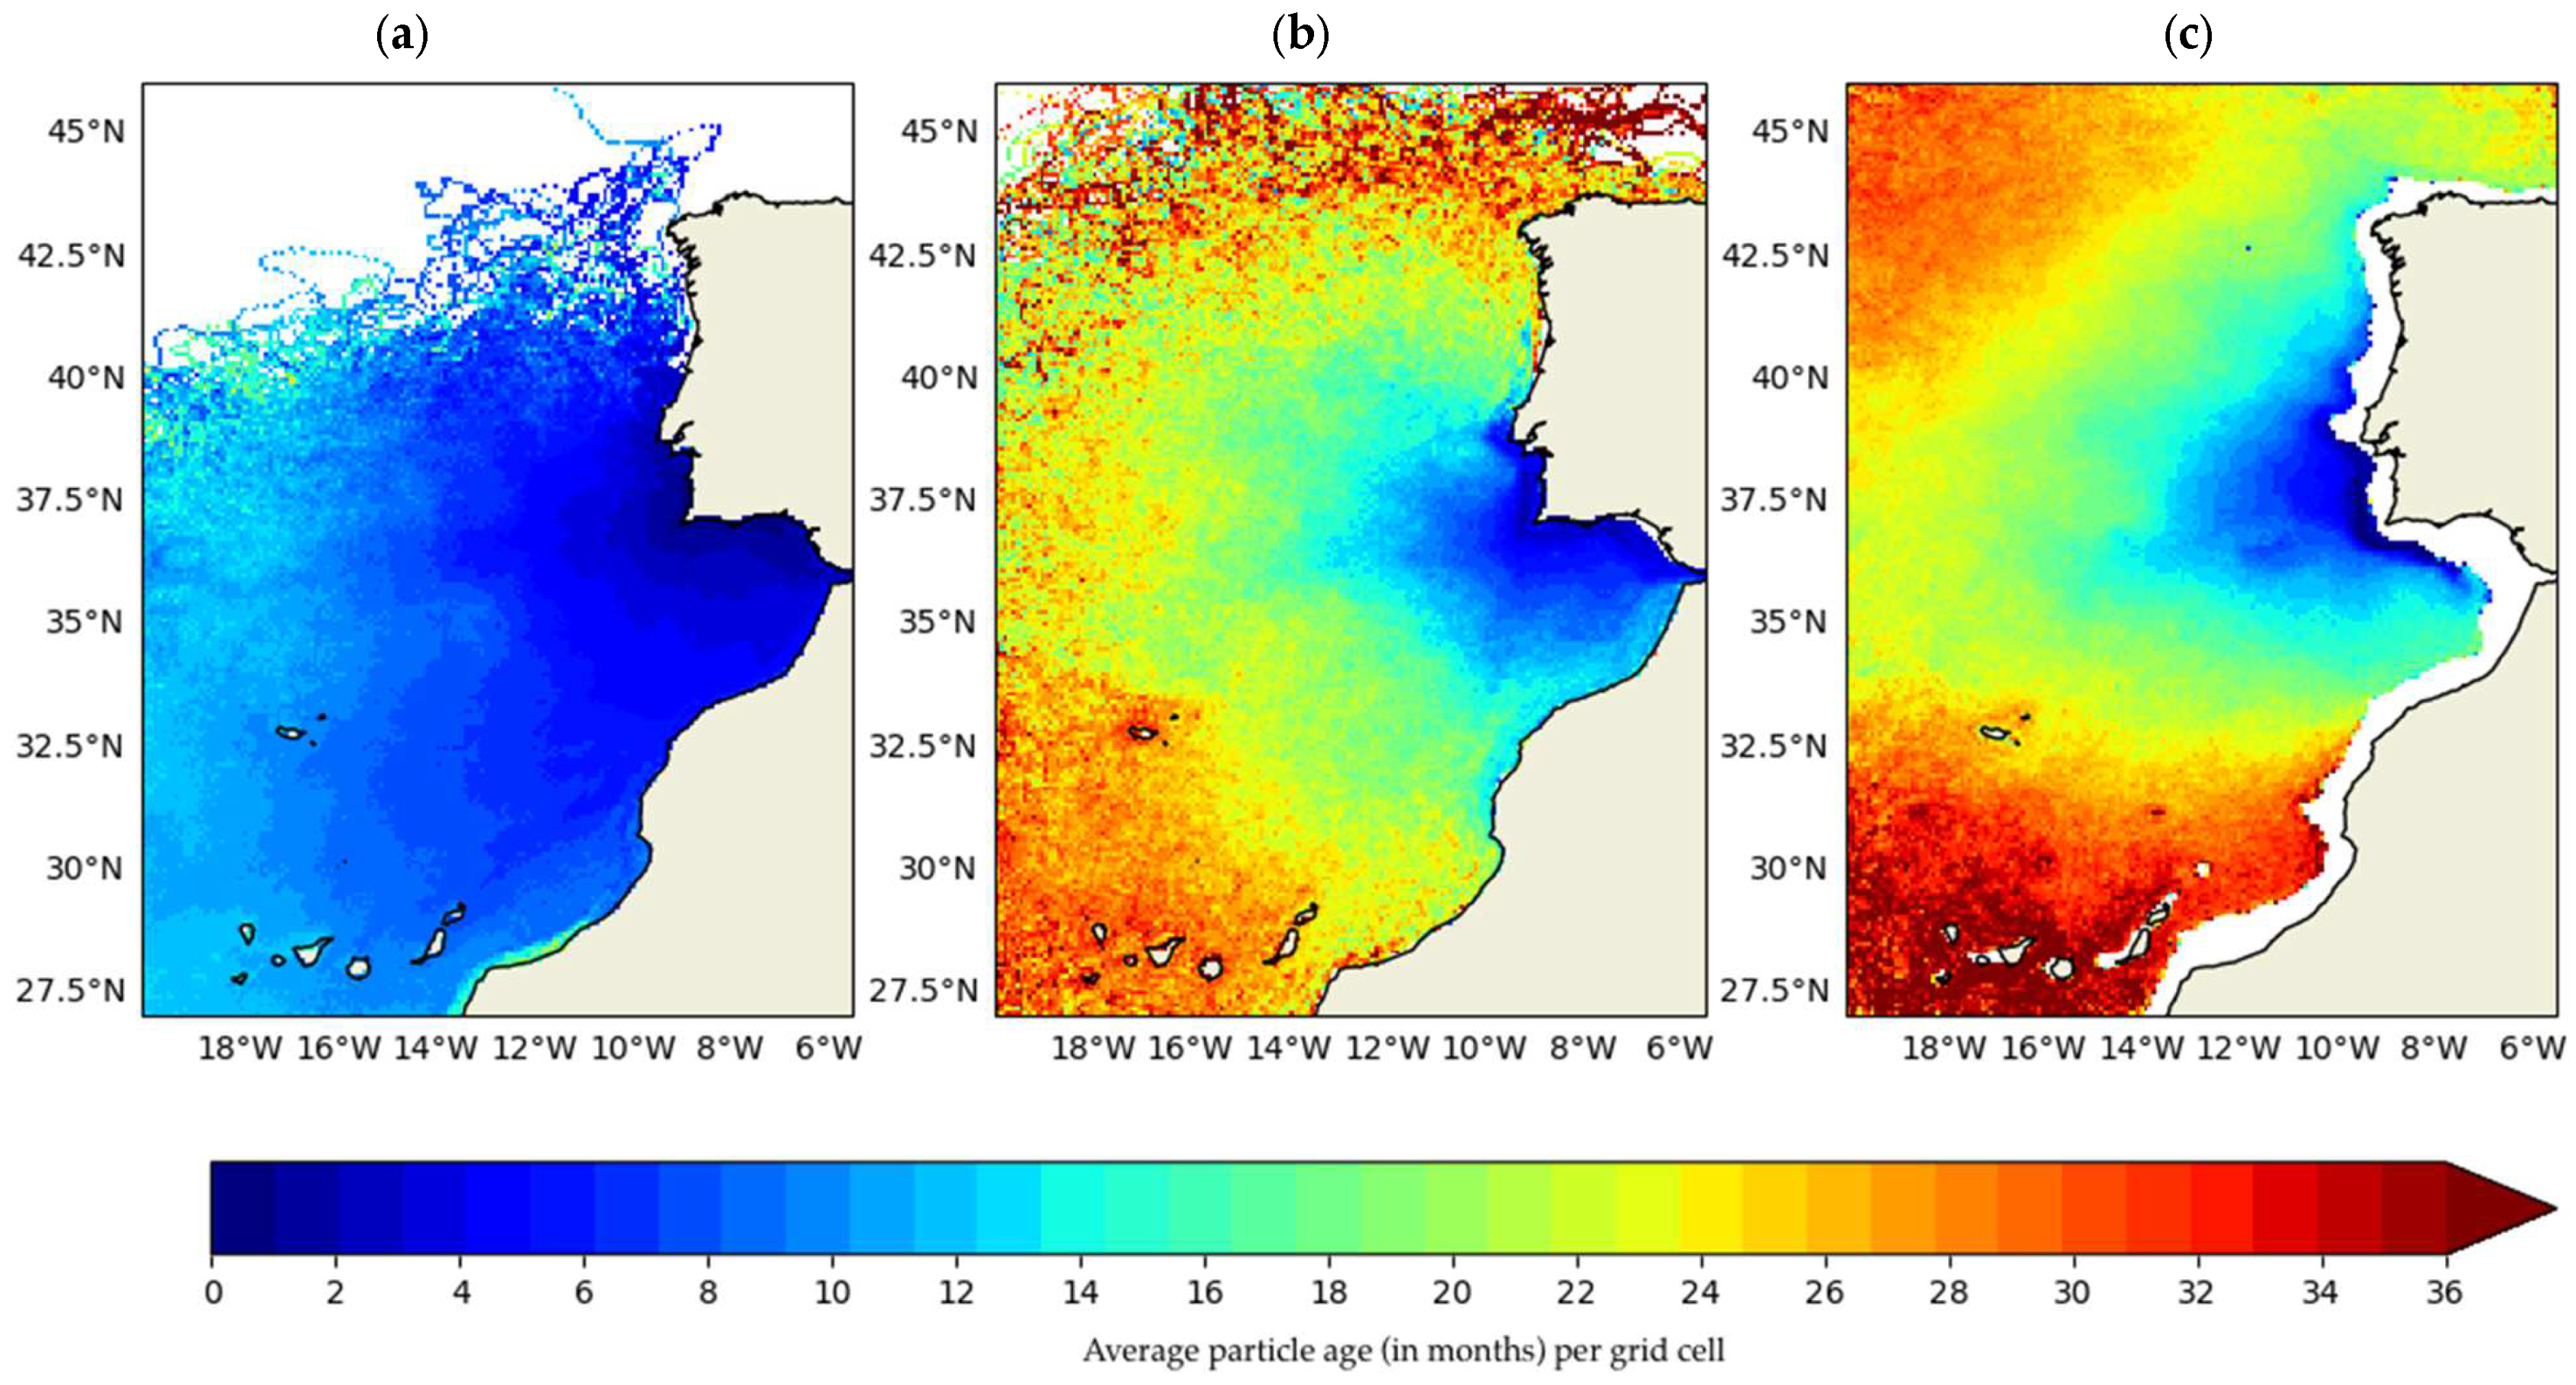
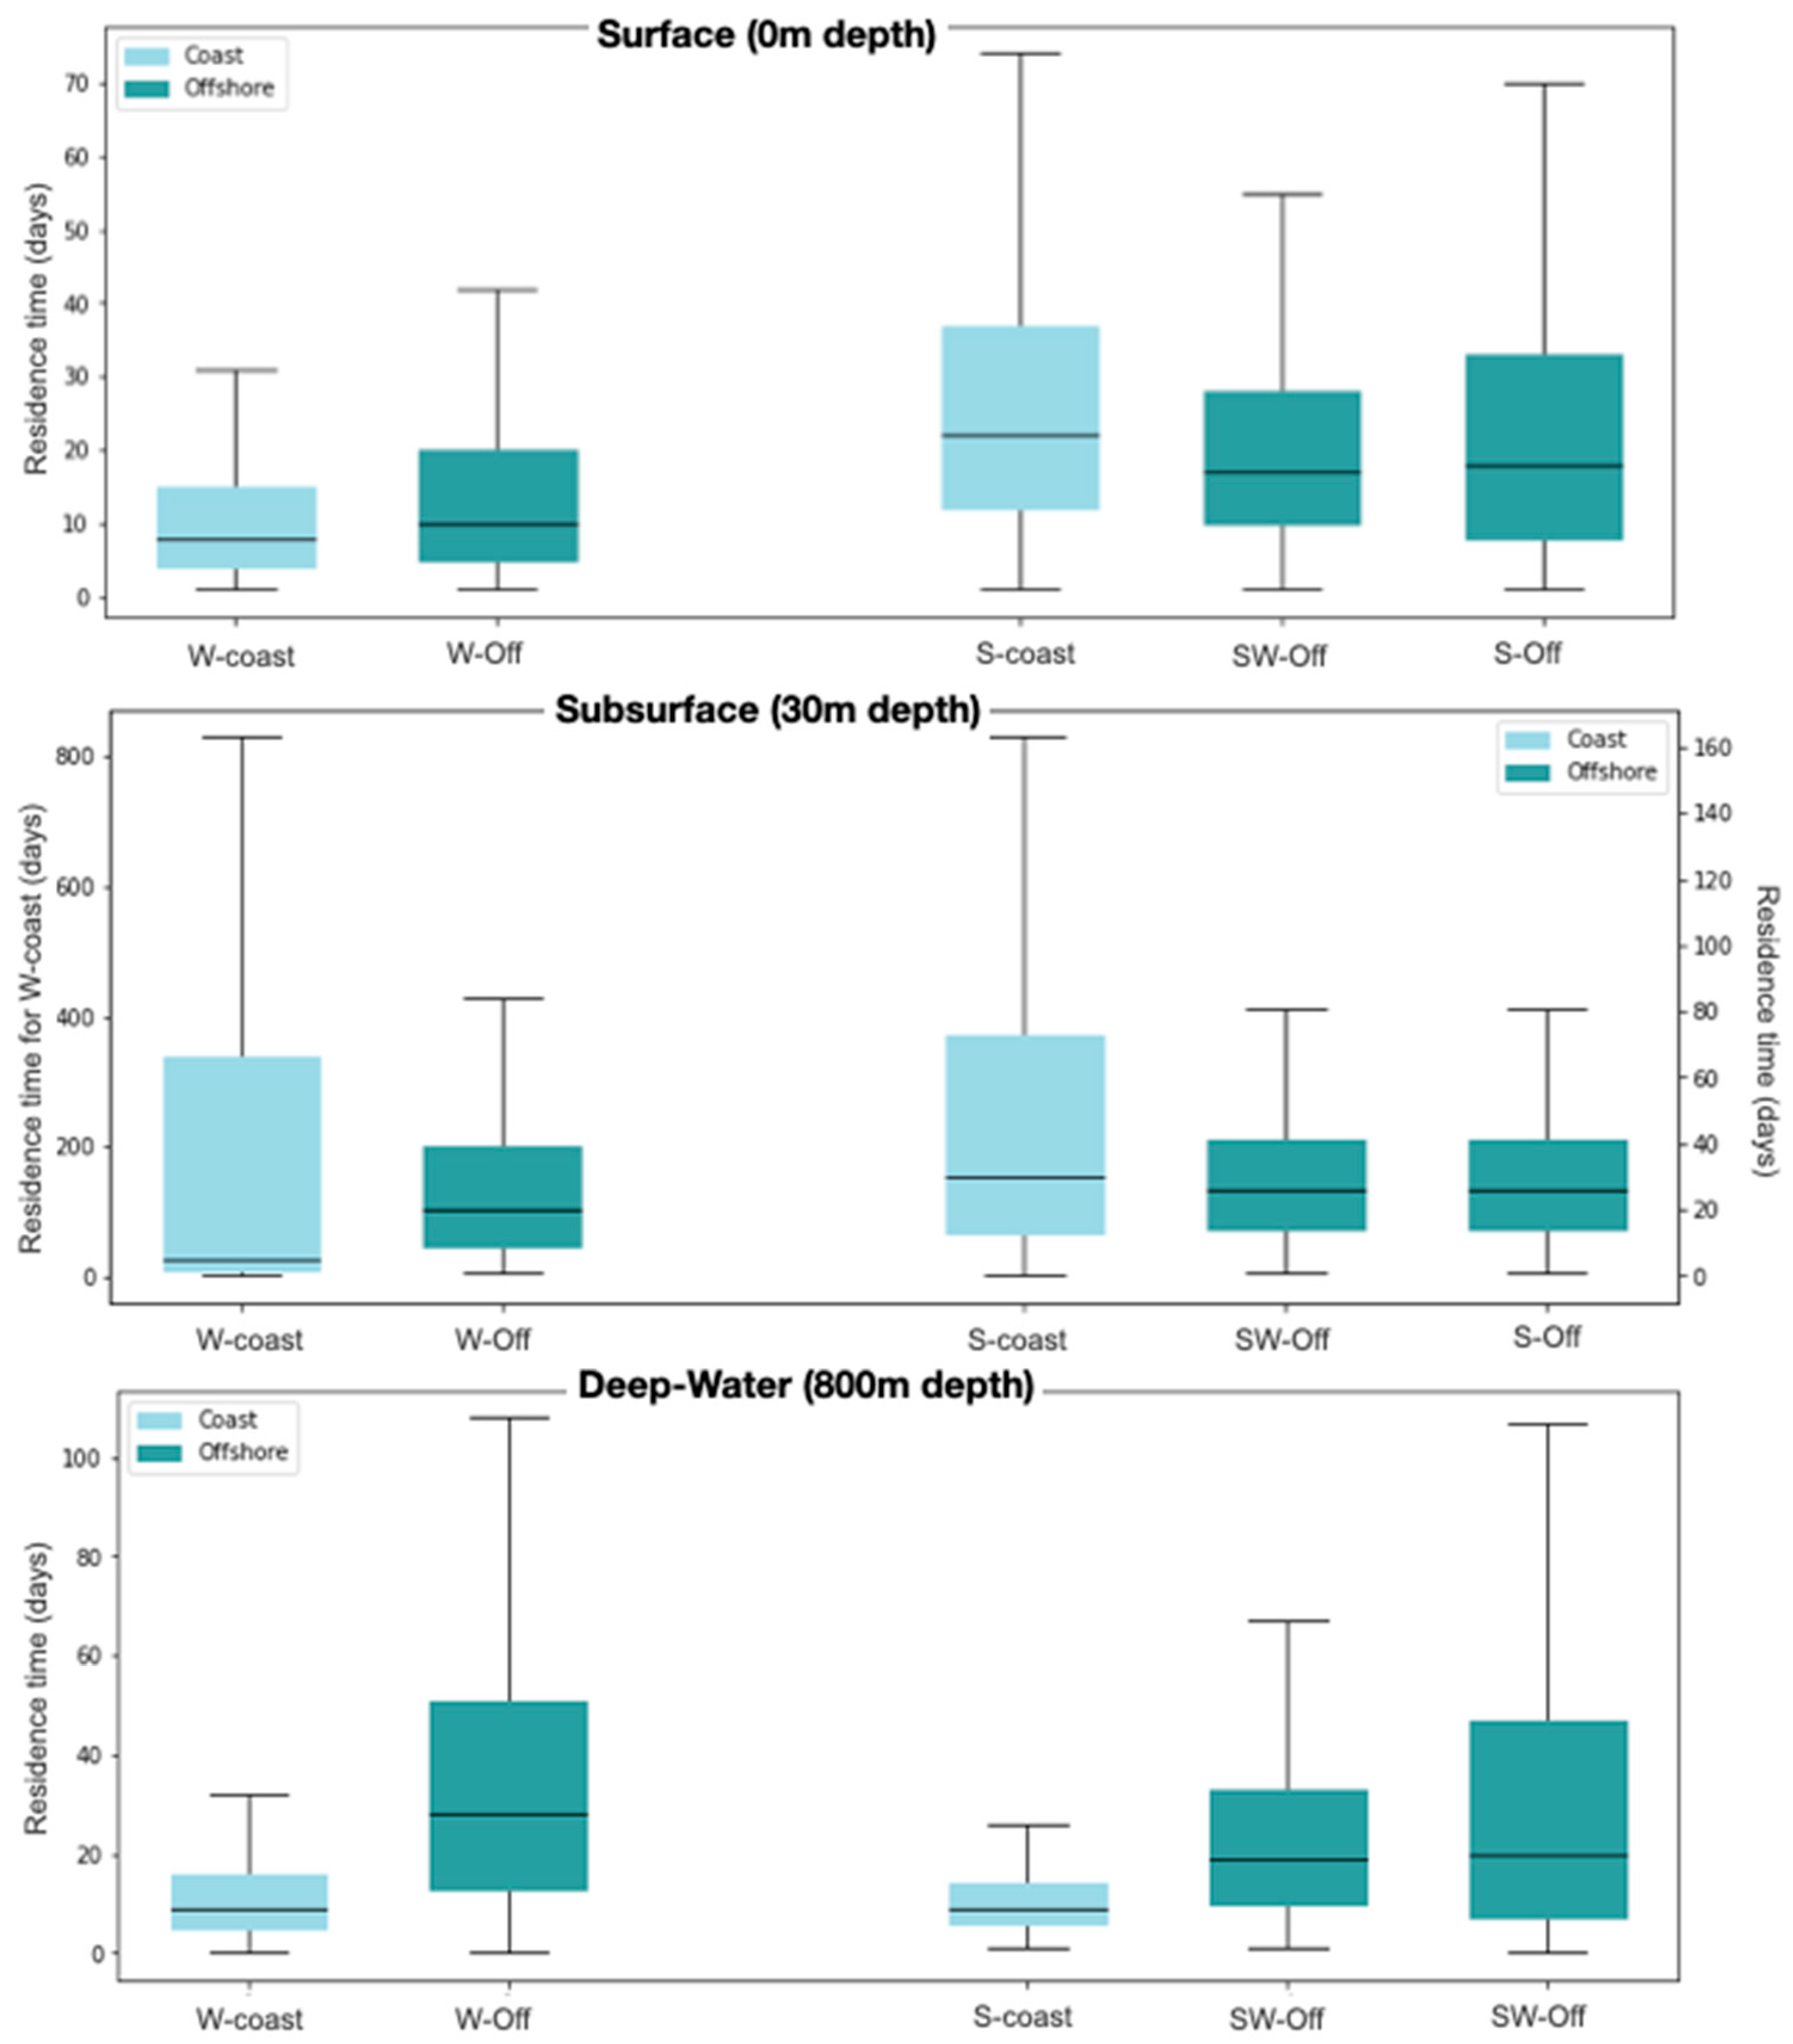
3.2. Residence Time of the Microplastic Particles
4. Discussion
5. Conclusions
Author Contributions
Funding
Acknowledgments
Conflicts of Interest
References
- Chatterjee, S.; Sharma, S. Microplastics in Our Oceans and Marine Health. Field Actions Sci. Rep. 2019, 54–61. Available online: https://journals.openedition.org/factsreports/5257 (accessed on 18 March 2022).
- Barnes, D.K.A.; Galgani, F.; Thompson, R.C.; Barlaz, M. Accumulation and fragmentation of plastic debris in global environments. Philos. Trans. R. Soc. Lond. B Biol. Sci. 2009, 364, 1985–1998. [Google Scholar] [CrossRef] [PubMed]
- Eriksen, M.; Lebreton, L.C.; Carson, H.S.; Thiel, M.; Moore, C.J.; Borerro, J.C.; Reisser, J. Plastic pollution in the world’s oceans: More than 5 trillion plastic pieces weighing over 250,000 tons afloat at sea. PLoS ONE 2014, 9, e111913. [Google Scholar] [CrossRef] [PubMed]
- Lusher, A. Microplastics in the Marine Environment: Distribution, Interactions and Effects. In Marine Anthropogenic Litter; Springer: Cham, Switzerland, 2015; pp. 245–307. [Google Scholar] [CrossRef]
- van Sebille, E.; Wilcox, C.; Lebreton, L.; Maximenko, N.; Hardesty, B.D.; van Franeker, J.A.; Eriksen, M.; Siegel, D.; Galgani, F.; Law, K.L. A global inventory of small floating plastic debris. Environ. Res. Lett. 2015, 10, 124006. [Google Scholar] [CrossRef]
- Kane, I.A.; Clare, M.A.; Miramontes, E.; Wogelius, R.; Rothwell, J.J.; Garreau, P.; Pohl, F. Seafloor microplastic hotspots controlled by deep-sea circulation. Science 2020, 368, 1140–1145. [Google Scholar] [CrossRef] [PubMed]
- Khatmullina, L.; Chubarenko, I. Transport of marine microplastic particles: Why is it so difficult to predict? Anthr. Coasts 2019, 2, 293–305. [Google Scholar] [CrossRef]
- Koehler, A.; Anderson, A.; Andrady, A.; Arthur, C.; Baker, J.; Bouwman, H.; Gall, S.; Hidalgo-Ruz, V.; Law, K.L.; Leslie, H.; et al. Sources, fate and effects of microplastics in the marine environment: A global assessment. In Reports and Studies-IMO/FAO/Unesco-IOC/WMO/IAEA/UN/UNEP Joint Group of Experts on the Scientific Aspects of Marine Environmental Protection (GESAMP); International Maritime Organization (IMO): London, UK, 2015; Volume 90, p. 96. [Google Scholar] [CrossRef]
- Tsiaras, K.; Hatzonikolakis, Y.; Kalaroni, S.; Pollani, A.; Triantafyllou, G. Modeling the Pathways and Accumulation Patterns of Micro- and Macro-Plastics in the Mediterranean. Front. Mar. Sci. 2021, 8, 1389. [Google Scholar] [CrossRef]
- Mountford, A.S.; Maqueda, M.A.M. Modeling the Accumulation and Transport of Microplastics by Sea Ice. J. Geophys. Res. Ocean. 2021, 126, e2020JC016826. [Google Scholar] [CrossRef]
- Cardoso, C.; Caldeira, R.M.A. Modeling the Exposure of the Macaronesia Islands (NE Atlantic) to Marine Plastic Pollution. Front. Mar. Sci. 2021, 8, 653502. [Google Scholar] [CrossRef]
- Zhang, Z.; Wu, H.; Peng, G.; Xu, P.; Li, D. Coastal Ocean dynamics reduce the export of microplastics to the open ocean. Sci. Total Environ. 2020, 713, 136634. [Google Scholar] [CrossRef] [PubMed]
- Jalón-Rojas, I.; Wang, X.H.; Fredj, E. A 3D numerical model to Track Marine Plastic Debris (TrackMPD): Sensitivity of microplastic trajectories and fates to particle dynamical properties and physical processes. Mar. Pollut. Bull. 2019, 141, 256–272. [Google Scholar] [CrossRef] [PubMed]
- Raimundo, G.I.; Sousa, M.C.; Dias, J.M. Numerical Modelling of Plastic Debris Transport and Accumulation throughout Portuguese Coast. J. Coast. Res. 2020, 95, 1252–1257. [Google Scholar] [CrossRef]
- Collins, C.; Hermes, J. Modelling the accumulation and transport of floating marine micro-plastics around South Africa. Mar. Pollut. Bull. 2018, 139, 46–58. [Google Scholar] [CrossRef]
- Prata, J.C.; da Costa, J.P.; Lopes, I.; Duarte, A.C.; Rocha-Santos, T. Environmental status of (micro) plastics contamination in Portugal. Ecotoxicol. Environ. Saf. 2020, 200, 110753. [Google Scholar] [CrossRef]
- Pereiro, D.; Souto, C.; Gago, J. Dynamics of floating marine debris in the northern Iberian waters: A model approach. J. Sea Res. 2018, 144, 57–66. [Google Scholar] [CrossRef]
- Rosas, E.; Martins, F.; Janeiro, J. Marine Litter on the Coast of the Algarve: Main Sources and Distribution Using a Modeling Approach. J. Mar. Sci. Eng. 2021, 9, 412. [Google Scholar] [CrossRef]
- INE. Algarve in Figures—2018. 2020. Available online: https://www.ine.pt/ine_novidades/RN2018/algarve/index.html (accessed on 25 March 2022).
- Antunes, J.; Frias, J.; Sobral, P. Microplastics on the Portuguese coast. Mar. Pollut. Bull. 2018, 131, 294–302. [Google Scholar] [CrossRef]
- Frias, J.; Gago, J.; Otero, V.; Sobral, P. Microplastics in coastal sediments from Southern Portuguese shelf waters. Mar. Environ. Res. 2016, 114, 24–30. [Google Scholar] [CrossRef]
- Lechthaler, S.; Schwarzbauer, J.; Reicherter, K.; Stauch, G.; Schüttrumpf, H. Regional study of microplastics in surface waters and deep sea sediments south of the Algarve Coast. Reg. Stud. Mar. Sci. 2020, 40, 101488. [Google Scholar] [CrossRef]
- Barton, E.D.; Steele, J.; Turekian, K.; Thorpe, S. Canary and Portugal currents. Ocean. Curr. 2001, 330–339. [Google Scholar] [CrossRef]
- Fedoseev, A. Geostrophic circulation of surface waters on the shelf of north-west Africa. Rapp. PV Reun. Cons. Int. Explor. Mer. 1970, 159, 32–37. [Google Scholar]
- Peliz, Á.; Dubert, J.; Santos, A.M.P.; Oliveira, P.B.; Le Cann, B. Winter upper ocean circulation in the Western Iberian Basin—Fronts, Eddies and Poleward Flows: An overview. Deep. Sea Res. Part I Oceanogr. Res. Pap. 2005, 52, 621–646. [Google Scholar] [CrossRef]
- Batteen, M.L.; Martinez, J.R.; Bryan, D.W.; Buch, E.J. A modeling study of the coastal eastern boundary current system off Iberia and Morocco. J. Geophys. Res. Earth Surf. 2000, 105, 14173–14195. [Google Scholar] [CrossRef]
- Cropper, T.E.; Hanna, E.; Bigg, G.R. Spatial and temporal seasonal trends in coastal upwelling off Northwest Africa, 1981–2012. Deep Sea Res. Part I Oceanogr. Res. Pap. 2014, 86, 94–111. [Google Scholar] [CrossRef]
- Relvas, P.; Barton, E.; Dubert, J.; Oliveira, P.B.; Peliz, A.; da Silva, J.; Santos, A.M.P. Physical oceanography of the western Iberia ecosystem: Latest views and challenges. Prog. Oceanogr. 2007, 74, 149–173. [Google Scholar] [CrossRef]
- de Pascual-Collar, Á.; Sotillo, M.G.; Levier, B.; Aznar, R.; Lorente, P.; Amo-Baladrón, A.; Álvarez-Fanjul, E. Regional circulation patterns of Mediterranean Outflow Water near the Iberian and African continental slopes. Ocean. Sci. 2019, 15, 565–582. [Google Scholar] [CrossRef]
- Bashmachnikov, I.; Neves, F.; Calheiros, T.; Carton, X. Properties and pathways of Mediterranean water eddies in the Atlantic. Prog. Oceanogr. 2015, 137, 149–172. [Google Scholar] [CrossRef]
- Dagestad, K.-F.; Röhrs, J.; Breivik, Ø.; Ådlandsvik, B. OpenDrift v1. 0: A generic framework for trajectory modelling. Geosci. Model Dev. 2018, 11, 1405–1420. [Google Scholar] [CrossRef]
- Fernandez, E.; Lellouche, J.M. Product User Manual for the Global Ocean Physical Reanalysis product GLOBAL_REANALYSIS_PHY_001_030. EU Copernicus Marine Service 2018. Available online: https://resources.marine.copernicus.eu/product-detail/GLOBAL_MULTIYEAR_PHY_001_030/INFORMATION (accessed on 5 January 2020).
- Song, Y.K.; Hong, S.H.; Eo, S.; Jang, M.; Han, G.M.; Isobe, A.; Shim, W.J. Horizontal and Vertical Distribution of Microplastics in Korean Coastal Waters. Environ. Sci. Technol. 2018, 52, 12188–12197. [Google Scholar] [CrossRef]
- Van Melkebeke, M.; Janssen, C.; De Meester, S. Characteristics and Sinking Behavior of Typical Microplastics Including the Potential Effect of Biofouling: Implications for Remediation. Environ. Sci. Technol. 2020, 54, 8668–8680. [Google Scholar] [CrossRef] [PubMed]
- Khatmullina, L.; Isachenko, I. Settling velocity of microplastic particles of regular shapes. Mar. Pollut. Bull. 2017, 114, 871–880. [Google Scholar] [CrossRef] [PubMed]
- Fiúza, A.F. Upwelling patterns off Portugal. In Coastal Upwelling its Sediment Record; Springer: Boston, MA, USA, 1983; pp. 85–98. [Google Scholar]
- Tanhua, T.; Gutekunst, S.B.; Biastoch, A. A near-synoptic survey of ocean microplastic concentration along an around-the-world sailing race. PLoS ONE 2020, 15, e0243203. [Google Scholar] [CrossRef] [PubMed]
- Zhang, H. Transport of microplastics in coastal seas. Estuar. Coast. Shelf Sci. 2017, 199, 74–86. [Google Scholar] [CrossRef]
- Kaiser, D.; Kowalski, N.; Waniek, J.J. Effects of biofouling on the sinking behavior of microplastics. Environ. Res. Lett. 2017, 12, 124003. [Google Scholar] [CrossRef]
- Soto-Navarro, J.; Jordá, G.; Compa, M.; Alomar, C.; Fossi, M.; Deudero, S. Impact of the marine litter pollution on the Mediterranean biodiversity: A risk assessment study with focus on the marine protected areas. Mar. Pollut. Bull. 2021, 165, 112169. [Google Scholar] [CrossRef]


| Release Depth (m) | 0 | 30 | 800 |
|---|---|---|---|
| Time step | daily | daily | daily |
| Horizontal diffusion coefficient Kh (m2/s) | 1 | 1 | 1 |
| Source location | 49 points of emission | 49 points of emission | 12 points of emission |
| Number of particles | 49 | 49 | 48 |
| Release Depth (m) | 0 | 30 | 800 |
|---|---|---|---|
| North | 0% | 0% | 18% |
| South | 20% | 1% | 0% |
| West | 29% | 1% | 22% |
| East | 48% | 28% | 0% |
Publisher’s Note: MDPI stays neutral with regard to jurisdictional claims in published maps and institutional affiliations. |
© 2022 by the authors. Licensee MDPI, Basel, Switzerland. This article is an open access article distributed under the terms and conditions of the Creative Commons Attribution (CC BY) license (https://creativecommons.org/licenses/by/4.0/).
Share and Cite
Rosas, E.; Martins, F.; Tosic, M.; Janeiro, J.; Mendonça, F.; Mills, L. Pathways and Hot Spots of Floating and Submerged Microplastics in Atlantic Iberian Marine Waters: A Modelling Approach. J. Mar. Sci. Eng. 2022, 10, 1640. https://doi.org/10.3390/jmse10111640
Rosas E, Martins F, Tosic M, Janeiro J, Mendonça F, Mills L. Pathways and Hot Spots of Floating and Submerged Microplastics in Atlantic Iberian Marine Waters: A Modelling Approach. Journal of Marine Science and Engineering. 2022; 10(11):1640. https://doi.org/10.3390/jmse10111640
Chicago/Turabian StyleRosas, Eloah, Flávio Martins, Marko Tosic, João Janeiro, Fernando Mendonça, and Lara Mills. 2022. "Pathways and Hot Spots of Floating and Submerged Microplastics in Atlantic Iberian Marine Waters: A Modelling Approach" Journal of Marine Science and Engineering 10, no. 11: 1640. https://doi.org/10.3390/jmse10111640
APA StyleRosas, E., Martins, F., Tosic, M., Janeiro, J., Mendonça, F., & Mills, L. (2022). Pathways and Hot Spots of Floating and Submerged Microplastics in Atlantic Iberian Marine Waters: A Modelling Approach. Journal of Marine Science and Engineering, 10(11), 1640. https://doi.org/10.3390/jmse10111640