Article

The Development of a Lightweight DE-YOLO Model for Detecting Impurities and Broken Rice Grains

School of Agricultural Engineering, Jiangsu University, Zhenjiang 212013, China
*
Author to whom correspondence should be addressed.
Agriculture 2025, 15(8), 848; https://doi.org/10.3390/agriculture15080848
Submission received: 14 March 2025 / Revised: 3 April 2025 / Accepted: 10 April 2025 / Published: 14 April 2025

Abstract

:
A rice impurity detection algorithm model, DE-YOLO, based on YOLOX-s improvement is proposed to address the issues of small crop target recognition and the similarity of impurities in rice impurity detection. This model achieves correct recognition, classification, and detection of rice target crops with similar colors in complex environments. Firstly, changing the CBS module to the DBS module in the entire network model and replacing the standard convolution with Depthwise Separable Convolution (DSConv) can effectively reduce the number of parameters and the computational complexity, making the model lightweight. The ECANet module is introduced into the backbone feature extraction network, utilizing the weighted selection feature to cluster the network in the region of interest, enhancing attention to rice impurities and broken grains, and compensating for the reduced accuracy caused by model light weighting. The loss problem of class imbalance is optimized using the Focal Loss function. The experimental results demonstrate that the DE-YOLO model has an average accuracy (mAP) of 97.55% for detecting rice impurity crushing targets, which is 2.9% higher than the average accuracy of the original YOLOX algorithm. The recall rate (R) is 94.46%, the F1 value is 0.96, the parameter count is reduced by 48.89%, and the GFLOPS is reduced by 46.33%. This lightweight model can effectively detect rice impurity/broken targets and provide technical support for monitoring the rice impurity/ broken rate.

1. Introduction

Rice is one of the most important food crops in China, and the combine harvester plays a crucial role in rice production [1]. By 2023, the mechanization rate of rice harvesting in China exceeded 85%, and combine harvesters have been playing an important role in rice harvesting [2,3,4,5,6]. In recent years, many scholars and companies have conducted research on unmanned combine harvesters in China. However, the developed unmanned combine harvesters primarily focus on the correction of path deviations during movement, achieving basic functions such as operation path planning and headland turning, while machine vision systems primarily emphasize visual guidance in path optimization. However, there is no operation performance monitoring device for factors such as the impurity/broken rate, and the operation performance of the machine cannot be guaranteed [7]. For intelligent combine harvesters, the use of vision and sensor technologies to automatically detect grain impurity and breakage conditions and then adjust the industrial parameters of the intelligent combine harvester is essential to improving operational efficiency and accuracy. Rice is grown over a vast area in China, with many varieties available, and during harvesting, the impurity and breakage rates fluctuate significantly due to various factors, such as the design of the threshing [8] and cleaning unit [9]. The current methods for measuring the impurity and breakage content of rice in China mainly involve stopping the combine harvester; manually separating grains or using sieving to separate whole grains, broken grains, and impurities; and then calculating the impurity and breakage rates [10]. These methods cannot reflect the real-time state of the grains during the combine harvester’s operation. If the impurity rate of the grains is too high, it will affect the flowability of the rice during unloading, thereby affecting the unloading efficiency of the combine harvester. Broken grains lose their natural protective shell, making them more susceptible to water absorption, clumping, mold growth, and the oxidation of fatty acids [11], which makes them difficult to store and severely impacts the germination rate of seeds [12]. With the development of sensors and automation technology, it has become possible to obtain the impurity and breakage rates of grains during rice harvesting by the combine harvester. Companies such as JOHN DEERE and Germany’s CLAAS have equipped their combine harvesters with high-performance impurity and breakage detection devices, significantly improving the operational performance of these machines. However, these detection devices are primarily designed for crops such as wheat, soybeans, and corn, whose physical properties differ from those of rice. Additionally, these devices often rely on multispectral technology, which has complex light source structures and is bulky and expensive [13].
In recent years, a small number of scholars have integrated machine vision and DL (deep learning) technologies with combine harvesters, promoting the rapid development of intelligent combine harvesters. Currently, most research on intelligent combine harvesters focuses on automatic navigation, where unmanned combine harvesters perform field operations by identifying crop and non-crop areas. In 2021, Chen J. et al. [14] proposed a method based on dynamic regions of interest (ROIs) to measure the distance to the harvesting boundary. This method combines image processing and computer vision technologies to dynamically adjust the operating area of the harvester through a real-time analysis of the field scene. In 2022, Luo et al. [15] proposed a boundary detection method based on stereo vision. Their research utilized stereo vision technology and depth information to accurately identify crops and boundaries in the field, providing precise automatic steering support for the combine harvester. In 2022, Sun et al. [16] developed a method that combines 3D point cloud data with a dynamic moving surface model to capture and accurately calculate the height distribution of rice in real time. This depth-based height estimation method provides more detailed operational information for unmanned harvesters, allowing them to better adapt to field changes and avoid issues where crops that are too tall or too short affect the work efficiency of the unmanned harvester. In 2024, Niu et al. [17] proposed a method using high-resolution RGB images and 3D crop surface models (CSMs) collected by drones, which allows researchers to obtain dynamic height change information of maize crops during the growth process, providing a basis for operation planning and decision-making for intelligent combine harvesters. In the field of machine vision for intelligent combine harvesters, some scholars have used machine vision technology to detect rice impurities and broken grains. However, due to the color similarity between the components of rice impurities and broken grains, parts of grains adjacent to short straw may be misidentified as straw, and broken grains may be misidentified as whole grains. In 2015, Mahirah J. et al. [18] proposed a method for detecting mixed foreign matter inside grains based on machine vision technology and a dual light source illumination scheme, providing a reference for the development of impurity and breakage monitoring devices for grains. In 2016, Suchart et al. [19] used the Otsu algorithm to convert white rice images into binary images and then applied morphological operations and the Canny algorithm to detect the boundaries of each grain and determine its length. They used the Euclidean method to process each grain, achieving an average accuracy of 99.33% in classifying 300 grains of Thai rice. In 2018, Chen et al. [20] proposed a machine vision-based method for rice image collection and classification, allowing for the recognition of impurities and broken grains, with the integrated evaluation indexes for the recognition of stem impurities, small branch impurities, and broken grains reaching 86.92%, 85.07%, and 84.74%, respectively. In 2021, Ma et al. [21] conducted research on a segmentation method for rice stem impurities based on an improved Mask R-CNN. In 2021, Chen et al. [22] used an improved U-net model, and Wu et al. [23] employed the improved Mask R-CNN (convolutional neural network) algorithm to predict and segment grain, straw, and broken grains in grain images. However, the images used for model training were collected in laboratory environments with interference-free backgrounds, and due to overfitting, the segmentation time of these models was around 3–5 s. Additionally, existing studies mostly focus on installing sampling devices at the grain discharge outlet, but the high ejection speed at the discharge outlet can cause grain accumulation in the sampling device, affecting the discharge speed of the grains [24,25]. In field experiments, if the sampling camera lens is directly installed inside a closed grain bin, the large amount of dust inside the bin may cause fine particles to adhere to the camera surface, thus affecting the captured images’ quality [26].
Considering that rice impurity fragmentation detection involves the target identification of small crops, there are similarities in impurities in rice, but the different feature fusion of the YOLO model and the feature extraction structure of the backbone network are more practical [27,28]. YOLO series models are widely applied in object detection tasks due to their fast speed and high accuracy. YOLOv1 transformed the object detection problem into a regression task, enabling real-time detection; however, its performance was limited in small target detection and complex backgrounds. YOLOv2 introduced anchor boxes and multi-scale prediction, improving detection accuracy. YOLOv3 enhanced performance through multi-scale feature fusion and the Darknet-53 backbone, though at the cost of increased model complexity. YOLOv4, incorporating CSPDarknet, Mosaic data augmentation, and CIoU loss, achieved a good balance between accuracy and speed. YOLOv5 further optimized a lightweight design and training efficiency [29,30,31]. YOLOv6, YOLOv7, and YOLOv8 further improved accuracy and real-time capabilities, making them suitable for more complex scenarios [32,33,34]. However, most of these models adopt an anchor-based design, which heavily depends on hyperparameters and has limitations in detecting complex small targets like impurity and breakage rates in rice. In contrast, YOLOX, with its anchor-free design, dynamic label assignment, and lightweight structure, simplifies model adjustments while significantly improving detection accuracy and robustness for small targets [35]. YOLOX’s multi-scale feature extraction and excellent scalability make it more precise in the identification of rice impurities, broken grains, and intact grains, meeting the requirements for real-time field detection. Therefore, we choose YOLOX as the base model and further optimize its feature extraction and loss function design to improve the accuracy and efficiency of rice impurity and breakage detection.
The main objective of this study is to develop a target recognition and detection model for rice with impurities, which can effectively identify and detect rice stalks and broken rice grains. The improved model was tested against a self-made rice dataset to evaluate the effectiveness and accuracy of the proposed model. The performance of the improved DE-YOLO model and other object detection algorithms is compared.

2. Materials and Methods

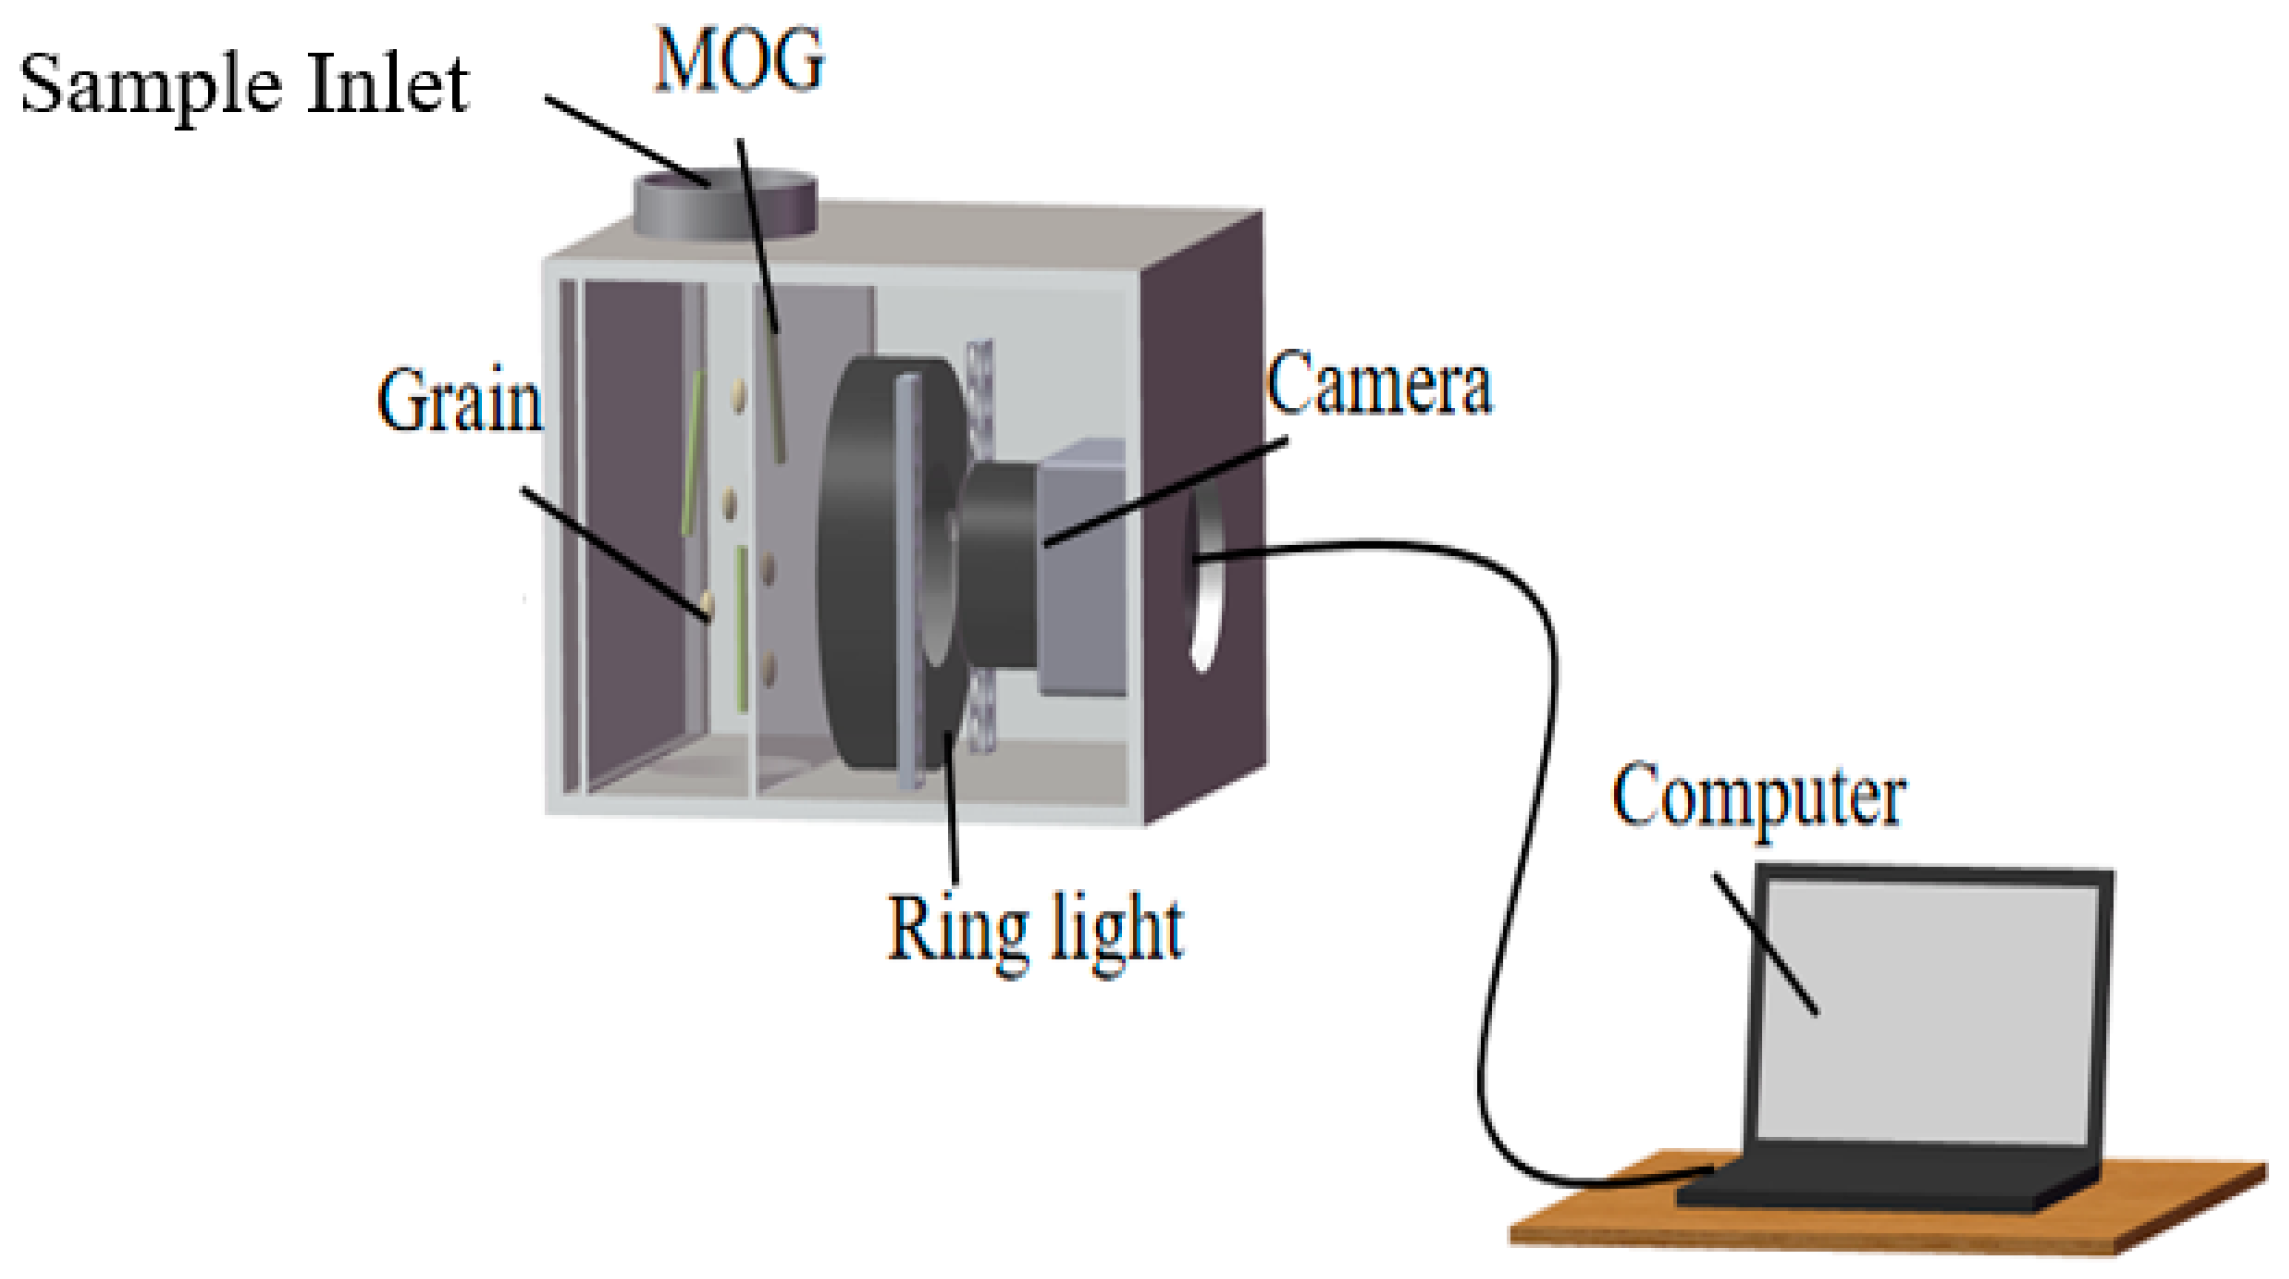
2.1. Data Collection

The data collection process for this study was conducted on 10 November 2023. The samples were collected from the grain tank of the combine harvester. The grain and MOG (material other than grain) fall into the image acquisition device from the inlet of the sampling device; the acquisition system consists of a color CMOS camera (HTSUA133GC/m, Shenzhen Huateng Vision Technology Co., Ltd., Shenzhen, China), a ring aperture, a low-reflectivity glass, and a notebook, and its installation position is shown in Figure 1.
The sampling device uses a ring light source for exposure. The selected color CMOS camera provides an SDK library compatible with the Windows system for camera integration and development, including the official acquisition software for image capture. The industrial camera is connected to the computer via a USB cable and communicates through the installed SDK driver. The acquisition software allows users to configure various camera parameters, including exposure settings, trigger settings, color adjustments, IO operations, video parameters, and resolution. Using the image acquisition function in the software, an automatic shooting cycle is set to capture images of grains falling within the sampling device. After image capture, the acquired images (1280 × 1024 × 3) are stored in JPG format on the laptop. The acquired images of the true classification recognition representation were used to conduct training and testing, as shown in Figure 2, with each image including the broken kernels to be identified and remnants other than the grains. The red line in the figure points to the broken grains, and the color lines point to the impurity stalks, so in order to ensure that the grains contained in each picture are not repeated, the camera shooting interval was set to 1500 ms.

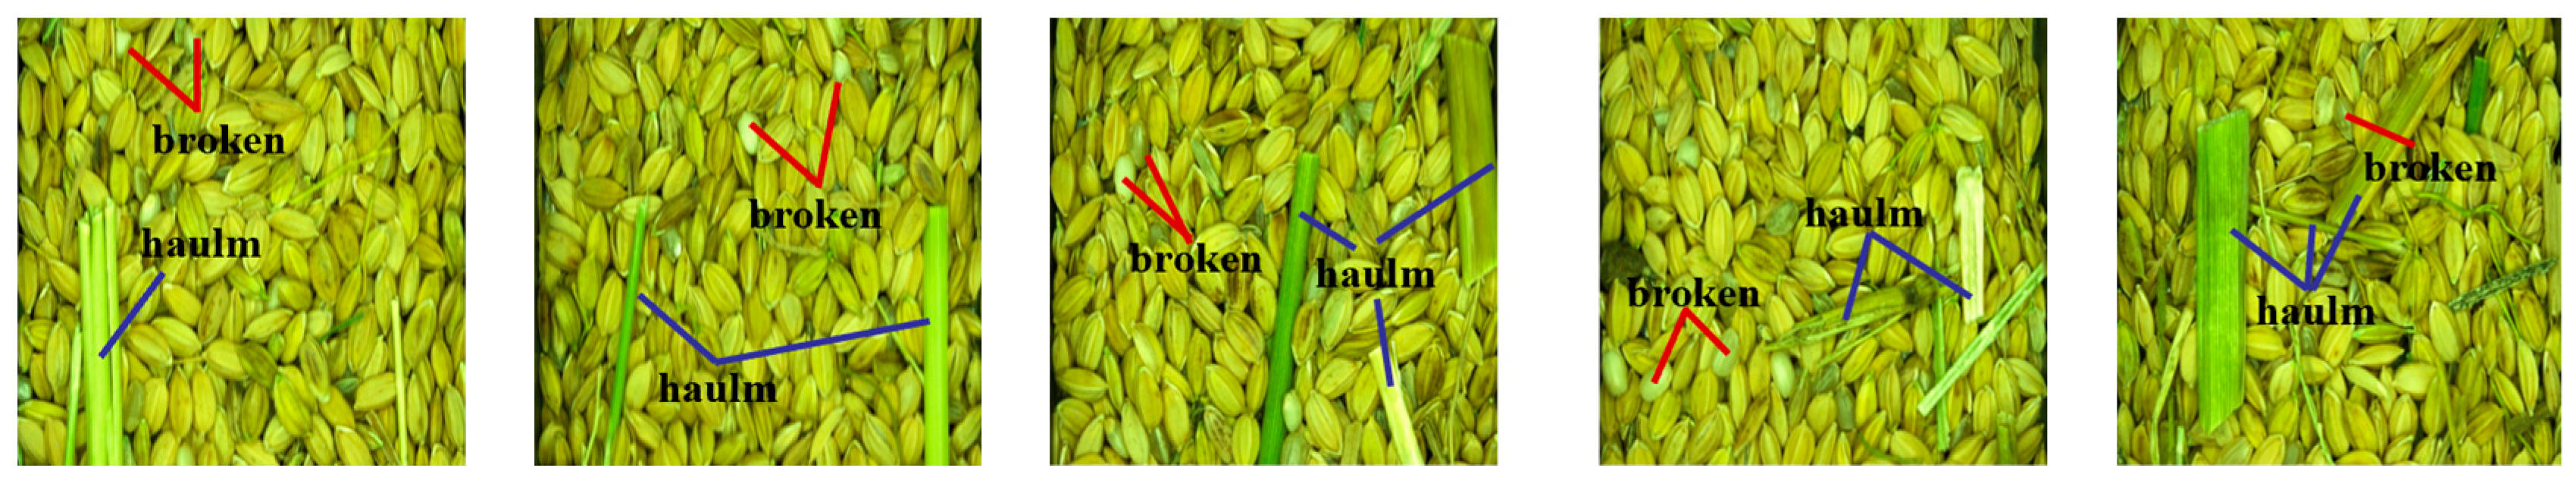
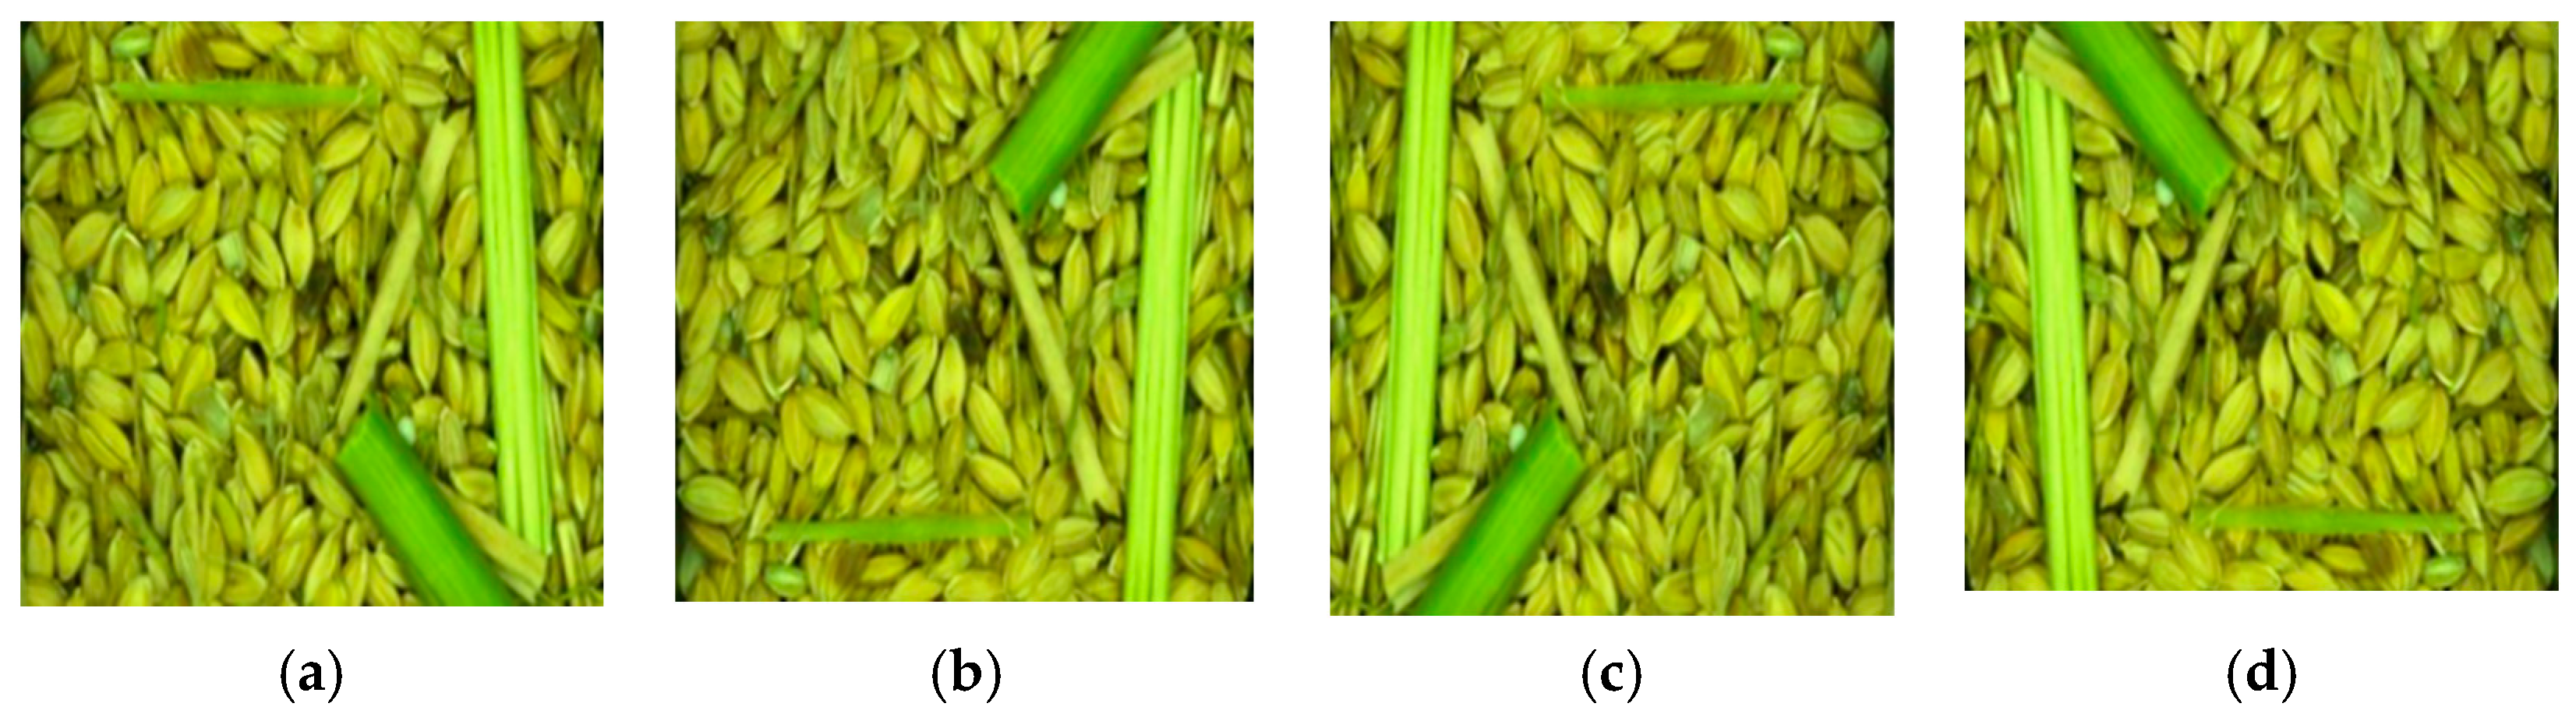
2.2. Image Annotation and Dataset Creation

A total of 2458 images were collected as the original dataset, and the data were annotated using LabelImg1.8.6 software [36,37]. The red line box and blue line box were mainly used to annotate the broken grains and stems, the broken grains and stems were used to represent the broken grains and stems in the annotation, and the text was generated as txt files. The annotated image set will be generated into an XML format set, and finally, the VOC dataset for rice impurity fragmentation monitoring will be constructed. In order to prevent the overfitting problem caused by an insufficient number of images in the dataset, the trained image dataset is expanded by contrast enhancement, mirror inversion, vertical flipping, Gaussian blur, and other methods; the dynamic data expansion technology can effectively reduce the over-dependence on some attribute features in the process of network learning and improve the generalization ability of the network [38]. The original 2458 original images were expanded to 9832, and the training, test, and validation sets were divided according to the ratio of 7:1:2. Figure 3 shows the enhancement process in the image data, wherein Figure 3a is the original image, Figure 3b is the original image vertically flipped and enhanced, and Figure 3c is the original image flipped vertically picture mirrored, and then Figure 3d enhanced by a mirror flip.

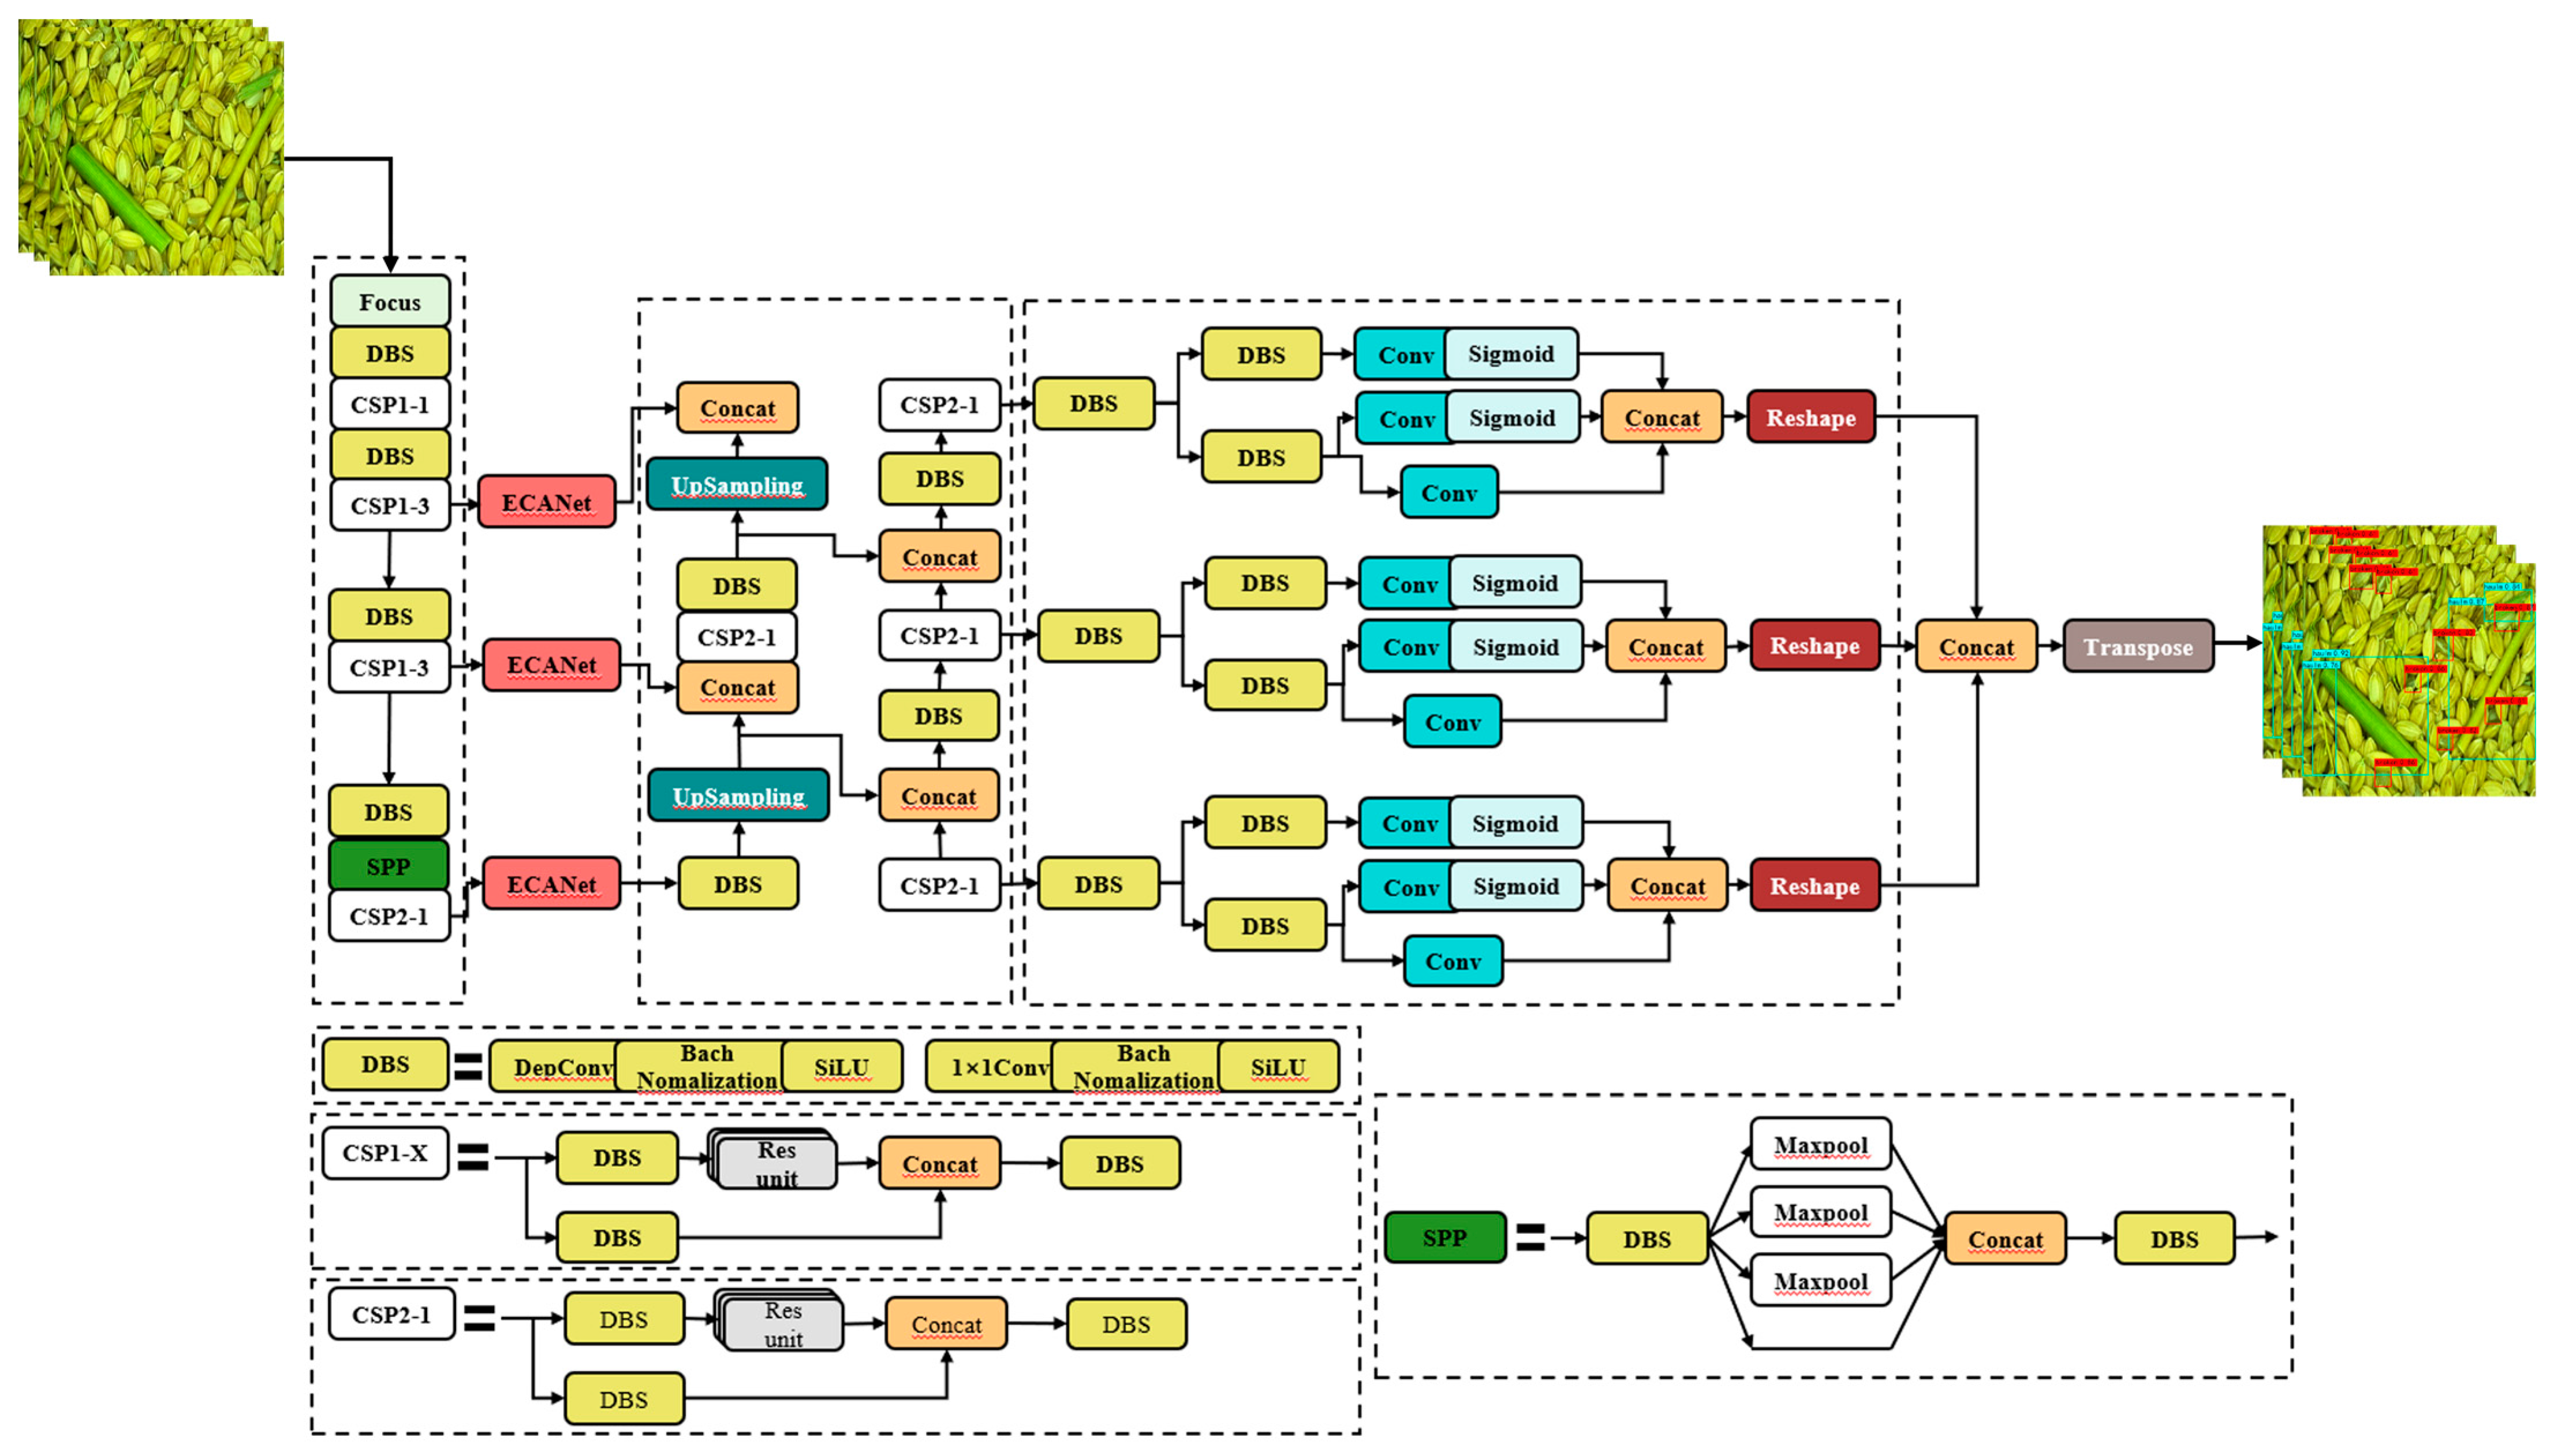
2.3. DE-YOLO Model Methodology

In field trials, it is necessary to consider the strong transferability of the designed object detection system, its responsiveness to complex working conditions, and its real-time detection capability. The YOLO (You Only Look Once) series, compared to other object detection algorithms, offers a faster detection speed, higher accuracy, smaller models, and fewer parameters, enabling the quick and reliable recognition of objects in images. It is suitable for the real-time detection of small crop targets in agricultural environments. YOLOX, an anchor-free object detection algorithm, was open-sourced by Megvii Technology in 2021. Compared to other algorithms in the YOLO series, YOLOX is anchor-free, eliminating the need for predefined anchor boxes and simplifying the detection process. YOLOX also adopts the SimOTA method as a sample matching and label assignment strategy, which can dynamically adjust the ratio and weight of positive and negative samples to avoid overfitting and underfitting. Additionally, YOLOX uses decoupled detection heads, which effectively improve the model’s expressive ability and accelerate convergence [39]. The DE-YOLO model is an improvement of the YOLOX-s model, designed for use in combine harvesters for detecting impurities and broken grains in rice crops during harvesting, as shown in Figure 4. The specific improvements to the model are as follows: The CBS module is replaced by the DBS module in the entire network model, with Depthwise Separable Convolution (DSConv) replacing the standard convolution in YOLOX for feature extraction. This effectively reduces the number of parameters and the computational load [40]. Lightweight networks such as MobileNet and ShuffleNet also use DSConv structures for feature extraction, making the model more lightweight. The ECANet attention mechanism module is introduced into the backbone feature extraction network [41]. By applying weighted selection, the network focuses on the regions of interest, enhancing its attention to rice impurities and broken grains. This compensates for the loss of accuracy due to the convolution changes aiming to achieve model light-weighting. The Focal Loss function is employed, with a focusing term, α(1 − p), added to optimize the class imbalance loss problem [42].

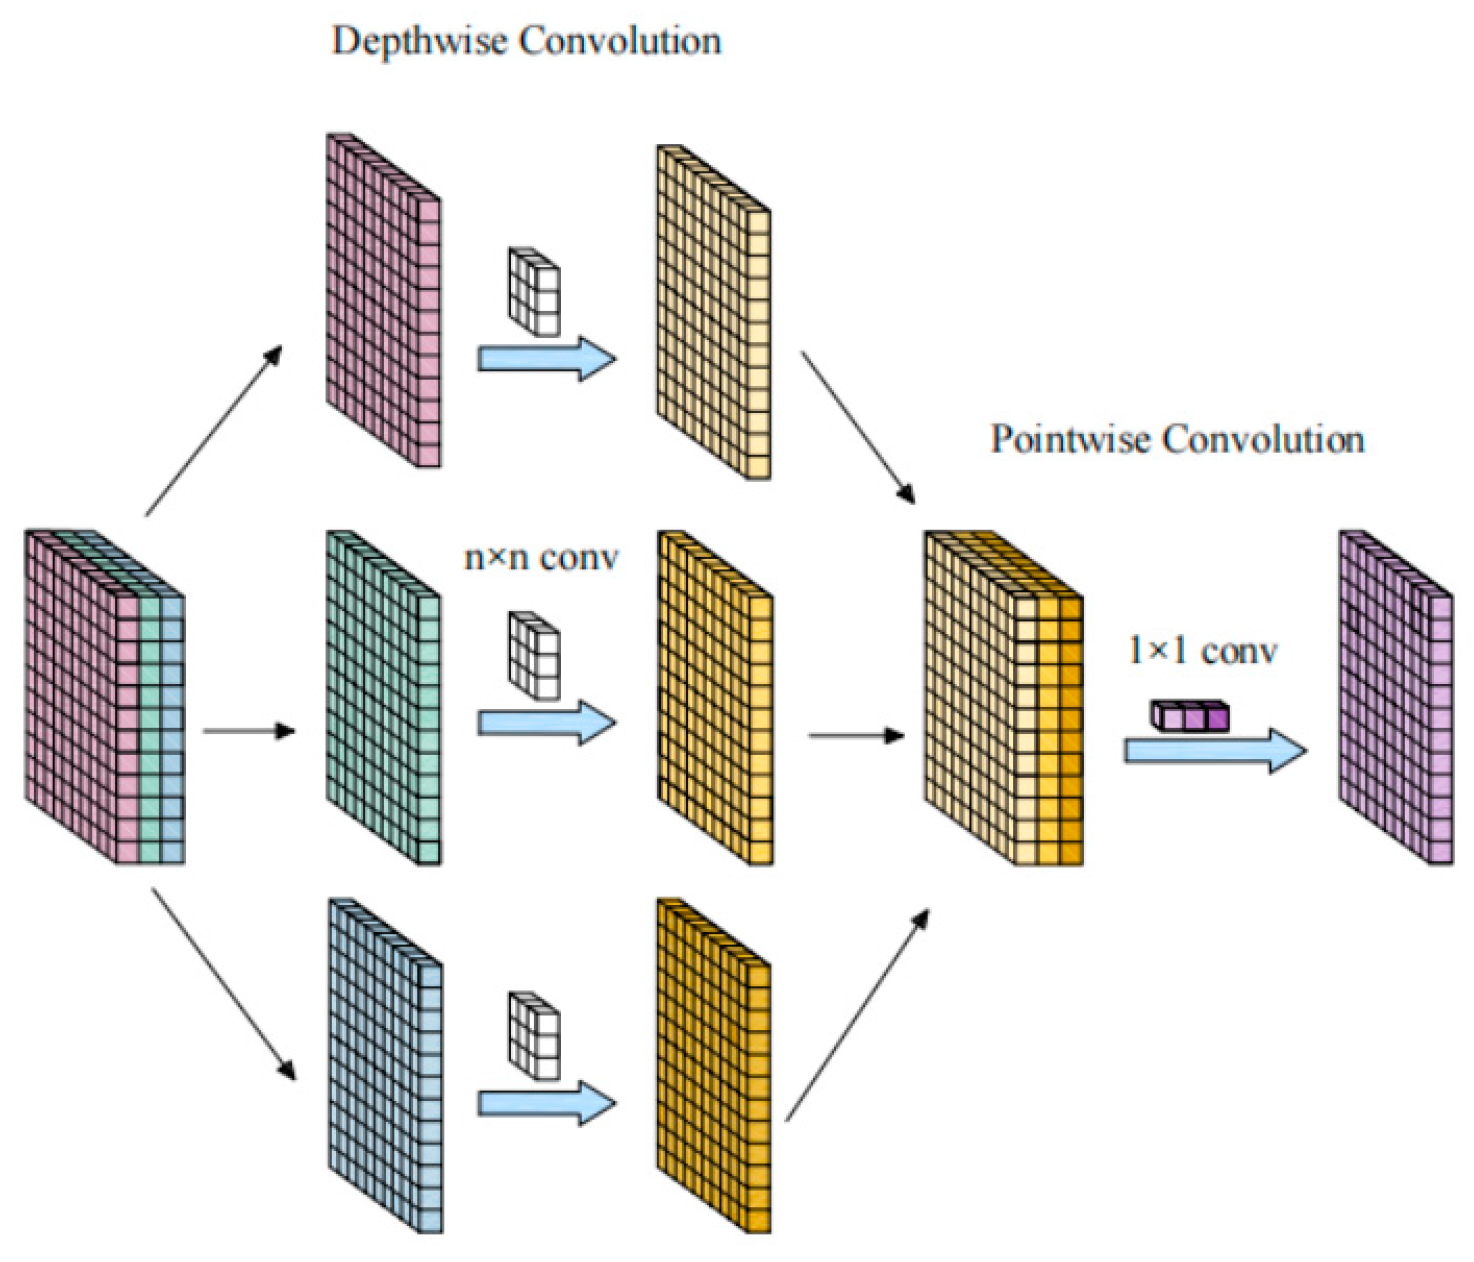
2.3.1. Model Lightweighting

In the entire network model, the CBS module is replaced with the DBS module. The DBS module includes convolution layers, BN layers, and activation functions. The convolution layer uses DSConv operations, which decompose the standard convolution operation into two steps: depthwise convolution (DWConv) and pointwise convolution (PWConv). DWConv applies a separate convolutional kernel to each channel of the input feature map, while PWConv uses a 1 × 1 convolution kernel to combine the outputs of depthwise convolution into the final feature map [43]. Figure 5 illustrates the process of DSConv. This decomposition significantly reduces the number of parameters and the computational load, improving efficiency while maintaining the model’s performance. The activation function used is the SiLU activation function. Lightweight deep learning models, such as the MobileNet series, also use DSConv to reduce model parameters and computational load [44].

2.3.2. Attention Mechanism

The attention mechanism is a widely used data processing method in DL, applied in various tasks such as natural language processing, text classification, image processing, action recognition, and speech recognition [45]. The ECANet model is a classic channel attention mechanism. It calculates the importance of each channel in the feature map and then assigns a weight to each feature based on its importance. This allows the neural network to focus on certain feature channels, enhance the useful ones, and suppress those channels that are less relevant to the current task [46]. ECANet can be considered an improved version of SENet. First, the input feature map undergoes global average pooling, and then the two fully connected layers in SENet are removed and replaced with a 1 × 1 convolution layer, making the model more lightweight by reducing the number of parameters. This modification allows for information exchange across channels, yielding a weight for each channel in the feature map. Finally, normalized weights are multiplied channel-wise by the original feature map to generate the weighted feature map, avoiding dimensionality reduction.

2.3.3. Loss Function: Focal Loss

The binary cross-entropy loss function used in the original model is replaced by the Focal Loss function. Focal Loss is a loss function designed to address the class imbalance problem in DL. It introduces a dynamic adjustment factor that places less focus on easily classified samples and more focus on the difficult-to-classify samples. By reducing the weight of easily classified samples, the model focuses more on learning the difficult ones. The Focal Loss formula is given in (1)–(3), and through the adjustment of several hyperparameters, this loss function focuses on the misclassified samples of rice containing impurities and broken grains. In contrast, the traditional binary cross-entropy loss (BCE) is primarily used for binary classification problems, such as positive and negative samples. For each sample, BCE calculates the difference between the predicted probability distribution and the actual label and optimizes this difference. However, it does not specifically handle class imbalance [47,48].
F L p t = α t 1 p t γ log   ( p t )
In the formula,
α t = { 1 α α     o t h e r w i s e     i f     y = 1
p t = { 1 p p o t h e r w i s e i f     y = 1
In the formula, y is the actual label, α is the weight adjustment for positive and negative samples, pt reflects the difficulty of classifying the sample, γ ≥ 0 is the adjustable focusing parameter, and (1 − pt) is the adjustment factor.

2.4. Experimental Environment

Before conducting model experiments, it is necessary to build an appropriate experimental environment based on the hardware configuration used for training and to adjust the relevant parameters for model training to prevent overfitting. The operating system employed was Windows11, and the GPU utilized was an NVIDIA GeForce GTX 1060. The deep learning framework is based on PyTorch, Python 3.8, PyTorch 1.9.0+cu111, CUDA 11.1, and cuDNN 8.0.50, with the installation of essential libraries, such as Torchvision 0.10.0+cu111, OpenCV 4.7.0.72, and Pillow 9.4.0, being required by the model. GPU acceleration was used to improve the speed of model training and inference, enhancing the efficiency of deep learning model training, inference, data processing, preprocessing, visualization, and result analysis. In this study, the evaluation metrics include precision, recall, mean average precision (mAP), F1-score, Floating Point Operations (FLOPs), and the number of parameters (Parameters) [49,50]. The corresponding formulas are as follows (4)–(7):
P r e c i s i o n = T p T p + F p × 100 %
R e c a l l = T p T p + F N × 100 %
In the formulas, TP represents the number of correctly identified targets, FP refers to the number of positive samples that were either not recognized or incorrectly identified, and FN indicates the number of targets that were incorrectly classified as negative samples.
m A P = i = 1 N A P i T p + F p × 100 %
F 1 = 2 × P r e c i s i o n × R e c a l l P r e c i s i o n + R e c a l l

3. Results and Discussion

3.1. Analysis of Ablation Experiment Results Based on YOLOX

The input image resolution is set to 640 × 640 pixels. Mosaic data augmentation is employed, followed by mixup processing on the mosaic-enhanced images. The maximum learning rate is set to 0.01, and a cosine annealing schedule is used for learning rate decay. The total training consists of 300 epochs, including 50 epochs in the frozen phase and 250 epochs in the unfrozen phase. During the unfrozen phase, the batch size is set to 4. The SGD optimizer is used to update the parameters. This study aims to develop a lightweight algorithm for detecting impurity and breakage in rice grains based on the YOLOX network. To analyze the impact of each improvement on the overall network performance, ablation experiments were conducted under identical training environments and hyperparameter settings. The six models evaluated are as follows: the original YOLOX model, Model, Model2, Model3, Model4, and DE-YOLO.
Model: This replaces the standard convolutional module in YOLOX with the DSConv module.
Model2: This builds upon Model by replacing the loss function in YOLOX with Focal Loss.
Model3: This builds upon Model1 by adding the ECANet attention mechanism.
Model4: This investigates the effects of ECANet and Focal Loss on the model’s performance without the lightweight DSConv module.
DE-YOLO: This adds the ECANet attention mechanism module to Model2.
Using the YOLOX-s model as the baseline, this study implements improvements sequentially and analyzes the specific impact of each improvement on the network’s performance.
The experimental results are shown in Table 1. Model1 replaces the standard convolution (CBS) in YOLOX with Depthwise Separable Convolution (DSConv), reducing the number of parameters by 5 M and lowering GFLOPS by 6.55. However, its mAP decreases to 92.86% (a drop of 1.79%). Model2 builds upon Model1 by incorporating Focal Loss to address the class imbalance in rice grains, improving the mAP to 95.14%. Model3 introduces the ECANet attention mechanism into Model1, increasing the mAP to 94.76%, which is slightly lower than Model2 (95.14%). This indicates that ECANet enhances feature extraction but does not fully compensate for the information loss caused by DSConv. The proposed DE-YOLO model achieves a parameter size of only 4.6 M and reduces GFLOPS to 7.02 while maintaining a mAP of 97.55%, demonstrating a balance between lightweight design and high accuracy.
This study improves the YOLOX model through lightweight modifications and analyzes the impact of Depthwise Separable Convolution (DSConv), Focal Loss, and the ECANet attention mechanism on detection performance. After adopting DSConv in Model1, the mAP decreased by 1.79%. This may be due to DSConv decomposing traditional convolution into DWConv and PWConv, reducing cross-channel feature interaction and affecting the model’s representational capacity. Similar phenomena have been reported in studies on MobileNetV1/V2 and ShuffleNet [50]. Although DSConv significantly reduces computational complexity, its suitability for accuracy-sensitive tasks requires careful consideration.
To address the potential information loss caused by DSConv, Model2 introduces Focal Loss based on Model1 to enhance the detection of hard-to-classify targets, such as rice grains with similar colors and broken grains. The experimental results show that Focal Loss improves the mAP to 95.14%, exceeding that of the original YOLOX model (94.65%). This demonstrates that Focal Loss effectively mitigates class imbalance, allowing the model to focus more on easily confused categories, thereby enhancing the overall detection performance. This suggests that optimizing the loss function in a lightweight YOLOX structure can improve detection accuracy without significantly increasing computational cost.
Model3 incorporates the ECANet attention mechanism into Model1, increasing the mAP to 94.76%, which is slightly higher than that of Model1 (92.86%) but lower than that of Model2 (95.14%). This indicates that ECANet enhances feature extraction but has limited improvement under the DSConv structure. Since DSConv reduces the integrity of feature representation during convolution, ECANet’s channel-wise adaptive mechanism may not fully compensate for this loss. Therefore, while ECANet provides some enhancement, its effectiveness is constrained in lightweight convolution structures. In contrast, Model4, which integrates both Focal Loss and ECANet, achieves a mAP of 97.42%, suggesting that ECANet performs better with complete convolutional feature representation (CBS). This further confirms that simply introducing DSConv in the YOLOX structure may impair feature extraction effectiveness, whereas combining it with an appropriate loss function and attention mechanism can significantly improve detection performance.
Ultimately, the proposed DE-YOLO model achieves both a lightweight design and high detection accuracy.
In order to more intuitively prove the effectiveness of the DE-YOLO model in the detection of rice impurity fragmentation targets, the improved YOLOX model can effectively and accurately identify MOG and broken grains by comparing the recognition effect diagram of the test set. Figure 6 shows the original images of YOLOX and DE-YOLO on the test set and the corresponding model recognition and detection effect diagrams.
As shown in Figure 6, YOLOX successfully detects most of the MOG and broken grains. However, it still fails to recognize broken grains with only a small portion of white kernel exposed, and it struggles to detect thin rice stems that are similar in color to intact grains. Improving the YOLOX model to enhance the extraction of useful features and suppress irrelevant ones yielded the DE-YOLO model, which accurately detected MOG and broken grains that YOLOX missed. In the YOLOX detection image, the black circles indicate instances that were not successfully recognized but were correctly identified in DE-YOLO. Figure 7 and Figure 8 show the mAP results for both YOLOX and DE-YOLO models. Both methods exhibit high accuracy, and after 300 iterations, the DE-YOLO model achieves an average precision of 97.55%, which is 2.9% higher than the average precision of the original YOLOX model.
Figure 9 and Figure 10 show the precision–recall (PR) curves for the YOLOX and DE-YOLO models, respectively. These curves further demonstrate that the improved YOLOX algorithm achieves higher average precision (AP) in the detection of MOG and broken grains, thus proving that the DE-YOLO algorithm can more effectively and accurately identify MOG and broken grains compared to the YOLOX model. This highlights the DE-YOLO algorithm’s superior performance in detecting small target crops.
To effectively alleviate the accuracy loss caused by class imbalance, this study replaces the binary cross-entropy loss function in the original model with the Focal Loss function to compute the confidence and classification losses. Figure 11 and Figure 12 show the loss-versus-epoch curves for the YOLOX-s and DE-YOLO models. After the training begins, due to frozen training, the loss–epoch curve is divided into two phases. In the later phase, the unfreezing training stage, the loss rapidly converges and gradually decreases during subsequent training.
From the loss–epoch curves, it can be observed that the DE-YOLO model has lower loss values in the early stages of training, demonstrating its strong fitting ability from the start. The smooth curve of the DE-YOLO model indicates greater stability throughout the training process, with a more significant reduction in loss. Ultimately, both the final training loss and validation loss are lower than those of the YOLOX-s model. In summary, the DE-YOLO model outperforms the YOLOX-s model in initial fitting, learning speed, and final performance.

3.2. Comparison of Experimental Results with Different Attention Mechanisms

To further validate the effectiveness of incorporating attention mechanisms, a series of comparative experiments were conducted by adding different attention modules. Starting from Model2, which is described in detail in Section 3.1, the effects of adding the SENet, CBAM, and ECANet attention mechanisms on the YOLOX algorithm were compared. These attention mechanisms were integrated into the backbone extraction network of Model2, and training was performed using the same dataset and parameters. The results, as shown in Table 2, present a comparison of different models for rice detection.
From Table 2, it can be seen that Model2 + SENet, Model2 + CBAM, and DE-YOLO all show improvements in accuracy, recall, mean average precision (mAP), and F1-score compared to the original model. The proposed DE-YOLO model, which adds the ECANet attention module to Model2, outperforms both Model2 + SENet and Model2 + CBAM in terms of accuracy, recall, mAP, and F1-score. Specifically, DE-YOLO improves accuracy by 2.41%, recall by 2%, the mAP by 2.9%, and the F1-score by 0.02 compared to Model2. The experimental results demonstrate that the ECA model is more effective at suppressing irrelevant features in rice samples while retaining more valuable detection features. This enhancement significantly improves the model’s performance in detecting small targets and further validates the effectiveness of incorporating attention mechanisms.

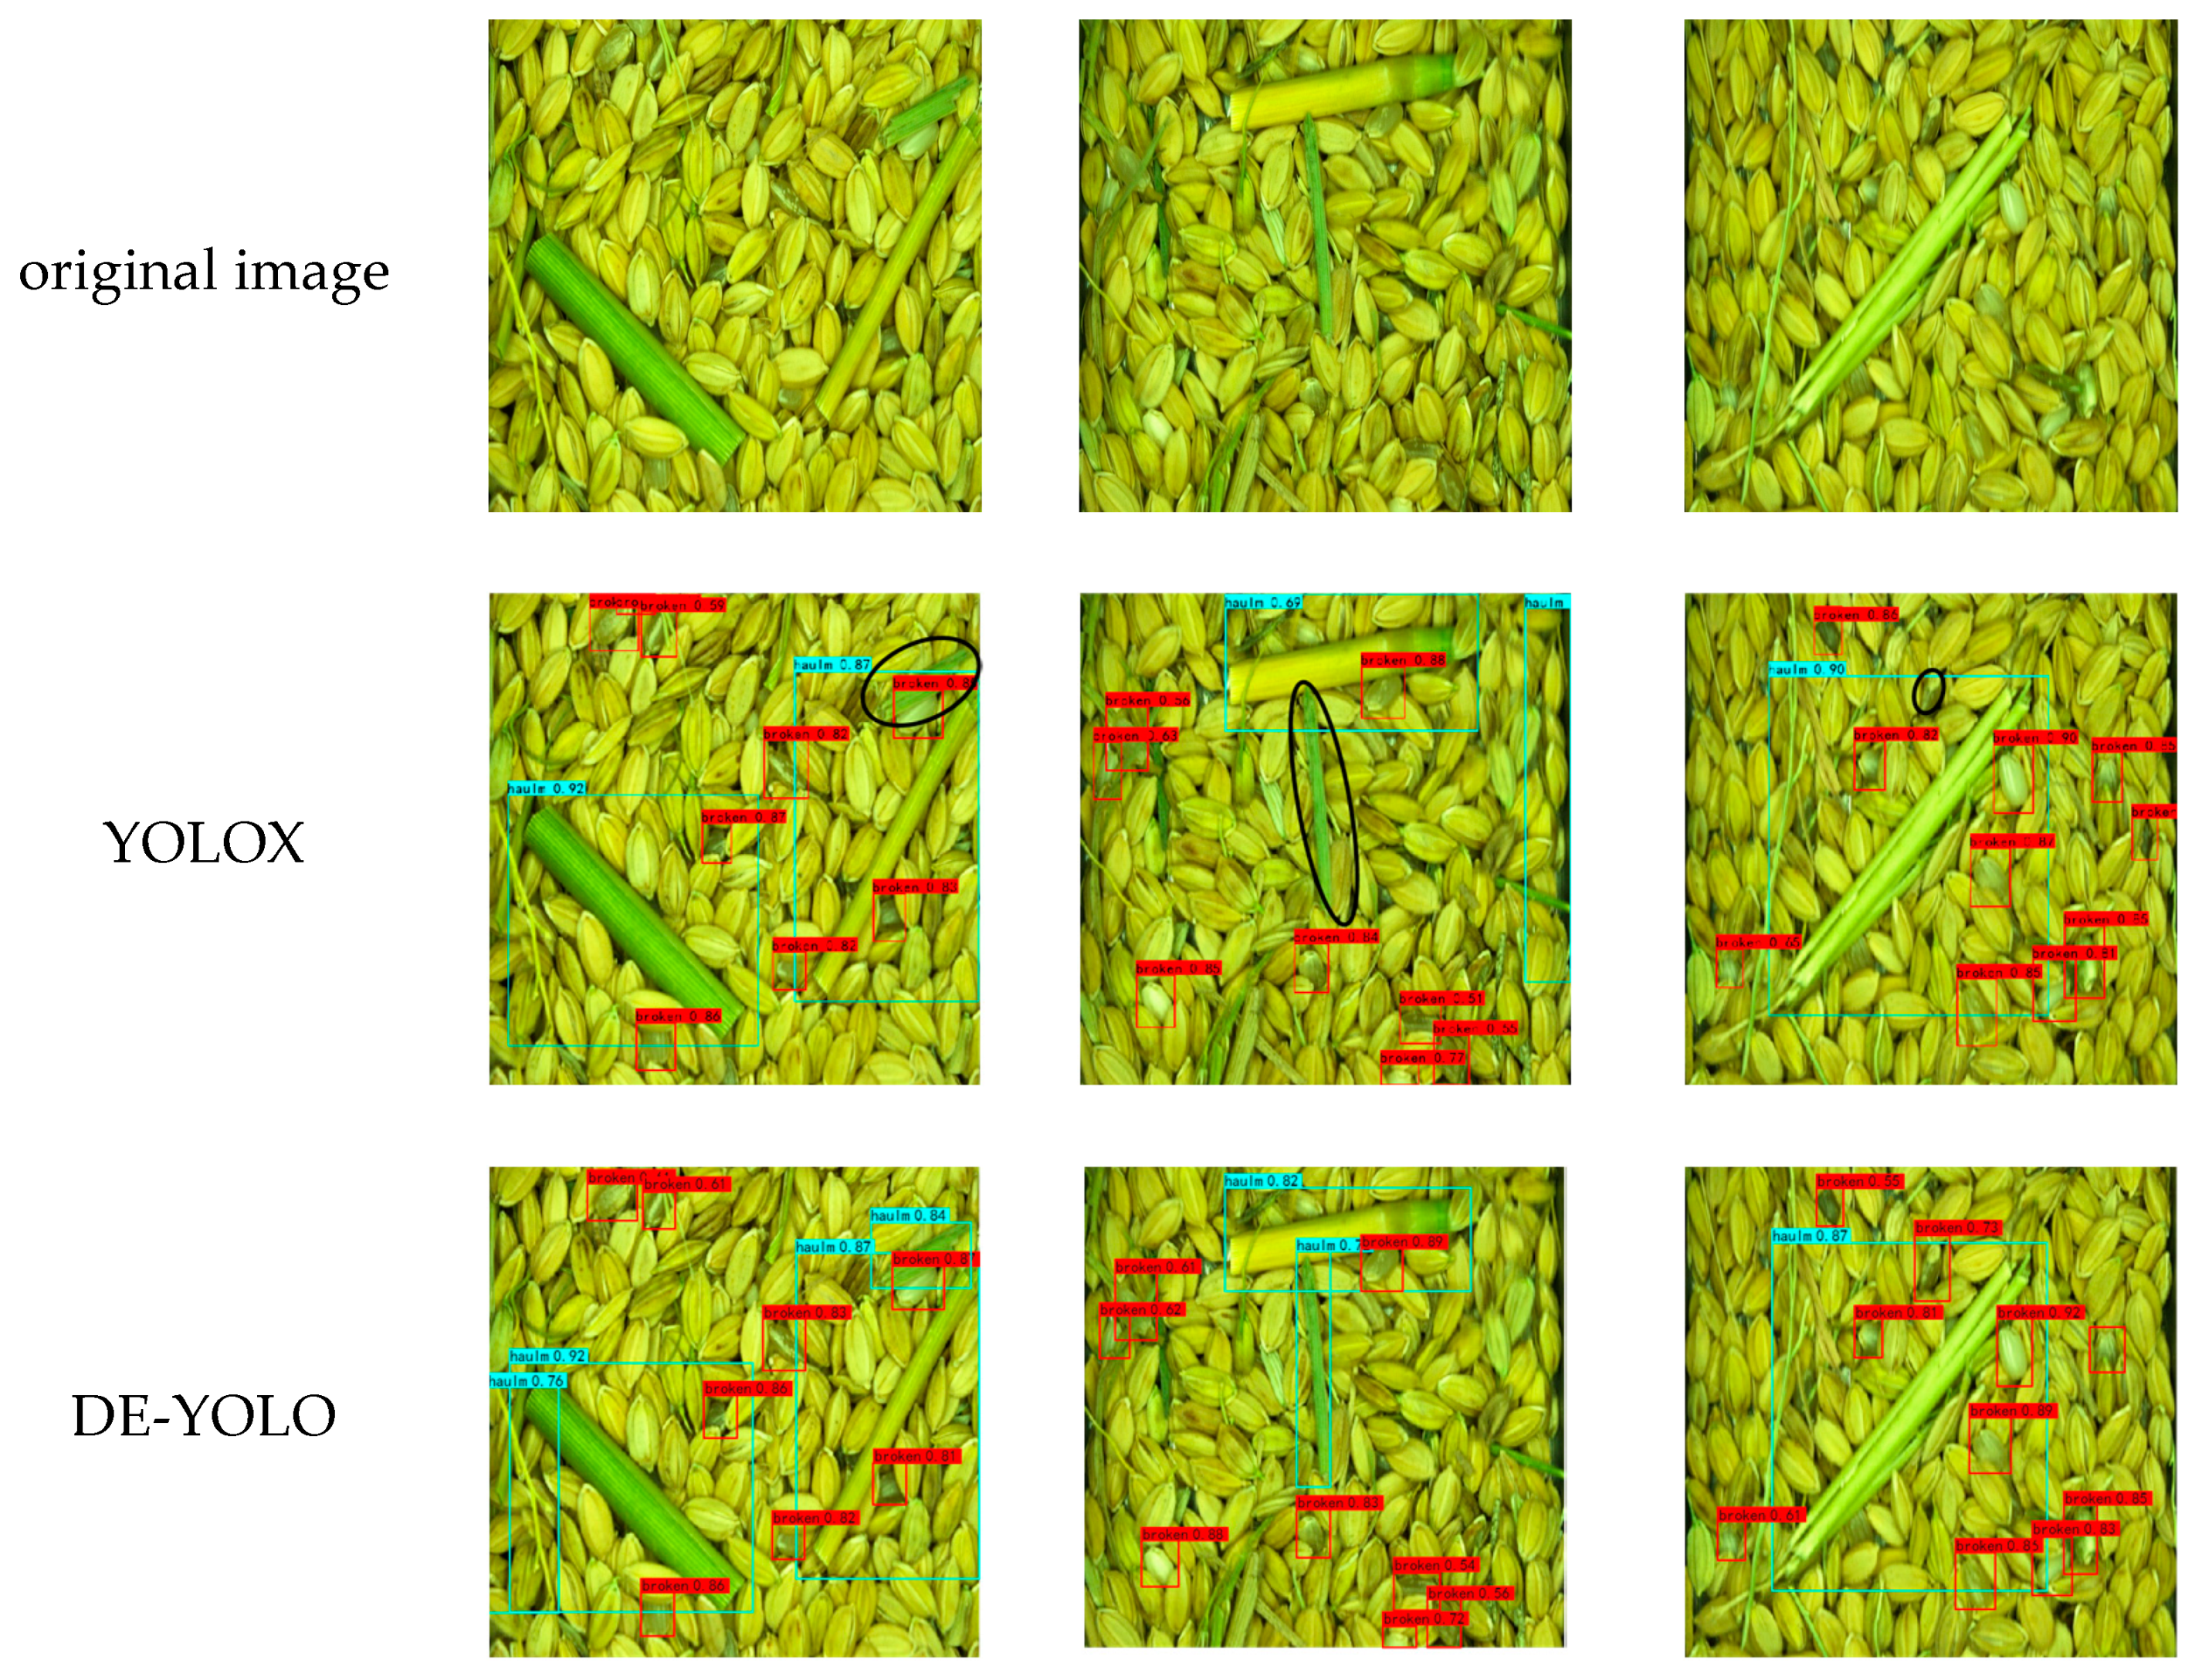
3.3. Comparison of Detection Results of Different Models

In order to further validate the performance of DE-YOLO in rice impurity and broken grain detection, a comparison of the recognition performance of various YOLO series detection models on the test samples was conducted. Using the same experimental platform and dataset, Faster R-CNN, YOLOv3, YOLOv5, YOLOX, DE-YOLO, and YOLOv8 were trained in the same batch. The detection results are shown in Table 3.
The experimental results demonstrate that the DE-YOLO model performs exceptionally well in the detection of impurity and breakage rates in rice, achieving high-accuracy detection results. Specifically, DE-YOLO achieves a precision of 96.66%, a recall of 94.46%, a mAP of 97.55%, and an F1-score of 0.96. These metrics indicate that DE-YOLO effectively reduces false positives and false negatives while accurately identifying rice stems and broken grains, delivering high-quality detection outcomes. Moreover, DE-YOLO has a parameter size of 4.6 M, significantly reducing computational resource consumption compared to other YOLO series models, such as YOLOv3 (62 M) and YOLOv8 (11.2 M). This lightweight design enables DE-YOLO to operate efficiently on resource-constrained devices.
DE-YOLO demonstrates significant advantages over other mainstream object detection models. Firstly, compared to YOLOv3, YOLOv5, and YOLOX, DE-YOLO outperforms them in key metrics such as precision, recall, mAP, and F1-score. For example, DE-YOLO’s precision is 2.98 percentage points higher than that of YOLOv3 and 1.72 percentage points higher than that of YOLOv5, showcasing its superior accuracy in effectively reducing false positives. Similarly, DE-YOLO achieves a higher recall than YOLOv3 and YOLOX, indicating its enhanced capability in detecting small and hard-to-identify objects, thereby minimizing missed detections.
Compared to YOLOv8, DE-YOLO achieves similar accuracy but reduces the parameter size by 59% due to its lightweight optimizations, significantly lowering computational costs and making it more suitable for deployment on resource-constrained devices.
Faster R-CNN, as a two-stage detector, performs well in feature extraction. However, DE-YOLO exhibits a considerable advantage across all performance metrics. Faster R-CNN achieves a precision of 88.52%, a recall of 86.93%, and a mAP of 89.71%, while DE-YOLO surpasses these figures by over 8 percentage points, with its F1-score improving by 0.08. Additionally, DE-YOLO’s parameter size is only 4.6 M, an 89% reduction compared to Faster R-CNN’s 41 M. This reduction not only allows DE-YOLO to outperform Faster R-CNN in accuracy but also gives it a clear advantage in computational efficiency.
Overall, DE-YOLO’s combination of high accuracy and low computational requirements makes it highly applicable for rice quality inspection. Its ability to operate efficiently in resource-limited environments provides an optimal solution for real-time detection applications.

4. Conclusions

(1)
Research Innovation and Methodology: To improve the detection accuracy of rice impurities and broken grains, this study proposes an improved YOLOX model—DE-YOLO. We replace the standard convolution module (CBS) in the YOLOX-s network with a Depthwise Separable Convolution module (DBS), which significantly reduces the model’s parameter size and achieves lightweight optimization. This makes DE-YOLO more efficient and suitable for deployment on resource-constrained mobile devices. To address the class imbalance caused by color similarity in rice samples, we use the Focal Loss function instead of the traditional binary cross-entropy (BCE) loss function, significantly improving the accuracy when handling small sample classes. To further enhance the detection accuracy of rice targets, particularly small targets such as broken grains and rice straw, the DE-YOLO model incorporates the ECANet attention mechanism module into the YOLOX-s backbone feature extraction network. This module effectively enhances the model’s attention to valid features while suppressing irrelevant features, further improving the detection capability for small targets. These improvements make DE-YOLO a highly efficient, accurate, and lightweight algorithm for rice target detection, so it is particularly suitable for detecting rice impurities and broken grains.
(2)
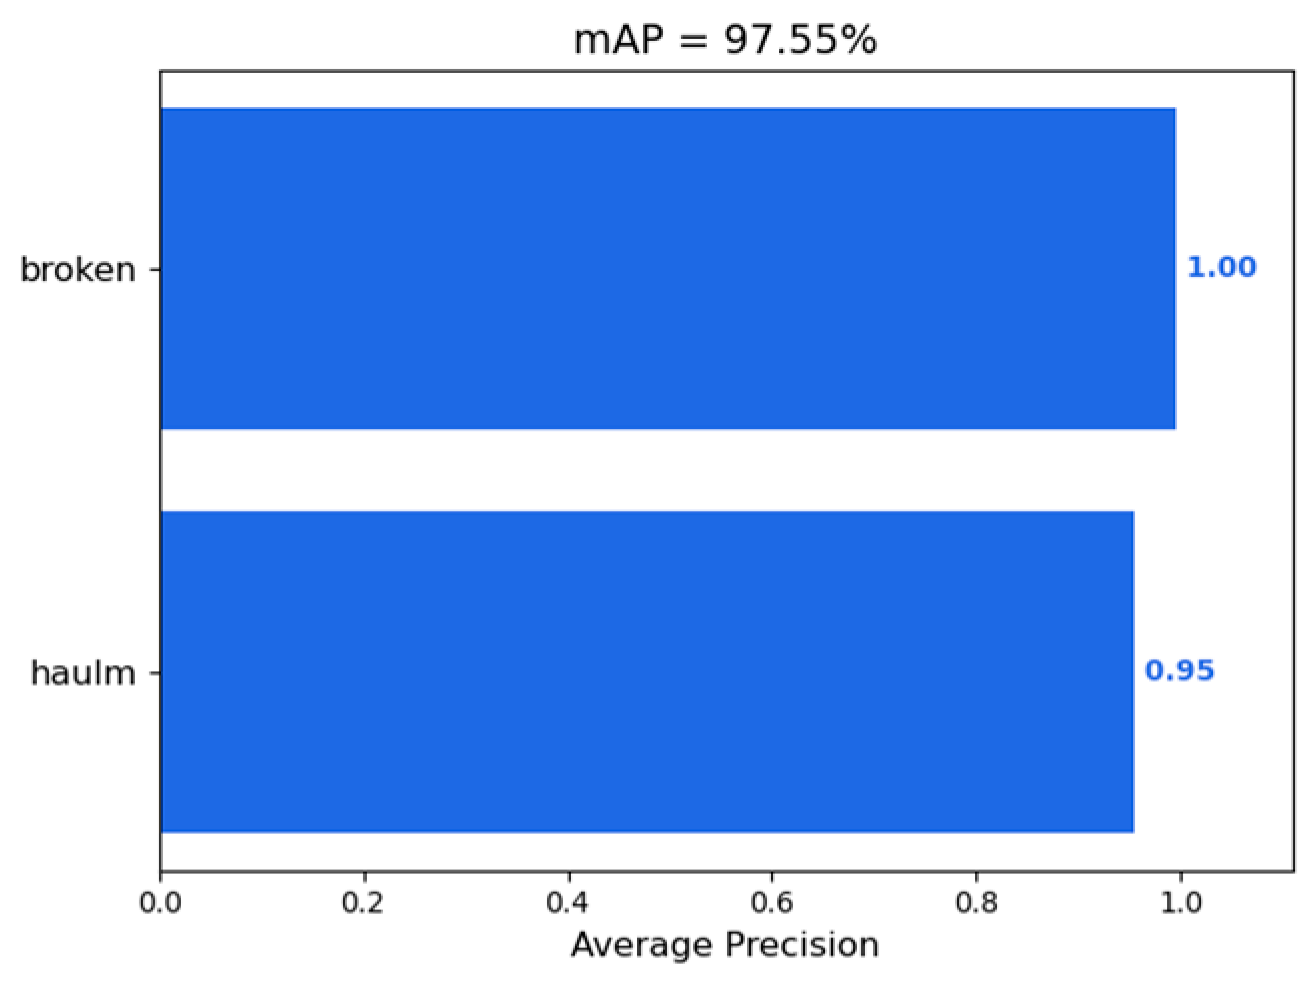
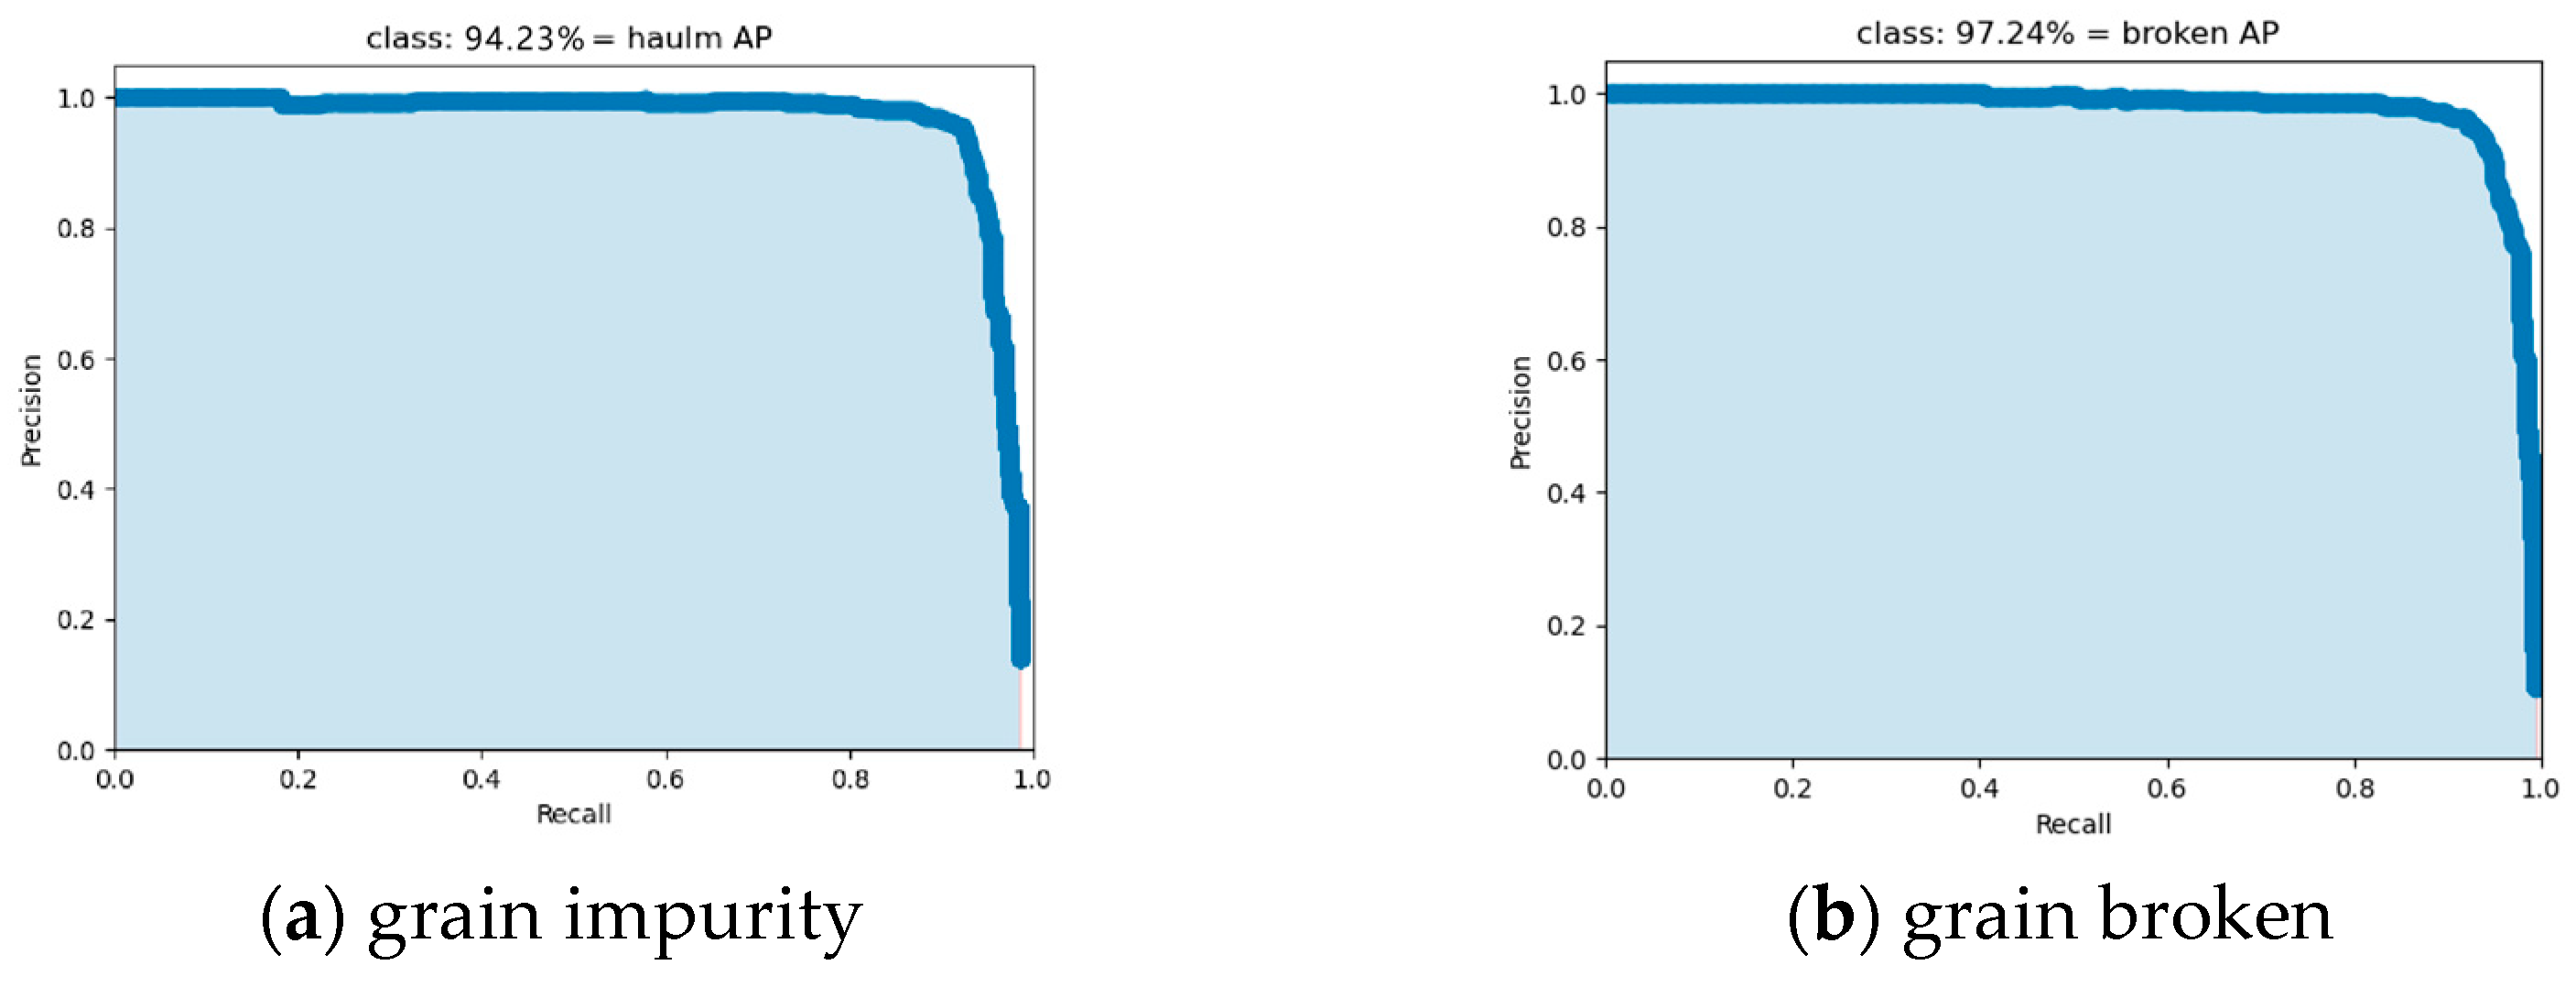
Experimental Results and Performance Verification: The experimental results show that DE-YOLO significantly outperforms traditional YOLO models in rice target detection. Compared to Faster R-CNN, YOLOv3, YOLOv5, YOLOX, and YOLOv8, DE-YOLO demonstrates superior precision and recall, especially in detecting small rice targets such as broken grains and impurities. Specifically, DE-YOLO achieves a precision of 96.66%, a recall of 94.46%, a mean average precision (mAP) of 97.55%, and an F1-score of 0.96%. These excellent performance results indicate that DE-YOLO not only maintains high accuracy while reducing model computation but also enhances the detection capability for small targets in rice samples. It has a significant advantage in detecting impurities and broken grains in complex backgrounds. Therefore, DE-YOLO provides an efficient and reliable solution for rice target detection, especially for impurity and broken grain detection, with promising application prospects in unmanned combine harvesters for grain impurity and broken monitoring.

Author Contributions

Conceptualization, methodology, software, validation, writing—original draft, investigation, data curation, and visualization, X.X.; validation and data curation, D.Y.; resources, writing—review and editing, formal analysis, supervision, project administration, and funding acquisition, Z.L.; resources, validation, and writing—review and editing, Y.L. All authors have read and agreed to the published version of the manuscript.

Funding

This research was funded by the National Natural Science Foundation of China (52275251); Sponsored by the QingLan Project of Jiangu Province, China; and was also funded by the Young Talents Cultivation Program of Jiangsu University, China (2022), the Agricultural Science and Technology Support Program of Taizhou, China (TN202208), and A Project Funded by the Priority Academic Program Development of Jiangsu Higher Education Institutions (No. PAPD-2023-87).

Institutional Review Board Statement

Not applicable.

Data Availability Statement

The raw data supporting the conclusions of this article will be made available by the authors upon request.

Conflicts of Interest

The authors declare no conflicts of interest.

References

  1. Ali, F.; Jighly, A.; Joukhadar, R.; Niazi, N.K.; Al-Misned, F. Current Status and Future Prospects of Head Rice Yield. Agriculture 2023, 13, 705. [Google Scholar] [CrossRef]
  2. Chen, S.; Zhou, Y.; Tang, Z.; Lu, S. Modal vibration response of rice combine harvester frame under multi-source excitation. Biosyst. Eng. 2020, 194, 177–195. [Google Scholar] [CrossRef]
  3. Qing, Y.R.; Li, Y.M.; Xu, L.Z.; Ma, Z.; Tan, X.L.; Wang, Z. Oilseed rape (Brassica napus L.) pod shatter resistance and its relationship with whole plant and pod characteristics. Ind. Crops Prod. 2021, 166, e113459. [Google Scholar] [CrossRef]
  4. Qing, Y.; Li, Y.; Yang, Y.; Xu, L.; Ma, Z. Development and experiments on reel with improved tine trajectory for harvesting oilseed rape. Biosyst. Eng. 2021, 206, 19–31. [Google Scholar] [CrossRef]
  5. Zhang, T.; Li, Y.M.; You, G.L. Experimental study on the cleaning performance of hot air flow cleaning device. Agriculture 2023, 13, 1828. [Google Scholar] [CrossRef]
  6. Que, K.X.; Tang, Z.; Wang, T.; Su, Z.; Ding, Z. Effects of unbalanced incentives on threshing drum stability during rice threshing. Agriculture 2024, 14, 777. [Google Scholar] [CrossRef]
  7. Chen, T.; Xu, L.; Ahn, H.S.; Lu, E.; Liu, Y.; Xu, R. Evaluation of headland turning types of adjacent parallel paths for combine harvesters. Biosyst. Eng. 2023, 233, 93–113. [Google Scholar] [CrossRef]
  8. Ma, Z.; Zhu, Y.L.; Wu, Z.P.; Traore, S.N.; Chen, D.; Xing, L.C. BP neural network model for material distribution prediction based on variable amplitude anti-blocking screening DEM simulations. Int. J. Agric. Biol. Eng. 2023, 16, 190–199. [Google Scholar] [CrossRef]
  9. Liu, Y.B.; Li, Y.M.; Ji, K.Z.; Yu, Z.W.; Ma, Z.; Xu, L.Z.; Niu, C.H. Development of a hydraulic variable-diameter threshing drum control system for combine harvester, part I: Adaptive monitoring method. Biosyst. Eng. 2025, 250, 174–182. [Google Scholar] [CrossRef]
  10. Liang, Z.; Wada, M.E. Development of cleaning systems for combine harvesters: A review. Biosyst. Eng. 2023, 236, 79–102. [Google Scholar] [CrossRef]
  11. Chen, Z.; Wassgren, C.; Kingsly Ambrose, R.P. A review of grain kernel damage: Mechanisms, modeling, and testing procedures. Trans. ASABE 2020, 63, 455–475. [Google Scholar] [CrossRef]
  12. Liu, Y.; Xin, P.; Sun, J.; Zheng, D. Oat Threshing Damage and Its Effect on Nutritional Components. Agriculture 2024, 14, 842. [Google Scholar] [CrossRef]
  13. Wallays, C.; Missotten, B.; De Baerdemaeker, J.; Saeys, W. Hyperspectral waveband selection for on-line measurement of grain cleanness. Biosyst. Eng. 2009, 104, 1–7. [Google Scholar] [CrossRef]
  14. Chen, J.; Song, J.; Guan, Z.H.; Lian, Y. Measurement of the distance from grain divider to harvesting boundary based on dynamic regions of interest. Int. J. Agric. Biol. Eng. 2021, 14, 226–232. [Google Scholar] [CrossRef]
  15. Luo, Y.; Wei, L.; Xu, L.; Zhang, Q.; Liu, J.; Cai, Q.B.; Zhang, W. Stereo-vision-based multi-crop harvesting edge detection for precise automatic steering of combine harvester. Biosyst. Eng. 2022, 215, 115–128. [Google Scholar] [CrossRef]
  16. Sun, Y.X.; Luo, Y.S.; Zhang, Q.; Xu, L.Z.; Wang, L.Y.; Zhang, P.P. Estimation of crop height distribution for mature rice based on a moving surface and 3D point cloud elevation. Agronomy 2022, 12, 836. [Google Scholar] [CrossRef]
  17. Niu, Y.X.; Han, W.T.; Zhang, H.H.; Zhang, L.Y.; Chen, H.P. Estimating maize plant height using a crop surface model constructed from UAV RGB images. Biosyst. Eng. 2024, 241, 56–67. [Google Scholar] [CrossRef]
  18. Mahirah, J.; Yamamoto, K.; Miyamoto, M.; Kondo, N.; Ogawa, Y.; Suzuki, T.; Habaragamuwa, H.; Ahmad, U. Double lighting machine vision system to monitor harvested paddy grain quality during head-feeding combine harvester operation(Article). Machines 2015, 3, 352–363. [Google Scholar] [CrossRef]
  19. Suchart, Y.; Chokcharat, R. An Effective Method for Classification of White Rice Grains Using Various Image Processing Techniques. In Proceedings of the 3rd International Conference on Intelligent Technologies and Engineering Systems (ICITES2014), Cheng Shiu University, Kaohsiung, Taiwan, 19–21 December 2014; pp. 91–97. [Google Scholar]
  20. Chen, J.; Gu, Y.; Lian, Y.; Han, M. Online recognition method of impurities and broken paddy grains based on machine vision. Trans. Chin. Soc. Agric. Eng. 2018, 34, 187–194. [Google Scholar] [CrossRef]
  21. Ma, Z.Y.; Zhang, X.K.; Yang, G.Y. Research on segmentation method of rice stem impurities based on improved Mask R-CNN. J. Chin. Agric. Mech. 2021, 42, 145–150. [Google Scholar] [CrossRef]
  22. Chen, J.; Han, M.; Lian, Y.; Zhang, S. Segmentation of impurity rice grain images based on U-Net model. Trans. Chin. Soc. Agric. Eng. 2020, 36, 174–180. [Google Scholar] [CrossRef]
  23. Wu, Z.P.; Chen, J.; Ma, Z.; Li, Y.M.; Zhu, Y.L. Development of a lightweight online detection system for impurity content and broken rate in rice for combine harvesters. Comput. Electron. Agric. 2024, 218, 108689. [Google Scholar] [CrossRef]
  24. Chen, J.; Zhang, S.; Li, Y.M.; Zhu, L.J.; Xia, H.; Zhu, Y.H. Research on online identification system of rice broken impurities in combine harvester. J. Chin. Agric. Mech. 2021, 42, 137–144. [Google Scholar] [CrossRef]
  25. Lian, Y.; Gong, S.J.; Sun, M.Y. Sampling box with damper for grain condition monitoring device of combine harvester. Chin. Hydraul. Pneum. 2022, 46, 71–78. [Google Scholar]
  26. Cai, Q.B. On-Line Monitoring Method and Experimental Study on Impurity and Broken Rate of Rice, Wheat and Rapeseed; China Jiangsu University: Zhenjiang, China, 2022. [Google Scholar]
  27. Zhang, Q.; Hu, J.P.; Xu, L.Z.; Cai, X.Y.; Liu, P. Impurity/Breakage assessment of vehicle-mounted dynamic rice grain flow on combine harvester based on improved Deeplabv3+ and YOLOv4. IEEE Access 2023, 11, 49273–49288. [Google Scholar] [CrossRef]
  28. Han, X.; Chang, J.; Wang, K. You only look once: Unified, real-time object detection. Procedia Comput. Sci. 2021, 183, 61–72. [Google Scholar] [CrossRef]
  29. Redmon, J.; Farhadi, A. Yolov3: An incremental improvement. arXiv 2018, arXiv:1804.02767. [Google Scholar] [CrossRef]
  30. Bochkovskiy, A.; Wang, C.-Y.; Liao, H.-Y.M. Yolov4: Optimal speed and accuracy of object detection. arXiv 2020, arXiv:2004.10934. [Google Scholar] [CrossRef]
  31. Ultralytics. Comprehensive Guide to Ultralytics YOLOv5. Available online: https://docs.ultralytics.com/zh/yolov5 (accessed on 28 May 2024).
  32. Li, C.; Li, L.; Jiang, H.; Weng, K.; Geng, Y.; Li, L.; Ke, Z.; Li, Q.; Cheng, M.; Nie, W.; et al. Yolov6: A single-stage object detection framework for industrial applications. arXiv 2022, arXiv:2209.02976. [Google Scholar] [CrossRef]
  33. Wang, C.-Y.; Bochkovskiy, A.; Liao, H.-Y.M. Yolov7: Trainable bag-of-freebies sets new state-of-the-art for real-time object detectors. In Proceedings of the IEEE/CVF Conference on Computer Vision and Pattern Recognition, Vancouver, BC, Canada, 17–24 June 2023; pp. 7464–7475. [Google Scholar] [CrossRef]
  34. Wang, H.; Yun, L.; Yang, C.; Wu, M.; Wang, Y.; Chen, Z. OW-YOLO: An Improved YOLOv8s Lightweight Detection Method for Obstructed Walnuts. Agriculture 2025, 15, 159. [Google Scholar] [CrossRef]
  35. Zhang, Y.; Zhang, W.; Yu, J.; He, L.; Chen, J.; He, Y. Complete and accurate holly fruits counting using YOLOX object detection. Comput. Electron. Agric. 2022, 198, 107062. [Google Scholar] [CrossRef]
  36. Ji, W.; Pan, Y.; Xu, B.; Wang, J. A Real-Time Apple Targets Detection Method for Picking Robot Based on ShufflenetV2-YOLOX. Agriculture 2022, 12, 856. [Google Scholar] [CrossRef]
  37. Zhang, Z.; Lu, Y.; Zhao, Y.; Pan, Q.; Jin, K.; Xu, G.; Hu, Y. Ts-yolo: An all-day and lightweight tea canopy shoots detection model. Agronomy 2023, 13, 1411. [Google Scholar] [CrossRef]
  38. Krizhevsky, A.; Sutskever, I.; Hinton, G.E. Imagenet classification with deep convolutional neural networks. Adv. Neural Inf. Process. Syst. 2012, 25, 84–90. [Google Scholar] [CrossRef]
  39. Ge, Z. Yolox: Exceeding yolo series in 2021. arXiv 2021, arXiv:2107.08430. [Google Scholar] [CrossRef]
  40. Chollet, F. Xception: Deep learning with depthwise separable convolutions. In Proceedings of the IEEE International Conference on Computer Vision and Pattern Recognition, Honolulu, HI, USA, 21–26 July 2017; pp. 1251–1258. [Google Scholar] [CrossRef]
  41. Wag, Q.; Wu, B.; Zhu, P.; Li, P.; Zuo, W.; Hu, Q. ECA-Net: Eficient channel attention for deep convolutional neural networks. In Proceedings of the Proe, IEEE Computer Society Conference on Computer Vision and Pattern Recognition, Online, 13–19 June 2020; pp. 11531–11539. [Google Scholar]
  42. Dina, A.S.; Siddique, A.B.; Manivannan, D. A deep learning approach for intrusion detection in Internet of Things using focal loss function. Internet Things 2023, 22, 100699. [Google Scholar] [CrossRef]
  43. Srivastava, H.; Sarawadekar, K. A depth wise separable convolution architecture for CNN accelerator. In Proceedings of the 2020 IEEE Applied Signal Processing Conference (ASPCON), Kolkata, India, 7–9 October 2020; pp. 1–5. [Google Scholar] [CrossRef]
  44. Sandler, M.; Howard, A.; Zhu, M.; Zhmoginov, A.; Chen, L.C. Mobilenetv2: Inverted residuals and linear bottlenecks. In Proceedings of the IEEE International Conference on Computer Vision and Pattern Recognition, Salt Lake City, UT, USA, 18–22 June 2018; pp. 4510–4520. [Google Scholar] [CrossRef]
  45. Niu, Z.; Zhong, G.; Yu, H. A review on the attention mechanism of deep learning. Neurocomputing 2021, 452, 48–62. [Google Scholar] [CrossRef]
  46. Rong, Y.; Ma, Z.; Quan, G.; Tong, L.; Shao, G.; Wang, B. Target detection of tea disease based on improved YOLOv5s-ECA-ASFF algorithm. J. Chin. Agric. Mech. 2024, 45, 244. [Google Scholar] [CrossRef]
  47. Su, J.; Liu, Z.; Zhang, J.; Sheng, V.S.; Song, Y.; Zhu, Y.; Liu, Y. DV-Net: Accurate liver vessel segmentation via dense connection model with D-BCE loss function. Knowl. Based Syst. 2021, 232, 107471. [Google Scholar] [CrossRef]
  48. Li, Z.C.; Ling, X.J.; Li, H.Q.; Luo, W.P. Object detection method for chestnut peng in the tree based on improved YOLOv3. J. Chin. Agric. Mech. 2024, 45, 209. [Google Scholar] [CrossRef]
  49. Liang, M.; Zhang, Y.; Zhou, J.; Shi, F.; Wang, Z.; Lin, Y.; Liu, Y. Research on detection of wheat tillers in natural environment based on YOLOv8-MRF. Smart Agric. Technol. 2024, 10, 100720. [Google Scholar] [CrossRef]
  50. Howard, A.G.; Zhu, M.; Chen, B.; Kalenichenko, D.; Wang, W.; Weyand, T.; Andreetto, M.; Adam, H. Mobilenets: Efficient convolutional neural networks for mobile vision applications. arXiv 2017, arXiv:1704.04861. [Google Scholar] [CrossRef]
Figure 1. Installation diagram of image sampling device.
Agriculture 15 00848 g001
Figure 2. The acquired images of the true classification recognition.
Agriculture 15 00848 g002
Figure 3. Image data enhancement. (a) Original image; (b) the picture flipped vertically; (c) the flipped picture mirrored; (d) the picture flipped vertically + mirrored.
Agriculture 15 00848 g003
Figure 4. Structure of DE-YOLO network model.
Agriculture 15 00848 g004
Figure 5. Schematic diagram of Depthwise Separable Convolution.
Agriculture 15 00848 g005
Figure 6. Recognition performance of YOLOX and DE-YOLO test sets.
Agriculture 15 00848 g006
Figure 7. mAP results for YOLOX model.
Agriculture 15 00848 g007
Figure 8. mAP results for DE-YOLOX model.
Agriculture 15 00848 g008
Figure 9. PR curve of YOLOX model.
Agriculture 15 00848 g009
Figure 10. PR curve of DE-YOLOX model.
Agriculture 15 00848 g010
Figure 11. YOLOX-s model loss plot.
Agriculture 15 00848 g011
Figure 12. DE-YOLO model loss plot.
Agriculture 15 00848 g012
Table 1. Experimental results under different models.
ModelDSConvFocal LossECANetmAPParametersGFLOPS
YOLOX 94.65%9.0 M13.08
Model1 92.86%4.0 M6.53
Model2 95.14%4.2 M6.71
Model3 94.76%4.2 M6.88
Model4 97.42%9.0 M13.26
DE-YOLO97.55%4.6 M7.02
Table 2. Comparison of experimental results of models with different attention mechanisms added.
Serial NumberPrecision%Recall%mAP%F1-Score
Model294.0892.4695.140.94
Model2 + SENet95.7893.0396.890.95
Model2 + CBAM95.4294.2597.290.95
DE-YOLO96.6694.4697.550.96
Table 3. Comparison of detection results of different YOLO algorithm models for rice.
ModelPrecision%Recall%mAP%F1-ScoreParameters
YOLOv393.6892.3994.630.9462 M
YOLOv594.9493.5195.260.947.3 M
YOLOX94.0892.4694.650.949.0 M
DE-YOLO96.6694.4697.550.964.6 M
YOLOv896.8995.4198.260.9611.2 M
Faster R-CNN88.5286.9389.710.8841 M
Disclaimer/Publisher’s Note: The statements, opinions and data contained in all publications are solely those of the individual author(s) and contributor(s) and not of MDPI and/or the editor(s). MDPI and/or the editor(s) disclaim responsibility for any injury to people or property resulting from any ideas, methods, instructions or products referred to in the content.

