Abstract
With the aim of tuning the complexity of traditional image processing parameters, the automated extraction of spike phenotypes based on the fusion of YOLOv11 and image processing was proposed, with winter wheat in Lingcheng District, Dezhou City, Shandong Province as the research object. The keypoint detection of spikes was studied, and the integration of FocalModulation and TADDH modules improved the feature extraction ability, solved the problems of light interference and spike awn occlusion under the complex environment in the field, and the detection accuracy of the improved model reached 96.00%, and the mAP50 reached 98.70%, which were 6.6% and 2.8% higher than that of the original model, respectively. On this basis, this paper integrated morphological processing and a watershed algorithm, and innovatively constructed an integrated extraction method for spike length, spike width, and number of grains in the spike to realize the automated extraction of phenotypic parameters in the spike. The experimental results show that the extraction accuracy of spike length, spike width, and number of grains reached 98.08%, 96.21%, and 93.66%, respectively, which provides accurate data support for wheat yield prediction and genetic breeding research, and promotes the development of intelligent agricultural phenomic technology innovation.
1. Introduction
As one of the world’s three major grains, wheat is the main source of food for many countries and regions around the world. In China, wheat is the second largest grain crop, with a total planting area of approximately 23.07 million hectares in 2025 and a yield accounting for 19.80% of the total grain production, which is of great significance for ensuring global food supply. Therefore, as a global key food crop, wheat yield and quality directly affect food security and agricultural economic development [1,2]. The production capacity of a single wheat plant is the core system of wheat production capacity [3], and spike phenotypic parameters such as spike length, spike width, and number of grains in the spike are closely related to the production capacity of a single plant [4,5,6]. These parameters are not only the key indicators for evaluating the merit of wheat varieties, but also are important data that provide support for precision breeding and field management [7]. The scientific and accurate collection and analysis of wheat spike phenotypic traits helps to screen high-yielding and high-quality varieties, monitor crop growth differences in the field, provide data guarantee for building intelligent planting modes, and promote the development of the wheat industry in a more precise and efficient direction [8].
Crop phenotype acquisition mainly relies on traditional measurement and automated equipment. Traditional manual measurement has the problems of low efficiency and strong subjectivity, which make it difficult to meet the demand of modern agricultural refinement; although automated equipment can realize accurate and efficient measurement, it is difficult to be popularized on a large scale due to high cost and complex operation [9]. In recent years, the integration of traditional image processing algorithms and deep learning models has brought new opportunities for the automated measurement of crop traits [10]. However, in the field of wheat spike trait extraction, there is still a lack of effective and non-destructive detection technology, which urgently needs in-depth research and breakthroughs [11].
Deep learning technology has opened up a new path for intelligent crop phenotype recognition by virtue of its high accuracy and strong robustness [12]. Among them, the YOLO series of algorithms stands out for its real-time application and accuracy [13], and has great potential in the field of crop phenotyping, as it is able to accurately measure complex phenotypic information, such as leaf structure, fruit area, and growth cycle [14]. Many researchers have conducted research based on the YOLO algorithm and achieved fruitful results. In the red-ripe strawberry identification and fruit stalk detection, combining YOLOv8-Pose, the Slim-neck module, and CBAM attention mechanism module, the mAP-kp indexes reached 94.52%, 95.48%, and 94.63%, respectively [15]; in the maize tassel detection task, combining the YOLOv5 model with the CA bottleneck module, the average accuracy reached 96% [16]; for wheat seed detection counting, the YOLOv8 model had a detection segmentation accuracy of 0.993 [17]. These studies have fully proved the effectiveness of the YOLO algorithm in crop phenotyping, accelerated the transformation of crop phenotyping from traditional manual operation to an automated and intelligent mode, and provided strong technical support for agricultural research and production practice.
The wide application of image processing technology in the field of agriculture provides an important means for crop monitoring, especially in the direction of crop classification and segmentation, fruit ripeness grading, and so on, to harvest many results [18]. In the recognition of multiple phenotypic parameters of soybean seeds, multiple phenotypic trait parameters such as the number of soybean seeds, long axis length, short axis length, area, circumference, etc., were calculated based on the OpenCV image processing library, realizing the automatic acquisition of phenotypic parameters at low cost and high throughput [19]; when determining the thousand-kernel weight of rapeseed grains, the limit corrosion algorithm was combined with the distance transformation and other operations so that the relative measurement error of the three varieties did not exceed 3.16% [20]. In the field of wheat spike feature extraction, the morphological method realizes the automated extraction of indicators such as the number of awns, awn length, spike length, spike type, and so on [21,22]; fusing the image processing algorithm with the YOLOv7 deep learning algorithm, the accuracy of wheat seed counting can reach 99.16% [23]; extracting the number of grains in a wheat spike through image processing and a deep learning algorithm, the accuracy reaches 92.04% [24]. These studies break the bottleneck of traditional manual monitoring efficiency, quantitatively correlate image features with crop phenotypes, promote the transformation of agricultural decision-making from experience-driven to data-driven, and inject new kinetic energy into the development of smart agriculture.
Currently, wheat spike phenotypic feature extraction mostly relies on field sampling with lossy detection, and spike length extraction is often limited by the complex parameter adjustments of image processing algorithms. Therefore, this paper proposes an innovative method combining YOLOv11 with image processing. By integrating the FocalModulation and TADDH modules, it enhances YOLOv11’s detection of wheat spike key points. It combines adaptive threshold segmentation, the watershed algorithm, and connectivity domain analysis to build a framework for the automatic extraction of phenotypic parameters, which effectively overcomes the problems of large measurement error and poor robustness in complex scenes. This innovative method not only improves the accuracy and efficiency of wheat spike phenotype extraction, but also provides scientific and reliable technical support for wheat precision breeding and field management.
2. Materials and Methods
2.1. Study Area
The research area is located in the experimental field of Yidukou Town, Lingcheng District, Dezhou City, Shandong Province (116°44′45.784″ E, 37°26′51.684″ N), at an altitude of approximately 15 m, in the Huanghuaihai temperate monsoon climate zone. It has four distinct seasons, with an average annual temperature of 12.9 °C, 547.5 mm of precipitation, a frost-free period of 208 days, and favorable field conditions. Focusing on winter wheat multi-species cultivation, full-area data collection was conducted in 13 sampling areas, with systematic organic fertilizer application and variety comparison trials, Specifically, as shown in Figure 1, we provide detailed spatial data support for analyzing the growth differences of wheat under different treatments, and to ensure that the conclusions of the experiment are representative of the whole region.
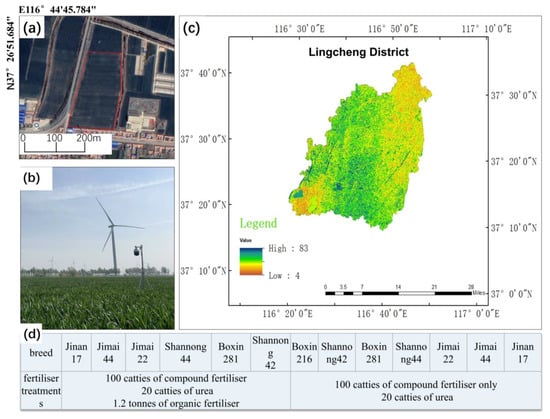
Figure 1.
Geographic location of the study area and planting distribution map. (a) Map of the study area; (b) map of equipment in the study area; (c) map of the location of the study area; (d) distribution of species and cultivation in the study area.
2.2. Dataset Construction
2.2.1. Data Acquisition
Individual wheat ears were studied and data was collected in the above-mentioned area. From 10 April to 20 May 2024, between 7:00 and 19:00 daily, image acquisition covered four key fertility stages: nodulation, tasseling, flowering, and grouting. To enrich data dimensions, different fertilization treatment and fertility stage combinations were set. A 1 cm2 grid background plate was used for dual-mode shooting: outdoor natural light (including sunny, cloudy, rainy weather) and indoor controlled-environment shooting. High-resolution images were taken with an iPhone 14 (12-megapixel dual rear camera) and a Nikon Z30 (20.9 megapixels). After cleaning and screening, a dataset of 885 wheat ear images was created. Some samples are shown in Figure 2, and variety distributions and quantities are detailed in Table 1, offering multi-dimensional data for wheat ear phenotype research.
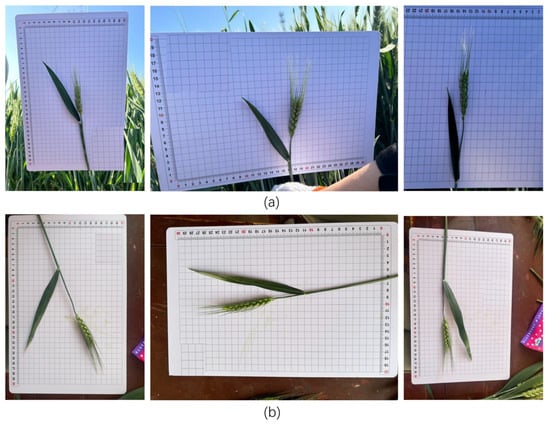
Figure 2.
Wheat spike partial dataset. (a) Lossless image; (b) lossy image.

Table 1.
Distribution of wheat varieties and number of collections.
2.2.2. Data Enhancement
In model training, to solve sample imbalance and boost generalization, multi-level data enhancement is employed. Geometrically, images are scaled to 800 × 800 pixels and augmented with horizontal/vertical flips (probability 0.5), ±30° rotations (probability 0.8), core cropping, and perspective transformations (probability 0.8). For color perturbations, HSV adjustment, Gamma correction, and Gaussian noise mimic real-world lighting. Additionally, Mosaic splicing, combined with Mixup (β = 0.8) and CutMix (λ = 0.7), improves scene adaptability. The results of data augmentation are shown in Figure 3. After enhancement, the training set expands to 2200 images, over twice the original size, reducing category imbalance. The dataset is then split into training, validation, and testing sets at a 7:2:1 ratio.
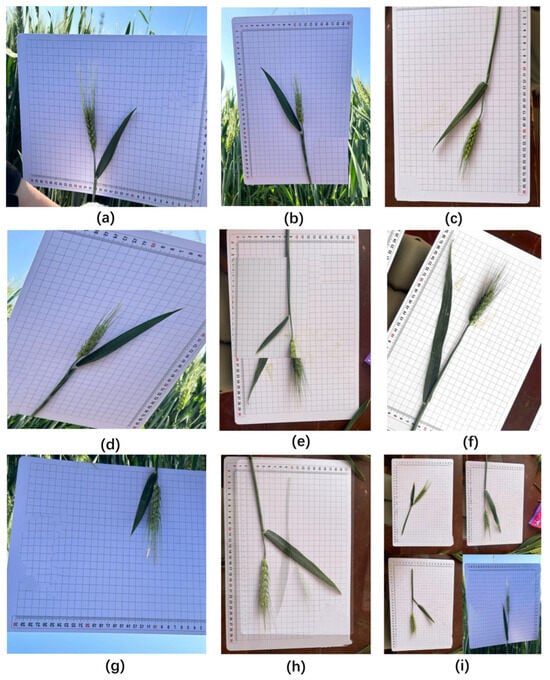
Figure 3.
Schematic diagram of each image enhancement effect. (a) random flip; (b) original image; (c) crop as you go; (d) perspective transformation; (e) cutmix enhancement; (f) HSV color desire transformation; (g) random rotation; (h) mixup enhancement; (i) mosaic enhancement.
2.3. Research Methodology
2.3.1. YOLOv11 Keypoint Detection Algorithm
Existing keypoint detection methods are mainly categorized into two types: top-down and bottom-up [25]. Top-down methods first detect all target bounding boxes in an image and then perform keypoint detection for each target within the box. Bottom-up methods detect all keypoints in the image first and then group them into different targets using clustering or association algorithms. Top-down is often used in accuracy-prioritized scenarios, while bottom-up is suitable for real-time multi-target detection [26].
YOLOv11-pose uses a top-down two-phase keypoint detection architecture, the “detection-keypoint localization” model, as shown in Figure 4. It has a lightweight backbone and a multi-branch header network, with five configurations (n, s, m, l, x). Its complexity can be adjusted via [depth, width, max_channels] parameters for different computing environments. The backbone integrates the C3F module and improved E-Conv structure, enhancing feature extraction by maintaining multi-scale aggregation during 3 × 3 convolutional down-sampling. The head network applies a hierarchical decoding strategy, optimizing multi-scale weights with the DFF mechanism. Integrated with the C3F module through up-sampling splicing, the Pose Head module outputs keypoint heatmaps and offsets for accurate localization.
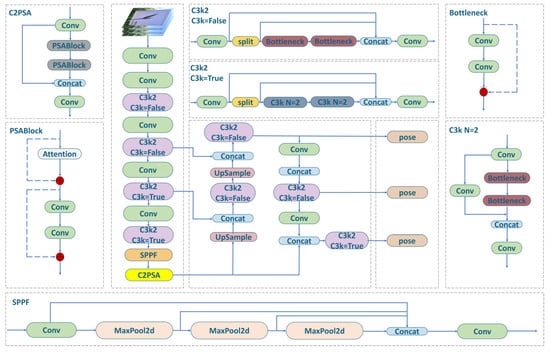
Figure 4.
YOLOv11-pose critical point detection network.
YOLOv11-pose adopts a multi-task co-optimization mechanism to achieve co-learning of target detection and pose estimation by introducing a multi-task loss function system. The total loss function consists of target detection loss (), key point position loss (), and key point confidence loss (), and Dynamic Loss Balancing (DLB) is introduced to automatically adjust the weights of each task according to the training phase, so as to enhance the model’s convergence stability and generalization ability.
The target detection loss combines the bounding box loss (), target confidence loss (), and classification loss (). DIoU (Distance-IoU) is adopted as the bounding box regression index to enhance target localization in complex scenes. Binary Cross Entropy (BCE) is used for confidence loss, and the Focal Loss mechanism is introduced for classification loss. By adjusting factor α and attenuation coefficient γ, it reduces the weight of easily classified samples to address category imbalance.
where b and are the prediction and true frames, respectively, and are the target confidence predictions and labels, is the predicted category probability, and and γ are the category imbalance moderators.
The key point location loss uses the more robust Smooth L1 Paradigm or Wing Loss, which introduces a visibility mask for edge or pose complex samples, and supervises only significantly visible key points to improve the model’s performance in occluded scenes. Keypoint Confidence Loss calculates the difference between predicted visibility and true visibility based on BCE to assess the consistency of the model in keypoint localization and confidence assessment. The final total loss function combines the three-part molecular task loss and achieves adaptive task balancing through a dynamic loss weighting module.
where K is the total number of keypoints; and are the coordinates of predicted and real keypoints; is the visibility label; and , , and are the task loss weights, which are dynamically adjusted according to the training progress or the task difficulty to improve the overall performance of the model.
2.3.2. Improving the YOLOv11 Network Model
Aiming at the problems of misdetection and insufficient detection accuracy of keypoints caused by light interference and occlusion in the field environment, the study builds a neural network model by integrating FocalModulation and TADDH (Task-aligned Dynamic Deformable Head) modules based on YOLOv11-pose. The FocalModulation module strengthens the model’s global perception and contextual modeling of key point features through the interactive modulation of space, channel, and task, and improves the ability of occluded region recognition; the TADDH module adds the Pose_TADDH detection head while guaranteeing the detection accuracy, realizing the independent modeling and spatial decoding of key point information, and enhancing the model’s ability to characterize complex structures and multi-scale targets. The dual modules work together to effectively improve the modeling level and anti-obstruction robustness of the model to the target structure information, improve the key point detection accuracy in complex scenes, and build a solid technical foundation for intelligent phenotyping of wheat, and the improved network structure is shown in Figure 5.
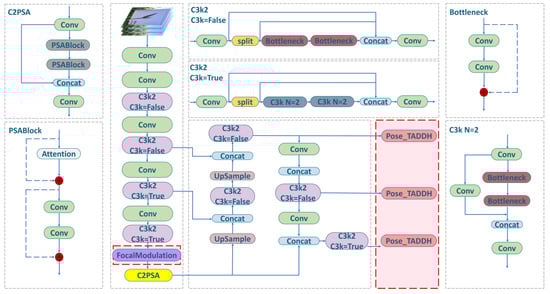
Figure 5.
Structure of the improved network model.
This paper introduces a focal modulation mechanism on high-level semantic feature maps and constructs a FocalModulation module to boost the model’s ability to model contextual information at various scales. The module combines the local fine-grained receptive field with global contextual attention for enhanced spatial perception and expression. It splits the input feature x into query (q), context (ctx), and gating vectors (gates) via 1 × 1 convolution. q and ctx have the same dimension, with gates controlling the focus layer’s output weight. Ctx undergoes depth-separable convolution for multi-scale aggregation, and its receptive field is adjusted by local_window and local_factor to balance local and remote information. Ctx_global is processed by global average pooling for long-range context. Context features are gated, weighted, and modulated with q channel-by-channel. To improve stability, the module offers normalization options and outputs optimized features via linear projection, as depicted in Figure 6.
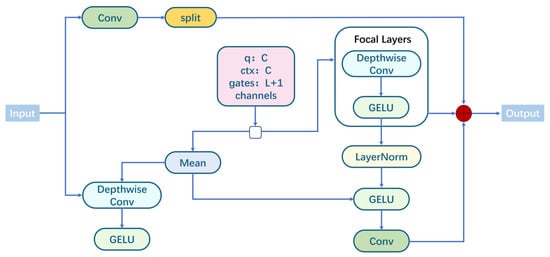
Figure 6.
Structure of FocalModulation module.
This paper innovatively introduces the concept of task dynamic alignment at the end of the YOLOv11 backbone network and designs the Pose_TADDH (Task-aligned Dynamic Deformable Head) keypoint detection module, as shown in Figure 7. Pose_TADDH consists of sub-modules like shared feature extraction, task decomposition, dynamic deformable convolution, and attention guidance. Lightweight GN-normalized convolution is used for feature extraction to obtain high-level semantic features. The Task Decomposition module decouples task features by separating keypoint regression and heatmap branches. The keypoint regression branch applies DyDCNv2 dynamic deformable convolution to capture wheat ear deformations through learning offset and weight alignment features. Moreover, the spatial attention mechanism generates a keypoint probability map, guiding heatmap regression to focus on key areas, thus enhancing localization accuracy and offering an effective solution for wheat ear keypoint detection.
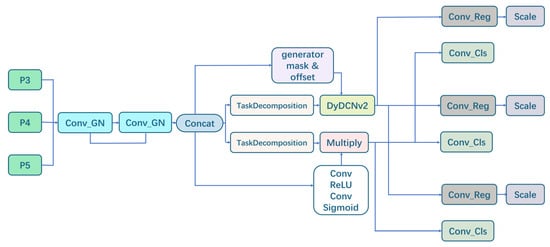
Figure 7.
Structure of TADDH module.
3. Model Training
3.1. Parameter Setting
The test platform for this study is based on a 64-bit operating system with Windows 11, RAM: 16.0 GB, Processor: 13th Gen Intel(R) Core(TM) i5-13500H, Display Adaptor: NVIDIA GeForce RTX 3050 6 GB Laptop GPU, Python version 3.8.0, Cuda 11.3, deep learning framework Pytorch 1.12.0, Ultralytics 8.3.40.
The Adam optimizer was chosen for the experiment and combined with a linear decay learning rate strategy to adapt to the wheat keypoint detection task. The initial learning rate is set to 0.0005 and the final learning rate is set to 0.01, with a total of 100 iterations. The warm-up phase is extended to 10 epochs to allow the model to gradually adapt to the training data, avoid initial oscillations, and promote stable convergence of the model. The weight decay is set to 0.0005 to effectively prevent overfitting. The momentum parameter is set to 0.937 to further accelerate the training process and improve the overall detection performance. The input image resolution is uniformly adjusted to 640×640 pixel size and the batch size is 8 during training.
3.2. Evaluation Indicator
To assess YOLOv11-pose’s performance in wheat keypoint detection, this paper employs target and keypoint detection metrics: Precision (P), Recall (R), and Mean Average Precision (mAP). These metrics evaluate the model’s detection capability, localization accuracy, and keypoint prediction accuracy from multiple aspects. Precision is the ratio of true positives among predicted positive samples, while recall is the ratio of correctly predicted samples among all true positives, with their formulas given below.
where TP is the True Positive case, FP is the False Positive case, and FN is the False Negative case.
The mAP is the average of the mean accuracies across all categories. In YOLOv11-pose for multi-category keypoint detection, mAP is a comprehensive metric reflecting the model’s average performance. It measures detection accuracy at different IoU thresholds. There are two main types: mAP@50, which calculates the average AP of all categories with an IoU threshold of 0.5; and mAP@50-95, which computes the AP at multiple IoU thresholds (from 0.5 to 0.95, incrementing by 0.05) and averages them. The calculation formulas are as follows.
Among them, AP is a measure of the average of the model’s accuracy at different recall levels. It combines accuracy and recall, and is a commonly used evaluation metric in target detection tasks; IoU (intersection and merger ratio) is a measure of the degree of overlap between predicted and real frames, and it is commonly used to evaluate the model’s prediction accuracy for object bounding boxes in YOLOv11-pose.
3.3. Analysis of Experimental Results
3.3.1. Training Results
For the target keypoint detection task, a deep neural network model is constructed and evaluated systematically using a hyperbolic analysis framework. Figure 8a shows that the keypoint similarity loss between the training and validation sets decreases during training and converges after about 50 epochs, demonstrating the model’s good fitting ability for wheat ear keypoints (spike apex and base). In Figure 8b, metrics like mAP@0.5, mAP@0.5:0.95, Precision, and Recall improve after 20 epochs, converge around 50 epochs, and the mAP approaches 0.95. This indicates the model performs well in keypoint detection, with high accuracy, robustness, and an ideal training effect without significant overfitting.
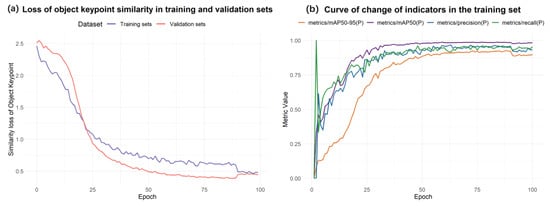
Figure 8.
Plot of experimental results of the improved model.
3.3.2. Analysis of Ablation Experiment Results
To verify the impact of different module designs on model performance, multiple sets of experiments were conducted, and the results are presented in Table 2. All models use the same dataset and training strategy, with evaluation based on the validation set. YOLOv11 shows balanced performance: Precision at 89.40%, Recall at 89.50%, mAP50 at 95.90%, mAP50-95 at 91.60%, and a detection time of 41.20 ms. Adding the FocalModulation module boosts Precision by 9.00% but reduces mAP50-95 by 2.30%. The TADDH module improves both metrics but increases detection time to 62.70 ms. However, fusing the two modules achieves higher precision: Precision reaches 96.00%, Recall 95.00%, mAP50 98.70%, mAP50-95 92.60%, and the model size is only 4.80M, indicating significant performance enhancement. Model comparison results are shown in Figure 9.
Table 2.
Results of ablation experiments with different improved strategies.
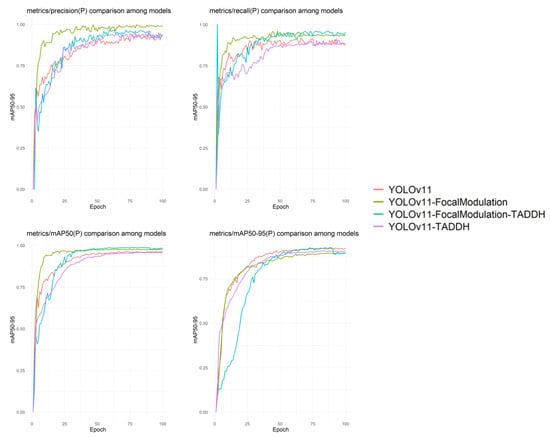
Figure 9.
Ablation experiment results chart.
3.3.3. Comparative Experimental Analysis of Different Models
In order to verify the superiority of the improved model for keypoint detection of wheat ears, YOLOv8, YOLOv9, Hourglass, and HRNet-W32 keypoint detection algorithms are selected for comparison experiments in this study. The quantitative indexes in Table 3 and the detection effect in Figure 10 show that the improved model shows good advantages in the core dimensions of keypoint detection accuracy, robustness, and inference efficiency, especially in the complex field scene; the processing accuracy of wheat ears overlapping, strong light, and other difficult problems have been improved, which verifies its in-depth optimization effect for the agricultural scene.
Table 3.
Comparison of experimental results from different models.
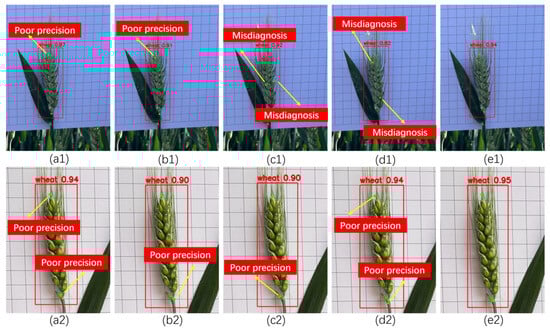
Figure 10.
Comparison of model detection effect. (a1) YOLOv8 detection effect under lossless conditions; (b1) YOLOv9 detection effect under lossless conditions; (c1) Hourglass detection effect under lossless conditions; (d1) HRNet-W32 detection effect under lossless conditions; (e1) YOLOv11 improved model detection effect under lossless conditions; (a2) YOLOv8 detection effect under deteriorated conditions; (b2) YOLOv9 detection effect under deteriorated conditions; (c2) Hourglass detection effect under deteriorated conditions; (d2) HRNet-W32 detection effect under deteriorated conditions; (e2) YOLOv11 improved model detection effect under deteriorated conditions.
4. Extraction of Spike Phenotype Parameters
Aiming at the problems of low efficiency and large error of the traditional manual measurement of spike phenotype, this paper explores integrating YOLOv11 keypoint detection with image processing to create an automated extraction system. The system preprocesses field wheat spike images using aberration correction and perspective transformation, then applies the YOLOv11 model for precise spike positioning and instance segmentation. Leveraging morphological features and deep learning, it automatically extracts and analyzes phenotypic parameters like spike length, width, and grain number, enhancing measurement efficiency and accuracy. The overall workflow is illustrated in Figure 11.
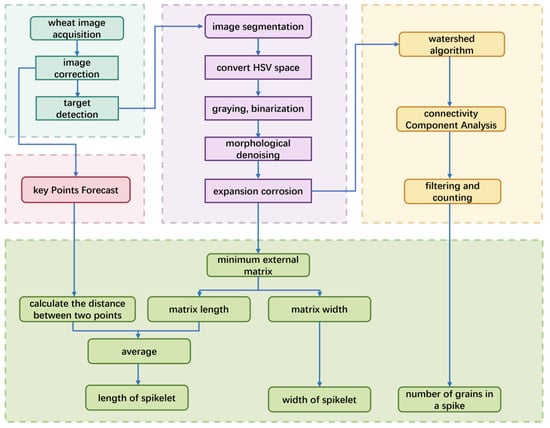
Figure 11.
Overall flowchart of spike phenotypic parameter extraction.
4.1. Image Processing
- (1)
- Image correction
Aiming at the problem of decreased accuracy of phenotype extraction caused by image tilting and distortion, a two-stage correction scheme is studied. In the first stage, Hough straight line detection is used for coarse correction, the image is grayed out and then the edges are extracted using the Canny algorithm, the straight lines are detected in polar coordinate space with an angular resolution of 1°, and a 200-accumulation threshold is set to screen the effective straight lines. The median angle of the detected straight line is calculated to determine the main direction deviation θ′, and the rotation matrix M is constructed to implement the affine transformation to effectively reduce the global rotation error. The matrix M is formulated as:
For complex samples with a tilt of more than 15°, the second stage implements perspective transformation optimization. Quadrilateral targets with more than 15% of the area are screened by contour detection, and the corrected rectangle is defined after sorting the largest contour vertices. An iterative parameter tuning strategy is used, with initial projection to 120% of the original map size, and dynamic optimization of Canny threshold (±20%) and contour approximation accuracy (0.01–0.05 times the perimeter) when the corrected angular deviation is >5° until the standard deviation in the linear direction is <2°. Through the synergistic correction of affine-perspective, this scheme can control the error in the main axis direction of the image within ±1.5° while maintaining the original aspect ratio, which improves the stability and accuracy of phenotypic feature extraction. The corrected image is shown in Figure 12.
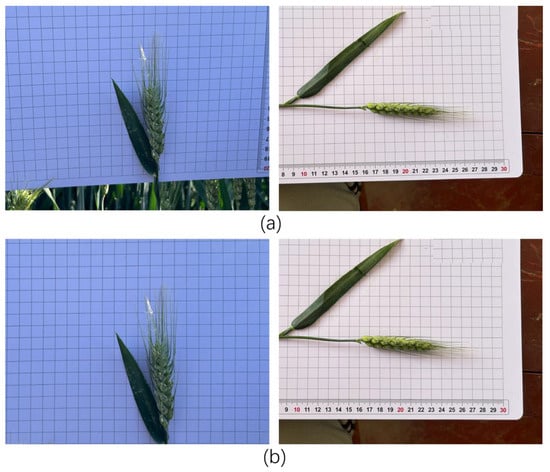
Figure 12.
Corrected images. (a) Pre-corrected image; (b) post-corrected image.
- (2)
- Color Space Conversion
The HSV (Hue, Saturation, Value) color space conversion technique is studied to improve the segmentation effect of wheat ears area. Compared to RGB space, HSV expresses color information more stably through three channels of hue, saturation, and luminance. The image is converted from BGR to HSV space, channel separation is performed, and the hue (H), saturation (S), and luminance (V) channels are extracted, respectively:
Among them, the saturation channel S and the luminance channel V can be used to enhance the contrast between the wheat ears and the background. The color space converted image is shown in Figure 13.
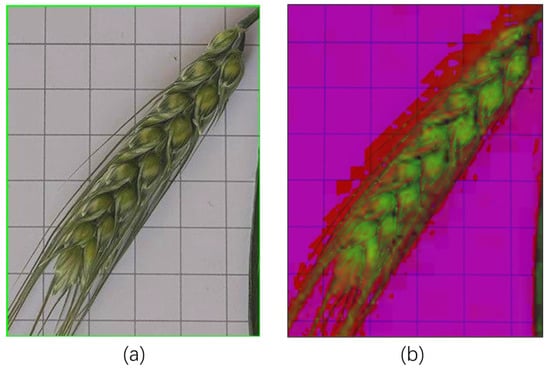
Figure 13.
Images after color space conversion. (a) Wheat segmentation image; (b) HSV image.
- (3)
- Morphological operation
Research on morphological operation methods seeks to improve the image processing effect. The RGB image is converted into a grayscale image, and the main brightness information is retained by weighted averaging to reduce the computational dimension; adaptive threshold segmentation is utilized for binarization, and the threshold is dynamically adjusted to cope with changes in illumination to achieve effective separation of the target from the background; the morphological open operation corrodes and then expands the image to eliminate small noise points and maintain the integrity of the target area; and the final expansion and corrosion combination operation is performed to accurately adjust the target. Finally, the combined operation of expansion and corrosion is performed to precisely adjust the target boundary morphology and improve the accuracy of subsequent analysis. The image after morphological operation is shown in Figure 14.
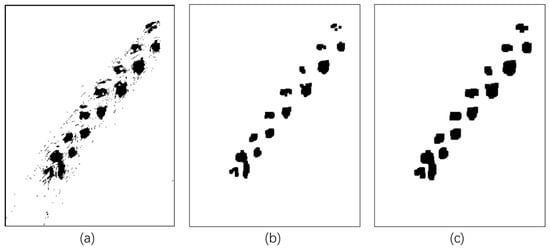
Figure 14.
Images after morphological manipulation. (a) Grayed-out binarized image; (b) morphological denoised image; (c) morphological swollen corrosion image.
4.2. Extraction of Phenotypic Parameters
4.2.1. Extraction of Spike Length and Width
To study the wheat ear size measurement method, we combine the Minimum Bounding Rectangle (MBR) and keypoint detection. Through image preprocessing, morphological operations are applied to remove noise; the cv2.findContours method is used to extract binarized image contours, and the largest contour is selected to calculate its Minimum Bounding Rectangle (MBR), and the pixel dimensions are converted to actual physical units (cm). The spike width was taken as the MBR width, and the spike length was averaged with the MBR length by innovatively integrating the YOLOv11 keypoint detection method to calculate the distance between the spike tip and the spike base. The formula for spike length and spike width were, respectively:
where SL is spike length; SW is spike width; dis is the distance between two keypoints; Ml is matrix length; and Mw is matrix width. In addition, the pixel-to-centimeter conversion is calibrated using a 1 cm2 grid reference to enhance the measurement accuracy. The method synthesizes image processing and deep learning techniques to effectively improve the accuracy of wheat ear size measurement. The extraction process image is shown in Figure 15.
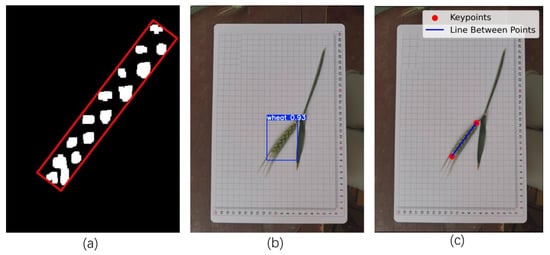
Figure 15.
Spike length and width extracted image. (a) Minimum outer join matrix; (b) key point detection; (c) distance calculation between two points.
4.2.2. Grain Number Extraction
The extraction method of spike number based on the watershed algorithm and connected component analysis is studied. The foreground markers are corrected, and unknown regions are defined by morphological operations, the watershed algorithm is used to simulate the process of water inundation to realize image segmentation, and the watershed boundary is marked in red; the segmentation result is converted into a binary image, and the target boundary is smoothed by morphological repair. We perform connectivity component analysis on the binary image to identify all white areas, set the area threshold to filter the noise, and retain the effective spikelets. The eligible regions are numbered and the minimum outer join matrix is plotted. The spike grain number extraction image is shown in Figure 16 with the formula:
where NS is the number of grains in the spike; num is the number of regions recognized.
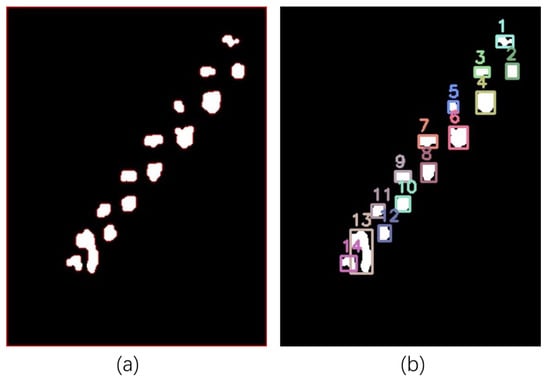
Figure 16.
Spike grain number extraction images. (a) Watershed segmentation image; (b) connected region analysis image: this number indicates the number of grains on one side of the ear.
4.3. Experimental Results and Error Analysis
In order to verify the validity of the measurement of wheat spike length, spike width, and number of grains in this experiment, the results of the experimental calculations were compared and analyzed with the manually measured values. The results show that the measured values are more in line with the real values, but there are some errors, which mainly stem from the limitations of the prediction process and image processing of the wheat spike base and apex, such as noise interference leading to prediction bias. For further quantitative analysis, 50 wheat ears were selected to compare the experimental and manual measurements of spike length, spike width, and number of grains, and the absolute and relative errors of 10 groups of samples were listed, and the detailed data are shown in Table 4, Table 5 and Table 6.
Table 4.
Spike length actual length vs. measured length.
Table 5.
Spike width actual length vs. measured length.
Table 6.
Comparison of the actual number of grains in a spike and the measured number of grains.
Analyzing Table 4, Table 5 and Table 6, it can be seen that there are errors between the measured values and the actual values due to the limitations of the shooting equipment, experimental environment, and image processing technology. In spike length measurement, the average absolute errors of the minimum outer connection matrix method, key point positioning method, and mean value combination method were 0.193 cm, 0.149 cm, and 0.144 cm, respectively, corresponding to the average relative errors of 2.595%, 2.013%, and 1.920%, which indicated that the combination of the measurement methods could improve the accuracy. The average absolute error of spike width measurement was 0.047 cm, and the relative error was 3.794%, which indicated that the measurement stability was good. However, the absolute error of spike grain number measurement reaches 1.929 and the relative error is 6.338%, reflecting the difficulty of seed recognition in complex scenes. The experiment proves that the fusion of multiple methods can optimize the measurement of spike length, and the measurement accuracy of spike width and number of grains still needs further research to improve.
In this study, regression analysis and error analysis were used to systematically assess the precision of spike length, spike width, and spike grain number measurements in 25 groups of wheat samples. The results showed that spike length measurements were highly linearly correlated with the actual values (R = 0.92, R2 = 0.85), and the regression equation y = 0.8938x + 0.77 showed that the measurements explained about 89% of the variance in the true values, and the systematic error was 0.77 units, with a homogeneous distribution of errors, which verified the stability of the measurement methods. The spike width measurement was equally reliable (R = 0.91, R2 = 0.83), and the regression equation y = 0.9749x + 0.06 indicated that the measurement bias was extremely small, but the error of individual samples exceeded the limit, which requires optimization of the measurement environment and image processing process. In contrast, the measurement accuracy of spike number was lower (R = 0.54, R2 = 0.3), and the regression equation y = 0.3976x + 18.37 showed that the measured values could only explain 30% of the true value variation, with discrete errors, and the absolute errors of some samples exceeded 50%, which could be attributed to uneven light, spike shading, and the algorithm’s insufficient recognition of overlapping seeds. Specific results are shown in Figure 17.
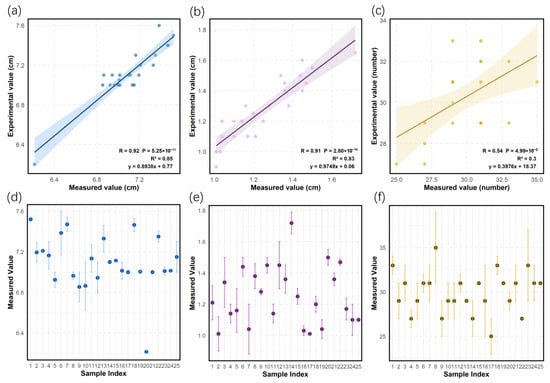
Figure 17.
Result analysis plots. (a) Spike length regression analysis; (b) spike width regression analysis; (c) spike grain number regression analysis; (d) spike length error analysis; (e) spike width error analysis; (f) spike grain number error analysis.
In previous studies, the average relative error range for spike length measurements was 3% to 4% [3,21]. In this study, a combined measurement method was used to control the error to 1.920%, fully demonstrating the advantages of the fusion strategy in practical applications. For peak width measurement, the same image processing method was used, and the error was consistent with the results of previous studies [3], further validating the feasibility of this method. However, in terms of peak particle counting measurement, the error of the deep learning method was lower than that of the method studied in this paper [24,27]. Therefore, the current peak particle counting extraction method still needs further optimization in terms of algorithm robustness and image preprocessing.
5. Conclusions
Based on YOLOv11 and image processing technology, a wheat spike phenotype detection method is proposed, and the main conclusions are as follows.
Based on the YOLOv11-pose network model, the FocalModulation and TADDH modules are integrated to effectively improve the model performance; the FocalModulation module dynamically adjusts the attention distribution and enhances the expression of middle- and low-level features with the help of multi-level convolution and learnable gating mechanisms; the Pose_TADDH module integrates the dynamic convolution and spatial alignment mechanism at the end of the trunk to efficiently model the key point prediction task. The improved algorithm Precision reaches 96.00%, which is 6.6% higher than the original model; Recall reaches 95.00%, which is 5.5% higher; mAP50 and mAP50-95 reach 98.70% and 92.60%, respectively, which are 2.8% and 1.00% higher than the original model.
The study selected YOLOv8, YOLOv9, Hourglass, and HRNet-W32 algorithms for comparison experiments, and the improved algorithms improved the detection effect under both natural environment and lossy shooting conditions.
The improved model can detect wheat spike base and apex keypoints, and combined with image processing, it enables stable spike length measurement. However, due to image quality and algorithm limitations, spike width measurement errors exceed the standard for some samples. Moreover, spike number detection accuracy is insufficient because of spike occlusion, overlap, and image processing constraints. To enhance the robustness of phenotypic parameter extraction, in-depth research on image resolution, complex scene adaptability, and multimodal data fusion is required.
Author Contributions
X.L., J.W. and L.L. collected data on wheat spike phenotypes in a field; X.L. and Z.Z. analyzed the data; X.L. and P.L. wrote the paper; X.L. and J.W. drew pictures for this paper; X.L., Z.Z., L.L. and P.L. reviewed and edited this paper. All authors have read and agreed to the published version of the manuscript.
Funding
This research received no external funding.
Institutional Review Board Statement
Not applicable.
Data Availability Statement
The data in this study are available upon request from the authors and corresponding authors. The data in this study is not available in its original form due to laboratory policies and confidentiality agreements.
Acknowledgments
The authors would like to thank all the reviewers who participated in the review.
Conflicts of Interest
The authors declare no conflicts of interest.
References
- Hickey, L.T.; Hafeez, A.N.; Robinson, H.; Jackson, S.A.; Leal-Bertioli, S.C.M.; Tester, M.; Gao, C.; Godwin, I.D.; Hayes, B.J.; Wulff, B.B.H. Breeding crops to feed 10 billion. Nat. Biotechnol. 2019, 37, 744–754. [Google Scholar] [CrossRef]
- Xing, X.; Liu, C.; Han, J.; Feng, Q.; Lu, Q.; Feng, Y. Wheat-Seed Variety Recognition Based on the GC_DRNet Model. Agriculture 2023, 13, 2056. [Google Scholar] [CrossRef]
- Lu, W.; Luo, B.; Pan, D.; Zhao, Y.; Yu, C.; Wang, C. Synchronous measurement of wheat ear length and spikelets number based on image processing. J. Chin. Agric. Mech. 2016, 37, 210–215. [Google Scholar]
- Du, S.; Li, Y.; Yao, M.; Li, L.; Ding, Q.; He, R. Counting method of grain number based on wheatear spikelet image segmentation. J. Nanjing Agric. Univ. 2018, 41, 742–751. [Google Scholar]
- Li, T.; Deng, G.; Su, Y.; Yang, Z.; Tang, Y.; Wang, J.; Qiu, X.; Pu, X.; Li, J.; Liu, Z.; et al. Identification and validation of two major QTLs for spike compactness and length in bread wheat (Triticum aestivum L.) showing pleiotropic effects on yield-related traits. Theor. Appl. Genet. 2021, 134, 3625–3641. [Google Scholar] [CrossRef] [PubMed]
- Sanchez-Bragado, R.; Vicente, R.; Molero, G.; Serret, M.D.; Maydupe, M.L.; Araus, J.L. New avenues for increasing yield and stability in C3 cereals: Exploring ear photosynthesis. Curr. Opin. Plant Biol. 2020, 56, 223–234. [Google Scholar] [CrossRef]
- Mansoor, S.; Karunathilake, E.M.; Tuan, T.T.; Chung, Y.S. Genomics, phenomics, and machine learning in transforming plant research: Advancements and challenges. Hortic. Plant J. 2025, 11, 486–503. [Google Scholar] [CrossRef]
- Xu, X.; Li, X.J.; Zhang, D.H.; Zhao, J.S.; Jiang, X.L.; Sun, H.L.; Ru, Z.G. Identification and validation of QTLs for kernel number per spike and spike length in two founder genotypes of wheat. BMC Plant Biol. 2022, 22, 146. [Google Scholar] [CrossRef]
- Li, J.; Qi, X.; Nabaei, S.H.; Liu, M.; Chen, D.; Zhang, X.; Yin, X.; Li, Z. A Survey on 3D Reconstruction Techniques in Plant Phenotyping: From Classical Methods to Neural Radiance Fields (NeRF), 3D Gaussian Splatting (3DGS), and Beyond. arXiv 2025, arXiv:2505.00737. [Google Scholar]
- Gao, Y.; Gao, L.; Li, X. A Generative Adversarial Network Based Deep Learning Method for Low-Quality Defect Image Reconstruction and Recognition. IEEE Trans. Ind. Inform. 2021, 17, 3231–3240. [Google Scholar] [CrossRef]
- Liu, Z.; Jin, S.; Liu, X.; Yang, Q.; Li, Q.; Zang, J.; Li, Z.; Hu, T.; Guo, Z.; Wu, J.; et al. Extraction of Wheat Spike Phenotypes From Field-Collected Lidar Data and Exploration of Their Relationships With Wheat Yield. IEEE Trans. Geosci. Remote Sens. 2023, 61, 4410813. [Google Scholar] [CrossRef]
- Murphy, K.M.; Ludwig, E.; Gutierrez, J.; Gehan, M.A. Deep Learning in Image-Based Plant Phenotyping. Annu. Rev. Plant Biol. 2024, 75, 771–795. [Google Scholar] [CrossRef] [PubMed]
- Zhao, Z.Q.; Zheng, P.; Xu, S.T.; Wu, X.D. Object Detection with Deep Learning: A Review. IEEE Trans. Neural Netw. Learn. Syst. 2019, 30, 3212–3232. [Google Scholar] [CrossRef]
- Zhai, Z.; Zhang, Z.; Xu, H. Review of applying YOLO family algorithms to analyze animal and plant phenotype. Trans. Chin. Soc. Agric. Mach. 2024, 55, 1. [Google Scholar]
- Liu, M.; Chu, Z.; Cui, M.; Yang, Q.; Wang, J.; Yang, H. Red Ripe Strawberry Recognition and Stem Detection Based on Improved YOLO v8—Pose. Trans. Chin. Soc. Agric. Mach. 2023, 54, 244–251. [Google Scholar]
- Jia, Y.; Fu, K.; Lan, H.; Wang, X.; Su, Z. Maize tassel detection with CA-YOLO for UAV images in complex field environments. Comput. Electron. Agric. 2024, 217, 108562. [Google Scholar] [CrossRef]
- Ma, N.; Su, Y.; Yang, L.; Li, Z.; Yan, H. Wheat Seed Detection and Counting Method Based on Improved YOLOv8 Model. Sensors 2024, 24, 1654. [Google Scholar] [CrossRef]
- Zheng, X.; Yang, F.; Li, F. Overview of crop image segmentation algorithm. Mod. Comput. 2020, 19, 72–75. [Google Scholar]
- Song, C.; Yu, C.; Xing, Y.; Li, S.; He, H.; Yu, H.; Feng, X. Algorith for acquiring multi-phenotype parameters of soybean seed based on OpenCV. Trans. Chin. Soc. Agric. Eng. 2022, 38, 156–163. [Google Scholar]
- Yao, Y.-H.; Li, Y.-N.; Zou, W.; Liu, Y.-Y.; He, R.-Y. Determination method on thousand-seed weight of rapeseed based on image processing. Chin. J. Oil Crop Sci. 2022, 44, 201–210. [Google Scholar]
- Bi, K.; Jiang, P.; Li, L.; Shi, B.; Wang, C. Non-destructive measurement of wheat spike characteristics based on morphological image processing. Trans. Chin. Soc. Agric. Eng. 2010, 26, 212–216. [Google Scholar]
- Jiang, P.; Zhang, B.; Bi, K. Wheat ear-length measurements based on image processing. J. Commun. Univ. China 2010, 4, 69–73. [Google Scholar]
- Wang, L.; Zhang, Q.; Feng, T.C.; Wang, Y.B.; Li, Y.T.; Chen, D. Wheat grain counting method based on YOLO v7-ST model. Nongye Jixie Xuebao/Trans. Chin. Soc. Agric. Mach. 2023, 54, 188–197+204. [Google Scholar]
- Geng, Q.; Zhang, H.; Gao, M.; Qiao, H.; Xu, X.; Ma, X. A rapid, low-cost wheat spike grain segmentation and counting system based on deep learning and image processing. Eur. J. Agron. 2024, 156, 127158. [Google Scholar] [CrossRef]
- Zheng, C.; Wu, W.; Chen, C.; Yang, T.; Zhu, S.; Shen, J.; Kehtarnavaz, N.; Shah, M. Deep Learning-based Human Pose Estimation: A Survey. ACM Comput. Surv. 2024, 56, 11. [Google Scholar] [CrossRef]
- Cheng, B.; Xiao, B.; Wang, J.; Shi, H.; Huang, T.S.; Zhang, L. Higherhrnet: Scale-aware representation learning for bottom-up human pose estimation. In Proceedings of the IEEE/CVF Conference on Computer Vision and Pattern Recognition, Seattle, WA, USA, 13–19 June 2020; pp. 5385–5394. [Google Scholar]
- Liu, Z.; Yuag, D.-G.; Wang, E. Automatic counting method of wheat grain based on improved bayes matting algorithm. J. Agric. Sci. Technol. 2020, 22, 75–82. [Google Scholar]


Disclaimer/Publisher’s Note: The statements, opinions and data contained in all publications are solely those of the individual author(s) and contributor(s) and not of MDPI and/or the editor(s). MDPI and/or the editor(s) disclaim responsibility for any injury to people or property resulting from any ideas, methods, instructions or products referred to in the content. |
© 2025 by the authors. Licensee MDPI, Basel, Switzerland. This article is an open access article distributed under the terms and conditions of the Creative Commons Attribution (CC BY) license (https://creativecommons.org/licenses/by/4.0/).