Abstract
The pore structure of cocopeat-based substrates critically influences their hydraulic properties, directly affecting water use efficiency in soilless cultivation systems. Previous macroscopic modeling approaches infer pore structures indirectly from water retention curves and rely on empirical parameterization of pore geometry and connectivity, overlooking microscale features that directly control fluid pathways and permeability. To address this gap, this study employed micro-CT imaging to reconstruct the three-dimensional pore structures of coarse cocopeat and a fine cocopeat–perlite mixture. Nine regions of interest (ROIs), representing three typical pore types in each substrate, were selected for quantitative pore structure analysis and pore-scale saturated flow simulations. Results show that over 90% of pore diameters in both substrates fall within the 0–400 μm range, and variations in cocopeat particle size and perlite addition significantly affect average pore diameter, porosity, fractal dimension, and tortuosity, thereby influencing permeability and local flow distribution. This study provides new insights into the microscale mechanisms governing water movement in cocopeat-based substrates and reveals key structural factors regulating hydraulic behavior in soilless cultivation systems.
1. Introduction
Soilless cultivation refers to the production technique in which crops are grown either in substrates—such as cocopeat, perlite, peat, and rockwool—or entirely in nutrient solution [1]. As an effective approach to enhancing crop yield potential and quality, soilless cultivation has seen a rapid expansion globally in recent years [2,3]. Between 2001 and 2011, the global area under soilless systems increased by an average of 3% annually [4]. In countries such as the Netherlands and Belgium, soilless cultivation can account for up to 95% of total greenhouse production [5]. Compared to solution-only hydroponic systems, substrate-based soilless cultivation offers advantages under certain conditions, as solid substrates can buffer water and nutrient stress more effectively [6]. Among available substrates, cocopeat has become one of the most popular choices worldwide due to its low cost and renewability [7,8,9,10]. Unlike peat, which is non-renewable and environmentally burdensome, cocopeat presents a more sustainable alternative [11,12]. Additionally, cocopeat poses no health risks to humans and requires less energy to process than rockwool [13,14].
Because the water retention and flow characteristics of substrates directly affect irrigation efficiency, increasing attention has been paid to modeling the hydraulic behavior of soilless media such as cocopeat [5]. Liu et al. [15] used simulation models to study the infiltration and distribution of water under drip irrigation in vinegar residue and its mixtures with peat. Deepagoda et al. [16] extended the concepts of water index (WI) and energy index (EI) to substrates such as cocopeat and perlite to evaluate their capacity to regulate the root-zone environment and characterize aeration properties. Gohardoust et al. [17] used the parallelized ParSWMS framework to solve the 3D Richards and advection–diffusion equations, simulating water and nutrient transport in perlite–tuff–cocopeat mixtures. However, while these macroscopic studies have revealed the dynamic behavior of water or nutrient solutions in soilless substrates, the pore structure inferred from water retention curves remains indirect, with pore geometry and connectivity largely parameterized empirically. This approach overlooks the critical role of microscale pore features [18]. Since these microstructural attributes directly control fluid pathways and permeability, it is necessary to investigate the pore-scale structure in detail, thereby gaining greater confidence in applying macroscopic approaches for modeling [19].
Similar to soil, cocopeat and other soilless media are porous materials whose irregular internal pore networks serve as both storage reservoirs and flow pathways for water, thus exerting a strong influence on fluid and solute transport [20]. Micro-computed tomography (Micro-CT) has become a powerful tool for analyzing pore structures, enabling researchers to quantify pore characteristics in various materials such as soil [21,22], sandstone [23,24], coal [25,26], and coarse-grained media [27,28]. Using numerical simulations, researchers have made significant advances in understanding microscale flow processes. Bird et al. [29] demonstrated how rock CT images can be imported into COMSOL to simulate current and fluid flow, suggesting that this process is generalizable and applicable to multidisciplinary studies. Gharedaghloo et al. [30] were the first to construct an unstructured pore network model (PNM) from μCT images of peat soil. They developed original simulation codes to model water and solute transport through the network, providing insights into how hydraulic conductivity responds to pore structural parameters. Ji et al. [31] visualized single-phase flow in biocemented sand using numerical simulations, revealing how increasing cementation alters pore pressure, velocity, and flow paths. These pore-scale studies have greatly enhanced our understanding of how microstructures influence macroscopic hydraulic behavior.
In soilless systems, irrigation and fertigation are often performed simultaneously, and all nutrients are delivered to plants via nutrient solution [2]. However, because the soilless substrate itself is strongly heterogeneous like soil [32], and their pore structures are affected by plant roots [33], cultivation practices [34], and variations in particle size or shape [35]. This heterogeneity can result in significant variations in pore structure across spatial scales from micrometers to millimeters [36,37]. The internal pore structure of a substrate is determined by the spatial arrangement of its pores of varying sizes. Moreover, structural parameters such as fractal dimension (FD) and tortuosity (τ) are influenced by both pore size distribution (PSD) and the topology of the pore network. Different pore types and size classes contribute differently to permeability [31,38], ultimately impacting fluid transport through the medium [39,40]. Additionally, the pore architecture also affects flow paths and velocity distributions; in particular, preferential flow zones may accelerate nutrient leaching from the root zone [41,42].
In this study, coarse cocopeat and a fine cocopeat–perlite mixture, both widely used under greenhouse conditions, were selected as the experimental substrates. Micro-CT scanning and three-dimensional reconstruction were employed to quantitatively characterize their pore structures and to assess the impact of perlite particles on pore architecture and connectivity. In addition, pore-scale saturated single-phase flow simulations were performed on representative regions of interest to analyze velocity distributions and to elucidate the regulatory role of pore structural heterogeneity in fluid transport. Accordingly, the objectives of this study are (1) to characterize the pore structures of coarse cocopeat and fine cocopeat–perlite substrates using micro-CT; (2) investigate the influence of pore structural parameters on fluid flow behavior; and (3) elucidate the relationship between microstructural variations and the hydraulic performance of soilless substrates.
2. Materials and Methods
2.1. Sample Preparation
The cocopeat-based soilless substrate samples used in this study were collected from a commercial blueberry greenhouse located at the experimental base of Yunnan Agricultural University, Kunming, Yunnan Province, China (25°07′59.3″ N, 102°45′27.8″ E). The greenhouse operated under a closed drip irrigation system for fertigation management. Although many suppliers recommend a cocopeat particle size between 0.5 and 1 mm, certain crops may require customized hydraulic or chemical properties, which can be achieved either by manually sieving to obtain different particle sizes or by incorporating unmodified natural materials or synthetic substances [43,44].
Additionally, it is common practice to mix larger-particle perlite into fine-textured cocopeat to improve aeration. Perlite can be reused after sterilization, making it a promising amendment for growing media [6,45]. Based on these practices, two representative types of cocopeat-based substrates were selected for investigation: (1) coarse cocopeat and (2) a mixed substrate composed of fine cocopeat and soft perlite at a 1:1 volumetric ratio. All substrate materials were commercially sourced from local horticultural suppliers, who processed them based on actual production requirements. For the coarse cocopeat, particles were manually sieved to retain only the fraction with sizes between 2–4 mm, with fines (<2 mm) and long fibers removed. In the mixed substrate, the fine cocopeat ranged from 0.5 to 1.5 mm, while the perlite particles ranged from 3 to 4 mm in diameter.
To minimize structural disturbance and ensure measurement repeatability, samples were irrigated to saturation and collected immediately once drainage had ceased, indicating that the substrate water content had stabilized close to field capacity [34]. At this point, the volumetric water content in the pots was measured using a portable W.E.T-2 sensor (Delta-T Devices, Burwell, UK), which yielded values of 53.14% for coarse cocopeat and 50.02% for the cocopeat–perlite mixture. Additional bulk samples of each substrate were used to determine the bulk density at the measured water content. The bulk density was measured by filling a known-volume cylinder (diameter 5 cm × height 5 cm) with substrate and weighing it, resulting in approximately 0.18 g cm−3 for coarse cocopeat and 0.21 g cm−3 for the fine cocopeat–perlite mixture. Intact cores were then extracted using hollow acrylic cylinders (2.5 cm in diameter and 3.5 cm in height), with three replicates taken from each substrate type, resulting in a total of six undisturbed cores. The collected cores were subsequently transported to the laboratory for micro-CT scanning. To preserve pore structure during transportation, the cores were wrapped in plastic film and cushioned with packing material to prevent deformation [39].
2.2. Experimental Methods
2.2.1. CT Scanning
High-resolution micro-computed tomography (micro-CT) imaging was performed using a nanoVoxel-2000 scanner (Sanying Precision Instruments Co., Ltd., Tianjin, China) to visualize the internal pore structures of the two substrate types. Six cylindrical samples were scanned sequentially, each placed vertically on the rotating stage of the CT system. The scanning parameters were as follows: acceleration voltage of 130 kV, current of 100 μA, and exposure time of 0.9 s. The spatial resolution was set to 12.77 μm, and a total of 2400 cross-sectional images were acquired in the X-Y direction and 3000 in the Z direction.
2.2.2. Image Processing and Pore Structure Reconstruction
To reduce noise interference and improve the accuracy of pore structure quantification, the CT images of cocopeat samples were processed using Avizo 2020 (Thermo Fisher Scientific, Waltham, MA, USA). After comparing three common methods (median filtering, Gaussian filtering and mean filtering), Gaussian filtering was chosen as the optimal preprocessing means, which can effectively denoise and retain the pore boundary details [38,46]. The three-dimensional pore structure of the matrix was subsequently reconstructed using an interactive threshold segmentation method to distinguish the pores from the solid matrix. A representative reconstruction is shown in Figure 1a.
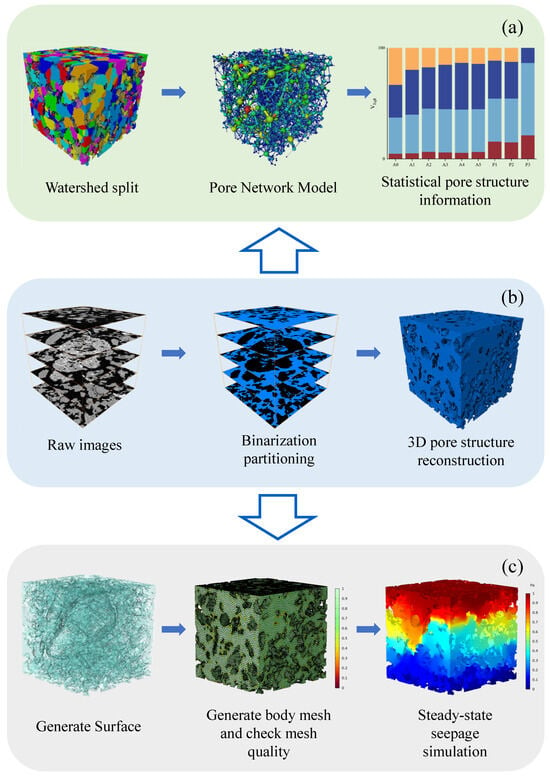
Figure 1.
Experimental flowchart: (a) PNM construction and Pore structure information statistics; (b) Image processing and 3D pore reconstruction; (c) File format conversion and Pore structure flow simulation.
Given the computational cost of numerical simulations, it was necessary to define a representative elementary volume (REV) for each substrate type [40]. By progressively extracting increasingly larger cubic regions and analyzing the corresponding porosity trends, the minimum representative elementary volume (REV) was determined as the point at which the porosity stabilized [25]. The porosity was calculated using the Volume Fraction module in Avizo, following the equation:
where Pori is the connected porosity of the ith sample, Vip is the voxel count of the connected pore space, and Vi is the total voxel count of the solid matrix.
For the coarse cocopeat samples, porosity stabilized when the cube size exceeded 350 × 350 × 350 voxels (approximately 4.5 × 4.5 × 4.5 mm), which was adopted as the REV dimension. As shown in Figure 2. A region of interest (ROI) was extracted from the center of each of the three coarse cocopeat samples, noted as CC1–CC3.
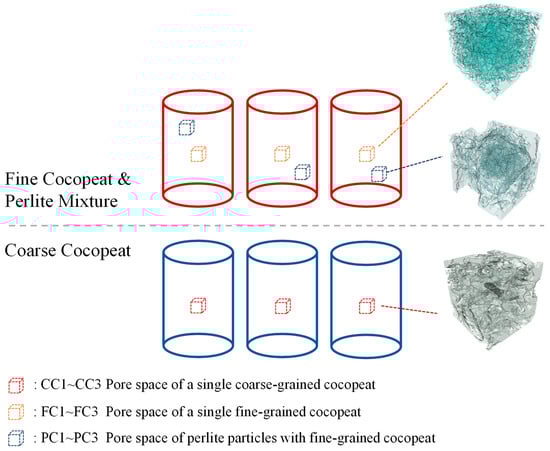
Figure 2.
Schematic diagram of the selection of regions of interest (ROIs).
In the fine cocopeat–perlite mixture, the incorporation of coarse perlite particles introduces localized variations in pore structure, thereby increasing overall heterogeneity [47,48]. Since traditional REV selection criteria may not be fully applicable to such heterogeneous media, this study focused on analyzing structural differences around perlite particles. Two ROI types were selected from the mixture: (i) regions containing a single intact perlite particle (PC1–PC3), and (ii) regions composed exclusively of fine cocopeat without perlite (FC1–FC3). Considering that perlite particle diameters typically range from 3 to 4 mm, all ROIs were set to a uniform size of 400 × 400 × 400 voxels (5 × 5 × 5 mm), ensuring that each ROI captured the full perlite particle and its surrounding pore structure.
In total, nine ROIs were extracted for structural analysis and flow simulations. For consistency, the three ROIs from the coarse cocopeat samples were also resized to 400 × 400 × 400 voxels. Basic information for each ROI is summarized in Table 1. This approach enabled direct comparisons between pure and mixed substrates while ensuring uniform simulation scale, facilitating the analysis of structural variations and their impact on flow behavior.

Table 1.
Basic information about ROI.
2.3. Equivalent Pore Network Modeling (PNM)
In order to quantitatively characterize pore structure properties, PNM needs to be created [49]. A watershed-based morphological segmentation algorithm was first applied, followed by the implementation of a maximal inscribed sphere (MIS) algorithm to develop an equivalent network representation of the pore structure. This approach has been widely validated in previous studies [30,50,51,52]. In the constructed PNM, larger pore bodies are approximated as spheres based on volume equivalency, while the constrictions connecting them (throats) are simplified as cylindrical rods.
Pore size distribution (PSD) was subsequently derived from the PNM, and the equivalent pore diameter was calculated using the following formula:
where Deq is the equivalent pore diameter (mm), and VPshed is the volume of the watershed-segmented individual pore (mm3).
2.4. Pore-Scale Flow Simulation
Connected pore spaces serve as the primary channels for fluid transport and play a decisive role in determining the permeability of porous media. However, laboratory methods often fall short in elucidating the relationship between microscale pore structure and fluid flow behavior [25,53]. Therefore, pore-scale fluid flow simulations were conducted by importing the segmented CT-based pore geometry into COMSOL Multiphysics 6.2 (COMSOL Inc., Burlington, MA, USA), enabling accurate and visual quantification beyond the capability of conventional methods.
The workflow for generating and importing the computational model is illustrated in Figure 1. Specifically, the segmented 3D pore geometry obtained from Avizo was first processed using the “Generate Surface” function to create a preliminary surface mesh representing the pore network. The resulting surface mesh was then carefully inspected and repaired in Avizo to fix intersecting surfaces and ensure a watertight geometry suitable for simulation. After mesh repair, the surface mesh was exported as a COMSOL-compatible STL file. The STL files were subsequently imported into COMSOL, where they were converted into volumetric domains to define the simulation geometry. This workflow allowed the realistic pore structures obtained from CT imaging to be directly used in numerical simulations while preserving microscale features critical for accurate flow and permeability analysis [25,54].
2.4.1. Governing Equations
The simulations solve the steady-state, incompressible Navier–Stokes equations to model laminar fluid flow within the pore space. The governing equations for conservation of mass and momentum are expressed as:
where is the fluid density (1000 kg/m3), is the flow velocity (m/s), represents the body force per unit volume (N·m−3), is the pressure gradient (Pa/m), and denotes the viscous force per unit volume (N·m−3).
2.4.2. Boundary Conditions
The simulations assume a single-phase, saturated flow condition under standard laboratory temperature (293.15 K), with fluid properties matching those of water. A no-slip boundary condition was applied at the solid–fluid interface, constraining fluid velocity to that of the stationary solid. Inlet and outlet boundaries were assigned normal pressures to drive flow through the domain.
To verify that the applied pressure differentials do not violate the linear flow assumption, sensitivity tests were conducted by varying the pressure drop across one order of magnitude (0.1–10 Pa). The resulting Reynolds numbers for the nine ROIs are summarized in Table 2.
Table 2.
Sensitivity Analysis: Reynolds Number under Different Pressure Gradients.
The Reynolds number in the porous medium was calculated as:
where ρ is the fluid density (kg·m−3), W (m) is the model’s cross-sectional length (400 voxels = 5108 μm), Uin (m·s−1) is the apparent inlet velocity (obtained by dividing the inlet volumetric flow rate by the model cross-sectional area), and μ is the dynamic viscosity (Pa·s).
As shown in Table 2, the Reynolds number consistently remained below the threshold of 10 across all ROIs and pressure gradients, ensuring that the linear Darcy law is valid under the simulated conditions. The inlet and outlet pressures were chosen with reference to Narsilio et al. [55], maintaining the outlet pressure at 0 Pa and applying a pressure drop of 1 Pa across the domain. Under this condition, the Reynolds number remained consistently below 10 for all ROIs, thereby justifying the use of linear Darcy flow in the simulations. This configuration reflects the scenario where a prescribed pressure difference is applied to drive the fluid flow through the medium.
2.4.3. Fractal Dimension and Tortuosity
Fractal dimension and tortuosity are critical indicators of pore structure complexity [56]. These parameters were evaluated across all nine ROIs to explore their influence on absolute permeability.
The fractal dimension (FD) was determined using the box-counting method, which quantifies spatial complexity based on scaling behavior. A series of cubic grids of decreasing size δ were overlaid on the binarized 3D pore domain. The number of occupied cubes N(δ) at each scale was recorded, and the fractal dimension was estimated using:
The slope of the fitted log–log curve of N(δ) vs. 1/δ yields the fractal dimension. Higher values of FD indicate more complex and heterogeneous pore structures.
Tortuosity () reflects how pore morphology elongates the flow path. The traditional definition, as the ratio of effective flow path length (Leff) to the straight-line distance (Ldir), is common:
This approach is limited to complex 3D geometries [57]. Therefore, an alternative method proposed by Duda et al. [58] was used, calculating tortuosity based on velocity fields:
where Vspf is the average fluid velocity magnitude within the entire fluid domain, and Vspfz is the average velocity component in the principal flow direction.
2.4.4. Absolute Permeability
Absolute permeability (K0) quantifies the relationship between volumetric flow rate and the imposed pressure gradient. It was calculated using Darcy’s Law after simulation:
where μ is fluid viscosity, Q is volumetric flow rate, L is the flow domain length (400 voxels = 5108 μm), A is the cross-sectional area, and ΔP is the pressure difference between inlet and outlet boundaries.
3. Results and Discussion
3.1. Quantitative Analysis of Pore Microstructure Parameters
To investigate the three-dimensional characteristics of internal pores, Avizo2020 (Thermo Fisher Scientific) was used to extract microstructural parameters of the pore space. Figure 3 illustrates the variation in pore number across nine regions of interest (ROIs) with respect to equivalent pore radius. To facilitate quantitative comparison, pores were classified into three equivalent radius categories: 0–200 µm, 200–400 µm, and >400 µm. The coarse cocopeat (CC) ROIs exhibited lower total pore counts but higher average equivalent radii (AEqR). Although pores within the 0–200 µm range constituted the majority (52.7% to 58%), their contribution to total pore volume was minimal (4.8% to 6.4%). Conversely, pores > 400 µm, representing only 9% to 10% of the total count, accounted for approximately 54% to 62% of total pore volume (Figure 4).
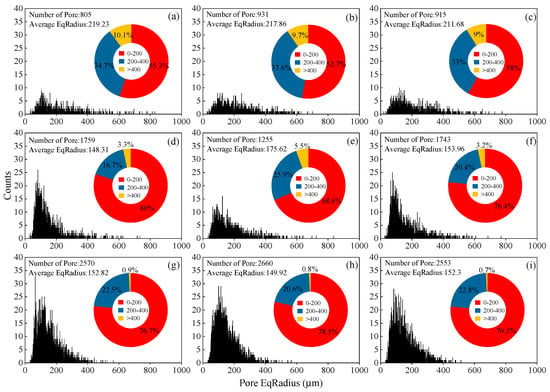
Figure 3.
Pore equivalent radius distribution of cocopeat and its mixture with perlite. (a–c): CC1–CC3; (d–f): PC1–PC3; (g–i): FC1–FC3.
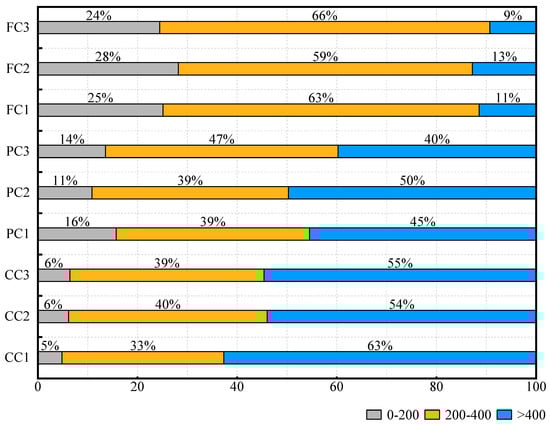
Figure 4.
Pore volume fraction in different equivalent radius ranges.
In contrast, the fine cocopeat (FC) ROIs showed a distinctly different pore size distribution. The proportion of pores within the 0–200 µm range increased markedly (>64%), along with a significant rise in their cumulative volume, which was approximately 2 to 4 times greater than that in the CC group. Meanwhile, the fraction of pores exceeding 200 µm decreased, reducing the AEqR, although the overall number of pores increased significantly. Previous studies indirectly inferred pore size distributions of cocopeat by fitting water retention curves with the van Genuchten (VG) model. However, wide variations in saturated water content (θs), residual water content (θr), and VG parameters α and n have been reported due to differences in manufacturer and origin [6,59,60,61]. Konduru et al. [62] observed significant differences in water-holding and air-filled porosities between sieved and unsieved cocopeat derived from spent coconut husks. Nonetheless, pore size distributions of cocopeat assessed using X-ray-based techniques remain scarcely reported in peer-reviewed literature.
Compared to the FC group, the ROIs containing perlite particles (i.e., the PC group) exhibited a smaller number of pores but a significantly higher proportion of large pores (>400 µm). The presence of perlite altered the microstructure of the fine-grained matrix, with its outer boundaries forming well-connected macropores that enhanced the air-filled porosity of the fine cocopeat substrate. This observation aligns with the findings of Wen et al. [63], who reported that incorporating coarse particles increases the proportion of macropores in granitic residual soils. However, due to its low bulk density, perlite particles in the substrate were observed to be displaced and accumulate at the surface during irrigation in our greenhouse experiments. This observation is based on our direct measurements and visual monitoring. Such particle displacement may potentially affect the stability of the pore network, influencing flow heterogeneity and water retention in the substrate. Quantitative characterization of this phenomenon, such as particle migration rates or mass balance, is recommended for future studies.
Figure 5 presents the distribution of equivalent throat radii in the PNM, which follows a unimodal pattern. Compared to the CC group, the FC group exhibited a greater number of throats, which reduced the average throat radius. Throats larger than 400 µm were nearly absent in the FC group. The distribution of throat sizes closely mirrors that of pore sizes, a trend also noted in soil pore network studies [64,65].
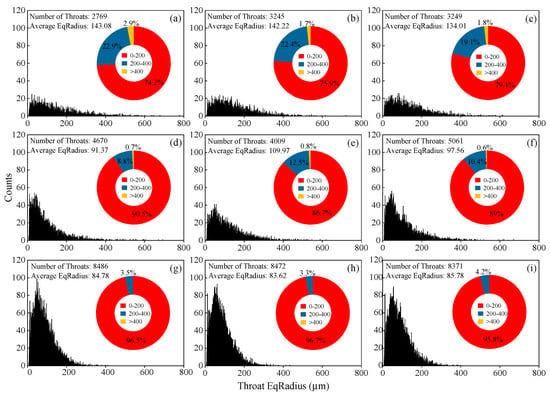
Figure 5.
Throat equivalent radius distribution of cocopeat and its mixture with perlite. (a–c): CC1–CC3; (d–f): PC1–PC3; (g–i): FC1–FC3.
The average coordination number (ACN) is an important metric for assessing pore network connectivity. A higher ACN indicates a more interconnected pore system. The coordination number (CN) of an individual pore refers to the number of connections it has with neighboring pores. As shown in Figure 6, a strong linear correlation was observed between equivalent pore radius (EqR) and CN across all ROIs, with R2 values ranging from 0.696 to 0.779. This suggests that larger pores generally exhibit higher connectivity, even though they are fewer in number, implying that these macropores may serve as “transport hubs” within the network. Wen et al. [66] reported strong correlations between ACN and parameters such as AEqR (r = 0.739), average equivalent throat radius (AEtR) (r = 0.858), and average porosity (APor) (r = 0.694). In this study, the corresponding correlation coefficients were 0.75, 0.55, and 0.90, respectively.
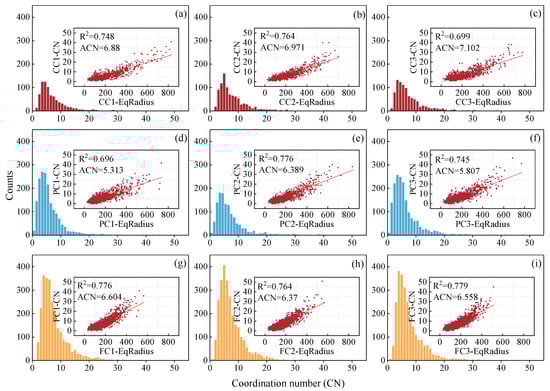
Figure 6.
Coordination number distribution of cocopeat and its mixture with perlite. (a–c): CC1–CC3; (d–f): PC1–PC3; (g–i): FC1–FC3.
The CC group had the highest ACN values among all samples (6.88, 6.971, and 7.102). In contrast, the FC group showed lower ACN values (6.604, 6.37, and 6.558), indicating that while CC had larger pores, it also featured a more connected network, potentially enhancing fluid mobility. While PC1 and PC3 showed AEqR comparable to those of the FC group, their ACN were lower. Although PC2 exhibited relatively high Por and AEqR values, its ACN remained low. This suggests that the presence of perlite particles may impair pore network connectivity, likely due to low CN values of pores located inside perlite grains.
To validate this hypothesis, we marked the positions of pores with CN < 5 across all nine ROIs. As shown in Figure 7, in ROIs without perlite, these poorly connected pores were scattered with no clear clustering. In contrast, in the PC group, they were predominantly located inside the perlite particles. This observation confirms that low-CN pores within perlite particles may be the key contributors to the reduced ACN observed in the PC group, thereby affecting overall pore network connectivity.
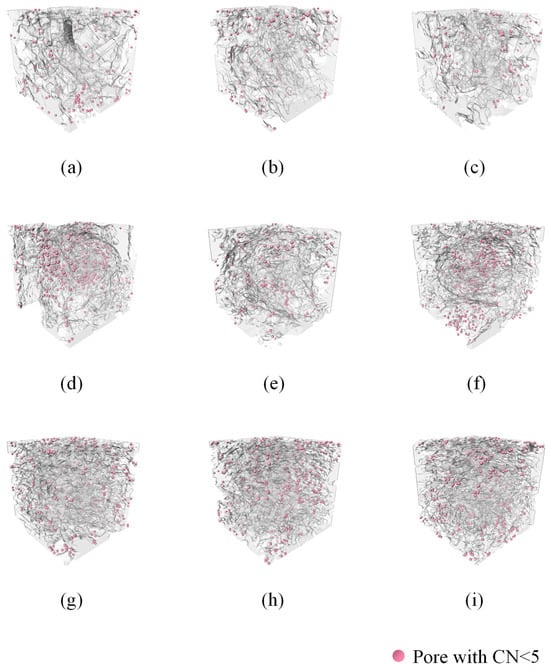
Figure 7.
Spatial location of the low coordination number of pores: (a–c): CC1–CC3; (d–f): PC1–PC3; (g–i): FC1–FC3.
3.2. Influence of Pore Structure Parameters on Permeability
Figure 8 illustrates the variation in porosity (Por), intrinsic permeability (K0), tortuosity (τ), and fractal dimension (FD) across the nine ROIs. A strong positive correlation was observed between Por and K0 (r = 0.75, p = 0.020), which aligns with classical porous media flow theory, where higher porosity generally leads to increased permeability. Additionally, both FD and τ exhibited strong negative correlations with K0 (r = −0.917, p < 0.001; r = −0.833, p = 0.005, respectively), indicating that permeability is influenced not only by porosity but also by the morphological complexity of the pore structure. Among these indicators, FD showed strong predictive capability for estimating K0, suggesting the applicability of fractal theory to cocopeat-based substrates.
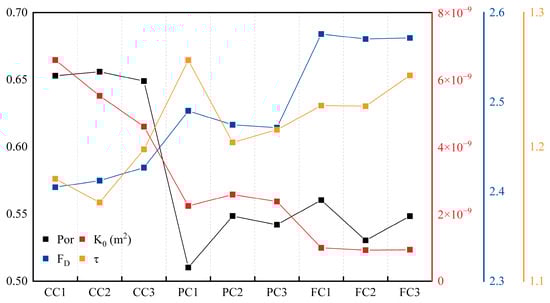
Figure 8.
Pore characterization parameters and permeability of ROIs.
Among the samples, CC1 exhibited the highest Por and K0, followed by CC2 and CC3. These three ROIs also showed relatively lower FD and τ values, implying that the coarse cocopeat formed a more uniform and well-connected pore network. Such structures facilitate simpler flow paths, thereby enhancing permeability. In contrast, the FC group showed reduced Por and K0 but higher FD and τ. In this study, FD is considered to be primarily modulated by the presence and spatial arrangement of small pores, which contribute to the complexity of the pore network and thus influence K0. As shown in Section 3.1, the fine-textured matrix exhibited smaller and more abundant pores, which further increased structural complexity and raised FD [67]. The relatively high τ values in the FC group indicate that the flow paths in these ROIs were more tortuous. Moreover, FD and τ were strongly correlated (r = 0.850, p = 0.004), consistent with previous findings [23] that dense small-pore networks increase tortuosity and thereby reduce permeability.
Compared to the FC group, the PC group demonstrated higher K0 and notably reduced FD. Interestingly, PC1 showed the lowest Por but the highest τ, whereas τ values in PC2 and PC3 were lower than those in the FC group. These observations suggest that the influence of perlite particles on pore structure is heterogeneous. This may be due to variations in individual particle orientation, shape, or surface roughness [68]. Nevertheless, the presence of perlite contributed to increased permeability, even under similar or lower Por conditions, by promoting the formation of larger, well-connected pores and a simpler pore network that facilitates fluid transport. These findings are in line with those of Gohardoust et al. [59], who reported that a 1:1 volume ratio of perlite to cocopeat exhibited higher saturated hydraulic conductivity (Ksat) than pure cocopeat. However, the hydraulic behavior of mixed substrates remains a subject of debate. For example, Gan et al. [69] found that pure peat had higher Ksat than a peat–perlite mixture (approximately 1:1 by volume) using a constant-head permeameter test. They attributed the reduction in Ksat to pore blockage caused by the fine particles in the composite substrate, even though the air-filled porosity of the mixture exceeded that of pure peat. These contrasting findings highlight the complexity of pore structure interactions in composite substrates.
Overall, macro-level pore structure parameters (Por, FD, and τ) provide a convenient means to estimate permeability. Variability in these parameters across the nine ROIs indirectly reflects differences in pore size distribution. Fundamentally, pore structure is governed by the number, size, and three-dimensional spatial arrangement of individual pores [70,71]. In general, a more spacious and continuous pore network facilitates water movement, thereby enhancing permeability. In our study, the sample size was relatively small (n = 9), which may have inflated the correlation coefficients. Moreover, the effects of individual pore structure parameters on K0 are interdependent. This is consistent with observations by Xia et al. [72] who noted that the way Por modulates FD can obscure the direct relationship between Por and K0. Future work will employ larger sample sizes and synthetic pore structures to clarify these interactions and to establish mathematical models linking pore characteristics to K0 using multivariate statistical approaches.
3.3. Visualization of Velocity Fields
As shown in Figure 9, a variety of streamlines with differing velocities formed within the pore space. Fluid preferentially migrates along paths with lower hydraulic resistance, resulting in a non-uniform spatial distribution of streamline density. A higher streamline density indicates a greater volume of fluid flow in that region, potentially identifying preferential flow zones [73]. Streamline analysis offers an efficient and accurate means to reveal the influence of structural heterogeneity on flow patterns, providing a more convenient alternative to traditional impregnation methods by eliminating the need for tedious sectioning or staining [64].
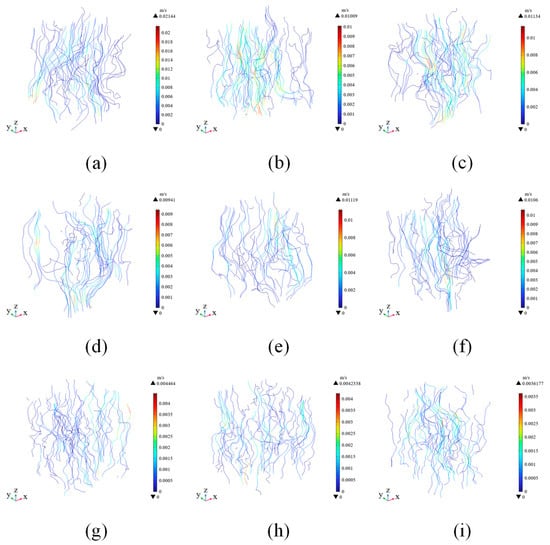
Figure 9.
Streamlines of velocity in ROIs. (a–c): CC1–CC3; (d–f): PC1–PC3; (g–i): FC1–FC3.
Among the different ROIs, the CC group exhibited several distinct clusters of dense and high-velocity streamlines, indicating the presence of preferential flow regions within the pore structure. In contrast, while the FC group also exhibited densely packed streamlines, they were not necessarily associated with high velocity—as observed near the center of FC1. The high-velocity clusters in the FC group appeared finer and narrower, reflecting the more confined and highly branched pore channels characteristic of fine cocopeat. Due to the constriction effects in certain pore cross-sections, clusters of high-velocity streamlines were also formed.
In the PC group, the presence of solid perlite particles led to a noticeable pattern where streamlines were concentrated predominantly along the outer boundaries of the perlite, while the flow paths were elongated and velocities in other regions remained low and dispersed. The pore channels surrounding perlite particles were substantially wider than those in the fine cocopeat, resulting in more concentrated and continuous streamline clusters. Notably, some of these high-velocity streamlines extended throughout the entire Z-direction of the ROI, indicating their potential role as preferential flow paths during saturation or near-saturation drainage processes. Therefore, a more detailed statistical analysis of these flow features is conducted in the following section.
3.4. Flow Velocity Response to Pore Structure Heterogeneity
To better understand the impact of pore structure on heterogeneous flow velocity distribution, this study employed the apparent inlet velocity Uin (SI unit: m·s−1) as a reference unit to classify the internal flow velocity fields across the pore space.
This approach, inspired by Gackiewicz et al. [53], assumes that in a theoretically homogeneous medium, the outlet fluid velocity (Uout) would be identical to Uin.
As shown in Figure 10a, the largest proportion of the pore volume within each ROI falls in the velocity range of 0–1Uin, including the stagnant velocity zone (SVZ, v = 0). With increasing velocity gradients, the relative volume fraction decreases across most intervals except for the highest range (>10Uin). The principal differences between ROIs lie in the 0–1Uin and > 5Uin intervals: The principal differences among ROIs occur within the 0–1Uin and >5Uin intervals: the CC group exhibits a higher proportion of flow within the 0–1Uin range, while the mixed-substrate ROIs (FC and PC groups) show a larger relative volume fraction in the >5Uin range.
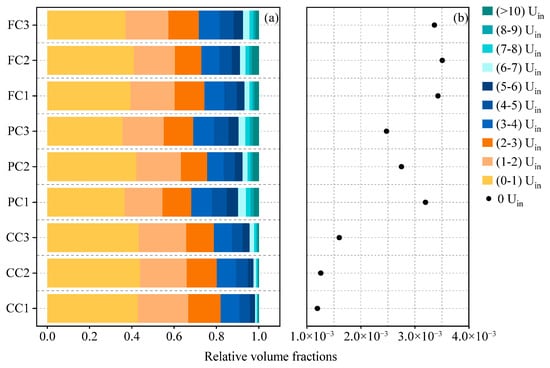
Figure 10.
(a) Relative volume distribution of different flow velocity intervals (expressed as multiples of inlet velocity Uin) across nine regions of interest (ROIs); (b) Relative volume fraction of stagnant velocity zones (SVZs, flow velocity = 0) within each ROI.
The volume fraction of the SVZ was also calculated explicitly (Figure 10b). For clarity, we further define a low-velocity zone (LVZ, v = 0–1Uin), a medium-velocity zone (MVZ, v = 1–5Uin), and a high-velocity zone (HVZ, v > 5Uin) for subsequent analysis. Interestingly, although the FC group does not dominate the broader low-velocity range, it exhibits the highest SVZ proportion, suggesting that the mechanisms underlying SVZ formation are not solely governed by velocity gradient distribution.
As shown in Figure 11, the relative volumes of these velocity zones exhibited distinct correlations with both pore size distribution and macroscopic structural parameters. LVZ and MVZ showed opposite trends in correlation coefficients compared to HVZ and SVZ. MVZ showed a strong positive correlation only with porosity (Por) and weak correlations with fractal dimension (FD) and tortuosity (τ), suggesting that moderate velocities (1–5Uin) are largely insensitive to pore geometry but more prevalent in highly porous media.
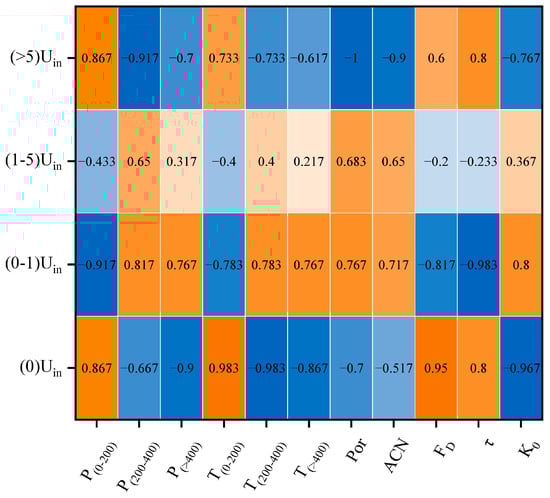
Figure 11.
Correlation heat map between flow velocity zone relative volumes and pore/throat size classes, pore structural parameters, and permeability.
In contrast, LVZ was highly responsive to pore structure variation. The correlation with throat parameters suggests that the presence of more medium and large pores leads to an increased volume of low-velocity fluid. LVZ showed a strong negative correlation with FD and τ, and a positive correlation with Por and average coordination number (ACN), indicating that simpler and more connected pore networks promote the formation of low-speed flow zones.
Gackiewicz et al. (2022) [53] reported that fluids flowing at velocities exceeding 1Uin accounted for 83% of the total flow rate in permeable soils, whereas in our substrate samples, approximately 60% of the fluids exhibited velocities above 1Uin. The Por of the substrates was consistently higher than that of the soils examined by Gackiewicz et al. (2022) [53]. Interestingly, both HVZ and SVZ exhibited strong negative correlations with Por was close to −1 (p < 0.001). We note that the small sample size (n = 9 ROIs) may contribute to the extreme correlation values. These results are consistent with observations from equivalent pore and throat radii: larger pores increase overall porosity while simultaneously reducing the relative volumes of HVZ and SVZ.
Figure 12 illustrates the spatial distribution of HVZ across the nine ROIs. In the CC group, HVZ appear more clustered, while in the PC group, they are localized around solid perlite particles and show higher curvature. Although HVZ volumes in the FC and PC groups are similar, the FC group exhibits a more fragmented and dispersed HVZ pattern, with numerous small and isolated clusters. Most HVZ is elongated, corresponding to the geometry of dominant flow paths in porous media, where flow tends to concentrate along a limited number of preferential channels—consistent with Poiseuille’s law. Tortuosity (τ) also significantly affects HVZ morphology and volume. In FC and PC groups, narrower and more tortuous pathways yield lower average velocities but still include several dominant channels carrying higher flow, resulting in higher normalized HVZ volumes. Additionally, localized pore constrictions also induce isolated zones of high-speed flow by forcing adjustments in velocity and direction, which increase τ.
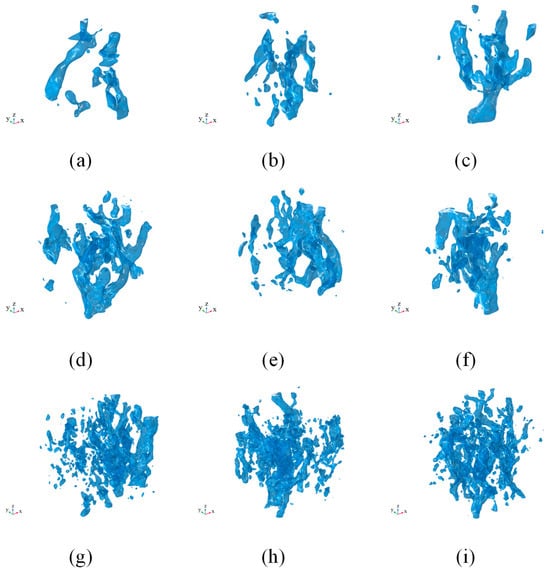
Figure 12.
Spatial distribution of high-velocity zones (HVZ, v > 5Uin) in ROIs. (a–c): CC1–CC3; (d–f): PC1–PC3; (g–i): FC1–FC3.
SVZ, by contrast, tend to be located in narrower branches of the flow paths and are strongly negatively correlated with the number of throats between 200–400 μm. Narrower connections increase the likelihood of localized stagnation. Figure 13 shows the spatial distribution of SVZ. Due to viscous drag from the pore walls, fluid velocity naturally decreases from the central axis toward the wall, potentially halting entirely in rough-surfaced or recessed regions, forming recirculation zones that increase resistance [74]. SVZ were more uniformly distributed in CC and FC groups, whereas in PC, they clustered near the central region. Although these pores are technically connected, the narrow internal channels within perlite particles severely limit fluid mobility—consistent with findings from Section 3.1, where the internal coordination number (CN < 5) of perlite pores led to a dense and complex structure that hinders drainage. When fluid enters small pores from larger external ones, additional Laplace pressure can suppress flow, favoring migration along wider peripheral channels [75].
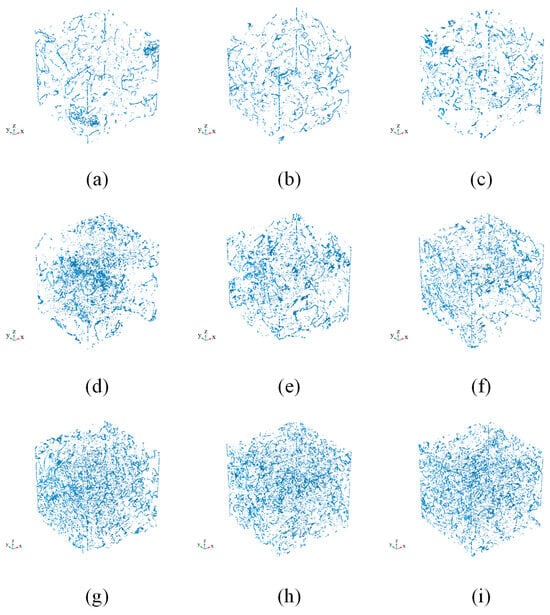
Figure 13.
Spatial distribution of stagnant-velocity zones (SVZ, v = 0) in ROIs. (a–c): CC1–CC3; (d–f): PC1–PC3; (g–i): FC1–FC3.
Overall, the patterns of saturated single-phase flow differ significantly between pure coarse cocopeat and fine cocopeat–perlite mixtures. Both contain dominant flow paths that exhibit high velocities and carry greater fluid volumes. However, structural features such as constricted or irregular pores lead to localized stagnation, which, though limited in volume, may significantly affect solute transport and chemical retention. Macroscopic structural parameters such as Por, ττ, and τ—quantifiable via CT image analysis—can reasonably predict these flow behaviors. The addition of large perlite particles improves the aeration capacity of fine cocopeat matrices by creating wider external pores that facilitate drainage, a trend consistent with findings from previous studies on the percolation of porous media. Meanwhile, the internal pores of perlite retain small amounts of water, enabling slow release and partially preserving the substrate’s water-holding capacity.
4. Conclusions
This study combined Micro-CT and pore-scale flow simulations to systematically investigate the microstructural and hydraulic differences between coarse cocopeat and fine cocopeat–perlite mixed substrates. A total of nine regions of interest (ROIs) were analyzed to evaluate how particle size and composition influence pore architecture, permeability, and velocity distribution. The main conclusions are as follows:
- (1)
- Pore structure characteristics: Over 90% of pore diameters in all substrates were concentrated within 0–400 μm, with coordination number generally increasing with pore size. Coarse cocopeat contained a higher fraction of macropores (>400 μm), while perlite addition increased average pore size but reduced pore count.
- (2)
- Hydraulic properties: Porosity (Por) was positively correlated with permeability (K0), whereas fractal dimension (FD) and tortuosity (τ) were negatively correlated with K0. Compared with fine cocopeat, perlite addition decreased pore-space complexity (lower FD) and enhanced permeability, highlighting its role in improving hydraulic conductivity.
- (3)
- Flow distribution: Approximately 90% of velocities were below 5Uin. Lower Por and higher τ promoted the formation of high-velocity zones (HVZ), while higher FD increased stagnant zones (SVZ). Perlite particles introduced spatial heterogeneity by concentrating flow along external surfaces and inducing stagnation within internal pores, thereby jointly enhancing drainage and residual water retention.
- (4)
- This study demonstrates how substrate microstructure governs water transport in soilless cultivation systems, providing direct insights for optimizing irrigation management. Nevertheless, the present work has several limitations. All simulations were performed under saturated conditions, while in practice, horticultural substrates typically function under unsaturated states dominated by thin water films. In addition, the exclusion of substrates with larger particles (e.g., vermiculite, expanded clay) constrains the generality of the conclusions, and the physical and chemical changes that cocopeat undergoes during repeated irrigation cycles (e.g., compaction, decomposition, salinity accumulation) may further alter hydraulic behavior over time. To address these issues, future research should integrate macroscopic hydraulic tests, such as water retention curves fitted with the van Genuchten model and simulations based on the Richards equation, to investigate seepage processes in limited-volume containers under variably saturated conditions. Moreover, combining periodic micro-CT measurements with time-evolving simulations would enable the capture of long-term dynamics, thereby strengthening the link between pore-scale mechanisms and real cultivation scenarios.
Overall, this work advances the microstructural understanding of mixed substrates and identifies key structural factors affecting hydraulic behavior, thereby supporting more efficient irrigation strategies in soilless cultivation.
Author Contributions
Conceptualization, J.L.; methodology, K.Y. and J.L.; software, K.Y. and X.Z.; validation, T.L., K.Y. and Q.F.; formal analysis, K.Y.; investigation, W.L. and K.Y.; resources, J.L.; data curation, K.Y.; writing—original draft preparation, K.Y.; writing—review and editing, T.L., Q.F. and J.L.; visualization, K.Y. and X.Z.; supervision, T.L. and J.L.; project administration, J.W.; funding acquisition, K.Y., J.L. and J.W. All authors have read and agreed to the published version of the manuscript.
Funding
This research was funded by “National Science and Technology Program during the Twelfth Five-year Plan Period, grant number 2023YFD1901203”, “Yunnan Provincial Department of Education Science Research Fund Project, grant number 2025Y0526” and “Applied Basic Research Key Project of Yunnan, grant number 202301BD070001-173”.
Data Availability Statement
Data are contained within the article; further inquiries can be directed to the corresponding authors.
Conflicts of Interest
The authors declare no conflicts of interest.
References
- Massa, D.; Magan, J.J.; Montesano, F.F.; Tzortzakis, N. Review Minimizing Water and Nutrient Losses from Soilless Cropping in Southern Europe. Agric. Water Manag. 2020, 241, 106395. [Google Scholar] [CrossRef]
- Pandey, K.; Singh, K.G.; Singh, A. Multi-Sensors Based Smart Nutrient Reuse Management System for Closed Soilless Culture under Protected Cultivation. Comput. Electron. Agric. 2023, 204, 107495. [Google Scholar] [CrossRef]
- Sodini, M.; Cacini, S.; Navarro, A.; Traversari, S.; Massa, D. Estimation of Pore-Water Electrical Conductivity in Soilless Tomatoes Cultivation Using an Interpretable Machine Learning Model. Comput. Electron. Agric. 2024, 218, 108746. [Google Scholar] [CrossRef]
- Ahn, T.I.; Yang, J.-S.; Park, S.H.; Im, Y.-H.; Lee, J.Y. Nutrient Recirculating Soilless Culture System as a Predictable and Stable Way of Microbial Risk Management. J. Clean. Prod. 2021, 298, 126747. [Google Scholar] [CrossRef]
- Incrocci, L.; Thompson, R.B.; Dolores Fernandez-Fernandez, M.; De Pascale, S.; Pardossi, A.; Stanghellini, C.; Rouphael, Y.; Gallardo, M. Irrigation Management of European Greenhouse Vegetable Crops. Agric. Water Manag. 2020, 242, 106393. [Google Scholar] [CrossRef]
- Papadimitriou, D.M.; Daliakopoulos, I.N.; Louloudakis, I.; Savvidis, T.I.; Sabathianakis, I.; Savvas, D.; Manios, T. Impact of Container Geometry and Hydraulic Properties of Coir Dust, Perlite, and Their Blends Used as Growing Media, on Growth, Photosynthesis, and Yield of Golden Thistle (S. hispanicus L.). Sci. Hortic. 2024, 323, 112425. [Google Scholar] [CrossRef]
- Caputo, S.; Rumble, H.; Schaefer, M. “I like to Get My Hands Stuck in the Soil”: A Pilot Study in the Acceptance of Soil-Less Methods of Cultivation in Community Gardens. J. Clean. Prod. 2020, 258, 120585. [Google Scholar] [CrossRef]
- Fornes, F.; Belda, R.M.; Lidon, A. Analysis of Two Biochars and One Hydrochar from Different Feedstock: Focus Set on Environmental, Nutritional and Horticultural Considerations. J. Clean. Prod. 2015, 86, 40–48. [Google Scholar] [CrossRef]
- Mahjoor, F.; Ghaemi, A.A.; Golabi, M.H. Interaction Effects of Water Salinity and Hydroponic Growth Medium on Eggplant Yield, Water-Use Efficiency, and Evapotranspiration. Int. Soil Water Conserv. Res. 2016, 4, 99–107. [Google Scholar] [CrossRef]
- Lu, B.; Wang, X.; Hu, C.; Li, X. Rapid and High-Performance Analysis of Total Nitrogen in Coco-Peat Substrate by Coupling Laser-Induced Breakdown Spectroscopy with Multi-Chemometrics. Agriculture 2024, 14, 946. [Google Scholar] [CrossRef]
- Feng, J.; Zhi, Y.; Zhang, D.; Chi, C.P.; Chu, S.; Hayat, K.; Zhou, P. Rice Straw as Renewable Components of Horticultural Growing Media for Purple Cabbage. Sci. Total Environ. 2020, 747, 141274. [Google Scholar] [CrossRef]
- Petropoulos, S.; Fernandes, A.; Stojkovic, D.; Pereira, C.; Taofiq, O.; Di Gioia, F.; Tzortzakis, N.; Sokovic, M.; Barros, L.; Ferreira, I.C.F.R. Cotton and Cardoon Byproducts as Potential Growing Media Components for Cichorium spinosum L. Commercial Cultivation. J. Clean. Prod. 2019, 240, 118254. [Google Scholar] [CrossRef]
- Paoli, R.; Feofilovs, M.; Kamenders, A.; Romagnoli, F. Peat Production for Horticultural Use in the Latvian Context: Sustainability Assessment through LCA Modeling. J. Clean. Prod. 2023, 413, 137395. [Google Scholar] [CrossRef]
- Yamaya, M.; Nakayama, K.; Hosoda, M.; Yanai, M.; Sasaki, H. A Rockwool Fibre Worker with Lung Fibrosis. Lancet 2000, 355, 1723–1724. [Google Scholar] [CrossRef] [PubMed]
- Liu, Z.; Li, P.; Hu, Y.; Wang, J. Wetting Patterns and Water Distributions in Cultivation Media under Drip Irrigation. Comput. Electron. Agric. 2015, 112, 200–208. [Google Scholar] [CrossRef]
- Deepagoda, T.K.K.C.; Lopez, J.C.C.; Moldrup, P.; de Jonge, L.W.; Tuller, M. Integral Parameters for Characterizing Water, Energy, and Aeration Properties of Soilless Plant Growth Media. J. Hydrol. 2013, 502, 120–127. [Google Scholar] [CrossRef]
- Gohardoust, M.R.; Šimůnek, J.; Hardelauf, H.; Tuller, M. Adaptation and Validation of the ParSWMS Numerical Code for Simulation of Water Flow and Solute Transport in Soilless Greenhouse Substrates. J. Hydrol. 2021, 596, 126053. [Google Scholar] [CrossRef]
- Smet, S.; Beckers, E.; Plougonven, E.; Leonard, A.; Degre, A. Can The Pore Scale Geometry Explain Soil Sample Scale Hydrodynamic Properties? Front. Environ. Sci. 2018, 6, 20. [Google Scholar] [CrossRef]
- Zhang, H.; He, H.; Gao, Y.; Mady, A.; Filipovic, V.; Dyck, M.; Lv, J.; Liu, Y. Applications of Computed Tomography (CT) in Environmental Soil and Plant Sciences. Soil Tillage Res. 2023, 226, 105574. [Google Scholar] [CrossRef]
- Liu, W.; Feng, Q.; Chen, W.; Wei, W.; Deo, R.C. The Influence of Structural Factors on Stormwater Runoff Retention of Extensive Green Roofs: New Evidence from Scale-Based Models and Real Experiments. J. Hydrol. 2019, 569, 230–238. [Google Scholar] [CrossRef]
- Qiao, J.; Liu, X.; Zhu, Y.; Jia, X.; Shao, M. Three-Dimensional Quantification of Soil Pore Structure in Wind-Deposited Loess under Different Vegetation Types Using Industrial X-Ray Computed Tomography. Catena 2021, 199, 105098. [Google Scholar] [CrossRef]
- Rooney, E.C.; Bailey, V.L.; Patel, K.F.; Dragila, M.; Battu, A.K.; Buchko, A.C.; Gallo, A.C.; Hatten, J.; Possinger, A.R.; Qafoku, O.; et al. Soil Pore Network Response to Freeze-Thaw Cycles in Permafrost Aggregates. Geoderma 2022, 411, 115674. [Google Scholar] [CrossRef]
- Wu, Y.; Tahmasebi, P.; Lin, C.; Munawar, M.J.; Cnudde, V. Effects of Micropores on Geometric, Topological and Transport Properties of Pore Systems for Low-Permeability Porous Media. J. Hydrol. 2019, 575, 327–342. [Google Scholar] [CrossRef]
- Zhao, Z.; Zhou, X.-P. Pore-Scale Diffusivity and Permeability Evaluations in Porous Geomaterials Using Multi-Types Pore-Structure Analysis and X-μCT Imaging. J. Hydrol. 2022, 615, 128704. [Google Scholar] [CrossRef]
- Fan, N.; Wang, J.; Deng, C.; Fan, Y.; Wang, T.; Guo, X. Quantitative Characterization of Coal Microstructure and Visualization Seepage of Macropores Using CT-Based 3D Reconstruction. J. Nat. Gas Sci. Eng. 2020, 81, 103384. [Google Scholar] [CrossRef]
- Guo, X.; Liu, Y.; Zhang, L.; Deng, C.; Song, L.; Zhang, Y. Regulatory Mechanism of Microscopic Pore Structure on Anisotropy of Gas Multimodal Seepage in Original Coals. Energy 2024, 300, 131611. [Google Scholar] [CrossRef]
- Ge, M.; Chen, G.; Liu, W.; Liu, C.; Zheng, D. Study on the Pore Structure Characteristics of Maize Grain Piles and Their Effects on Air Flow Distribution. Comput. Electron. Agric. 2024, 224, 109136. [Google Scholar] [CrossRef]
- Li, J.; Cao, S.; Song, W.; Sun, L. Visualization and Quantification of Pore Structure in Cement Tailings Waste Rock Composites Using X-Ray Computed Tomography and Deep Learning. Constr. Build. Mater. 2025, 476, 141341. [Google Scholar] [CrossRef]
- Bird, M.B.; Butler, S.L.; Hawkes, C.D.; Kotzer, T. Numerical Modeling of Fluid and Electrical Currents through Geometries Based on Synchrotron X-Ray Tomographic Images of Reservoir Rocks Using Avizo and COMSOL. Comput. Geosci. 2014, 73, 6–16. [Google Scholar] [CrossRef]
- Gharedaghloo, B.; Price, J.S.; Rezanezhad, F.; Quinton, W.L. Evaluating the Hydraulic and Transport Properties of Peat Soil Using Pore Network Modeling and X-Ray Micro Computed Tomography. J. Hydrol. 2018, 561, 494–508. [Google Scholar] [CrossRef]
- Ji, Y.; Zhou, J.; Xie, L.; Shen, L.; Zheng, Y.; Ma, S. Quantitative Microstructural Characterization and Seepage Visualization of Biocemented Sand. Comput. Geotech. 2024, 174, 106594. [Google Scholar] [CrossRef]
- Zhang, Z.; Liu, K.; Zhou, H.; Lin, H.; Li, D.; Peng, X. Linking Saturated Hydraulic Conductivity and Air Permeability to the Characteristics of Biopores Derived from X-Ray Computed Tomography. J. Hydrol. 2019, 571, 1–10. [Google Scholar] [CrossRef]
- Jiang, X.; Zhong, X.; Yu, G.; Zhang, X.; Liu, J. Different Effects of Taproot and Fibrous Root Crops on Pore Structure and Microbial Network in Reclaimed Soil. Sci. Total Environ. 2023, 901, 165996. [Google Scholar] [CrossRef]
- Budhathoki, S.; Lamba, J.; Srivastava, P.; Malhotra, K.; Way, T.R.; Katuwal, S. Using X-Ray Computed Tomography to Quantify Variability in Soil Macropore Characteristics in Pastures. Soil Tillage Res. 2022, 215, 105194. [Google Scholar] [CrossRef]
- Prodanovic, V.; Zhang, K.; Hatt, B.; McCarthy, D.; Deletic, A. Optimisation of Lightweight Green Wall Media for Greywater Treatment and Reuse. Build. Environ. 2018, 131, 99–107. [Google Scholar] [CrossRef]
- Giuliani, L.M.; Hallett, P.D.; Loades, K.W. Effects of Soil Structure Complexity to Root Growth of Plants with Contrasting Root Architecture. Soil Tillage Res. 2024, 238, 106023. [Google Scholar] [CrossRef]
- Baetens, J.M.; Verbist, K.; Cornelis, W.M.; Gabriels, D.; Soto, G. On the Influence of Coarse Fragments on Soil Water Retention. Water Resour. Res. 2009, 45, W07408. [Google Scholar] [CrossRef]
- Zhao, L.; Guanhua, N.; Yan, W.; Hehe, J.; Yongzan, W.; Haoran, D.; Mao, J. Semi-Homogeneous Model of Coal Based on 3D Reconstruction of CT Images and Its Seepage-Deformation Characteristics. Energy 2022, 259, 125044. [Google Scholar] [CrossRef]
- Luo, L.; Lin, H.; Li, S. Quantification of 3-D Soil Macropore Networks in Different Soil Types and Land Uses Using Computed Tomography. J. Hydrol. 2010, 393, 53–64. [Google Scholar] [CrossRef]
- Qian, Y.; Yang, X.; Zhang, Z.; Li, X.; Zheng, J.; Peng, X. Estimating the Permeability of Soils under Different Tillage Practices and Cropping Systems: Roles of the Three Percolating Pore Radii Derived from X-Ray CT. Soil Tillage Res. 2024, 235, 105903. [Google Scholar] [CrossRef]
- Fukumasu, J.; Jarvis, N.; Koestel, J.; Larsbo, M. Links between Soil Pore Structure, Water Flow and Solute Transport in the Topsoil of an Arable Field: Does Soil Organic Carbon Matter? Geoderma 2024, 449, 117001. [Google Scholar] [CrossRef]
- Liu, J.; Lu, S. Amendment of Different Biochars Changed Pore Characteristics and Permeability of Ultisol Macroaggregates Identified by X-Ray Computed Tomography (CT). Geoderma 2023, 434, 116470. [Google Scholar] [CrossRef]
- Carlile, W.R.; Raviv, M.; Prasad, M. Chapter 8—Organic Soilless Media Components. In Soilless Culture, 2nd ed.; Raviv, M., Lieth, J.H., Bar-Tal, A., Eds.; Elsevier: Cambridge, MA, USA, 2019; pp. 303–378. ISBN 978-0-444-63696-6. [Google Scholar]
- Kumar, M.A.; Moghal, A.A.B.; Vydehi, K.V.; Almajed, A. Embodied Energy in the Production of Guar and Xanthan Biopolymers and Their Cross-Linking Effect in Enhancing the Geotechnical Properties of Cohesive Soil. Buildings 2023, 13, 2304. [Google Scholar] [CrossRef]
- Al Naddaf, O.; Livieratos, I.; Stamatakis, A.; Tsirogiannis, I.; Gizas, G.; Savvas, D. Hydraulic Characteristics of Composted Pig Manure, Perlite, and Mixtures of Them, and Their Impact on Cucumber Grown on Bags. Sci. Hortic. 2011, 129, 135–141. [Google Scholar] [CrossRef]
- Ge, M.; Chen, G.; Liu, W.; Liu, C.; Zheng, D. Study of Air Flow and Heat Transfer in Soybean Piles Based on CT. J. Food Eng. 2024, 369, 111954. [Google Scholar] [CrossRef]
- Lanzon, M.; Cnudde, V.; de Kock, T.; Dewanckele, J. X-Ray Microtomography (μ-CT) to Evaluate Microstructure of Mortars Containing Low Density Additions. Cem. Concr. Compos. 2012, 34, 993–1000. [Google Scholar] [CrossRef]
- Liu, Y.; Deng, H.; Jiang, Z.; Tian, G.; Wang, P.; Yu, S. Research on Influence Laws of Aggregate Sizes on Pore Structures and Mechanical Characteristics of Cement Mortar. Constr. Build. Mater. 2024, 442, 137606. [Google Scholar] [CrossRef]
- Sun, L.; Wan, F.; Wang, G.; Duan, S.; Huang, Q.; Li, W. Pore-Fracture Structures and Seepage Flow Characteristics during Spontaneous Coal Combustion Based on CT 3D Reconstruction. Energy 2024, 305, 132398. [Google Scholar] [CrossRef]
- Dong, J.; Dai, P.; Liu, W.; Xu, H.; Sui, S. Characterizing Disintegrated Dolomite Pore Structure and Seepage: CT Scanning and Numerical Approach. J. Rock Mech. Geotech. Eng. 2024, 17, 4386–4399. [Google Scholar] [CrossRef]
- Ferreira, T.R.; Archilha, N.L.; Pires, L.F. An Analysis of Three XCT-Based Methods to Determine the Intrinsic Permeability of Soil Aggregates. J. Hydrol. 2022, 612, 128024. [Google Scholar] [CrossRef]
- Yan, F.; Zeng, T.; Yang, M.; Peng, S.; Gao, C.; Yang, Y. Study on Pore-Crack Evolution and Connectivity of Coal Subjected to Controlled Electrical Pulse Based on CT Scanning Technology. Energy 2024, 296, 131200. [Google Scholar] [CrossRef]
- Gackiewicz, B.; Lamorski, K.; Kochiieru, M.; Sławiński, C.; Hsu, S.-Y.; Chang, L.-C. Hybrid Modelling of Saturated Water Flow in Percolating and Non-Percolating Macroporous Soil Media. Geoderma 2022, 406, 115467. [Google Scholar] [CrossRef]
- Liu, J.; Wang, Y.; Tian, Y.; Zhuang, Y.; Lu, S. Pore Structure Analysis via X-Ray μCT: Enhancing Soil Macroaggregate Models for Water Permeability and Carbon Sequestration. Geoderma Reg. 2024, 36, e00764. [Google Scholar] [CrossRef]
- Narsilio, G.A.; Kress, J.; Yun, T.S. Characterisation of Conduction Phenomena in Soils at the Particle-Scale: Finite Element Analyses in Conjunction with Synthetic 3D Imaging. Comput. Geotech. 2010, 37, 828–836. [Google Scholar] [CrossRef]
- de Andrade, E.; Ferreira, T.R.; Gaspareto, J.V.; Pires, L.F. Intra-Aggregate Pore Network Stability Following Wetting-Drying Cycles in a Subtropical Oxisol Under Contrasting Managements. Agriculture 2025, 15, 1725. [Google Scholar] [CrossRef]
- Zhang, Y.; Yang, Z.; Wang, F.; Zhang, X. Comparison of Soil Tortuosity Calculated by Different Methods. Geoderma 2021, 402, 115358. [Google Scholar] [CrossRef]
- Duda, A.; Koza, Z.; Matyka, M. Hydraulic Tortuosity in Arbitrary Porous Media Flow. Phys. Rev. E 2011, 84, 036319. [Google Scholar] [CrossRef] [PubMed]
- Gohardoust, M.R.; Bar-Tal, A.; Effati, M.; Tuller, M. Characterization of Physicochemical and Hydraulic Properties of Organic and Mineral Soilless Culture Substrates and Mixtures. Agronomy 2020, 10, 1403. [Google Scholar] [CrossRef]
- Londra, P.; Paraskevopoulou, A.; Psychogiou, M. Hydrological Behavior of Peat- and Coir-Based Substrates and Their Effect on Begonia Growth. Water 2018, 10, 722. [Google Scholar] [CrossRef]
- Wang, D.; Gabriel, M.Z.; Legard, D.; Sjulin, T. Characteristics of Growing Media Mixes and Application for Open-Field Production of Strawberry (Fragaria ananassa). Sci. Hortic. 2016, 198, 294–303. [Google Scholar] [CrossRef]
- Konduru, S.; Evans, M.R.; Stamps, R.H. Coconut Husk and Processing Effects on Chemical and Physical Properties of Coconut Coir Dust. Hortscience 1999, 34, 88–90. [Google Scholar] [CrossRef]
- Wen, T.; Chen, X.; Luo, Y.; Shao, L.; Niu, G. Three-Dimensional Pore Structure Characteristics of Granite Residual Soil and Their Relationship with Hydraulic Properties under Different Particle Gradation by X-Ray Computed Tomography. J. Hydrol. 2023, 618, 129230. [Google Scholar] [CrossRef]
- Luo, Y.; Wen, T.; Lin, X.; Chen, X.; Shao, L. Quantitative Analysis of Pore-Size Influence on Granite Residual Soil Permeability Using CT Scanning. J. Hydrol. 2024, 645, 132133. [Google Scholar] [CrossRef]
- Pires, L.F.; Ghanbarian, B.; Lin, Q. Physical, Topological and Hydraulic Properties of an Oxisol under Conservation Practices: X-Ray Tomography Imaging and Pore-Network Simulation. Soil Tillage Res. 2024, 239, 106055. [Google Scholar] [CrossRef]
- Wen, T.; Chen, X.; Shao, L. Effect of Multiple Wetting and Drying Cycles on the Macropore Structure of Granite Residual Soil. J. Hydrol. 2022, 614, 128583. [Google Scholar] [CrossRef]
- Sun, X.; She, D.; Fei, Y.; Wang, H.; Gao, L. Three-Dimensional Fractal Characteristics of Soil Pore Structure and Their Relationships with Hydraulic Parameters in Biochar-Amended Saline Soil. Soil Tillage Res. 2021, 205, 104809. [Google Scholar] [CrossRef]
- Qi, J.; Fei, W.; Narsilio, G.A. An LBM Study on the Local Fluid Flow in Irregular Monodisperse Granular Assemblies from DEM: Effects of Particle Shape. Comput. Geotech. 2025, 177, 106817. [Google Scholar] [CrossRef]
- Gan, L.; Fan, H.; Wu, W.; Liu, H.; Ma, F.; Niu, Y. Water Retention Parameters of Soilless-culture Substrates. Trans. Chin. Soc. Agric. Mach. 2013, 44, 113–118, 142. [Google Scholar]
- Li, B.; Zhou, H.; Wang, G.; Liu, G.; Gao, W.; Zhu, K.; Chen, C. Explore the “Transparent” Soils: Soilporelogy Has Sailed. Acta Pedol. Sin. 2023, 60, 1221–1230. [Google Scholar] [CrossRef]
- Pessoa, T.N.; Ferreira, T.R.; Pires, L.F.; Cooper, M.; Uteau, D.; Peth, S.; Vaz, C.M.P.; Libardi, P.L. X-Ray Microtomography for Investigating Pore Space and Its Relation to Water Retention and Conduction in Highly Weathered Soils. Agriculture 2023, 13, 28. [Google Scholar] [CrossRef]
- Xia, Y.; Cai, J.; Perfect, E.; Wei, W.; Zhang, Q.; Meng, Q. Fractal Dimension, Lacunarity and Succolarity Analyses on CT Images of Reservoir Rocks for Permeability Prediction. J. Hydrol. 2019, 579, 124198. [Google Scholar] [CrossRef]
- Meng, A.; Tan, Y.; Xing, C.; Lv, H.; Xiao, S. Investigation on Preferential Path of Fluid Flow by Using Topological Network Model of Permeable Asphalt Mixture. Constr. Build. Mater. 2020, 242, 118163. [Google Scholar] [CrossRef]
- Zhao, C.; Zang, Y.; Xie, P.; Xu, Z. Effects of Vortices Trapped in a Dead End on Resistance to Pore-Scale Flow. J. Pet. Sci. Eng. 2021, 207, 109177. [Google Scholar] [CrossRef]
- Wang, Y.; Li, J.; Feng, F.; Qu, C.; Tang, C.; Wang, Q.; Zhang, W.; Yan, X.; Lin, Z. Unveiling the Role of Pore Characteristics in Sludge Dewatering: Visualization by Nano-CT and Micromodel Study. Water Res. 2024, 252, 121191. [Google Scholar] [CrossRef] [PubMed]


Disclaimer/Publisher’s Note: The statements, opinions and data contained in all publications are solely those of the individual author(s) and contributor(s) and not of MDPI and/or the editor(s). MDPI and/or the editor(s) disclaim responsibility for any injury to people or property resulting from any ideas, methods, instructions or products referred to in the content. |
© 2025 by the authors. Licensee MDPI, Basel, Switzerland. This article is an open access article distributed under the terms and conditions of the Creative Commons Attribution (CC BY) license (https://creativecommons.org/licenses/by/4.0/).