Abstract
Sugar beet is a nitrogen (N)-sensitive crop, and its N regulation and utilization are critical for enhancing productivity. Sugar beet seedlings at the two-true-leaf-pair stage were hydroponically grown in an artificial climate chamber. Leaves and roots from three seedlings per treatment were sampled at 10, 20, 25, and 30 days after exposure to N treatments (N5: 5 mmol/L, N10: 10 mmol/L, N15: 15 mmol/L, and N20: 20 mmol/L) to assess the effects of N supply level on growth, photosynthesis, and carbon and nitrogen metabolism. The results revealed a time-dependent dynamics in beet biomass accumulation, with N20 inducing chlorosis and necrosis symptoms by 10 days post-treatment (DPT), resulting in the lowest biomass. While N15 significantly promoted root biomass by 30 DPT, showing a 23.70% (root dry weight, RDW) increase over N20; chlorophyll content and gas exchange parameters-net photosynthetic rate (Pn), stomatal conductance (Gs), transpiration rate (Tr) exhibited significant N dependence, with N15 maintaining high chlorophyll level (0.78 mg/g) and photosynthetic rate (220.33 μmol/(m2·s). Nitrogen assimilation, as indicated by glutamine synthetase and glutamate synthetase activity (GS and GOGAT), was stronger under N15, promoting amino acid synthesis and root growth, whereas N20 inhibited enzyme activity. Carbon metabolism analysis revealed that N15-driven sucrose synthesis significantly increased root sucrose content, sucrose phosphate synthase and sucrose synthase activity (SPS and SS), optimizing source–sink allocation. Correlation analysis showed a positive relationship between leaf and root biomass (r = 0.91), and root sucrose content was positively correlated with GOGAT activity (r = 0.90), emphasizing the synergistic regulation of C/N metabolism. On the contrary, N20 led to disrupted C/N metabolic homeostasis, inhibited enzyme activity, and C/N distribution. These results indicated that the photosynthetic output, enzyme efficiency, and sucrose distribution were coordinated by nitrogen optimization, and the growth of sugar beet seedlings was optimized.
1. Introduction
Nitrogen (N), an essential macronutrient for plants, critically regulates growth and development through its structural roles in chlorophyll biosynthesis, protein formation, and key metabolic processes [1,2]. Optimal N availability enhances photosynthetic efficiency, enzymatic activity, and nutrient assimilation, thereby improving crop productivity and quality [3,4]. The physiological integration of nitrogen status and carbon metabolism in plants regulates the photosynthetic efficiency and assimilate output capacity of source organs, as well as the receiving, utilization, and storage intensity of assimilate in sink organs. The synergy and balance of carbon and nitrogen metabolism in plant growth and organ development are an indispensable biochemical basis for constructing and maintaining efficient plant source–sink relationships [5,6,7].
The dynamic changes in C and N metabolism in plants directly affect the formation and transformation of photosynthetic products, as well as the absorption of mineral nutrients and protein synthesis [8,9]. Soluble sugars (especially sucrose) and amino acids serve as pivotal intermediates in these metabolic pathways, requiring precise coordination through integrated signaling networks to ensure proper biological activities [10]. This metabolic symbiosis operates through reciprocal resource exchange: carbon metabolism supplies essential substrates (carbon skeletons) and energy carriers (ATP/NADPH) for nitrogen assimilation, while nitrogen metabolism provides enzymatic machinery (Rubisco) and photosynthetic pigments for carbon fixation [11,12,13]. Both pathways fundamentally depend on shared redox equivalents, ATP supplies, and carbon skeleton pools, establishing C/N homeostasis as a non-negotiable prerequisite for plant growth and stress adaptation [14].
Key enzymatic regulators orchestrate this metabolic equilibrium. Following nitrogen (e.g., nitrate) reduction, glutamine synthetase (GS) and glutamate synthase (GOGAT) drive the core ammonium assimilation cycle, converting inorganic N into organic compounds of amides and amino acids, effectively bridging C and N metabolism in cells [15]. Among them, GS is particularly important for maintaining cellular N homeostasis to prevent ammonium toxicity [16]. It is also considered to be a metabolic indicator of plant drought resistance, salt resistance, and other abiotic stresses [17,18]. In parallel, sucrose phosphate synthase (SPS) and sucrose synthase (SS) govern C flux partitioning, exhibiting nitrogen-dependent activity modulation—optimal N supply enhances their catalytic efficiency, whereas deficiency or excess induces functional impairment [19,20]. Nitrogen use efficiency (NUE), defined as biomass production per unit N absorbed, emerges from this intricate metabolic coordination and serves as the physiological manifestation of C/N balance [21,22]. Maintenance of C/N homeostasis through metabolic pathway optimization represents a strategic approach for stabilizing source–sink relationships and enhancing crop productivity. Rational manipulation of these interconnected networks offers a viable solution for improving nitrogen utilization while sustaining yield stability in agricultural systems.
Sugar beet (Beta vulgaris L.) is a globally significant crop for sucrose production and bioenergy feedstock [23,24]. Unlike most crops, it exhibits a distinct separation between photosynthetic source tissues (leaves) and specialized sucrose-storing sink organs (roots), where carbon is transported and stored primarily as sucrose [25]. This physiological specialization simplifies the study of core carbon–nitrogen (C/N) interactions, positioning sugar beet as an ideal model bridging basic research and agricultural applications. Sugar beet shows special nitrogen demand during growth to drive early biomass accumulation [26], but the metabolic coordination behind this nitrogen-dependent growth has not been resolved. This study employs a controlled nitrogen supply gradient (N5-N20) to (1) analyze growth dynamics, photosynthetic performance, and physiological markers of C/N metabolism, (2) explore spatial allocation patterns of carbon metabolites (sucrose) and nitrogen assimilates (amino acids), and (3) examine specific responses of core enzymatic regulators (SPS, SS, GS, and GOGAT) to nitrogen availability, thereby elucidating the relationship among nitrogen use efficiency, dynamic C/N homeostasis, and source-to-sink resource economics in sugar beet. This research aims to provide a physiological basis for improving nitrogen use efficiency in sugar beet.
2. Materials and Methods
2.1. Experimental Materials and Culture Conditions
Sugar beet (Beta vulgaris L.) seeds (variety ‘KWS9147’) were obtained from KWS SAAT SE & Co. KGaA (Einbeck, Germany). Seeds were germinated in moist vermiculite. After 8 days, uniform seedlings were selected and transferred to modified Hoagland solution [27] with NO3− as the sole N source at concentrations of 5 mmol/L (N5), 10 mmol/L (N10), 15 mmol/L (N15), and 20 mmol/L (N20) for 10, 20, 25, or 30 days, respectively. There were 24 seedlings in each hydroponic container (35 × 25 × 14 cm), and the nutrient solution was replaced every seven days. Growth conditions maintained a 25 °C/18 °C day/night temperature regime, a 14 h photoperiod, and a light intensity of 200 μmol/(m2·s).
2.2. Measurement of Morphological Traits in Sugar Beet
Leaf and root fresh weights were recorded for seedlings across nitrogen treatments. Tissues were oven-dried at 105 °C for 30 min (enzyme denaturation), then at 75 °C to constant weight (<0.001 g/24 h variation). Dry weights were measured separately using a 0.0001 g precision balance.
2.3. Chlorophyll, Total Nitrogen, and Photosynthetic Parameter Analysis
For chlorophyll quantification, leaves (0.5 g fresh weight) were homogenized in liquid nitrogen and extracted with analytical grade 95% ethanol. Chlorophyll a (λ = 665) and chlorophyll b (λ = 649) concentrations were determined spectrophotometrically (UV-1800, Shimadzu Corporation, Kyoto, Japan), respectively, and calculated according to the following formula [28]:
In the formula, C is pigment content (mg/L); V is the volume of extraction liquid (mL); N is the dilution factor; m is the fresh weight of the sample (g); 1000 represents 1 L = 1000 mL.
For total N determination, leaf and root samples were rinsed with deionized water, oven-dried (105 °C, 30 min; then 65 °C to constant weight). Total N content was analyzed via the Kjeldahl method using 0.2 g aliquots digested in sulfuric acid (98%) with K2SO4− and CuSO4 catalyst (9:1 w/w). N quantification was performed using a Hanon K1100 automatic Kjeldahl nitrogen analyzer. Total N content was calculated as follows [27]:
In the formula, V1 represents the volume of HCl (in mL) used to titrate the sample, and V0 represents the volume of HCl (in mL) used in the blank titration. CHCl represents moles of HCl per liter. Ts accounts for dilution during distillation. M is for the mass of the sample (in grams).
Photosynthetic parameters were measured using a CI-340 portable photosynthesis system (CID Bio-Science) under controlled conditions in an artificial climate chamber [29]. Net photosynthetic rate (Pn), transpiration rate (Tr), stomatal conductance (Gs), and intercellular CO2 concentration (Ci) were recorded between 9:00 and 11:00 AM on the third pair of fully expanded true leaves (acropetal position) under stable light intensity, humidity, and carbon dioxide concentration.
2.4. Glutamine Synthetase (GS) and Glutamate Synthase (GOGAT) Activity Assays
A total of 1 g fresh sample was homogenized in extraction buffer (0.05 mol/L Tris-HCl pH 8.0, 2 mmol/L MgSO4·7H2O, 2 mmol/L DTT, 0.4 mol/L sucrose). After centrifugation, the crude enzyme solution was obtained.
For GS activity determination, reaction mixtures containing 100 μL crude extract, 80 mmol/L hydroxylamine-HCl, 40 mmol/L ATP, and 100 mM Tris-HCl (pH 7.4) were incubated at 37 °C for 30 min. The reaction was terminated by 0.2 mol/L TCA, 0.3 mol/L FeCl3, and 0.6 mol/L HCl. After centrifugation, γ-glutamyl hydroxamate formation was quantified at 540 nm. One enzyme unit (U) was defined as 0.005 ΔA540/(min∙g) fresh weight.
For GOGAT activity determination, the crude extracts were incubated at 30 °C with 20 mmol/L α-ketoglutarate, 10 mmol/L KCl, 3 mmol/L NADH, and 20 mmol/L L-glutamine in 25 mmol/L Tris-HCl (pH 7.6). NADH oxidation was monitored at 340 nm. Enzyme activity (U) was calculated as 1 nmol NADH oxidized per minute per gram of fresh weight [28].
2.5. Sucrose Quantification, and Sucrose Synthase and Sucrose Phosphate Synthase Activity Assays
A total of 0.5 g of fresh tissue was homogenized in ice-cold HEPES-NaOH buffer (pH 7.5, 1 mmol/L EDTA, 5 mM MgCl2) and centrifuged to obtain crude enzyme extract. Sucrose synthase (SS) activity was assayed in reactions containing 50 mmol/L HEPES-NaOH (pH 7.5), 50 mmol/L MgCl2, 100 mmol/L UDP-glucose, and 100 mmol/L fructose (substituted with 100 mmol/L fructose-6-phosphate for sucrose phosphate synthase (SPS)), incubated at 30 °C for 30 min. Reactions were terminated with 2 mol/L NaOH, boiled for 10 min, and quantified at 480 nm using resorcinol reagent (0.1% in 30% HCl). One enzyme unit (U) represented 1 μmol/L sucrose synthesized per min per mg protein. At the same time, the crude enzyme solution was taken, and 2 mol/L NaOH was added. The following was the same as the above operation to determine the sucrose content [28].
2.6. Statistical Analysis
Data from three biological replicates per treatment/time point (three technical replicates) are expressed as mean ± SD. Normality and homogeneity of variance were confirmed prior to one-way ANOVA using SPSS 26.0. Fisher’s LSD post hoc tests identified significant inter-treatment differences (p < 0.05, 95% CI). Correlation analyses and visualizations employed Origin 8.0 and GraphPad Prism 10.0.
3. Results
3.1. Nitrogen-Dependent Growth Regulation in Sugar Beet Seedlings
Nitrogen availability induced distinct temporal patterns in leaf and root biomass accumulation (Figure 1 and Figure 2; Table S1). At early stages (10 days post-treatment, DPT), significant biomass variations were observed among treatments (N20 < N5 < N10 < N15, p < 0.05), with N20 showing the lowest biomass. Between 20 and 25 DPT, nitrogen concentration exhibited no significant differential effects on biomass accumulation (p < 0.05). By 30 DPT, compared with N5/N10 treatment, N15 and N20 treatments significantly increased leaf dry weight (63.54%, 74.44% and 50.52%, 60.56%)/fresh weight (79.41%, 89.07% and 79.25%, 88.89%) and root fresh weight (40.71%, 60.56% and 12.42%, 28.35%), but there was no significant difference in root dry weight among treatments.
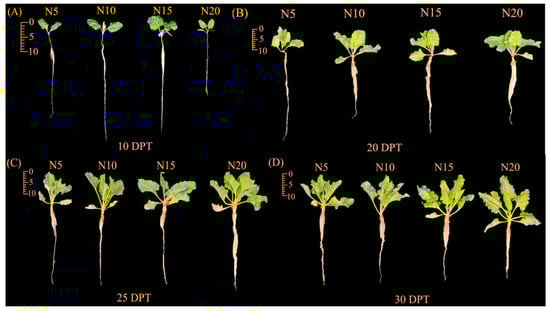
Figure 1.
Phenotypic changes in sugar beet seedlings under different nitrogen treatments at 10 (A), 20 (B), 25 (C), and 30 (D) days post-treatment (DPT).
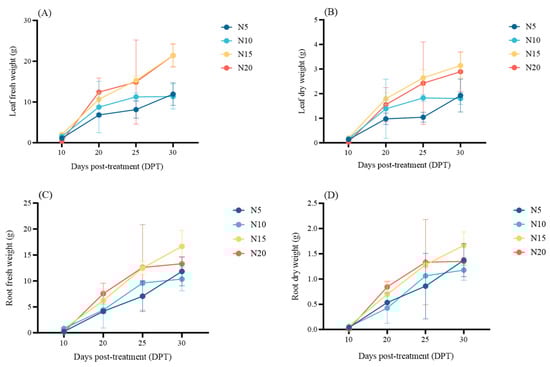
Figure 2.
Effects of different nitrogen treatments on leaf fresh weight (A) and dry weight (B), and root fresh weight (C) and dry weight (D) of sugar beet at 10, 20, 25, and 30 DPT.
Overall, before 25 DPT, biomass accumulation showed a positive correlation with nitrogen supply. However, by 30 DPT, the contribution of N15 to root biomass accumulation was greater than that of N20 and other treatments. This suggests N15 optimally promoted leaf and root growth by 20 DPT. Conversely, N20 likely caused nitrate over-reduction, leading to ammonium accumulation, triggering toxicity that suppressed biomass accumulation.
3.2. Nitrogen-Mediated Regulation of Photosynthetic Performance
3.2.1. Changes in Chlorophyll Content
Chlorophyll a, b, and total content exhibited N-dose and time-dependent accumulation patterns (Figure 3). During early stages (10–20 DPT), chlorophyll levels followed the hierarchy N20 < N5 < N10 < N15 (p < 0.05). By 30 DPT, this trend was reversed, and N20 reached the highest chlorophyll content of 2.4177 mg/g (p < 0.05). The changes in chlorophyll content in beet seedlings likely reflect their adaptive mechanisms to different N levels.
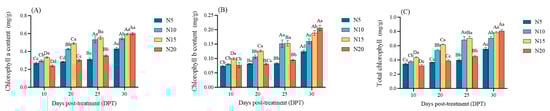
Figure 3.
Changes in chlorophyll a (A), chlorophyll b (B), and total chlorophyll (C) contents in sugar beet under different nitrogen treatments at 10, 20, 25, and 30 DPT. Different lowercase letters indicate that there are significant differences in different nitrogen concentrations on the day; different capital letters indicated that the same N concentration was significantly different at different times, p < 0.05.
3.2.2. Gas Exchange Parameters
Gas exchange dynamics revealed N-dependent photosynthetic acclimation in sugar beet leaves (Figure 4, Table S2). At 10 DPT, N15 exhibited superior photosynthetic performance, with net photosynthetic rate (Pn), transpiration rate (Tr), and stomatal conductance (Gs) significantly exceeding other treatments (p < 0.05). Intercellular CO2 concentration (Ci) exhibited a significant positive correlation with N level (p < 0.05).
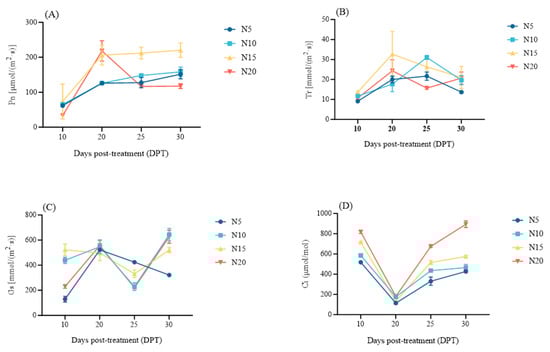
Figure 4.
Dynamics of photosynthetic parameters in sugar beet under differential nitrogen supplies at 10, 20, 25, and 30 DPT. (A) net photosynthetic rate (Pn), (B) transpiration rate (Tr), (C) stomatal conductance (Gs), (D) intercellular CO2 concentration (Ci).
From 20 to 30 DPT, Pn increased in N5-N15 (+20.37%, +25.66%, +6.79%; N15 > N10 > N5) but decreased 46.10% in N20. Ci accumulated proportionally to the N supply across treatments. Transpiration rate (Tr) peaked at 25 DPT in N5/N10 (22.33/31 mmol/(m2·s)) versus 20 DPT in N15/N20 (32.67/24.33 mmol/(m2·s)). By 30 DPT, Tr converged in N10-N20 while N5 remained significantly lower (p < 0.05). Stomatal conductance (Gs) at 20 DPT increased sharply in N5/N10/N20 (+303.87%, +19.33%, +142.47% vs. 10 DPT) but declined in N15 (−4.91%). Subsequent dynamics showed N5 continuously declining while others rebounded to maxima at 30 DPT (N10:643.67 > N20:627 > N15:521.33 μmol/(m2·s)).
3.3. Nitrogen Metabolism Regulation of Sugar Beet Under Different Nitrogen Supply
3.3.1. Nitrogen Content
As shown in Figure 5, N content in both leaves and roots peaked at 10 DPT across all treatments. Subsequently, the nitrogen contents in the leaves of each treatment were significantly reduced after 20 DPT, which was reduced by 39.29%, 32.77%, 32.89%, and 24.57%, respectively, compared with 10 DPT (p < 0.05), and then each treatment was significantly increased; during the whole treatment period, N20 maintained nitrogen advantage. In roots, N content in N20 was significantly higher than in other treatments on 20 DPT (p < 0.05); however, its advantage diminished progressively, with all treatments converging to stable levels by 30 DPT (N20 > N15 > N10 > N5).
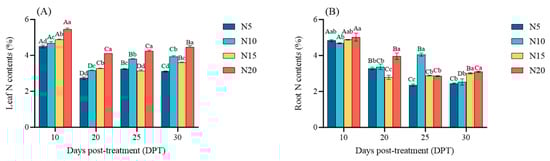
Figure 5.
Nitrogen allocation in sugar beet under varying nitrogen supply at 10, 20, 25, and 30 DPT: (A) leaf nitrogen content, and (B) root nitrogen content. Different lowercase letters indicate that there are significant differences in different nitrogen concentrations on the day; different capital letters indicated that the same N concentration was significantly different at different times, p < 0.05.
3.3.2. Glutamine Synthetase (GS) and Glutamate Synthase (GOGAT) Activity
In leaves, GS activity generally decreased over time and was positively correlated with N supply levels; by 30 DPT, no significant differences in GS activity were observed among the N treatments (Figure 6A). In roots, N15 reached the peak at 20 DPT, which was 47.33 U/g, and the GS activity of the other treatments decreased gradually. Compared with 10 DPT, it decreased by 13.98%, 13.40%, and 16.29%; GS activity followed the order: N15 > N20 > N10 > N5 until 25 DPT; by 30 DPT, GS activity of N20 was the lowest, 7.3 U/g (Figure 6B).
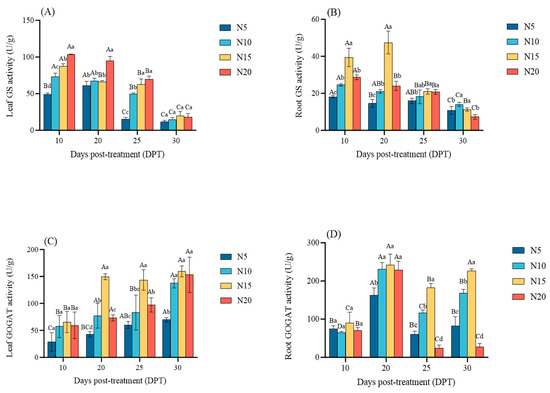
Figure 6.
Nitrogen-dependent regulation of nitrogen assimilation enzymes in sugar beet at 10, 20, 25, and 30 DPT. (A) leaf glutamine synthetase (GS) activity, (B) root GS activity, (C) leaf glutamate synthase (GOGAT) activity, (D) root GOGAT activity. Different lowercase letters indicate that there are significant differences in different nitrogen concentrations on the day; different capital letters indicated that the same N concentration was significantly different at different times, p < 0.05.
In leaves, GOGAT activity increased over time, with N15 consistently showing significantly higher activity than other treatments, while N5 maintained the lowest; by 30 DPT, GOGAT activity in N10 and N20 was similar to that in N15 (Figure 6C). In roots, N15 consistently showed the highest GOGAT activity; GOGAT activity peaked on 20 DPT for all treatments. Compared with 10 DPT, it increased by 117.82%, 256.03%, 170%, and 251.42%, respectively (N15/N10/N20 > N5, p < 0.05). By 25 DPT, GOGAT activity in the N20 declined sharply, and compared with 20DPT, it is reduced by 89.31%, with activity levels following the order: N15 > N10 > N5 > N20 (Figure 6D). This may be due to the GS/GOGAT feedback inhibition caused by high nitrogen levels, which results in a decrease in N20 nitrogen metabolism efficiency.
3.4. Carbon Metabolism of Sugar Beet Under Different Nitrogen Supply
3.4.1. Sucrose Accumulation
Sucrose content in the leaves of sugar beet peaked at 20 DPT. Compared with 10 DPT, it increased by 86.02%, 62.70%, 36.46%, and 9.92%, respectively, with significant differences observed among the nitrogen treatments (N20 < N15 < N10 < N5, p < 0.05) (Figure 7A). In roots, no significant differences in sucrose content were observed at 10 DPT; however, from 20 DPT onward, sucrose content in N10 and N15 increased significantly, particularly in N15, Compared with 10 DPT, it increased by 195.01% (N5 < N20 < N10 < N15, p < 0.05) (Figure 7B).
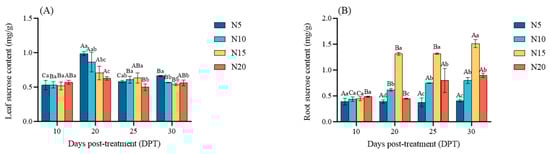
Figure 7.
Sucrose accumulation profiles in response to nitrogen availability at 10, 20, 25, and 30 DPT: (A) leaf sucrose content, and (B) root sucrose content. Different lowercase letters indicate that there are significant differences in different nitrogen concentrations on the day; different capital letters indicated that the same N concentration was significantly different at different times, p < 0.05.
3.4.2. Sucrose Synthase (SS) and Sucrose Phosphate Synthase (SPS) Activity
In leaves, SS activity showed little difference across treatments at 10 DPT; however, after 20 DPT, SS activity increased, especially in the N5, which was significantly higher than in the other treatments (p < 0.05). It reached the peak at 25 DPT, which was 59.93 mg sucrose/g FW/h. Then, it was balanced with other treatments at 30 DPT (Figure 8A). In roots, SS activity maintained a persistent pattern of N15 > N20 > N10 > N5 (p < 0.05), with particularly high activity in N15 and N20. At 30DPT, it was 184.81%, 137.53% and 42.55%, and 18.88% higher than N5 and N10, respectively (Figure 8B).
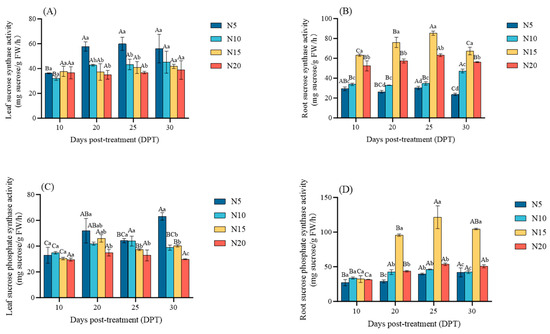
Figure 8.
Changes in sucrose synthase activity (SS), sucrose phosphate synthase activity (SPS) in sugar beet leaves (A,C) and roots (B,D) under different nitrogen treatments at 10, 20, 25, and 30 DPT, respectively. Different lowercase letters indicate that there are significant differences in different nitrogen concentrations on the day; different capital letters indicated that the same N concentration was significantly different at different times, p < 0.05.
From 10 to 30 DPT, SPS activity significantly increased in all treatments (p < 0.05) except N20 in leaves, with N5 showing superior activity and N20 displaying suppression. At 30 DPT, SPS activity in N5 leaves was 111.21% higher than that in N20 leaves (Figure 8C). In roots, SPS activity increased in both N15 and N20, with N15 exhibiting the significantly highest (p < 0.05), followed by N20, N10, and N5. At 30 DPT, the SPS activity in roots of N15 was 106.38% higher than that of N20 (Figure 8D). This may be because N15 improves the catalytic efficiency of SS and SPS and promotes the distribution of carbon flux, while N20 leads to functional damage due to excessive nitrogen, and the efficiency of carbon metabolism is reduced.
3.5. Carbon and Nitrogen Metabolic Network Coordination
The correlation matrix revealed systematic interactions between photosynthetic performance, nitrogen assimilation, and carbon distribution (Figure 9). The coordination between leaf dry weight (LDW) and root dry weight (RDW) exhibited strong source–sink coupling (r = 0.91, p < 0.01), both positively regulated by photosynthetic capacity (total chlorophyll (Chl): r = 0.83/0.66; net photosynthetic rate (Pn): r = 0.73/0.65, p < 0.01) yet negatively influenced by root nitrogen content (RNC, r = −0.72/−0.75). Leaf GOGAT activity (FGOGAT) enhanced LDW and RDW (r = 0.82/0.66) while leaf GS activity (LGS) suppressed LDW (r = −0.50). Root sucrose content (RSC) and sucrose phosphate synthase (RSPS) activity strongly correlated with biomass parameters (LDW: r = 0.75 and 0.70; RDW: r = 0.59 and 0.63, respectively; p < 0.05 or p < 0.01).
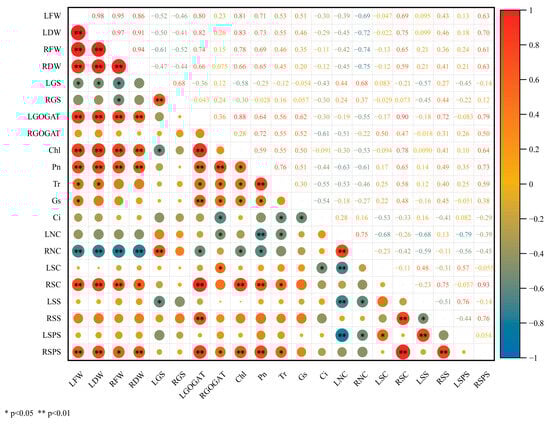
Figure 9.
Correlation analysis of measured phenotypic and physiological parameters. Red/blue circles denote positive/negative Pearson correlation coefficients; asterisks indicate significance levels (* p < 0.05, ** p < 0.01). LFW, leaf fresh weight; LDW, leaf dry weight; RFW, root fresh weight; RDW, root dry weight; LGS, leaf GS activity; RGS, root GS activity; LGOGAT, leaf GOGAT activity; RGOGAT, root GOGAT activity; Chl, total chlorophyll; Pn, net photosynthetic rate; Tr, transpiration rate; Gs, stomatal conductance; Ci, intercellular CO2 concentration; LNC, leaf nitrogen content; RNC, root nitrogen content; LSC, leaf sucrose content; RSC, root sucrose content; LSS, leaf SS activity; RSS, root SS activity; LSPS, leaf SPS activity; RSPS, root SPS activity.
Enzymatic coordination between organs emerged as a negative leaf–root sucrose synthase (LSS-RSS) activity correlation (r = −0.51), a positive SS-SPS synergy (r = 0.76), and a positive RSPS linkage with photosynthetic parameters (Chl: r = 0.64; Pn: r = 0.73; p < 0.01). Carbon–nitrogen metabolism interacted with each other through: LGS inhibition of photosynthetic components (Chl: r = −0.58; FSS: r = −0.57), LGOGAT coordination with multiple processes (Chl: r = 0.88; RSS: r = 0.72; p < 0.01), and RNC suppression of photosynthetic-sucrose metabolism (r = −0.53 to −0.61 for key parameters). Spatial allocation patterns revealed that leaf nitrogen content (LNC) and RNC positively correlated (r = 0.75) but inhibited sucrose metabolism. RSC coordinated with LGOGAT (r = 0.90) and Pn (r = 0.78), and leaf sucrose content (LSC) reflected compensatory GS-SPS interactions (r = 0.57) and carboxylation limitation (r = −0.53 with Ci). It seems that sugar beet promotes growth through synchronized enhancement of photosynthetic carbon allocation (r = 0.64–0.93) and nitrogen assimilation efficiency (r = 0.66–0.82).
4. Discussion
The observed growth dynamics under differential nitrogen supplies reveal a time-dependent optimization strategy governed by metabolic plasticity. Initial biomass suppression in N5 and N10 is likely due to insufficient N availability for protein synthesis and chloroplast development [30]. However, at 30 DPT, the root biomass accumulation in N15 surpassed that in N20 (Figure 2; Table S1). This observation supports the “luxury consumption” phenomenon, where excessive nitrogen initially causes early-stage “burning” but ultimately enhances photosynthetic gains in later stages [31]. Photosynthetic parameters, including chlorophyll content and gas exchange (Pn, Gs, and Tr), exhibited strong N-dose dependency [32]. N15 promoted sustained chlorophyll accumulation and superior photosynthetic rates, particularly in later stages, suggesting enhanced light-harvesting and CO2 assimilation efficiency [33]. Notably, N20’s transient chlorophyll surge by 30 DPT coincided with reduced stomatal conductance (Gs) (Figure 3 and Figure 4; Table S2), hinting at osmotic stress or feedback inhibition under excessive N [34]. These trends highlight a specific N-dependent physiological regulation: the growth advantage of beet is likely dependent on a balanced N supply that maximizes photosynthetic output [35]. The enhancement of GS/GOGAT activities possibly contributes to improved amino acid synthesis and N transport, thereby promoting root growth. Carbon metabolism reflects this balance, as N-driven activation of SPS and SS activation in roots enhances sucrose synthesis, optimizing source-to-sink translocation. The strong correlation between leaf-root biomass (r = 0.91) and the link between glutamate synthase activity in leaves and photosynthesis (FGOGAT-Pn, r = 0.64) emphasize the C/N co-regulation in sustaining growth (Figure 9).
The spatiotemporal distribution of sucrose and nitrogen compounds reveals a sink-driven resource economy. Under N15, the N accumulation efficiency of sugar beet was significant at the early stage at 10 DPT. At 20–30 DPT, the unit N content in leaves and roots gradually decreased and tended to be stable. At the same time, the sucrose content in roots increased sharply at 20 DPT and reached the maximum at 30 DPT (Figure 5 and Figure 7). This transition reflects a strategic reassignment: the aboveground part initially acts as N “sinks” for rapid growth, while the belowground part later prioritizes C storage (sucrose) and N retention to enhance nutrient uptake and stress resilience. Notably, root sucrose content under N15 correlated positively with leaf GOGAT activity (r = 0.90) and photosynthetic parameters (Pn, r = 0.65) (Figure 9), indicating that efficient N assimilation fuels C fixation and sucrose export to roots [36]. Conversely, the negative correlation between leaf N content and root sucrose synthase activity (r = −0.68) suggests that excessive leaf N may redirect resources away from C metabolism, disrupting source–sink coordination. These patterns align with the “functional equilibrium hypothesis,” where plants balance C and N allocation to optimize growth under fluctuating nutrient availability [37,38].
SPS, SS, GS, and GOGAT are key enzymes for N-mediated C/N regulation [39,40,41]. Under nitrate supply, N15 specifically enhanced root SPS and SS activities, driving sucrose synthesis and storage. This enzymatic activation likely improved sink strength, evidenced by the root sucrose-SPS activity correlation (r = 0.93) (Figure 9). Concurrently, sustained high GS/GOGAT activity in N15-treated roots facilitated efficient assimilation of reductively generated ammonium into glutamine/glutamate pools, supporting amino acid biosynthesis and nitrogen recycling. Contrastingly, GS activity in leaves negatively correlated with sucrose synthase (r = −0.57), suggesting compartmentalized roles: root GS supports N assimilation for growth, while leaf GS may regulate N remobilization during senescence [42]. The synergy between GOGAT and photosynthetic trait (Tr) (r = 0.56) further highlights how N assimilation enzyme directly influences C metabolism processes. However, N20’s decline in GS/GOGAT activity indicates enzymatic sensitivity to N excess, potentially triggering metabolic feedback loops that impair NUE [43]. These findings provide a physiological basis for the precise management of nitrogen and the improvement of nitrogen use efficiency. Future work should explore molecular drivers and field validation to link physiological insights with agronomic practices. In addition, studying the C/N signaling pathway can reveal the regulatory mechanisms behind the observed enzyme and metabolic plasticity.
5. Conclusions
This study suggests that sugar beet seedlings may prioritize nitrogen assimilation (GS/GOGAT activation) in the early growth stage (10–20 DPT) to promote photosynthesis mechanisms, and shift to carbon sink-driven carbon partitioning (SPS/SS mediated sucrose synthesis) in the later stage (25–30 DPT). N15 (15 mmol/L) sustained this dynamic equilibrium: N15 promoted photosynthetic output, SS/SPS activity, and nitrogen assimilation efficiency by increasing the “flow” of photosynthesis from leaves (source) to roots (sink); by increasing the GS/GOGAT activity in roots, it promotes C skeleton supply to store sucrose, thereby maintaining C/N homeostasis, preventing metabolic toxicity and optimizing seedling growth. However, N20 caused yellowing and necrosis of seedlings due to nitrogen overload in the early stage (10 DPT), and excessive chlorophyll accumulation in the late stage (30 DPT) inhibited GOGAT activity and destroyed sucrose distribution, resulting in C/N metabolism disorder. These findings provide a physiological basis for improving nitrogen use efficiency by adjusting nitrogen fertilizer input and internal carbon and nitrogen metabolism rhythm in the future.
Supplementary Materials
The following supporting information can be downloaded at: https://www.mdpi.com/article/10.3390/agriculture15121273/s1, Table S1: Effects of different nitrogen treatments on leaf fresh weight and dry weight, and root fresh weight and dry weight of sugar beet at 10, 20, 25, and 30 DPT; Table S2: Table S2 The effects of net photosynthetic rate (Pn), transpiration rate (Tr), stomatal conductance (Gs) and intercellular CO2 concentration (Ci) on sugar beet leaf under different nitrogen treatments.
Author Contributions
Conceptualization, D.L. and K.C.; methodology, K.C. and L.X.; software, K.C., M.C. and Y.Z.; validation, K.C. and X.L.; formal analysis, K.C.; data curation, K.C.; writing—original draft preparation, K.C.; writing—review and editing, D.L. and K.C.; visualization, Q.B. and W.X.; supervision, D.L. and H.W.; funding acquisition, D.L. and W.X. All authors have read and agreed to the published version of the manuscript.
Funding
The Heilongjiang Provincial Natural Science Foundation of China (LH2023C090), and the Earmarked Fund (CARS-17), the Inner Mongolia Autonomous Region “The Open Competition Mechanism to Select the Best Candidates” project entitled “Creation of Elite Beet Germplasm and Breeding of Varieties Suitable for Mechanized Operation” (2022JBGS0029), the Precision Identification Project of Germplasm Resources (19240700).
Data Availability Statement
The original contributions presented in this study are included in the article/Supplementary Material. Further inquiries can be directed to the corresponding authors.
Acknowledgments
We appreciate the support from the Tianchi Program and Sugar Beet Breeding Research Project.
Conflicts of Interest
The authors declare no conflicts of interest.
References
- Kraiser, T.; Gras, D.E.; Gutiérrez, A.G.; González, B.; Gutiérrez, R.A. A holistic view of nitrogen acquisition in plants. J. Exp. Bot. 2011, 62, 1455–1466. [Google Scholar] [CrossRef] [PubMed]
- Nacry, P.; Bouguyon, E.; Gojon, A. Nitrogen acquisition by roots: Physiological and developmental mechanisms ensuring plant adaptation to a fluctuating resource. Plant Soil 2013, 370, 1–29. [Google Scholar] [CrossRef]
- Adhikari, C.; Bronson, K.F.; Panuallah, G.M.; Regmi, A.P.; Saha, P.K.; Dobermann, A.; Olk, D.C.; Hobbs, P.R.; Pasuquin, E. On-farm soil N supply and N nutrition in the rice–wheat system of Nepal and Bangladesh. Field Crops Res. 1999, 64, 273–286. [Google Scholar] [CrossRef]
- Guo, S.; Zhou, Y.; Shen, Q.; Zhang, F. Effect of ammonium and nitrate nutrition on some physiological processes in higher plants-growth, photosynthesis, photorespiration, and water relations. Plant Biol. 2007, 9, 21–29. [Google Scholar] [CrossRef]
- Chikov, V.; Bakirova, G. Relationship between carbon and nitrogen metabolisms in photosynthesis. The role of photooxidation processes. Photosynthetica 2000, 37, 519–527. [Google Scholar] [CrossRef]
- Liu, H.; Gao, X.; Fan, W.; Fu, X. Optimizing carbon and nitrogen metabolism in plants: From fundamental principles to practical applications. J. Integr. Plant Biol. 2025, 67, 1447–1466. [Google Scholar] [CrossRef]
- Kusano, M.; Fukushima, A.; Redestig, H.; Kazuki, S. Metabolomic approaches toward understanding nitrogen metabolism in plants. J. Exp. Bot. 2011, 62, 1439–1453. [Google Scholar] [CrossRef]
- Liu, X.; Yin, C.; Xiang, L.; Jiang, W.; Xu, S.; Mao, Z. Transcription strategies related to photosynthesis and nitrogen metabolism of wheat in response to nitrogen deficiency. BMC Plant Biol. 2020, 20, 448. [Google Scholar] [CrossRef]
- Otori, K.; Tanabe, N.; Maruyama, T.; Sato, S.; Yanagisawa, S.; Tamoi, M.; Shigeoka, S. Enhanced photosynthetic capacity increases nitrogen metabolism through the coordinated regulation of carbon and nitrogen assimilation in Arabidopsis thaliana. J. Plant Res. 2017, 130, 909–927. [Google Scholar] [CrossRef]
- Nunes-Nesi, A.; Fernie, A.R.; Stitt, M. Metabolic and signaling aspects underpinning the regulation of plant carbon nitrogen interactions. Mol. Plant 2010, 3, 973–996. [Google Scholar] [CrossRef]
- Sweetlove, L.J.; Beard, K.F.M.; Nunes-Nesi, A.; Fernie, A.R.; Ratcliffe, R.G. Not just a circle: Flux modes in the plant TCA cycle. Trends Plant Sci. 2010, 15, 462–470. [Google Scholar] [CrossRef] [PubMed]
- Erdal, S. Melatonin promotes plant growth by maintaining integration and coordination between carbon and nitrogen metabolisms. Plant Cell Rep. 2019, 38, 1001–1012. [Google Scholar] [CrossRef] [PubMed]
- Paul, M.J.; Pellny, T.K. Carbon metabolite feedback regulation of leaf photosynthesis and development. J. Exp. Bot. 2003, 54, 539–547. [Google Scholar] [CrossRef]
- Lawlor, D.W. Carbon and nitrogen assimilation in relation to yield: Mechanisms are the key to understanding production systems. J. Exp. Bot. 2002, 53, 773–787. [Google Scholar] [CrossRef] [PubMed]
- Zhong, C.; Cao, X.; Hu, J.; Zhu, L.; Zhang, J.; Huang, J.; Jin, Q. Nitrogen metabolism in adaptation of photosynthesis to water stress in rice grown under different nitrogen levels. Front. Plant Sci. 2017, 8, 1079. [Google Scholar] [CrossRef]
- Bao, A.; Zhao, Z.; Ding, G.; Shi, L.; Xu, F.; Cai, H. Accumulated expression level of cytosolic glutamine synthetase 1 gene (OsGS1;1 or OsGS1;2) alter plant development and the carbon-nitrogen metabolic status in rice. PLoS ONE 2014, 9, e95581. [Google Scholar] [CrossRef]
- Nagy, Z.; Németh, E.; Guóth, A.; Bona, L.; Wodala, B.; Pécsváradi, L. Metabolic indicators of drought stress tolerance in wheat: Glutamine synthetase isoenzymes and Rubisco. Plant Physiol. Biochem. 2013, 67, 48–54. [Google Scholar] [CrossRef]
- Teixeira, J.; Pereira, S. High salinity and drought act on an organ-dependent manner on potato glutamine synthetase expression and accumulation. Environ. Exp. Bot. 2007, 60, 121–126. [Google Scholar] [CrossRef]
- Zhang, L.; Sun, S.; Liang, Y.; Li, B.; Ma, S.; Wang, Z.; Ma, B.; Li, M. Nitrogen levels regulate sugar metabolism and transport in the shoot tips of crabapple plants. Front. Plant Sci. 2021, 12, 626149. [Google Scholar] [CrossRef]
- Li, Y.; Lv, Y.; Lian, M.; Peng, F.; Xiao, Y. Effects of combined glycine and urea fertilizer application on the photosynthesis, sucrose metabolism, and fruit development of peach. Sci. Hortic. 2021, 289, 110504. [Google Scholar] [CrossRef]
- Coruzzi, G.M.; Zhou, L. Carbon and nitrogen sensing and signaling in plants: Emerging ‘matrix effects’. Curr. Opin. Plant Biol. 2001, 4, 247–253. [Google Scholar] [CrossRef]
- Krapp, A.; Traong, H.N. Regulation of C/N interaction in model plant species. J. Crop Improv. 2006, 15, 127–173. [Google Scholar] [CrossRef]
- Geng, G.; Yang, J. Sugar beet production and industry in China. Sugar Tech 2015, 17, 13–21. [Google Scholar] [CrossRef]
- Simões, W.L.; Yuri, J.E.; Guimarães, M.J.M.; Santos, J.D.; Araújo, E.F.J. Beet cultivation with saline effluent from fish farming. Rev. Bras. Eng. Agrícola Ambient. 2016, 20, 62–66. [Google Scholar] [CrossRef]
- Xing, X.; Dong, S.; Guo, M.; Wei, L.; Shi, S. Optimizing Nitrogen Application Enhances Sugar Beet (Beta vulgaris L.) Productivity by Modulating Carbon and Nitrogen Metabolism. Agronomy 2025, 15, 1142. [Google Scholar] [CrossRef]
- Su, J.; Zhou, H.; Wang, K.; Fan, H.; Hou, Z. Effects of nitrogen fertilizer management on dry matter accumulation and yield of drip-irrigated sugar beet in arid areas. Agronomy 2016, 14, 1010. [Google Scholar] [CrossRef]
- Li, J.; Li, W.; Xu, L.; Wang, M.; Zhou, Q.; Li, S.; Tan, W.; Wang, Q.; Xing, W.; Liu, D. Acclimation of sugar beet in morphological, physiological and BvAMT1. 2 expression under low and high nitrogen supply. PLoS ONE 2022, 17, e0278327. [Google Scholar] [CrossRef] [PubMed]
- Wang, K.; Huang, J. Principle and Technology of Plant Physiological and Biochemical Experiments; China Higher Education Publishing House: Beijing, China, 2015. [Google Scholar]
- Ignatova, L.K.; Novichkova, N.S.; Mudrik, V.A.; Lyubimov, V.U.; Ivanov, B.N.; Romanova, A.K. Growth, photosynthesis, and metabolism of sugar beet at an early stage of exposure to elevated CO2. Russ. J. Plant Physiol. 2005, 52, 158–164. [Google Scholar] [CrossRef]
- Mu, X.; Chen, Y. The physiological response of photosynthesis to nitrogen deficiency. Plant Physiol. Biochem. 2021, 158, 76–82. [Google Scholar] [CrossRef]
- Xiong, Q.; Tang, G.; Zhong, L.; He, H.; Chen, X. Response to nitrogen deficiency and compensation on physiological characteristics, yield formation, and nitrogen utilization of rice. Front. Plant Sci. 2018, 9, 1075. [Google Scholar] [CrossRef]
- Oner, F. Effects of nitrogen doses on stomatal characteristics, chlorophyll content, and agronomic traits in wheat (Triticum aestivum L.). PeerJ 2024, 212, e18792. [Google Scholar] [CrossRef] [PubMed]
- Jiang, L.; Dong, D.; Gan, X.; Wei, S. Photosynthetic efficiency and nitrogen distribution under different nitrogen management and relationship with physiological N-use efficiency in three rice genotypes. Plant Soil 2005, 271, 321–328. [Google Scholar] [CrossRef]
- Mostafa, H.H.A.; Li, B.; Zhu, X.; Song, C. Nitrogen assimilation under osmotic stress in maize (Zea mays L.) seedlings. Plant Growth Regul. 2021, 94, 87–99. [Google Scholar] [CrossRef]
- Gu, J. Optimizing irrigation and nitrogen regimes in rice plants can contribute to achieving sustainable rice productivity. Agronomy 2023, 13, 2495. [Google Scholar] [CrossRef]
- Wang, L.; Ruan, Y.L. Shoot-root carbon allocation, sugar signalling and their coupling with nitrogen uptake and assimilation. Funct. Plant Biol. 2015, 43, 105–113. [Google Scholar] [CrossRef] [PubMed]
- Hartmann, H.; Bahn, M.; Carbone, M.; Richardson, A.D. Plant carbon allocation in a changing world-challenges and progress. New Phytol. 2020, 227, 981–988. [Google Scholar] [CrossRef]
- Zhang, J.; He, N.; Liu, C.; Xu, L.; Chen, Z.; Li, Y.; Wang, R.; Yu, G.; Sun, W.; Xiao, C.; et al. Variation and evolution of C: N ratio among different organs enable plants to adapt to N-limited environments. Glob. Change Biol. 2020, 26, 2534–2543. [Google Scholar] [CrossRef]
- Cun, Z.; Li, X.; Zhang, J.Y.; Hong, J.; Gao, L.; Yang, J.; Ma, S.; Chen, J. Identification of candidate genes and residues for improving nitrogen use efficiency in the N-sensitive medicinal plant Panax notoginseng. BMC Plant Biol. 2024, 24, 105. [Google Scholar] [CrossRef]
- Matiolli, C.C.; Soares, R.C.; Alves, H.L.S.; Abreu, I.A. Turning the knobs: The impact of post-translational modifications on carbon metabolism. Front. Plant Sci. 2022, 12, 781508. [Google Scholar] [CrossRef]
- Mahboob, W.; Yang, G.; Irfan, M. Crop nitrogen (N) utilization mechanism and strategies to improve N use efficiency. Acta Physiol. Plant. 2023, 45, 52. [Google Scholar] [CrossRef]
- Havé, M.; Marmagne, A.; Chardon, F.; Masclaux-Daubresse, C.; Notes, A. Nitrogen remobilization during leaf senescence: Lessons from Arabidopsis to crops. J. Exp. Bot. 2017, 68, 2513–2529. [Google Scholar] [PubMed]
- Fortunato, S.; Nigro, D.; Lasorella, C.; Marcotuli, I.; Gadaleta, A.; Pinto, M.C. The role of glutamine synthetase (GS) and glutamate synthase (GOGAT) in the Improvement of nitrogen use efficiency in cereals. Biomolecules 2023, 13, 1771. [Google Scholar] [CrossRef] [PubMed]
Disclaimer/Publisher’s Note: The statements, opinions and data contained in all publications are solely those of the individual author(s) and contributor(s) and not of MDPI and/or the editor(s). MDPI and/or the editor(s) disclaim responsibility for any injury to people or property resulting from any ideas, methods, instructions or products referred to in the content. |
© 2025 by the authors. Licensee MDPI, Basel, Switzerland. This article is an open access article distributed under the terms and conditions of the Creative Commons Attribution (CC BY) license (https://creativecommons.org/licenses/by/4.0/).