Abstract
Climate change has a complex impact on the agricultural crop system, with knowledge of the processes being necessary to assist decisions that guide the adaptation of society to profound structural changes. This study aims to highlight the main changes generated by the modification of climatic parameters (increasing air temperature, humidity and precipitation and decreasing wind speed) on agricultural crops in a region with important changes in its economic profile due to urban extension and land use modification. The analysis methodology is based on the Cropwat software to highlight the temporal variability of crop evapotranspiration, effective rain and water requirements for different crops—strawberry, sunflower and pea—and the possibility of using other types of crops with higher yield and lower water needs. The methodology used highlights this fact, showing that major changes are needed in the choice of crop schemes and future technological processes in the current context of climate change. The current results of the study, conducted over a period of 30 years (1991–2020), showed that the climatic, land use and economic changes in the study area have led to a decrease in evapotranspiration and crop water requirements due to the amounts of precipitation that can provide for the water needs of strawberry, sunflower and pea crops. The irrigation requirements during the analysis period 1991–2020 varied from <10 mm/year to 120 mm/year for strawberry crops, and can exceed 300 mm/year for sunflower and pea crops, having higher values in years with a precipitation deficit (effective rain less than 100 mm). Analyzing the irrigation requirements during the vegetation growing seasons shows that for pea and strawberry the trend is decreasing, but without a significance level. Only for the sunflower crop is an increasing trend recorded in the initial and late stages. The results obtained provide a methodological framework as well as concrete information for decision-makers in the field of agriculture who must build adaptation mechanisms for climate challenges.
1. Introduction
The agricultural sector has been constantly undergoing technological modernization in order to increase productivity. Initially, machines with high power and capacity were used to process the land and crops, largely eliminating manual labor. The 1980s brought the use of GPS technology, which laid the foundation for precision agriculture. The emergence of Internet of Things (IoT) devices and sensor technologies ushered in an era of real-time data collection from fields, allowing farmers to comprehensively observe soil conditions, crop health and weather patterns [,]. In present times, the technologies for processing large volumes of data are robotics, drones, artificial intelligence and machine learning, and they provide the tools necessary to optimize agricultural processes [,,,].
Changes in climatic conditions and the appearance of anomalies in the distribution of precipitation lead to major risks for farmers, and new methods are currently being used to anticipate some climatic phenomena and adapt to new crop patterns [,,].
As such, the allocation of water resources among consumers poses a major problem for the agricultural sector. Evapotranspiration (ET) is an important component of the surface hydrological cycle and energy exchange, which also constitutes a vital link between soil–plant–atmosphere. The natural distribution of precipitation, the hydrological regime of water bodies and the water needs of crops must be allocated in such a way as to obtain agricultural production that satisfies the quantitative and qualitative demand of the consumer.
At the same time, the change in land use has a reducing effect on the quantities of agricultural products delivered to the consumer. In recent years, the freshness of the products delivered has been a major problem, with consumers trying to avoid processed products as well as the carbon footprint of these products. The latter is generated mainly by the energy consumption required to heat greenhouses, irrigate the land, transport the products over long distances and the actual processing of the soil.
According to the National Institute of Statistics, during the period 1991–2020, the Bucharest–Ilfov development region extended its urban area [,,]. Because of this, many agricultural crops suffered decreases regarding the surface area and total production. In general, low crop yield is caused by an increase in air temperature and a reduction in precipitation quantities, especially during the months with high crop water requirements.
The crop evapotranspiration under standard conditions, denoted as ETc, is the evapotranspiration from disease-free, well-fertilized crops, grown in large fields, under optimum soil water conditions and achieving full production under the given climatic conditions []. Knowledge of the ETc is fundamental in irrigation projects because it represents the amount of water that must be returned to the soil to maintain growth and production in ideal conditions. However, their estimation can be difficult and exposed to many errors, sometimes because of the Kc values [].
The Cropwat model has been tested at an international level, but also at the Romanian level [,,,,], generating very good results both on the reference evapotranspiration [] and on the crop evapotranspiration, these being validated based on direct measured data at the experimental stations in Romania such as Căldărușani, Poiana Brasov and Voinesti. The tests carried out so far [] have targeted cereal crops (wheat, maize), fruit crops (apple trees), vegetables (potato) and soil covered with grass. The simulated results were close to the measured ones, with error rates lower than 5%, which means that the model generates values with a small degree of overestimation in Romania []. Experimental measurements conducted at the evapometric station in Romania showed that additional quantities of water lead to higher values of evapotranspiration, and reduction of soil water volumes lead to decreased evapotranspiration in the crop and drying of the crop before harvesting [].
The adaptation of agricultural crops to the intensification of air temperature and reduction of water reserves can be observed by the ability of some agricultural crops such as strawberries, pea and sunflowers to spread, especially in recent years, as well as the ability of farmers to cultivate them. In this sense, the previously mentioned crops represent our interest, in order to analyze their variability regarding the crop evapotranspiration and irrigation requirements at each stage of development for the period 1991–2020. Also, a short analysis regarding the climatic factor will be performed based on the measured data in the north part of the Bucharest–Ilfov development region at the Căldărușani experimental station.
The choice of three different crops, pea, strawberry and sunflower, allows an overview of the study region’s capacity to adapt to different crop water requirements in different vegetation stages [,,]. Also, those crops are the ones that have extended their surface area in the last few years around Bucharest. The modeling of crop evapotranspiration, effective rain and irrigation requirements every 10 days was carried out using the Cropwat 8.0 software [,,].
The aim of the research is to present the variation of the crop evapotranspiration, effective rain and irrigation requirements during the period 1991–2020 for three different crops, strawberry, pea and sunflower, in the Bucharest–Ilfov development region.
This study will offer information regarding the crop productivity around the Bucharest–Ilfov region in the context of satisfying the need of big cities for fresh food at low prices and with low carbon emissions.
As a study of the specialized literature shows, the need for this analysis is accentuated by the direct and indirect impact of climate change on the entire agricultural crop system. The need for technological changes, but especially in the type of crops planted, is a major one. Crop disasters due to climatic causes (heat waves, hail, lack of snow cover, climatic and pedological drought) have increasingly become the main cause of economic losses for farmers. The increase in energy prices (electricity, liquid fuels) and the decrease in water resources have produced a decrease in irrigated land areas at the continental and European levels.
2. Materials and Methods
2.1. Study Area
Romania is a country located in the southeastern part of Europe at the intersection of the 45° north latitude parallel and the 25° east longitude meridian (Figure 1). It has an agricultural area of 13.5 million hectares. A total of 23.3% of the country’s active population works in agriculture, but the majority (44.3%) are over 65 years old.
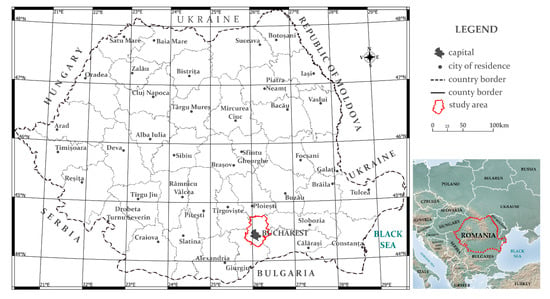
Figure 1.
Research area of the study.
The research area is within the Romanian Plain, more precisely in the north of Bucharest, on the shores of Lake Căldărușani, at an altitude of 82 m. For more than 50 years, an evapometric measurement station has been operating here where experimental measurements have been made regarding the evaporation processes on the surface of the water and soil, as well as evapotranspiration for various agricultural crops, especially cereal crops (wheat, corn) (Figure 2). The experimental station is located in the middle of an agricultural area, surrounded by arable land on which crops that do not have a very large extension at the country level have been cultivated in recent years: soybeans, rapeseed, etc. Sunflower and pea crops have been the subject of research conducted annually at the Căldărușani station, but only for short periods of time. Strawberry crops have never been monitored at this station.
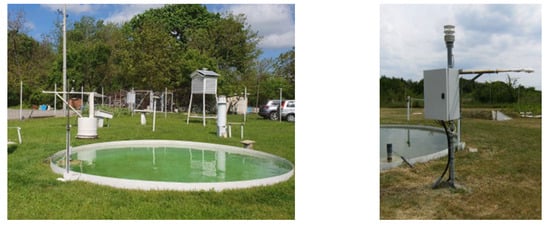
Figure 2.
Hydrometeorological equipment from the experimental station at Căldărușani, Romania.
The geographical location of the study area gives the temperate continental climate several specific features: the transitional character from oceanic and Mediterranean to continental or arid; thermal potential favorable to intensive agriculture; moderate relative air humidity; precipitation with a tendency to decrease quantitatively from west to east; and the predominant wind direction on the northeast–southwest diagonal [].
2.2. Data
This study used monthly average values of climatic parameters such as air temperature (°C), relative humidity (%), wind speed (m/s), sunshine duration and monthly amounts of precipitation amounts (mm). The analyzed data were recorded during 1991–2020 for the monthly intervals from April to November and come from the Căldărușani experimental evapometric station. This data is from the National Institute of Hydrology and Water Management (N.I.H.W.M.) database.
The measurement period is adapted according to the altitudinal steps and the zonal climatic regime. The present study uses hydrometeorological measurements from the April–November interval, because in the winter months (December–February) and spring (March) evaporation has values close to zero, which can be negligible for hydrological balance studies. The abovementioned climatic parameters were used in the estimation of evapotranspiration, effective precipitation and necessary irrigation at a 10-day time step.
In addition to climatic data, the study used information on the type of soil, i.e., its saturation degree, as well as the type of crop, i.e., the planting date and the harvest date, the duration of each stage of plant development and the crop coefficient. This information was found in the specialized literature and in the model’s user manual. Regarding soil moisture, the information was averaged over the analyzed period, because at the Căldărușani station, moisture measurements were made over short periods of time, after 2023, and the nearest agrometeorological stations, which could provide information on moisture, are located at distances greater than 100 km (Calarasi, Slobozia, etc.) []. The crop and soil data, used in the simulation of evapotranspiration and the necessary irrigation quantities, are presented in Table 1.

Table 1.
Crop and soil input data for the Cropwat 8.0 model.
2.3. Cropwat Model
The methodology of this study was based on Cropwat 8.0, originally developed by the Land and Water Development Division of FAO in 1990, with the support of the Institute of Irrigation and Development Studies in Southampton (United Kingdom) and the National Water Research Center (Egypt), for evaluating crop water requirements in order to facilitate the planning and management of irrigation projects. All the information regarding the calculation and method used by this software is described within the papers published by FAO and other researchers [,,,]. The model’s input can be classified in 4 categories: (1) climatic data (rainfall, air temperatures, relative humidity, sunshine duration, wind speed measured at 2 m); (2) agricultural crop data (crop type, sowing period, standard crop coefficient, plant development stages, root depth, plant withering point, plant response capability, crop yields, plant height); (3) soil data (soil type, maximum rain infiltration rate, maximum root depth, initial soil humidity conditions) and (4) irrigation. The Cropwat software had be used in order to obtain crop evapotranspiration (ETc), irrigation requirement or some simulation of the irrigation scheduling and yield reduction. In order to obtain the ETc, FAO started from the indirect calculation of the potential evapotranspiration (ETo) with the Penman–Monteith equation. The original formula has been modified based on the availability of the climatic data such as relative humidity, wind speed, sunshine duration and mean air temperature. The output data consists of a daily evapotranspiration value (mm) (Equation (1)).
where —reference evapotranspiration (mm/day−1); —net radiation at vegetation surface/top (MJ m−2 day−1); G—caloric flow/flux in the soil (MJ m−2 day−1); T—average air temperature at 2 m height (°C); —wind speed at 2 m height (m s−1); —water vapor tension at temperature (kPa); —actual water vapor tension (kPa); —saturation vapor pressure deficit (kPa); —slope of the curve representing water vapor tension (kPa °C−1); γ—psychrometric constant (kPa °C−1).
The Cropwat model can calculate evapotranspiration for crops in two ways: by using the reference evapotranspiration calculated by the modified Penman–Monteith equation, or by using the evapotranspiration measured directly at the station. In this study, the ETo was calculated by the modified Penman–Monteith equation.
The model proposes the estimation of crop evapotranspiration (ETc) during the growing season as a product of reference evapotranspiration (ETo) and crop coefficient (Kc) (Equation (2)) [].
where ETo—reference evapotranspiration (mm) and Kc—crop coefficient.
Kc values vary with crop and stage of development and it can be obtained from classical tables proposed by Doorenbos and Pruitt in 1977 and Doorenbos and Kassam in 1994. The Kc values mentioned in that tables were obtained through experimental measurements as the ratio between reference evapotranspiration and crop evapotranspiration [,].
The net irrigation water requirement (NIWR) is the quantity of water that a crop needs for growth and to reach maximum yield. For multiple crops, the NIWR estimation is based on the scheme for a given year, by calculating the water requirements (CWRs) of each individual crop (Figure 3). The multiple cropping per year is automatically taken into account by separately computing crop water requirements for each cropping period. Dividing the area of the scheme (measured in ha), the value for irrigation water requirements can be expressed in mm or in m3/ha (1 mm = 10 m3/ha) (Equation (3)).
where NIWR—net irrigation requirement (mm); Si—area cultivated with the crop for which the NIWR is estimated (ha); S—total area analyzed (ha).
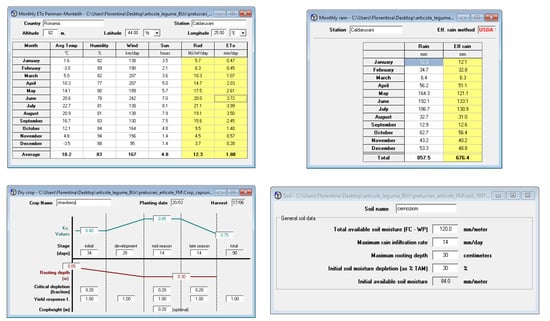
Figure 3.
Cropwat 8.0 input data for strawberry crop to the simulation made for the 1991 year.
Crop water requirements (CWR) for a specific crop are given by (Equation (4)):
where the crop coefficient of the given crop during the growth stage; ETo—reference evapotranspiration (mm); Peff—effective rain (mm).
In this study, irrigation needs were estimated starting from the moment the soil reached the critical depletion point, i.e., the moment of reaching the maximum exhaustion of the crop of 100%. In agricultural practice, irrigation cannot be performed at the critical depletion because it is not known in real time, and irrigation modeling in this scenario offers the ideal situations and the maximum yield that plants can reach by approaching agricultural measures in real time [].
2.4. Mann–Kendal Statistical Test
To analyze the variability over time of climatic data: air temperature, precipitation, air humidity, wind speed and simulated crop evapotranspiration and irrigation needs, the Mann–Kendal statistical test was used within the Excel template MAKESENS. This was developed for detecting and estimating trends in the time series of annual values of atmospheric parameters and the procedure is based on the nonparametric Mann–Kendall test for the trend and the nonparametric Sen’s method for the magnitude of the trend []. Those statistical tests were applied in this study, both to the series of monthly average values of climatic parameters monitored during the period 1991–2020 at the Căldărușani experimental station and to the series extracted from the Cropwat model, obtained on the stages of crop development for each year. As such, based on the Excel template MAKESENS, the direction of trends and their degree of certainty were obtained.
3. Results
3.1. Analysis of Hydrometeorological Parameters
In the annual regime of the average monthly air temperature, for the period 1991–2020, the highest monthly average was recorded in July (+24.0 °C) and the lowest monthly average in December (−1.2 °C) (Figure 4a). The average annual thermal amplitude is 25.2 °C, which reflects the degree of continentality of the study area. In terms of annual thermal deviations from the multiannual average air temperature (11.9 °C), a higher frequency of negative thermal deviations is observed in the first decade of the analyzed period. Starting with 2000, there are more positive thermal deviations, the highest value being recorded in 2012 of 1.8 °C (Figure 4b). The climatic changes observed in the air temperature regime are also highlighted by the decadal average values of the analyzed period. These values are 11.1 °C (1991–2000), 12.4 °C (2001–2010) being the warmest decade and 12.1 °C (2011–2020). As a result, after 2000, the air temperature increased compared to the first decade by 1.0 … 1.3 °C for the study area.
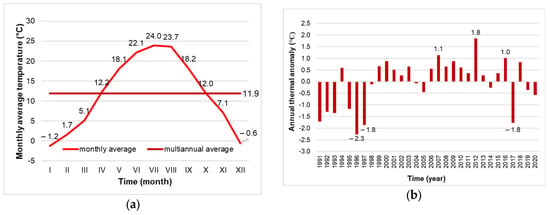
Figure 4.
The annual regime of air temperature (a) and annual thermal anomalies (b) at the Căldărușani experimental evapometric station for the period 1991–2020.
The annual regime of the average monthly precipitation amounts indicates the highest monthly amount in June (78.5 mm) and the lowest amount in February (25.5 mm) (Figure 5a). The annual amount of precipitation for the entire analyzed period is 595.0 mm. Negative rainfall deviations alternate with positive rainfall deviations, but after 2005, negative rainfall deviations predominate (Figure 5b). In the transitional temperate continental climate, the precipitation regime is unevenly distributed in time and space, an aspect also valid for the study area, as can be seen from Figure 5. The decadal average values of precipitation amounts do not have significant changes, with values of 599.1 mm in the first decade, 591.8 mm in the second decade and 594.2 mm in the third decade of the period 1991–2020. The changes observed in the precipitation regime are less coherent spatially and chronologically compared to the thermal regime.
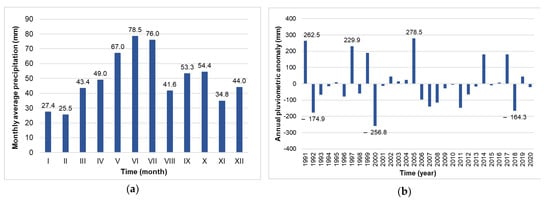
Figure 5.
The annual regime of precipitation (a) and annual pluviometric anomalies (b) at the Căldărușani experimental evapometric station for the period 1991–2020.
At the monthly level, air temperature values increase from 12 to 18 °C starting with the spring months (April–May), reach a maximum of 23–24 °C in the summer months, July and August, and decrease in autumn starting with September to about 7 °C in November. The months with the highest amounts of precipitation are May–June with 67–80 mm/month. The highest amount of precipitation in a month, 205.7 mm, was recorded in May 2012. Relative humidity has higher values of over 78–83% in the autumn months when the temperature decreases significantly. Regarding wind speed, it has maximum values in the spring and autumn months of 1.3–1.7 m/s.
The average air temperature, obtained based on measurements taken at the Căldărușani experimental evapometric station (Table 2), included in the monthly analysis interval April–November from 1991 to 2020, was +17.6 °C. Thus, in the analyzed period, the years 1999, 2008, 2012 and 2013 were noted as having average air temperature values (monthly interval April–November) of over +19 °C. The lowest average air temperature values (from the April–November period) close to +15 °C were measured in the years 1991–1992 and 1995–1996. Regarding the amounts of precipitation, their average value was 458.8 mm, for the monthly interval April–November. The years with higher amounts of precipitation, over 700 mm, recorded in the April–November interval were 1991 and 2005. The lowest amounts of precipitation recorded in the period 1991–2020, characteristic of the April–November interval, were approximately 300 mm in the years 2000, 2007–2008 and 2011–2012. The relative humidity in the analyzed period had values between 61% and 77%, and the wind speed varied between 0.3 m/s (2016–2018) and up to over 2 m/s (1992–1997).

Table 2.
Results of the Mann–Kendall test for analyzed climate parameters, period 1991–2020.
Based on the application of the Mann–Kendall statistical test on the monthly climate data series (from April to November) from the period 1991–2020, an increasing trend in air temperature was obtained, with a higher degree of confidence in August and September, α of 0.05 and 0.1. Regarding precipitation, the Z test values indicated a slight increase in the spring months, at the beginning of summer and at the end of autumn, as well as a decrease in the summer, in July and August, but also at the beginning of autumn, without a degree of confidence. Air humidity also indicates an increase in the period April–November with degrees of confidence between 0.01 (May) and 0.1 (October–November), the exception being September when a slight decreasing trend was identified. Wind speed has a decreasing trend, with the highest degree of confidence of 0.001.
The trends identified at the level of climatic parameters are consistent with the trends observed at the national level, namely intensification of the air thermal regime, especially in the spring and summer months, decreases in the wind speed regime at the country level and a slight increase in precipitation amounts in the autumn months [].
3.2. Analysis of Simulated Results with the Cropwat Model
For strawberry cultivation, during the period 1991–2020, the Cropwat model generated an average evapotranspiration of 162 mm/year, effective rain of 155 mm/year and an irrigation requirement of about 43.5 mm/year (Table 3). Evapotranspiration values for strawberry cultivation varied between 190.3 mm (in 2000) and 131.2 mm (in 1991) (Figure 5). There is a close relationship between evapotranspiration and precipitation; evapotranspiration decreases when precipitation amounts are maximum, and these are often accompanied by a reduction in the thermal regime and an increase in cloudiness. For strawberry crops, the irrigation requirement is on average 43 mm/year, varying during the growing season between 2.6 mm (year 1991) and 126 mm (year 2007), the highest water requirements of the plant being specific to the development and mid-season stages (12–15 mm) (Figure 6). In years with lower amounts of precipitation ranging between 60 and 90 mm (e.g., 2000, 2002, 2018), the irrigation requirement exceeds 100 mm. The analytical results obtained by applying the Cropwat 8.0 model are shown in Table 3.

Table 3.
Cropwat 8.0 model results for the crops studied, multi-annual average values.
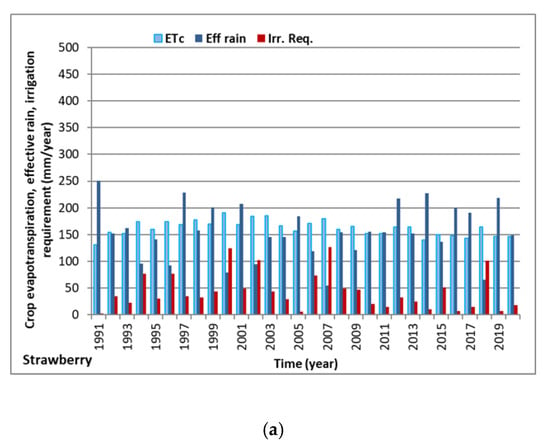
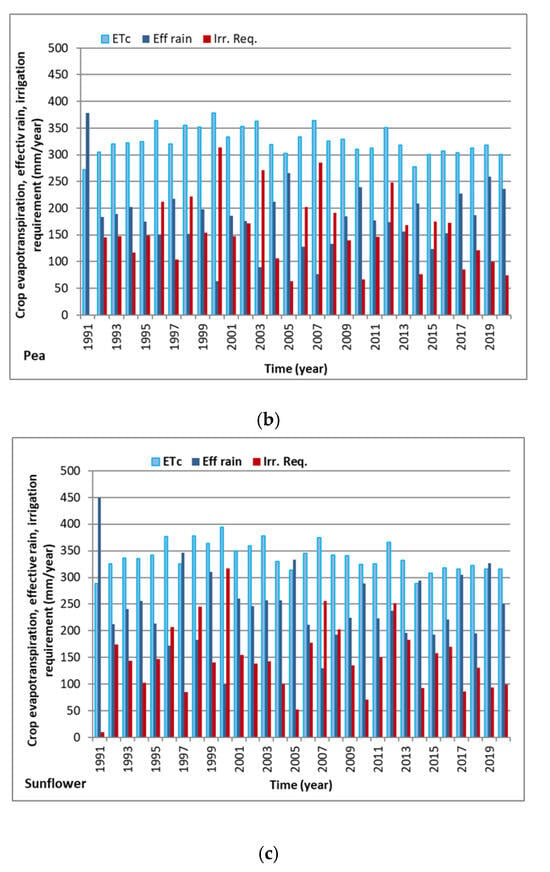
Figure 6.
Annual variation of crop evapotranspiration (ETc), effective rain (Eff rain) and irrigation requirement (Irr. Req.) for strawberry (a), pea (b) and sunflower (c) crops, simulated with the Cropwat model (period 1991–2020).
For the sunflower crop, the annual evapotranspiration values were higher than for the strawberry crop presented previously, due to the longer duration of the vegetation cycle and the more developed leaf apparatus (Table 3). Thus, in the time interval 1991–2020, the average value of evapotranspiration for the sunflower crop was 337 mm, varying between 288 mm (year 1991) and 394 mm (year 2000) (Figure 6). Effective rain for the vegetation period of the sunflower crop was on average 244 mm/year, with a maximum value of 449.3 reached in 1991 and a minimum of 100.2 mm in 2000. Irrigation requirement varies significantly from one year to another; minimum annual values resulting from simulations carried out for the year 1991 were Irr. Req. 9.8 mm (year with a strong surplus of precipitation), with maximum values of Irr. Req. of 317.4 mm in the year 2000 (year with a deficit in terms of precipitation). In the development stage, the sunflower crop requires an average of 12 mm; later in the mid-season stage, the water requirement reaches 94 mm (Figure 7).
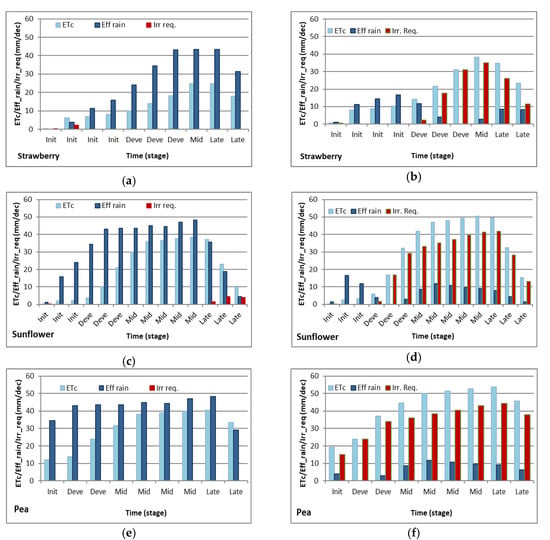
Figure 7.
Values extracted from simulations performed with Cropwat 8.0, for the years 1991 (a,c,e) and 2000 (b,d,f), regarding crop evapotranspiration ETc (mm/10 days), effective precipitation Eff. Rain (mm/10 days) and irrigation requirement Irr. Req. (mm/10 days).
The pea crop, with a maximum crop height of 0.5 m, is a high water consumer. Evapotranspiration values for this plant varied between 272.5 mm (year 1991) and 378.3 mm (year 2000), with an average of 325.1 mm (Table 3). Eff. Rain records had the highest value of 378.3 mm in 1991 and values lower than 100 mm in the years 2000, 2003 and 2007 (Figure 6). Irrigation required for pea crops has an average value of 152.4 mm, and can reach values higher than 270 mm in years with a precipitation deficit and meteorological and hydrological drought. The crop’s water requirement is at its maximum during its development and mid-season periods, reaching over 40 mm and over 80 mm, respectively (Figure 7, Table 4).

Table 4.
The number of days corresponding to each crop vegetation period.
Regarding the trends highlighted with the Mann–Kendal test for the three parameters simulated with Cropwat 8.0 software crop evapotranspiration, effective rain and irrigation requirement, the results obtained are represented in Table 5. In the case of evapotranspiration for all three crops selected for testing, a decreasing trend was obtained both at the level of the entire growing season and for each stage, with higher confidence levels in the case of strawberry and sunflower crops of 0.05 and lower in the case of pea crops of 0.1.

Table 5.
Mann–Kendall test results for evapotranspiration, effective rainfall and irrigation requirements of strawberry, pea and sunflower crops.
In the case of Effective rain, different trends were obtained from one crop to another and from one development stage to another. Thus, for the strawberry crop, the Eff. Rain trend is increasing, and for the sunflower crop, the trend is decreasing, at least in the initial and development stages. As for the pea crop, Eff. Rain has a growing trend in the initial, development and mid-season development stages, without confidence levels, and a decreasing trend in the late stage.
Analyzing Irr. Req. during the period 1991–2020, for strawberry and pea crops, a decrease was observed at each stage of development. The irrigation requirement in the case of sunflower crops records an increasing trend in the initial and late stages, and a decreasing trend in all the others.
4. Discussion
Climate change, as analyzed in recent decades by both foreign and Romanian researchers, indicates an acceleration of some components of the water cycle in nature, including evaporation and evapotranspiration. A main cause of the change in evaporation and evapotranspiration rates is attributed to human influence, which has led to an increase in global temperature. Most studies conducted worldwide have shown that both evaporation and evapotranspiration show increasing values, with a significant trend in the summer months [,,,]. This acceleration of evaporation and evapotranspiration is attributed to the intensification of radiative factors and air temperature. However, recent studies have occasionally supported decreasing trends in potential and actual evapotranspiration.
The changes in the potential or actual evapotranspiration regime have been attributed to the decrease in the intensity of solar radiation and wind speed, as well as to the changes in the atmospheric precipitation. The dependence of the evapotranspiration process on the entire complex of meteorological parameters makes the analysis of these climatic components part of all studies targeting the evaporation and evapotranspiration processes. Changes have been observed worldwide and within the rainfall regime; a decrease in the precipitation regime by up to 90 mm/decade in the southern part of the continent was observed (according to the European Environment Agency). In Romania, the amount of precipitation has decreased especially during the summer; the future trend is a drastic reduction of up to 33% of the amount, by 2090, compared to the period 1961–1990 []. An increasing trend regarding precipitation during the vegetation period can lead to a reduction in evapotranspiration values.
Among the research analyzing this topic is the work of Maček (2018), which analyzed the variation of evapotranspiration based on data monitored at 18 stations in Slovenia []. His results support the increasing trend in mountainous areas, while for stations located in the sub-Mediterranean region, a decreasing trend was obtained, but with a low degree of confidence.
According to Paltineanu (2012), the reference evapotranspiration increased during the growing season by about 103.9 mm from the 20th century to the 21st century in the area of the Bucharest–Baneasa station, which is located a few kilometers from our area of interest []. The maximum daily values of evapotranspiration reach 6 mm/day, with frequent records in the years 2000, 2002, 2003 and 2007 [,]. In the case of our study, the maximum values reach an average of 4–4.5 mm/day in June and July, and the highest daily values of evapotranspiration reached 5 mm/day in 1998, 2007 and 2012.
Studies that have addressed the close relationship between evapotranspiration and soil moisture support the fact that, if until 1998 the evapotranspiration trend was increasing, after this year and until 2008, with the decrease in soil moisture, the evapotranspiration values started to decrease []. The decrease in the soil water reserve leads to lower values of evapotranspiration and causes the withering of crops before they reach the maximum development stage [].
Another issue addressed in recent studies concerns the cyclical occurrence of periods with a tendency to increase and decrease in crop evapotranspiration values. Thus, after a short period with a negative trend, a period with a positive trend follows []. A cause of these cycles may be the reduction of the radiative component and the increase in nebulosity. In our study, this cyclical trend of crop evapotranspiration values was also observed, such that until 2007 its trend was increasing, followed by a period of decrease until the end of the analysis interval. This is observed not only in the case of crop evapotranspiration but also in the case of water requirements for irrigation.
The results obtained represent significant progress in identifying the water requirements for different types of crops so as to achieve optimal production. However, large-scale analysis requires experimentally determined input data obtained from specific research platforms. The limited number of these platforms and the generalization of some parameters to large spaces can be an element that produces a lack of accuracy in the results.
5. Conclusions
The results obtained represent significant progress in understanding the water requirements for each agricultural crop under current climatic conditions. This leads to efficient management of crop schemes and optimal agricultural yield. In this way, water resources are protected, greenhouse gases are no longer emitted and agricultural production is obtained that ensures the sustainability of agricultural farms over time. At the same time, consumers benefit from fresh agricultural products, in sufficiently large quantities and at affordable prices throughout the production period.
Addressing the issue of irrigation requirements of the three plants (crops) studied, in the same climatic context, draws attention to the initial periods of development in which, regardless of the type of crop, they would need additional irrigation for optimal development.
The study focuses on agricultural crops with different vegetation periods (more than 80–90 days of vegetation) which, simulated by Cropwat model, under the same climatic conditions over a period of 30 years, showed that they had the ability to adapt to climatic changes. The results are not worrying; despite the intensification of the air temperature regime, the increase of precipitation and the reduction of wind speed, the evapotranspiration at the level of crops shows a decreasing trend. During the analyzed period 1991–2020, the water requirement of strawberry and pea crops was reduced. This is the reason why these crops are part of the category of those that have expanded in the last 30 years in the northern Bucharest–Ilfov development region. In the same time, water requirements increased in the case of sunflower at the beginning and end of the plant development stage. The sunflower crop has a large leaf development, such that it requires more water to reach maturity and maximum yield.
In conclusion, to achieve optimum crop production, it is recommended to run the program periodically, with the updating of parameters that allow the most accurate orientation towards the needs of the crop. It is also recommended to implement seasonal irrigation programs that take into account each vegetation stage, to improve the maximum water requirement in the middle of the development season (according to Figure 6).
Although the Cropwat model uses a series of climate, soil and crop parameters, it is easy to apply at different temporal and spatial scales. The results obtained with the Cropwat model are of great use to farmers and different land users, and can reduce the amount of irrigated water, especially in periods when they are not required. The model could be extended to Eastern Europe and the Mediterranean area and beyond in order to identify crops suitable and adaptable to climate, economic and environmental changes.
As such, knowledge of this information can considerably improve agriculture and economies based on this component, contributing to decision-making in the field of management and protection of agricultural land. The issue addressed supports the rational use and management of water reserves, by expanding the areas cultivated with agricultural plants with minimal irrigation needs, especially in periods of hydrological deficit.
In the future, we plan to expand the study and apply the Cropwat model at a national level, to identify how crop types are best suited to current climatic conditions and require the least water resources. This can improve crop yields and, implicitly, increase income within the national economy.
Author Contributions
Conceptualization, F.I.M. and D.C.D.; methodology, F.I.M. and D.M.O.C.; software, F.I.M.; validation, D.C.D., F.I.M. and D.M.O.C.; formal analysis, F.I.M., D.C.D. and D.M.O.C.; investigation, D.C.D. and D.P.; resources, D.C.D. and F.I.M.; data curation, F.I.M.; writing, F.I.M., D.P., D.M.O.C. and D.C.D.; writing—review and editing, F.I.M., D.C.D., D.M.O.C. and D.P.; visualization, all authors.; supervision, D.C.D.; project administration, D.C.D. All authors have read and agreed to the published version of the manuscript.
Funding
This research was supported by a grant from the Ministry of Research, Innovation and Digitization, CNCS/CCCDI-UEFISCDI, project number COFUND-DUT-FEED4FOOD, within PNCDI IV Project title: Vulnerable communities fostering innovation and governance of sustainable building systems in European cities, through project number 50/2024.
Institutional Review Board Statement
Not applicable.
Data Availability Statement
Data are available through a request to the corresponding author.
Acknowledgments
In particular, the authors would like to thank the Ministry of Environment, Water and Forests (Romania), for the financial support offered in the development of experimental measurements of evaporation and evapotranspiration in Romania. Moreover, the authors we would like to acknowledge the National Institute of Hydrology and Water Management (N.I.H.W.M.) and the Experimental Station Căldărușani for their scientific and technical support, also for collecting the evapometric experimental data. The author would like to thank the three anonymous reviewers for their helpful and constructive comments that assisted in improving this manuscript.
Conflicts of Interest
The authors declare no conflicts of interest.
Abbreviations
The following abbreviations are used in this manuscript:
| ETc | crop evapotranspiration (mm) |
| ETo | reference evapotranspiration (mm) |
| Eff. Rain | effective rain |
| FAO | Food and Agriculture Organization |
| NIWR | Net Irrigation Water Requirement |
| CWR | Crop Water Requirement |
| Irr. Req. | Irrigation Requirement |
References
- Shafi, U.; Mumtaz, R.; García-Nieto, J.; Hassan, S.A.; Zaidi, S.A.R.; Iqbal, N. Precision Agriculture Techniques and Practices: From Considerations to Applications. Sensors 2019, 19, 3796. [Google Scholar] [CrossRef]
- Skakun, S.; Justice, C.O.; Vermote, E.; Roger, J.C. Transitioning from MODIS to VIIRS: An analysis of inter-consistency of NDVI data sets for agricultural monitoring. Int. J. Remote Sens. 2018, 39, 971–992. [Google Scholar] [CrossRef]
- Baloi, A.; Belean, B.; Turcu, F.; Peptenatu, D. GPU-based similarity metrics computation and machine learning approaches for string similarity evaluation in large datasets. Soft Comput. 2023, 28, 3465–3477. [Google Scholar] [CrossRef]
- Islam, N.; Rashid, M.M.; Pasandideh, F.; Ray, B.; Moore, S.; Kadel, R. A review of applications and communication technologies for internet of things (IoT) and unmanned aerial vehicle (UAV) based sustainable smart farming. Sustainability 2021, 13, 182. [Google Scholar] [CrossRef]
- Akhter, R.; Sofi, S.A. Precision agriculture using iot data analytics and machine learning. J. King Saud Univ.-Comput. Inf. Sci. 2022, 34, 5602–5618. [Google Scholar] [CrossRef]
- Majeed, Y.; Fu, L.; He, L. Editorial: Artificial intelligence-of-things (AIoT) in precision agriculture. Front. Plant Sci. 2024, 15, 1369791. [Google Scholar] [CrossRef]
- Prăvălie, R.; Patriche, C.V.; Sîrodoev, I.; Bandoc, G.; Dumitraşcu, M.; Peptenatu, D. Water deficit and corn productivity during the post-socialist period. Case study: Southern Oltenia drylands. Romania Arid. Land Res. Manag. 2016, 30, 239–257. [Google Scholar] [CrossRef]
- Prăvălie, R.; Sîrodoev, I.; Patriche, C.V.; Bandoc, G.; Peptenatu, D. The analysis of the relationship between climatic water deficit and corn agricultural productivity in the Dobrogea Plateau. Carpathian J. Earth Environ. Sci. 2014, 9, 201–214. [Google Scholar]
- Yang, Z.; Diao, C.; Gao, F. Towards scalable within-season crop mapping with phenology normalization and deep learning. IEEE J. Sel. Top. Appl. Earth Obs. Remote Sens. 2023, 16, 1390–1402. [Google Scholar] [CrossRef]
- Available online: http://statistici.insse.ro:8077/tempo-online/#/pages/tables/insse-table (accessed on 7 January 2025).
- Peptenatu, D.; Draghici, C.; Merciu, C. Characteristics of entrepreneurial profile in some emergent territorial structures in Romania. Actual Probl. Econ. 2012, 12, 448–458. [Google Scholar]
- Diaconu, D.C.; Peptenatu, D.; Gruia, A.K.; Grecu, A.; Gruia, A.R.; Gruia, M.F.; Drăghici, C.C.; Băloi, A.M.; Alexandrescu, M.B.; Sibinescu, R.B. The Impact of Urban Expansion on Land Use in Emerging Territorial Systems: Case Study Bucharest-Ilfov, Romania. Agriculture 2025, 15, 406. [Google Scholar] [CrossRef]
- Allen, R.G.; Pereira, L.S.; Smith, M.; Raes, D.; Wright, J.L. FAO-56 Dual crop coefficient method for estimating evaporation from soil and application extensions. J. Irrig. Drain. Eng. 2005, 131, 2–13. [Google Scholar] [CrossRef]
- Pereira, A.B.; Villa Nova, N.A.; Pires, L.F.; Angelocci, L.R.; Beruski, G.C. Estimation method of grass net radiation on the determination of potential evapotranspiration. Meteorol. Appl. 2014, 21, 369–375. [Google Scholar] [CrossRef]
- Mincu, F.I.; Neculau, G. An Experimental Study on Crop Evapotranspiration in Romania. Scientific Papers. Series A. Agronomy 2024, 67, 554–561. [Google Scholar]
- Neculau, G.; Stan, F. Evaporation and evapotranspiration in Romania. Forum Geogr. 2016, 15, 39–48. [Google Scholar] [CrossRef]
- Stan, F.; Neculau, G. Implementation of some calculation methods of the evaporation in the catchments of Prut and Bârlad Rivers. Air Water Compon. Environ. 2014, 2014, 219–226. [Google Scholar]
- Stan, F.; Neculau, G.; Zaharia, L.; Ioana-Toroimac, G.; Mihalache, S. Study on the evaporation andevapotranspiration measured on Căldăruşani lake. Procedia Environ. Sci. 2016, 32, 281–289. [Google Scholar] [CrossRef]
- Constantin, D.M.; Mincu, F.I.; Diaconu, D.C.; Burada, C.D.; Baltateanu, E. Water Management in Wheat Farming in Romania: Simulating the Irrigation Requirements with the CROPWAT Model. Agronomy 2024, 15, 61. [Google Scholar] [CrossRef]
- Stăncalie, G.; Marica, A.; Toulios, L. Using earth observation data and CROPWAT model to estimate the actual crop evapotranspiratiom. Phys. Chem. Earth 2010, 35, 25–30. [Google Scholar] [CrossRef]
- Stan, F.; Zaharia, L.; Neculau, G.; Ioana-Toroimac, G. Variabilité spatiale et temporelle de l’évaporation dans la Plaine roumaine. Actes Colloq. L’assoc. Int. Climatol. 2015, 28, 621–626. [Google Scholar]
- Nayak, T.R.; Choudhary, M.K.; Pandram, V.K. Modelling the Crop Water Requirement Using CROPWAT: A Case Study of Samrat Ashok Sagar (Halali) Project Command. In Proceedings of the India Water Week, New Delhi, India, 4–8 April 2016. [Google Scholar] [CrossRef]
- Stan, F.; Carmello, V.; Zaharia, L.; Ioana-Toroimac, G. Estimation de l’evapotranspiration pour differents types de cultures agricoles, par le modele Cropwat. Estudes de cas en Roumanie et au Bresil. In Proceedings of the XXX Colloque de l’Association INternationale de Climatologie, Sfax, Tunisia, 3–6 July 2017; pp. 485–490. [Google Scholar]
- Saravanan, K.; Saravanan, R. Determination of Water Requirements of Main crops in the Tank Irrigation Command area using CROPWAT 8.0. Int. J. Interdiscip. Multidiscip. Stud. 2014, 1, 266–272. [Google Scholar]
- Shah, P.V.; Mistry, R.N.; Amin, J.B.; Parmar, A.M.; Shaikh, M.R.A. Irrigation scheduling using Cropwat. Int. J. Adv. Res. Eng. Sci. Technol. 2015, 2, 192–201. [Google Scholar]
- Al-Najar, H. The Integration of FAO-Cropwat model and GIS Techiniques for Estimating Irrigation Wtaer Requirement and its Application in the Gaza Strip. Nat. Resour. 2011, 2, 146–154. [Google Scholar] [CrossRef]
- National Institute of Geography (NIG). Geography of Romania (Geografia România); Romanian Academy Publishing House: Bucharest, Romania, 2005; Volume 5. [Google Scholar]
- Available online: https://ismn.earth/en/networks/?id=RSMN (accessed on 23 January 2025).
- Doorenbos, J.; Pruitt, W.O. Guidelines for predicting crop-water requirements. In FAO Irrigation and Drainage Paper, 2nd ed.; FAO: Rome, Italy, 1977; p. 156. [Google Scholar]
- Allen, R.G.; Pereira, L.S.; Raes, D.; Smith, M. Crop evapotranspiration: Guide-lines for computing crop water requirements. In FAO Irrigation and Drainage Paper; FAO: Rome, Italy, 1998; p. 300. [Google Scholar]
- Djaman, K.; O’Neill, M.; Owen, K.; Smeal, D.; Koudahe, K.; West, M.; Allen, S.; Lombard, K.; Suat Irmak, S. Crop Evapotranspiration, Irrigation Water Requirement and Water Productivity of Maize from Meteorological Data under Semiarid Climate. Water 2018, 10, 405. [Google Scholar] [CrossRef]
- Doorenbos, J.; Kassam, A.H. Efeito da & AACUTEgua no Rendimento das Culturas; Ufpb: Campina Grande, Brazil, 1994; p. 306. [Google Scholar]
- Salmi, T.; Maatta, A.; Anttila, P.; Ruoho-Airola, T.; Amnell, T. Detecting Trends of Annual Values of Atmospheric Pollutants by the Mann-Kendall Test and Sen’s Slope Estimates—The Excel Template Application Makesens; Publications on Air Quality; Pappelallee: Berlin, Germany, 2002; Volume 31, p. 35. [Google Scholar]
- Bojariu, R.; Bîrsan, M.; Cică, R.; Velea, L.; Burcea, S.; Dumitrescu, A.; Dascălu, S.; Gothard, M.; Dobrinescu, A.; Cărbunaru, F.; et al. Schimbările Climatice—De la Bazele Fizice la Riscuri și Adaptare; Printech: Bucharest, Romania, 2015. [Google Scholar]
- Dinpashoh, Y.; Babamiri, O. Trends in reference crop evapotranspiration in Urmia Lake basin. Arabian J. Geosci. 2020, 13, 372. [Google Scholar] [CrossRef]
- Yong, S.L.S.; Ng, J.L.; Huang, Y.F.; Ang, C.K. Innovative Trend Analysis of Reference Crop Evapotranspiration in Peninsular Malaysia. IOP Conf. Ser. Earth Environ. Sci. 2021, 1022, 012071. [Google Scholar] [CrossRef]
- Sevov, A.; Georgieva, V. Technological solutions for common sunflower (Heliantus annuus) growing in a changing climate condition. Sci. Papers. Ser. A. Agron. 2023, 2, 380–387. [Google Scholar]
- La Fuente, S.; Jennings, E.; Lenters, J.; Verburg, P.; Kirillin, G.; Shatwell, T.; Couture, R.-M.; Côté, M.; Råman Vinnå, L.; Woolwa, I. Increasing warm-season evaporation rates across European lakes under climate change. Clim. Change 2024, 177, 173. [Google Scholar] [CrossRef]
- Maček, U.; Bezak, N.; Šraj, M. Reference evapotranspiration changes in Slovenia, Europe. Agric. For. Meteorol. 2018, 260–261, 183–192. [Google Scholar] [CrossRef]
- Paltineanu, C.; Chitu, E.; Mateescu, E. New trends for reference evapotranspiration and climatic water deficit. Int. Agrophys. 2012, 26, 159–165. [Google Scholar] [CrossRef]
- Jung, M.; Reichstein, M.; Ciais, P.; Seneviratne, S.I.; Sheffield, J.; Goulden, M.L.; Bonan, G.; Cescatti, A.; Chen, J.; De Jeu, R.; et al. Recent decline in the global land evapotranspiration trend due to limited moisture supply. Nature 2010, 467, 951–954. [Google Scholar] [CrossRef]
- Tomas-Burguera, M.; Begueria, S.; Vicente-Serrano, S.M. Climatology and trends of reference evapotranspiration in Spain. Int. J. Climatol. 2021, 41, E1860–E1874. [Google Scholar] [CrossRef]
Disclaimer/Publisher’s Note: The statements, opinions and data contained in all publications are solely those of the individual author(s) and contributor(s) and not of MDPI and/or the editor(s). MDPI and/or the editor(s) disclaim responsibility for any injury to people or property resulting from any ideas, methods, instructions or products referred to in the content. |
© 2025 by the authors. Licensee MDPI, Basel, Switzerland. This article is an open access article distributed under the terms and conditions of the Creative Commons Attribution (CC BY) license (https://creativecommons.org/licenses/by/4.0/).