1. Introduction
Tillage practices have changed significantly during the past decade. Systems based on traditional practices have been replaced by more biologically based farming systems. These practices have been boosted by the stimulation of various scientific advances and the expansion of technological possibilities. Other incentives include the need to adapt to adverse climatic conditions and the site-specific measurement results of precision agriculture. These factors point to the differences in the soil across the field and reveal its heterogeneity. Adaptation to local conditions is very important, i.e., the climate, soil and the applied technological system need to be matched, which will ensure the production of the proper quantity and quality while protecting the environment [
1].
Soil tillage is necessary to ensure the appropriate soil conditions for plants to grow. In the last decade, traditional soil conservation objectives have been coupled with previous tillage tasks due to soil degradation [
2]. In the past few decades, drought in agriculture has severely affected crop production and food security worldwide [
3,
4]. Extreme weather conditions affect not only the soil, but also the plant’s physiological parameters [
5]. Climate change poses a new challenge to maize producers, which necessitates a rethinking of every single element of production technology [
6].
Soil tillage has an influence on soil properties, especially on soil water content [
7]. Minimum tillage improves the soil structure, crop residues better conserve soil moisture [
8] and it is more efficient to use in comparison with intensive tillage [
9]. In spring time, minimally tilled soil frequently consists of a higher amount of water than intensively tilled soil. Intensive tillage degrades the soil structure and reduces the soil water content [
10]. Tillage largely influences the pore size distribution [
11]. Conventional cultivation brings a higher soil volume and slower water infiltration [
12,
13]. The rate of infiltration is controlled by the pore size distribution and the continuity of pores or pathways [
14]. Infiltration of water increases the water storage for crops and groundwater recharge [
15]. Intensive soil tillage increased the topsoil moisture released into the environment [
16].
Assessing and properly classifying the soil structure is not an easy task, as soil is a very heterogeneous and complex medium. There are several methods to assess the structure of the topsoil, some of which are visual. A soil sample is dug out and classified. One of the applied methods is the Visual Evaluation of Soil Structure (VESS) [
17]. The visual soil evaluation method (VSA) [
18] is based on similar principles. There are also methods of assessment based on instrumental data, one of which is penetration resistance measured by a penetrometer, widely used as an indicator of tillage effect [
19]. The soil structure undergoes changes during the growing season, the extent of which can be significant depending on the tillage system, and this effect can be measured by the penetration resistance [
20]. There is also a significant correlation between the root length and the average root diameter of maize and penetration resistance [
21].
Many researchers are investigating the effects of different tillage practices on soil and crop production. Several of these researchers have demonstrated that tillage practices affect soil physical properties in both topsoils and subsoils [
22,
23,
24]. The influence of tillage on moisture content, penetration resistances and bulk density is important for soil physical properties. However, changes in soil physical properties affect seed germination, plant population, root zone distribution and yield [
25,
26]. Reduced tillage systems are perceived by farmers to lower soil temperatures, create wetter soil conditions and produce harder soil conditions than conventional tillage systems [
27]. There are several ways to measure the real-world effects of tillage systems on the soil. The most obvious ways to measure soil compaction are the volumetric density and penetration resistance [
28]. Another basis for comparison can be soil moisture content. By comparing these parameters, it can be shown that soil physical and biological properties are better in reduced tillage systems compared to intensive tillage systems [
29]. It is very important to understand the short- and long-term effects of tillage systems and to use those best-suited to the prevailing climatic conditions [
30].
There are other methods to reveal pore structure characteristics and hydraulic properties, including saturated hydraulic conductivity and the soil water retention curve (SWRC). The effect of pore structure on the hydraulic properties is an important factor. Three-dimensional pore structure characteristics and hydraulic properties are related [
31].
The objective of this research was to evaluate the impact of drought on soil physical parameters in crop production by testing different conventional and novel tillage systems to ensure optimal soil physical parameters. The relevance and utility of the obtained results will contribute to the agronomic development of precision farming by the proper choice of agrotechnical operations on chernozem soils with a 2.5 cm positioning accuracy during drought.
2. Materials and Methods
The tillage system experiment was set up in the eastern region of Hungary at Nádudvar (47°25′49.3″ N 21°12′33.5″ E) on chernozem soil type in 2016. The area is 25 ha, which is divided into 5 separate plots and different crop species are grown in rotation. These crops are maize, sunflower, rapeseed, wheat and soybean. Each species is grown on a 4.5 ha plot. Each plot is further divided into 4 parts and different tillage systems are used in these plots [
32].
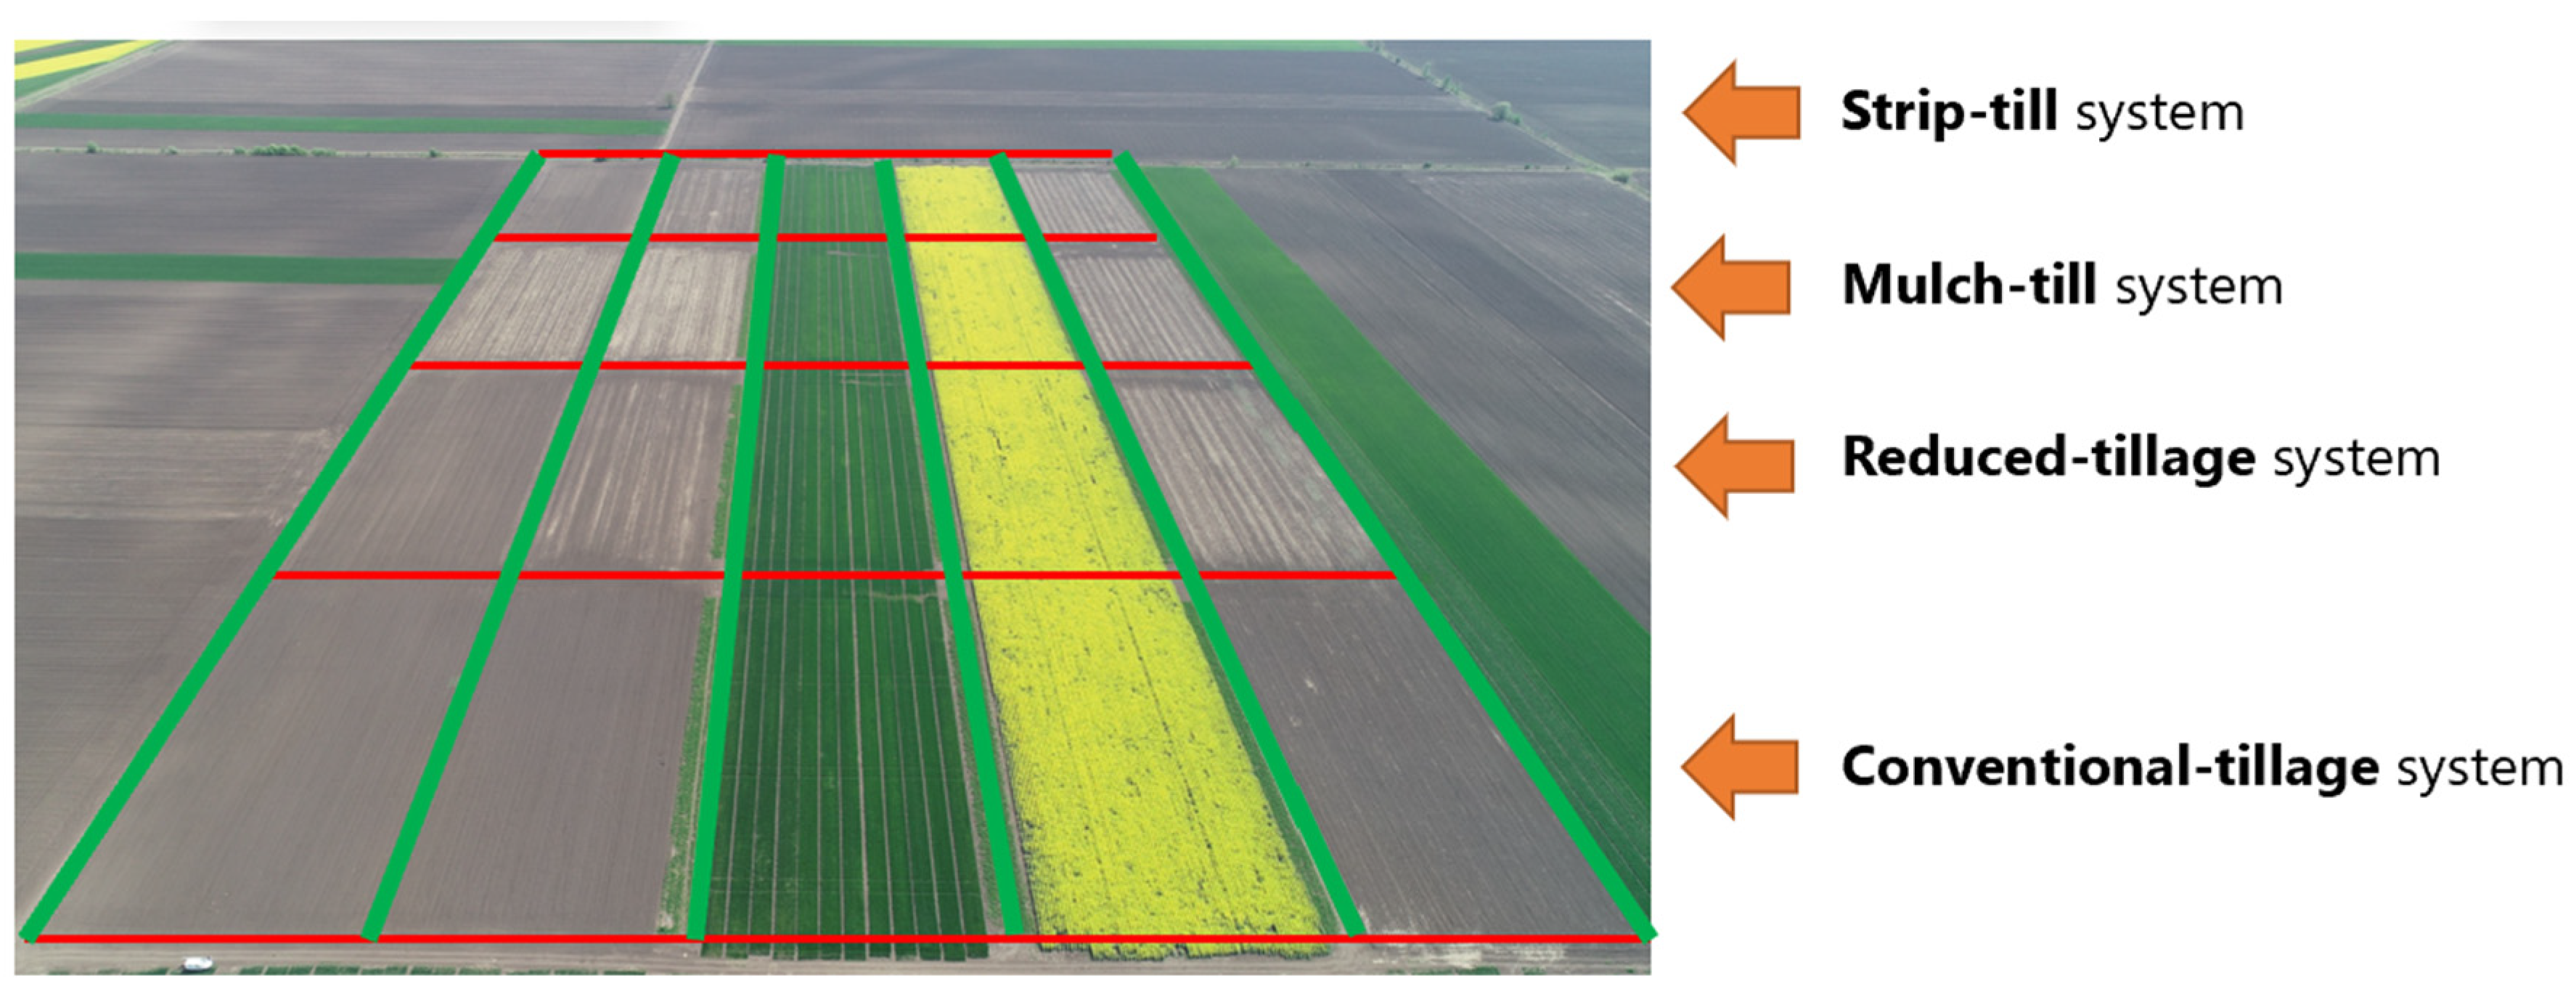
The basic tillage tool used in the conventional tillage system is the plough (Rabe Cormoran RABE Agrartechnik gmbH, Bad Essen, Germany), with a ploughing depth of 30 cm, leaving no stalk residue on the surface.
The basic cultivating tools are medium-depth cultivators (Gaspardo Artiglio, Maschio Gaspardo S.p.A., Campodarsego, Italy) with a small angle of inclination and a proper mixing effect. For primary tillage, the cultivation must be carried out over the entire surface, with a working depth of 30 cm and a maximum residue of 15% on the surface.
In the mulch-till cultivation system, straight-knife soil looseners (Orthman Digger, Orthman Manufacturing, Lexington, KY, USA) should be used, loosening the entire surface to a maximum depth of 30 cm. After the basic tillage technology is used, a stem residue cover of over 30% remains.
The strip-till tillage system is based on strip tillage (Orthman ST6, Orthman Manufacturing, Lexington, KY, USA). Forty percent of the total surface is cultivated 30 cm wide and 28 cm deep, with remaining stalk residue on more than 30% of the surface.
Primary tillage is performed in autumn, followed by sowing in spring after a mulching/seedbed preparation operation (
Figure 1).
State-of-the-art precision farming techniques were used in all four examined tillage systems. All operations within the field were carried out on the same track following the principles of CTF (Controlled Traffic Farming) and using machine linkages controlled by automatic steering systems with RTK accuracy (+/− 2.5 cm).
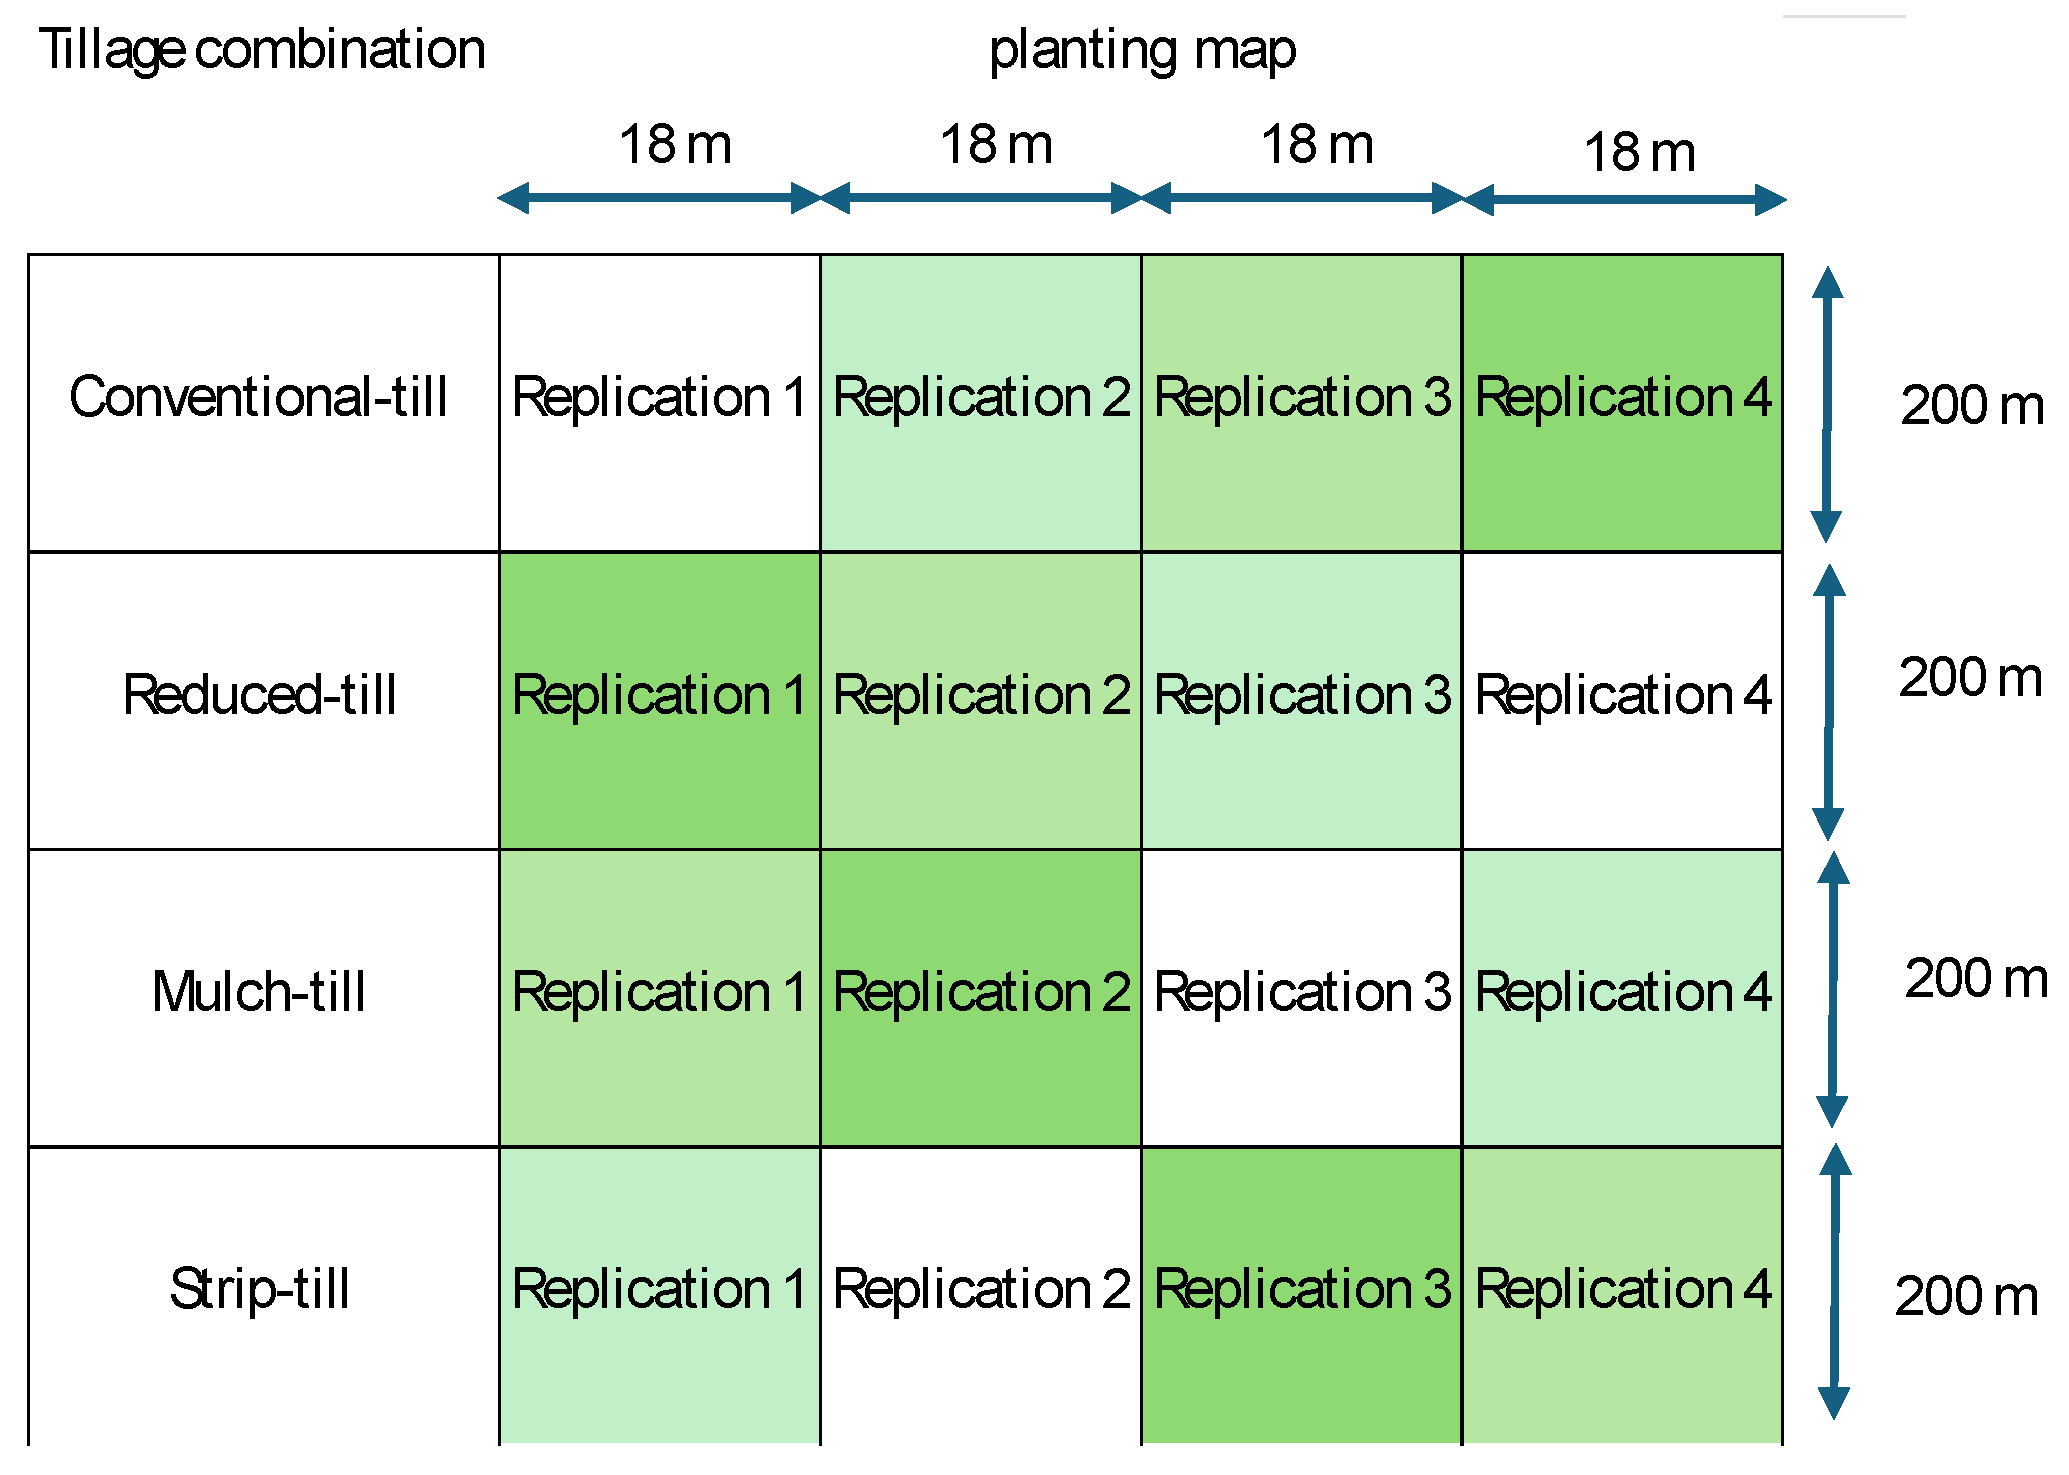
The examinations were carried out in 2021 and 2022. The examined area was established on the same plots in the two consecutive years. The area size was 4.5 ha, where the indicator crop was maize. The 4.5 ha plot was divided into 4 parts, where the 4 previously described different tillage systems were applied (
Figure 2). In each tillage method, 4 sample plots were set up, free from compaction caused by machinery implements, which the authors were able to observe with the help of CTF. The aim was to be able to evaluate the real changes in the soil under different tillage systems.
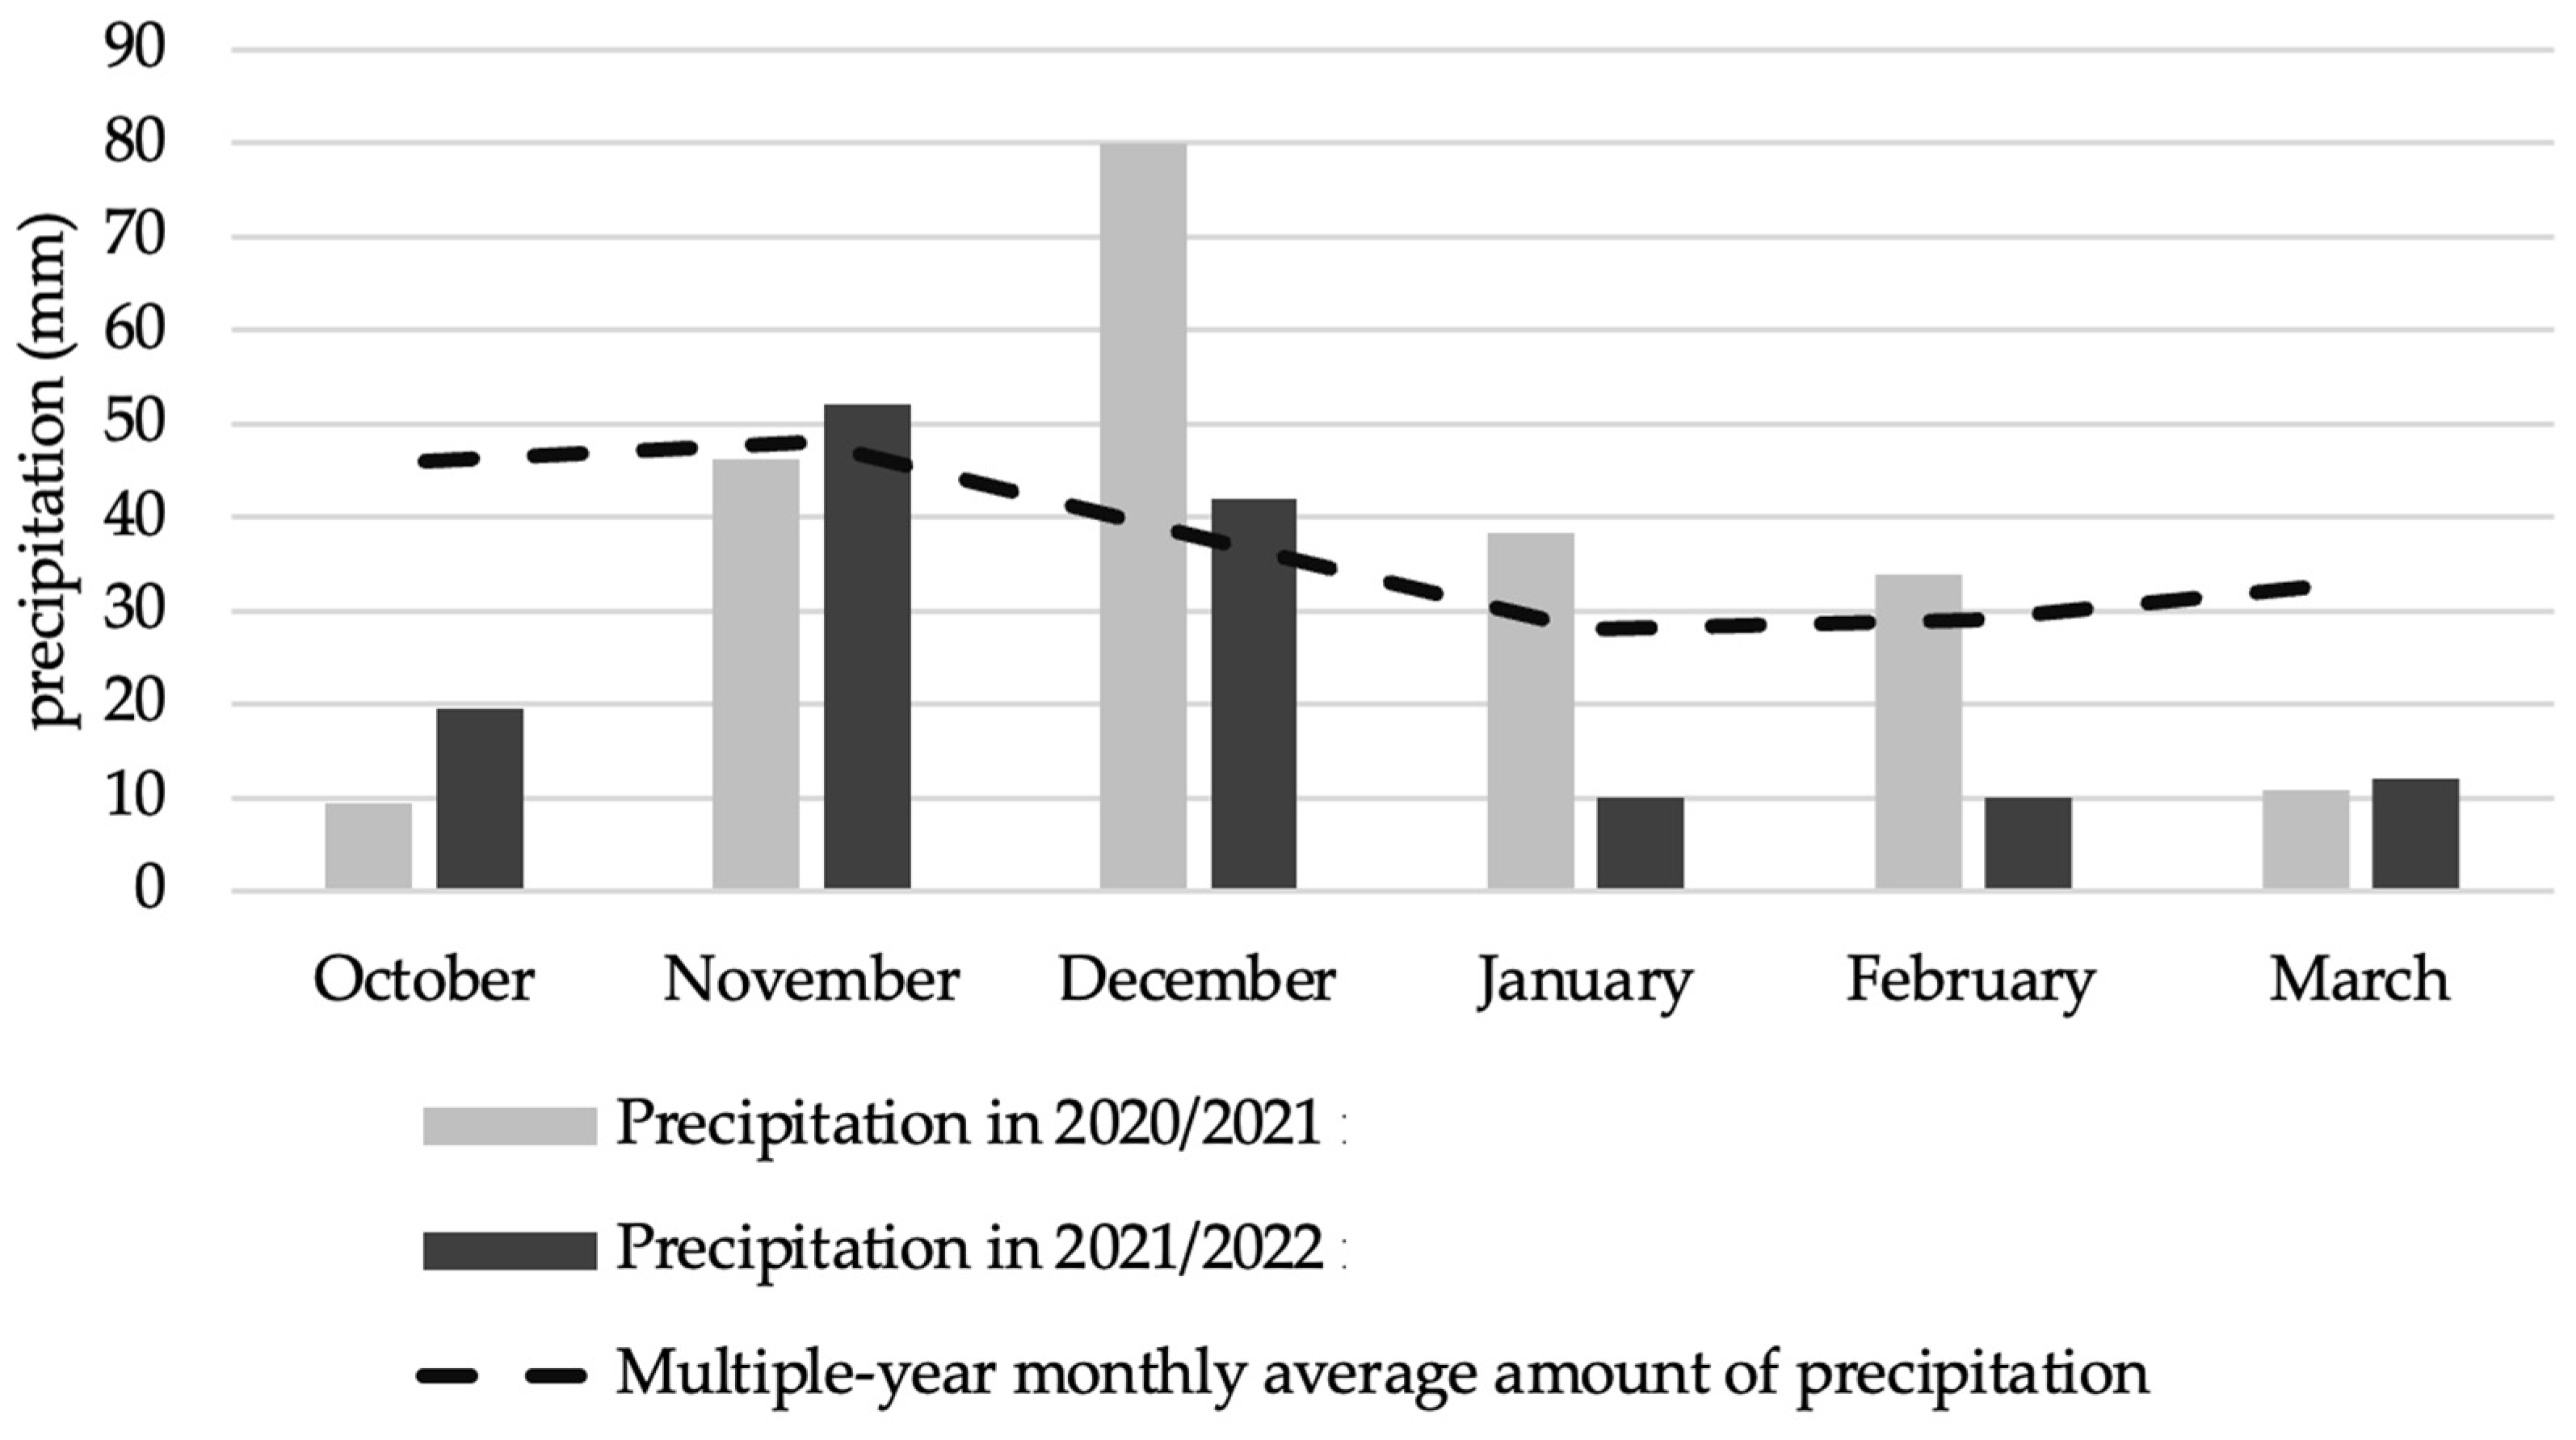
Based on the analysis of the prevailing weather conditions, precipitation values were divided into two parts, the pre-growing season (
Figure 3) and the growing season (
Figure 4). The data came from a meteorological station in the experimental area (type Davis 6466-M). The pre-growing season precipitation was 222 mm, averaged over 50 years. In the 2020/21 season, the precipitation was 218 mm, close to the long-term average, while in the 2021/22 season, there was 77 mm less precipitation, only 145 mm. The anomalies in the distribution of precipitation were also significant. In both years, below average rainfall was recorded in October, while January, February and March 2022 were particularly dry.
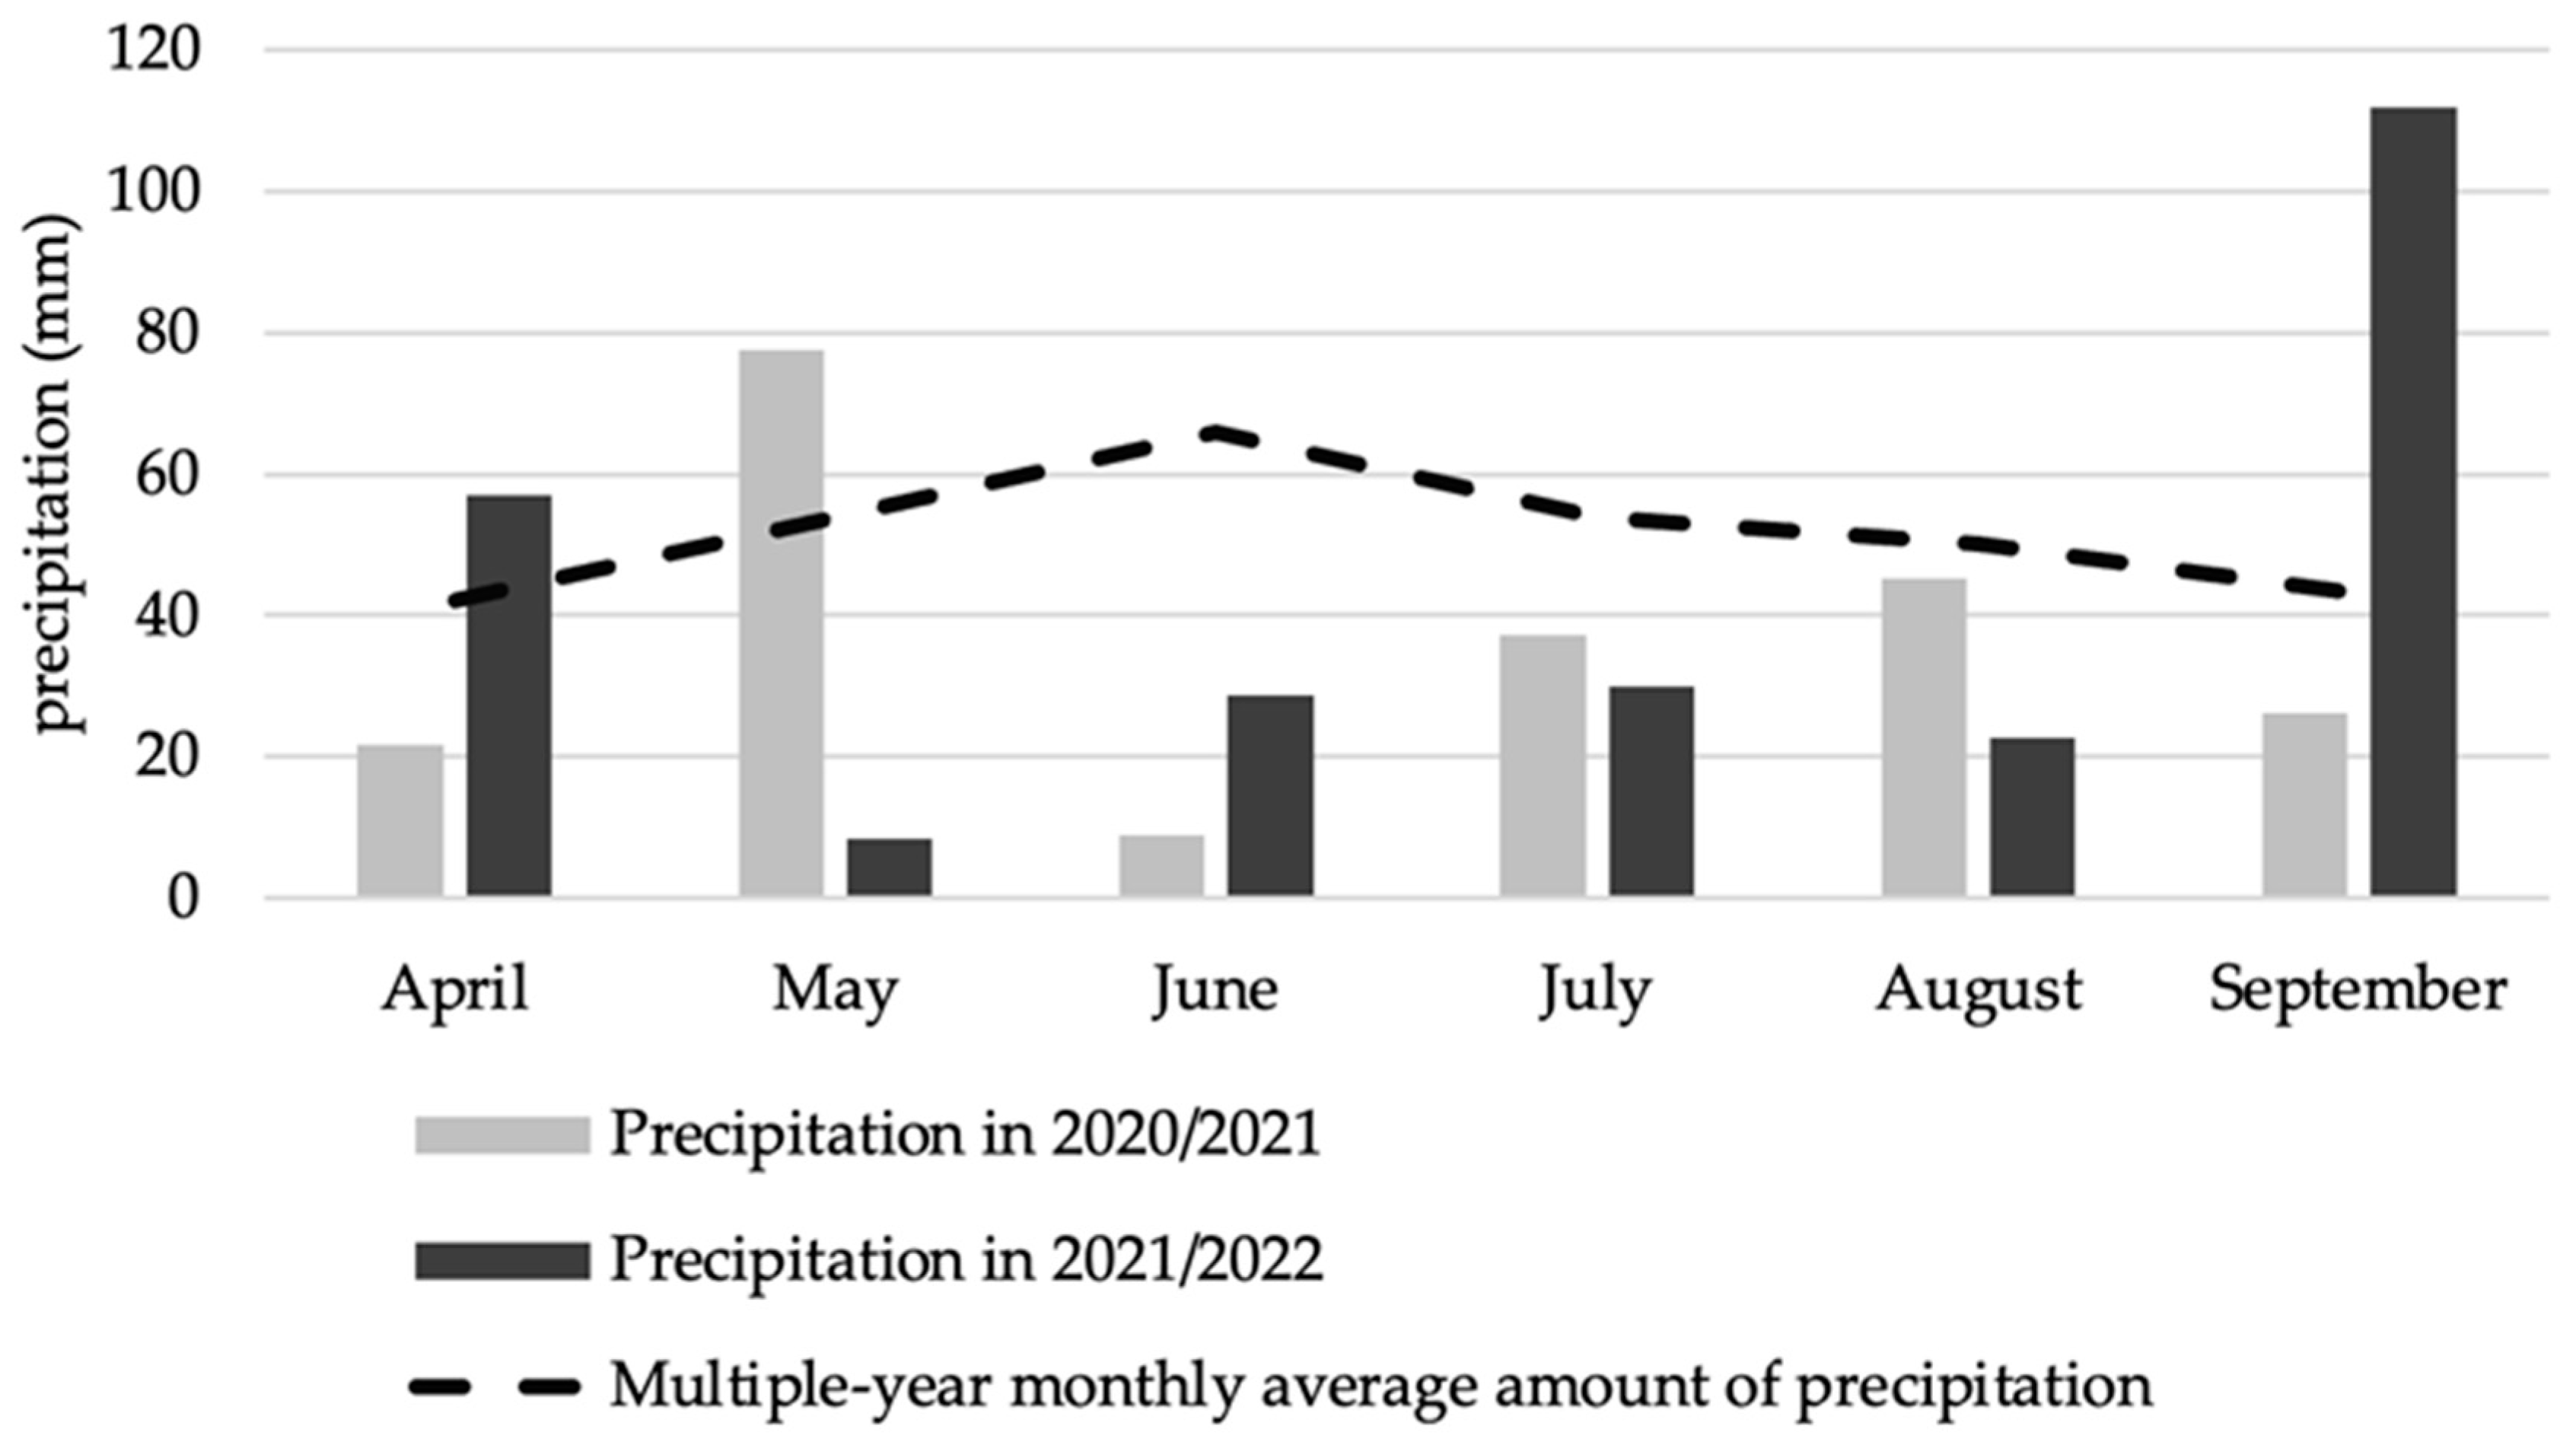
A comparison of the amount of rainfall during the growing season shows that it was significantly lower than the long-term average in both growing seasons. The 50-year average rainfall was 309 mm, compared to 216 mm in 2021 and 258 mm in 2022. In 2021, the early period tended to be more favourable in terms of precipitation, while later in the growing season rainfall was below the multi-year average. In particular, June was extremely dry, with a multi-year average of 66 mm and only 9 mm precipitation was recorded. Rainfall in 2022 was significantly below the 50-year average in all months except April and September. In the critical four months of the growing season (May, June, July, August), 80 mm less rainfall was recorded.
The physical composition and structure of the soil were measured and determined from a composite sample of the different examined plots (
Table 1). The soil was meadow chernozem, classified by FAO as Phaeozems-type soil [
34].
The chemical composition of the soil was characterised by favourable neutral pH, high organic matter content and a mid-heavy structure (
Table 2). In each treatment, four homogenised and randomised soil samples were taken at depths of 0–30 cm and 0–60 cm. The obtained soil samples were tested by an accredited soil laboratory (HL-LAB Ltd., Debrecen, Hungary) according to the Hungarian standards pH H
2O:MSZ-08-0206-2:1978; Mechanical composition: MSZ-08-0205:1978; organic matter:MSZ-08-0210:1977; pH
Kci: MSZ 20135:1999; CEC: MSZ-08-0206-2:1978.
The penetration resistance of the soil was measured in order to characterise soil looseness. Measurements were taken to a depth of 70 cm and the measurement device logged the obtained results in 1 cm increments. The device complied with ASAE S313.3 and it measured the penetration force in N dimensions, converted to megapascal (MPa) subsequently during the analysis. The device also measured soil moisture simultaneously and provided a v/v volume percentage value during the measurement.
Sixteen measurements were taken with the measurement device in each sample area. The measurement points were 1 m apart and in all cases were positioned in a row. The position of the measuring points was recorded with a GPS measuring device. Two measurements were taken in each crop year. The first measurement was performed in May, when the crops were still in the early stages of their developmental period, and the second in mid-August, during the period of biological maturation. The recorded GPS coordinates allowed the authors to repeat the measurements in the same place during the growing season and in the following year.
Precipitation data were measured at 10 min intervals at the experimental site using a Davis 6466-M rain gauge. Wireless radio frequency soil moisture sensors of Sentek Drill and Drop type were connected to the station. The probes, installed at a depth of 60 cm, measured the percentage soil water content by volume every 10 cm. Every 10 min, the obtained measurement results were transmitted to the central weather station and then transferred to a central server. Data were processed and statistically analysed using Microsoft Excel 365 and SPSS for Windows (version 25). Analysis of variance was used to determine significant difference. The probability level used in agricultural practice was p = 0.05. Duncan’s new multiple range test (MRT) was used to estimate the significance of differences between object means.
3. Results
The effect of temperature and humidity factors is best described in a comprehensive manner by the hydrothermal water supply index (K) according to Sielianinov:
Formula factors:
P is the monthly precipitation total (mm),
D is the number of days,
T is the mean daily air temperature in a given month (°C). The values of this index for individual months in the vegetation seasons of maize are given in
Table 3. Interpretation of the hydrothermal index according to Sielianinov is as follows: K > 1.5 denotes excessive moisture for most plants, 1 < K < 1.5 denotes sufficient moisture for most plants, 0.5 < K < 1.0 denotes insufficient moisture for most plants and K < 0.5 denotes drought. The 2022 growth season of May, June, July and August was very dry according to the results.
Analysis of variance (ANOVA) was used to statistically analyse the evolution of penetration values in the examined treatments. The statistical evaluation of the data measured in the zone in May 2021 showed that the penetration values from the soil surface to a depth of 40 cm were significantly different between the conventional and the systems based on the reduced methods. At depths between 40 and 60 cm, the soil conservation tillage systems had significantly looser structure than the other tillage systems (
Table 4).
Based on the results of the penetration measurements carried out in August 2021 on the same sample plots and at the same depths as previously, it was found that the loosest soil structure was in the 0–40 cm zone, which is particularly important for plant roots, in the strip tillage, while the densest was in the conventional tillage. A comparison of the data by zone and by tillage method showed no significant difference in penetration resistance values in the 0–10 cm layer. Based on the measured values, it was found that in the 20–30 cm layer, the conventional tillage system was significantly different from the reduced system (
Table 5), but they did not differ from each other. In the 30–40 cm and 40–50 cm layers, significant differences were measured for all tillage treatments.
Based on the results of the separate zonal measurements taken in May 2022, it was found that there was no significant difference between the penetration resistance values of the crops in the 0–10 cm layer (the zone of sowing depth). In the 10–20 and 20–30 cm layers, the soil structure of the conventional tillage was the loosest, with the lowest penetration resistance values. In the 30–40 cm layer, the trend was reversed, with the plots under conventional cultivation measuring as statistically distinct from the other cultivations (
Table 6). This zone had the highest penetration values, with the presence of a compacted layer exceeding 7 MPa.
Penetrations measured in August 2022 at the end of the growing season of the maize stand showed that in the 0 to 50 cm layer, the values of the conventional tillage system were significantly higher than those of all other systems. The loosest structure was found in plots under strip tillage (
Table 7).
The amount of moisture stored in the soil has a significant effect on plant development. For this reason, the moisture content of the soil was measured during the growing season. Soil moisture parameters were quantifiable in severely drought years, with 77 mm less precipitation in the growing season and 80 mm less in the pre-growing season compared to the 50-year average. In 2021, there was a significant difference between the conventional tillage and the different reduced tillage methods at a depth of 25–35 cm (
p < 0.05). In the upper shallow 15 cm soil layer during the sowing period in April, soil moisture content was significantly lower in conventional tillage than in reduced tillage with reduced number of operations, mulch tillage and strip tillage. The most significant difference was measured between conventional and mulch tillage, with a difference of 11.25
v/
v%. In May, due to spring rainfall, the moisture differences in the topsoil layer decreased, with no significant difference. During the phenological period of June and July, which is important for maize for yield differentiation and silking, most moisture was measured in the upper soil layer in the reduced-tillage system. In June, the moisture content was 21.51
v/
v% and it was 23.00
v/
v% in July, which was significantly different from the other tillage treatments. Also, in the period important for yield formation, reduced tillage resulted in the highest moisture value in the top 15 cm soil layer with 24.95
v/
v%, which was more than 64% higher than conventional tillage. In April, there was a similar trend in soil moisture in the deeper soil layers between the different tillage practices. Conventional tillage resulted in significantly lower soil moisture than all others. The largest difference was measured between conventional and mulch tillage at a depth of 25 cm, where mulch tillage resulted in 18.07
v/
v% higher soil moisture, and, at a depth of 35 cm, the difference was 18.42
v/
v% in April. Overall, in the 2021 growing season, the soil moisture content was significantly higher in all soil layers examined at the phenological stages important for early and maize development (
Table 8).
The 2022 crop year was extremely dry. The obtained results show that the soil moisture measured at 15–25 cm depth was significantly (
p < 0.05) lower in the first 2 months of the growing season in the conventional system compared to the other examined systems. At 35 cm depth, the soil moisture was significantly (
p < 0.05) lower in the conventional system compared to the other systems during the whole growing season. In April, the significantly highest moisture values in the top 15 cm soil layer were measured in the mulch and strip-till systems, with 24.72
v/
v% and 24.85
v/
v%, respectively, which were more than 65% higher than in the conventional tillage system. In June, there were significant differences between the different tillage methods in the topsoil layer. The differences between conventional and mulch tillage were evened out and they were not significantly different. The highest moisture content value in June was measured for the strip till, with 21.64
v/
v%, which was more than 60% higher than for conventional and mulch tillage. In July and August, the highest significant moisture content in the top 15 cm soil layer was obtained with the strip till. In July and August, strip till resulted in significantly higher moisture values in both the 25 cm and 35 cm soil layers compared to all tillage methods. Altogether, in the extreme dry year of 2022, when rainfall during the growing season was 80 mm below the long-term average, the strip till had the most favourable effect on soil moisture in all examined depth zones and months (
Table 9).
The penetration resistance can be used to evaluate the soil physical effects of tillage. In May and August 2021, soil resistance values were measured every cm from the soil surface to a depth of 70 cm in each tillage method. In evaluating the results, it was taken into account that 90% of the maize root zone is located in the soil depth from 0 to 60 cm and 85% of the total root zone is located in the zone from 0 to 30 cm [
35].
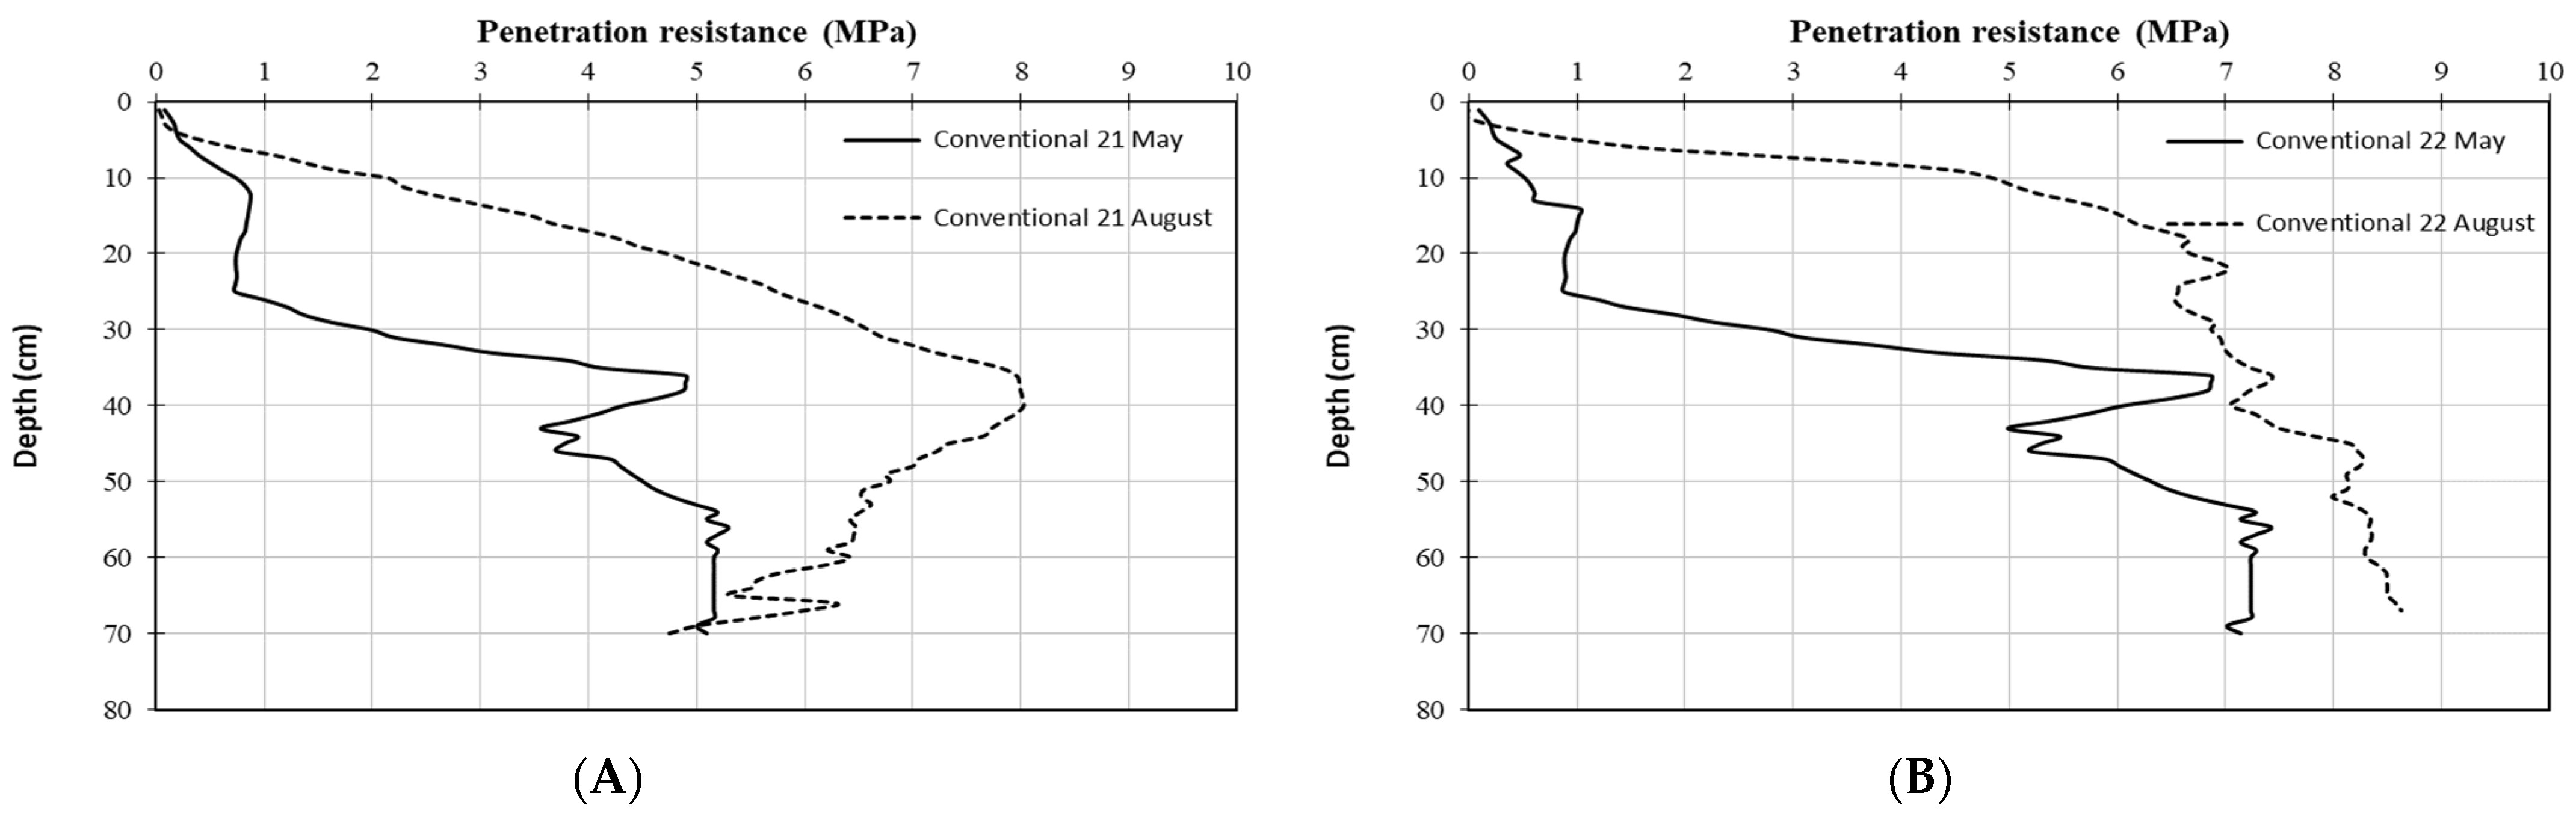
For conventional tillage, the penetration resistance was 1 MPa in the layer from 0 to 25 cm in May, below which a hard compacted layer was measured at approximately 5 MPa. This layer impedes root growth and water circulation. In August, the penetration resistance reached 5 MPa at a depth of 22 cm. At a depth of 40 cm, the maximum compaction value was 8 MPa (
Figure 5A). In 2022, in an extremely dry year, a similar condition was measured as in 2021 in the May period between 0 and 28 cm under conventional tillage. In the lower part of the ploughed layer, a very pronounced compacted layer was measured. This zone reached a compaction of 6.9 MPa between 28 and 34 cm, which is agronomically harmful. Below this layer, a more optimal, looser structure with a value of 5–5.3 MPa was found. At a depth of 55 cm, the cultivation reached its maximum compaction value of 7.3 MPa. This structure changed significantly by August. At a depth of 10 cm, a compactness of 4.8 MPa was measured. At a depth of 22 cm, a value of 7 MPa was observed, while 8.4 MPa was measured at 48 cm (
Figure 5B).
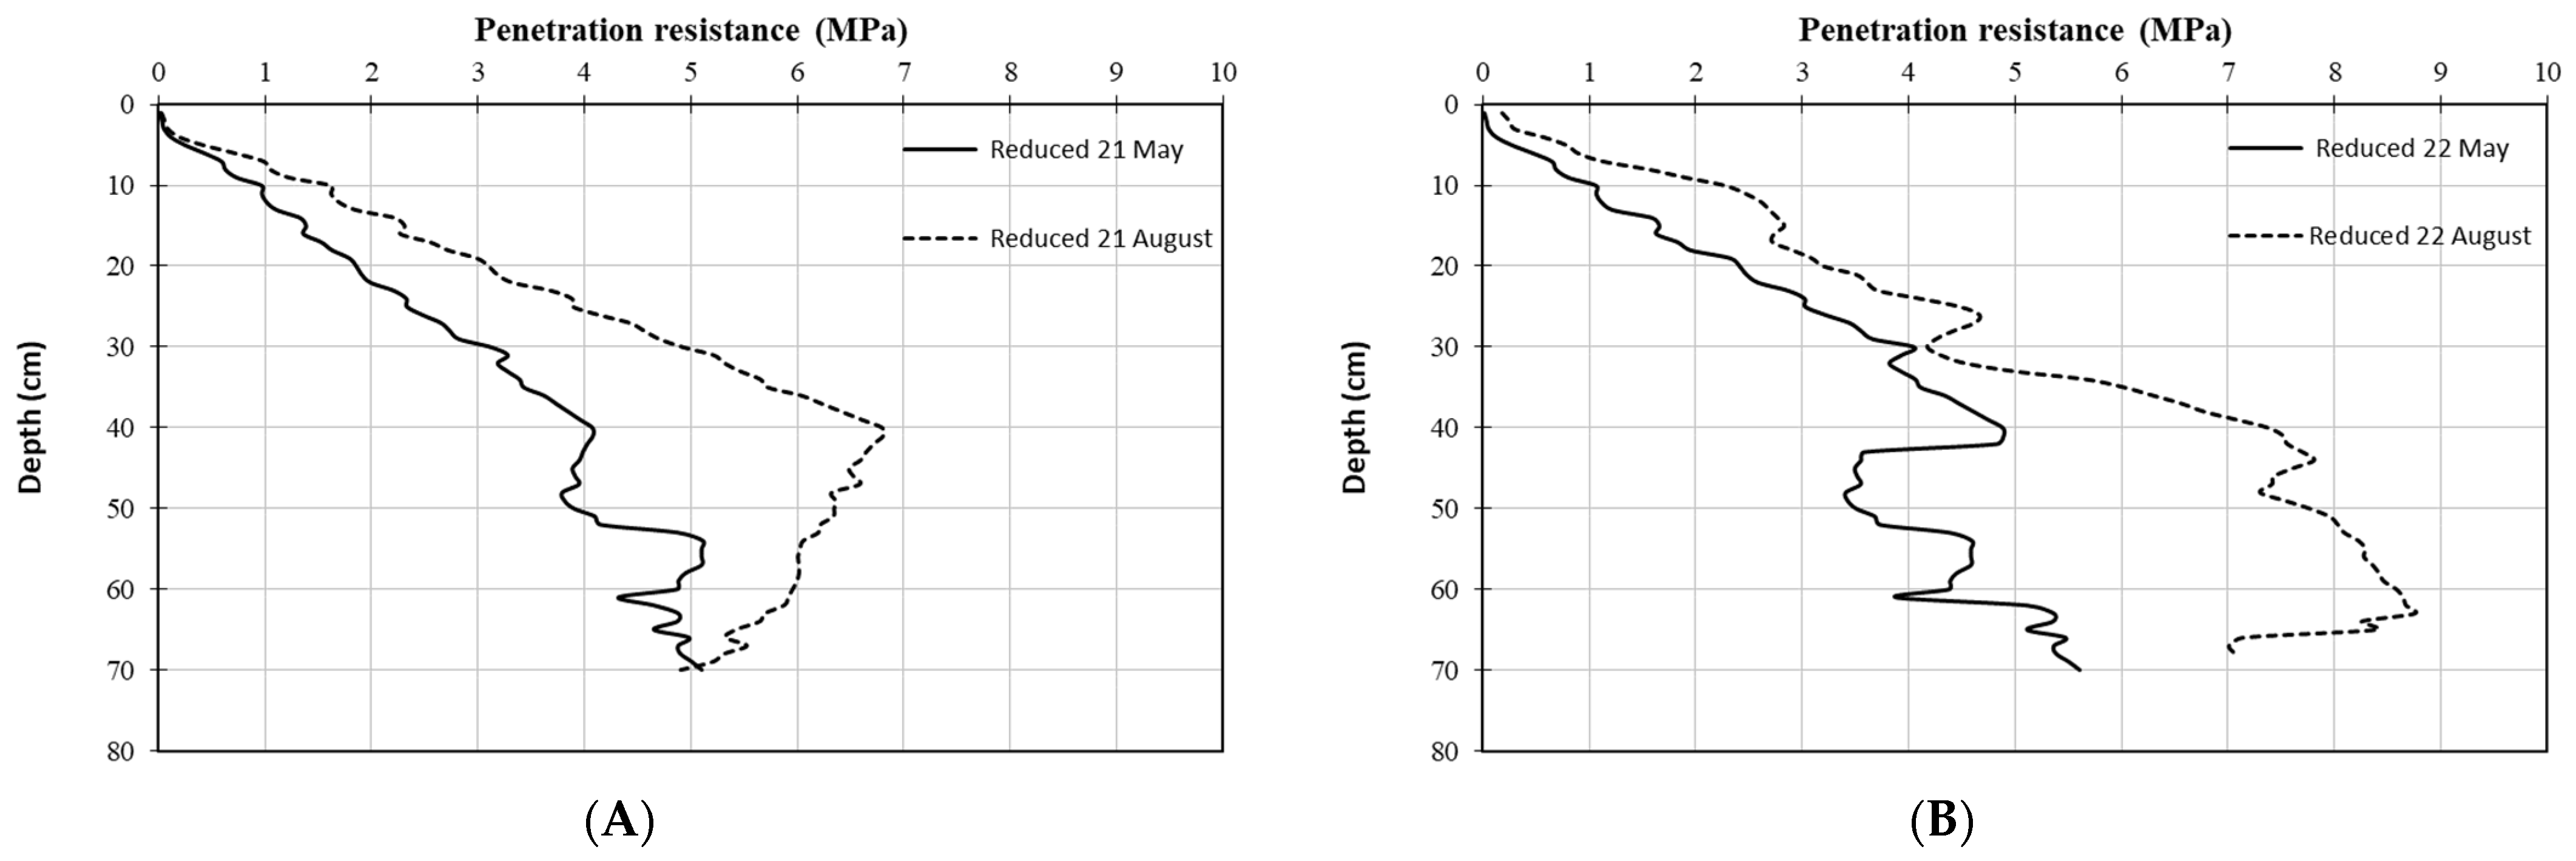
In the reduced-tillage system, the penetration resistance increased almost linearly in May 2021, reaching 4 MPa at a depth of 40 cm and 5 MPa at a depth of 52 cm. In the most compacted structure between 50 and 60 cm, 5.2 Mpa was measured. In August, the trend of penetration values in the experiment site was similar to that in May, but the difference is that it reached its maximum value of 6.8 MPa at a depth of 40 cm. Below 40 cm, the soil hardness decreased; at a depth of 70 cm, it was 5 MPa (
Figure 6A). In the reduced-tillage system, a penetration curve running linearly up to 40 cm was obtained in May 2022. During this time, the soil structure became looser, with the penetration resistance rising again below 60 cm. The measurement performed in August revealed a similar layered structure to that of May. The structure had compressed by 1 MPa compared to the May measurement. Average values of 4.18 MPa at 30 cm depth and 7.38 MPa at 40 cm depth were measured (
Figure 6B).
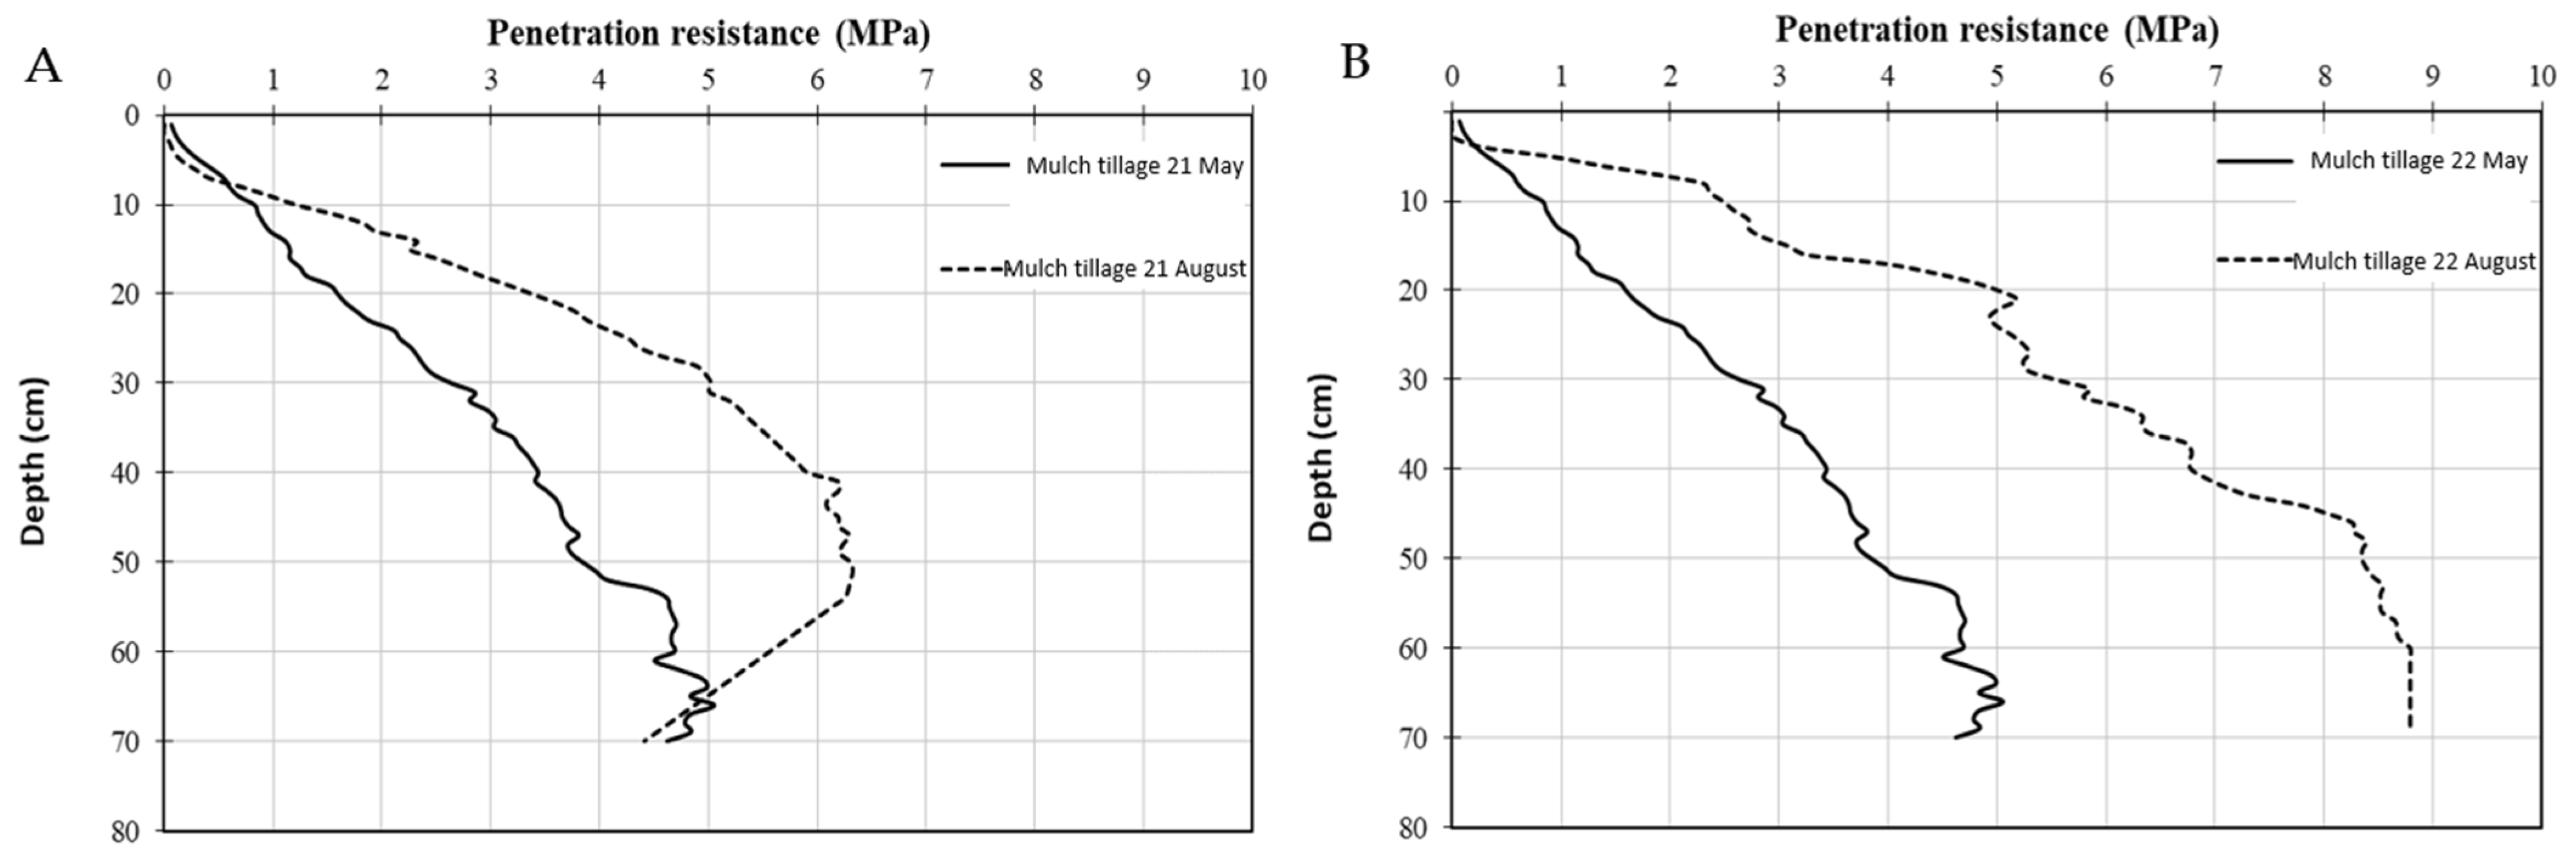
No compacted topsoil layer was found in the experiment site under the mulch-tillage system. In May, 0.83 MPa was measured at a depth of 10 cm and 2.64 MPa at a depth of 30 cm. The penetration resistance increased almost linearly and exceeded 5 MPa between 60 and 70 cm. In August, the 0–10 cm layer was basically the same as in May, and no compacted layer was measured. At a depth of 40–55 cm, this tillage method reached a maximum penetration value of 6.3 MPa. Below 55 cm, the penetration resistance of the soil decreased (
Figure 7A). In 2022, no compacted layer resulting from tillage was found in any of the measurements performed in the mulch-tillage system. In May, the compaction rate at 50 cm was 3.8 MPa, which is considered favourable. For the August period, this tillage method also retained the soil structure. The increasing penetration values were 5.2 MPa at 20 cm depth and 5.3 MPa at 30 cm (
Figure 7B).
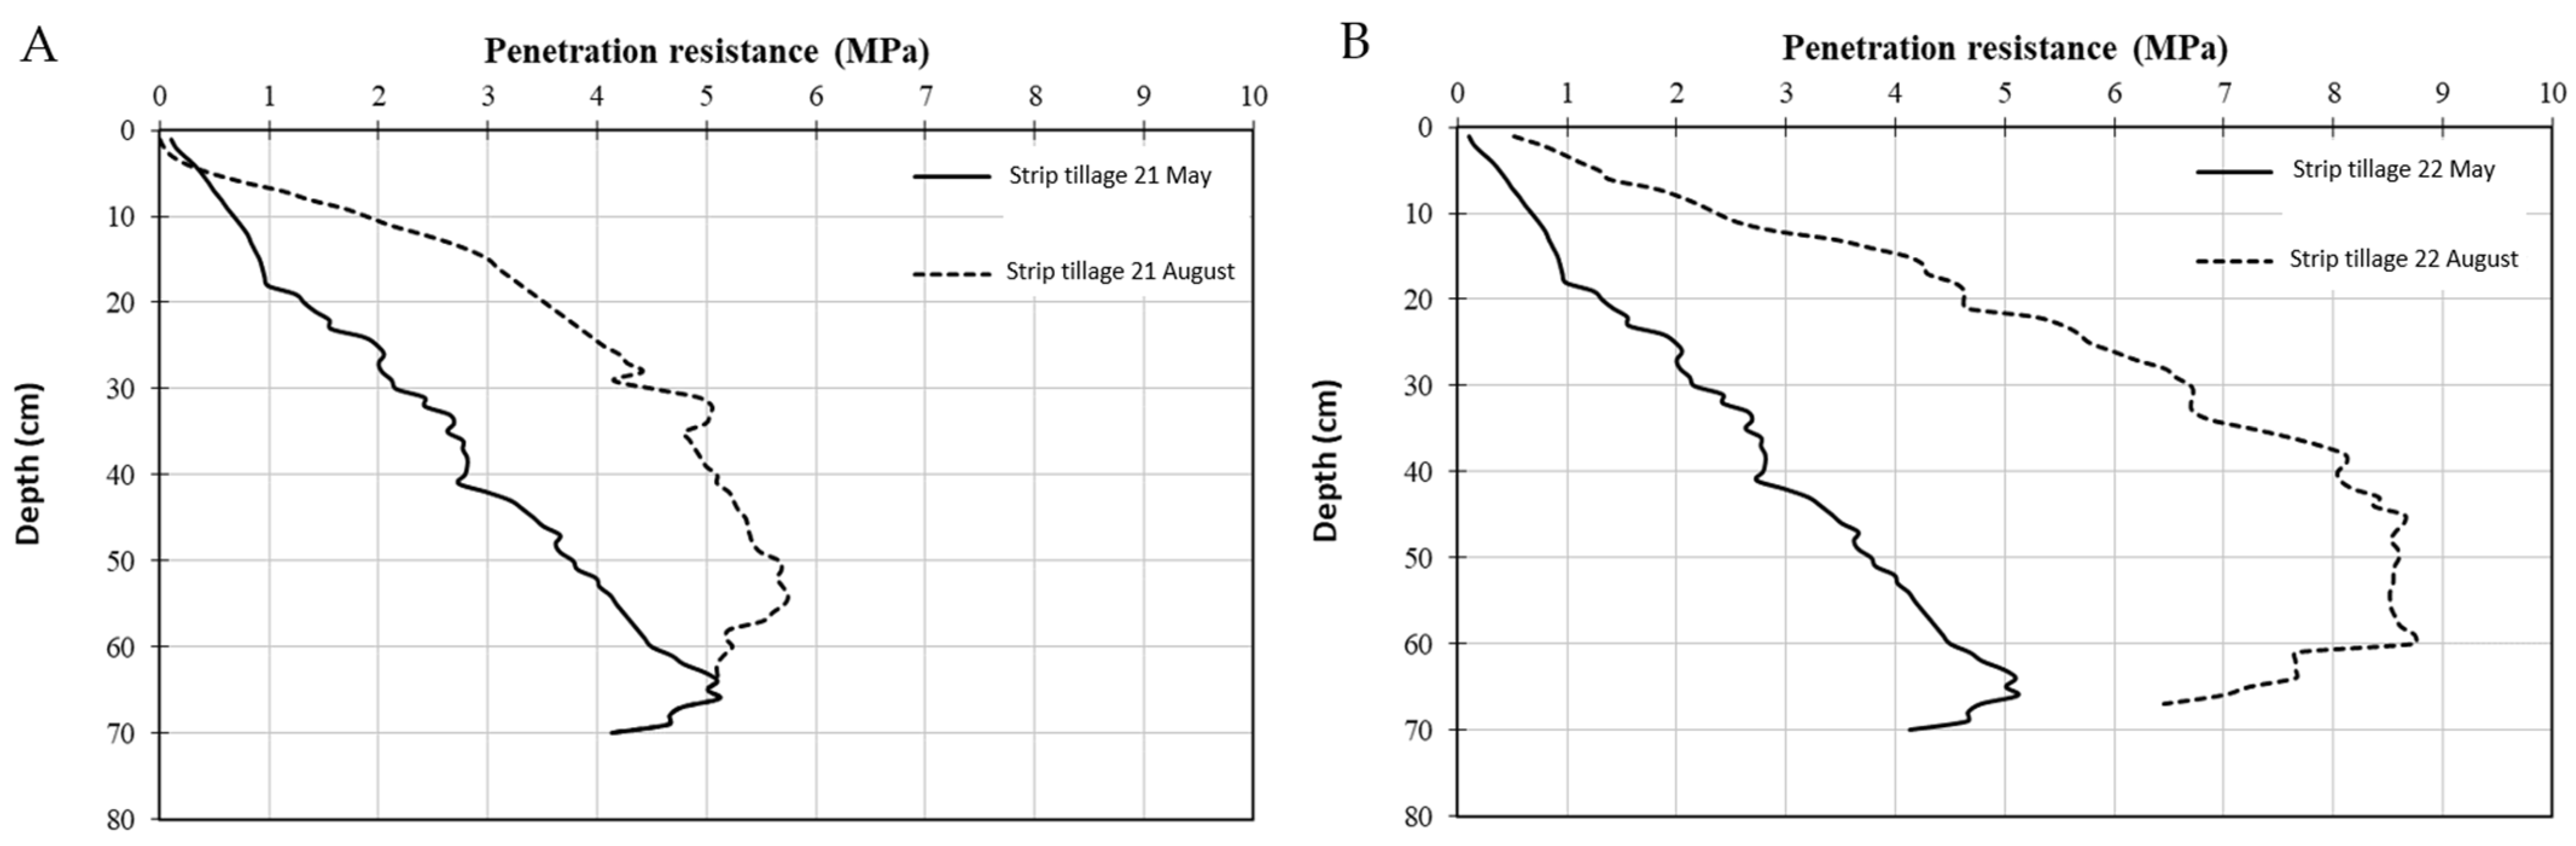
In the strip-till system, the May 2021 measurement revealed a favourable soil structure. At a depth of 30 cm a penetration resistance of 2.16 MPa was measured and at a depth of 40 cm a penetration resistance of 3.8 MPa was measured. The maximum compaction value at a depth of 65 cm was 5.2 MPa. The increase in values showed a nearly linear correlation. In August, the penetration resistance up to a depth of 8 cm was identical to the May soil structure. At a depth of 28–30 cm, the penetration resistance was 4.5 MPa, and at a depth of 33 cm the value was 5.1 MPa. The maximum value at 55 cm depth was 5.5 MPa. Between 55 and 70 cm, a decreasing penetration resistance was observed (
Figure 8A). In the 2022 crop year, a structure favourable for crop development was revealed in the area under strip tillage in May, with a value of 1 MPa at a depth of 20 cm and 2 MPa at 30 cm, which was optimal for maize root growth. In August, values of 4.8 MPa at 20 cm and 6.8 MPa at 30 cm were measured (
Figure 8B).
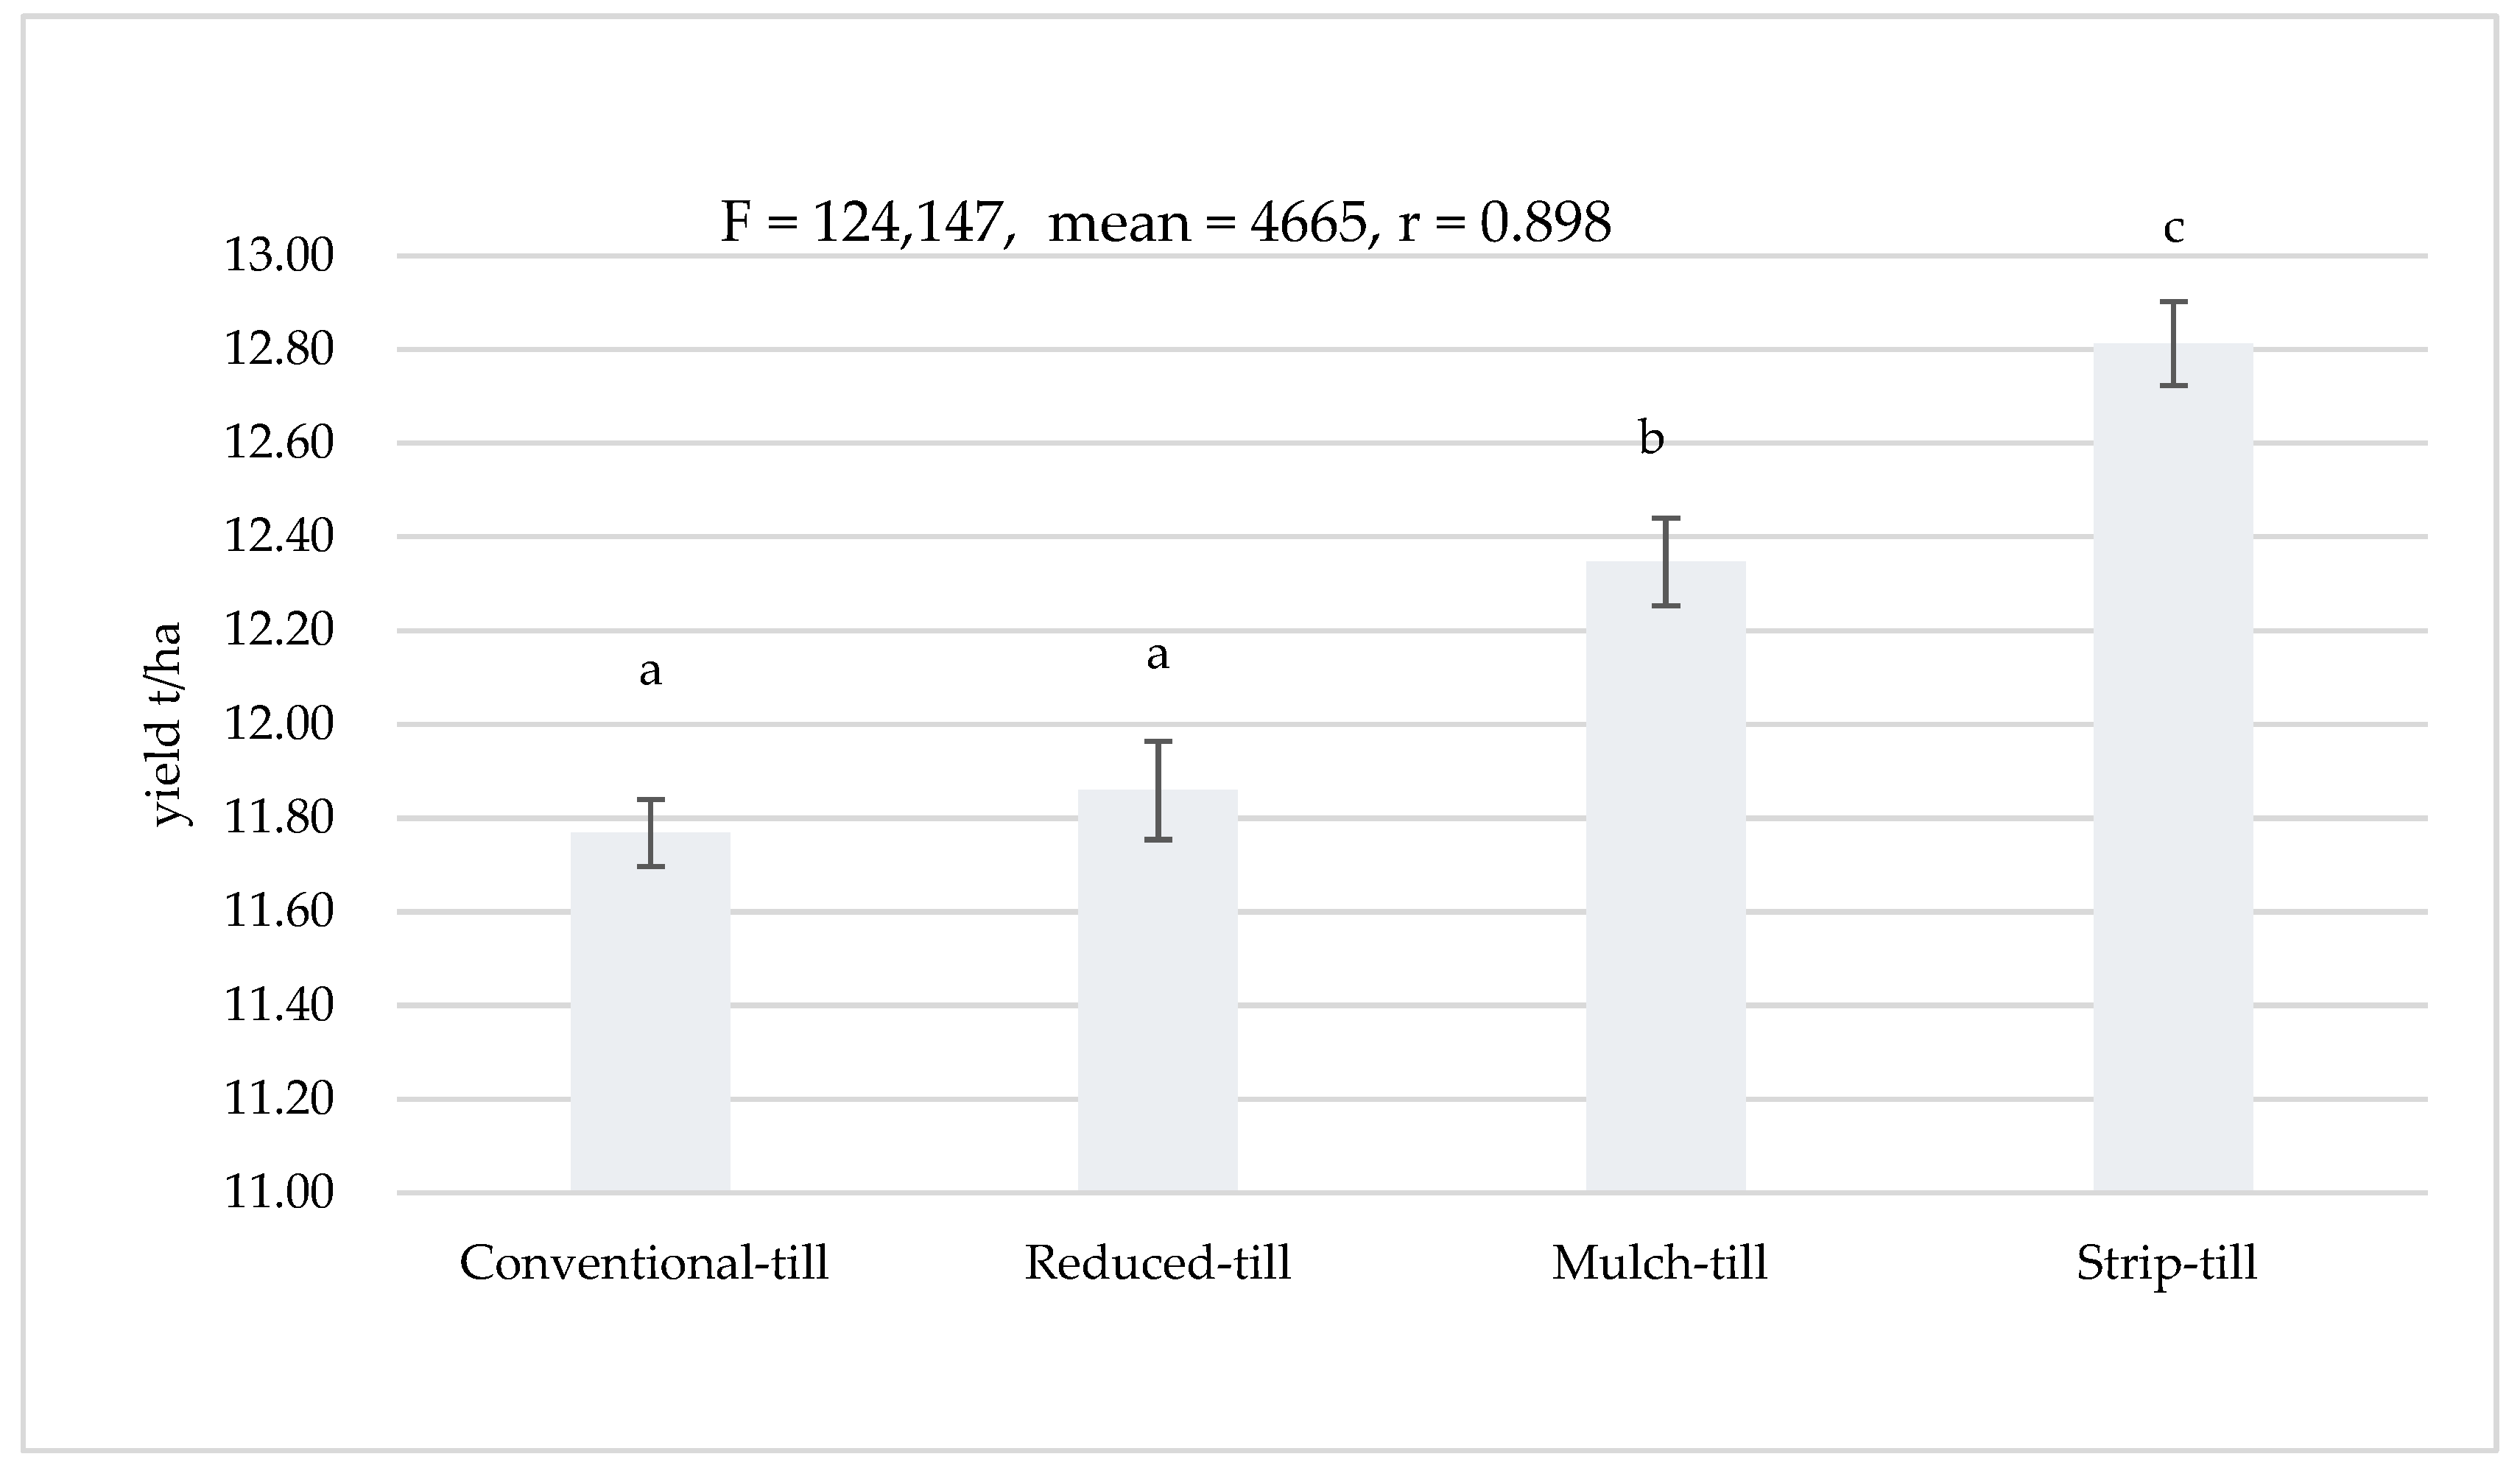
Figure 9 shows the maize harvest results for the experimental area in 2021. The yield obtained in the treatment area was not significantly different between the conventional till and the reduced till. Compared to these treatments and comparing each other, there was a significantly higher average yield of maize plants in the mulch-till and strip-till treatments. Based on the measured results, the crop stand in 2021 was able to use the optimal growing season conditions, which was reflected in the harvested yield.
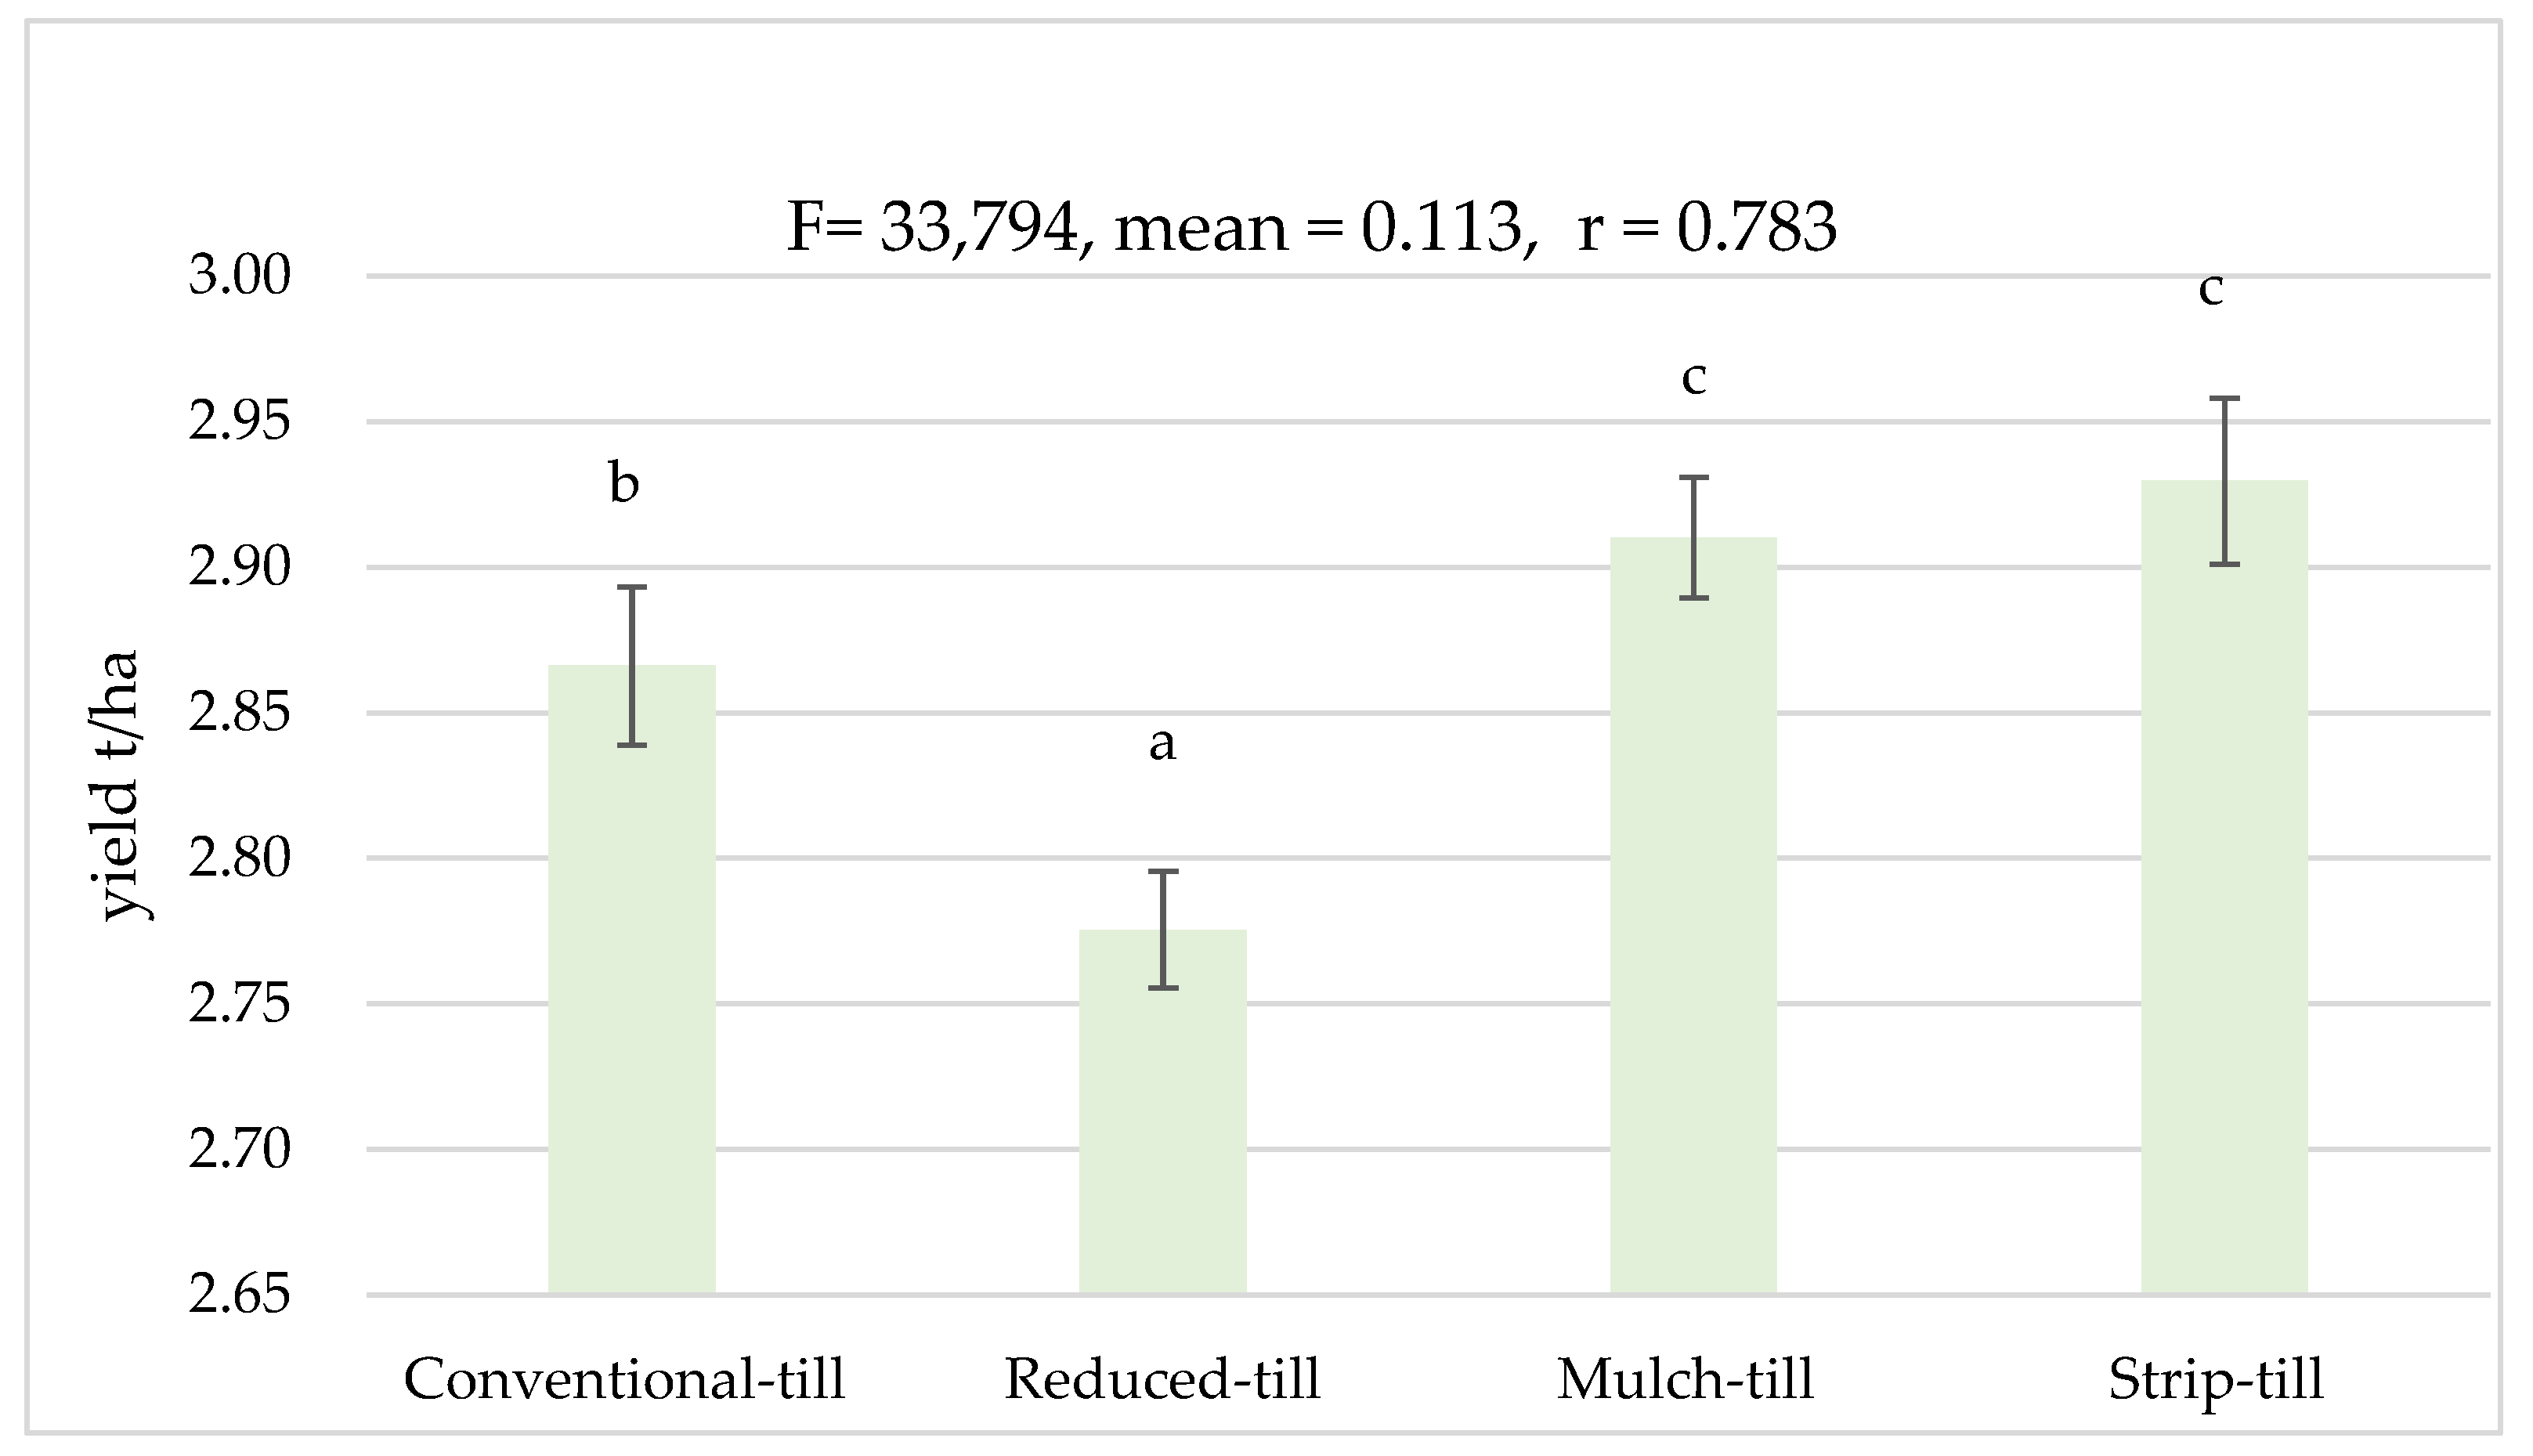
The yield level was lower in the extremely dry year of 2022 than in the previous year. The lowest yield was harvested after the reduced-till treatment. The conventional till produced the second highest yield. The mulch till and the strip till produced the highest yields statistically, with yields of these treatments not being significantly different from each other. The results showed that the used tillage method had an effect on some soil parameters. This effect also influenced the yield (
Figure 10).
4. Discussion
Several studies have shown that tillage has an impact on the physical properties of soil, which in turn affects the yield [
36]. This research has shown that not only the physical structure, but also the water holding capacity of the soil differs between various tillage systems. In both examined years, the obtained research results showed that the soil structure becomes more compact in the later stages of the growing season under conventional tillage systems compared to reduced systems. In the more favourable year of 2021, significantly higher soil moisture was measured in the deeper soil layers in the plots of the reduced system compared to the conventional system. In the extremely dry year of 2022, this effect was observed in the deeper zone of 35 cm.
The traditional tillage system is based on ploughing. This study found the greatest structural difference between the May and August conditions of both examined years. The performed study showed that this tillage system increased the porosity in the spring in the cultivated layer in the short term, but by August it reduced the stable structure of the soil, resulting in compaction. In May 2021, the soil penetration resistance did not exceed 0.75 MPa at a depth of 0–25 cm, and in 2022, the soil did not exceed 1 MPa. The obtained results are in agreement with those of Bronick and Lal [
37]. The performed measurements revealed the presence of a hard compacted layer between 25 and 40 cm, with values of 4.9 MPa in 2021 and 6.86 MPa in 2022. This hard layer hindered the development of plant roots. The higher value was observed in the drier year of 2022, when the water demand of the maize crop growing in the study area could have been met from the deeper soil layers, but the compacted structure prevented the plant roots from penetration. Similar results were obtained by Lal et al. [
38] and Munkholm et al. [
39]. The soil structure became compacted in August of both examined crop years, with maximum values of penetration resistance of 8.2 MPa and 8.27 MPa. Also, in terms of water holding capacity, significantly less
v/
v% water content was measured in the different soil layers, which also indicates that plants in this treatment can take up less water during stress periods. The penetration resistance measurements in the three types of reduced systems tested, in addition to conventional tillage, did not show compacted topsoil. The revealed structure indicated more favourable physical parameters, similar to the results obtained by Martens and Frankenberger [
40]. For the examined reduced systems, the penetration resistance increased almost linearly up to a depth of 60–70 cm in May.
Of the reduced systems, the most favourable soil structure values were measured in May in the strip-till system. In 2021, values of 1 MPa at 20 cm depth and 2 MPa at 30 cm depth were measured. In 2022, values of 1.32 MPa at 20 cm depth and 2.16 MPa at 30 cm depth were measured, which are optimal values for maize root growth. In reduced systems, the macroporosity, and thus the water holding capacity of the soil section, increased. The performed measurements revealed a significantly higher
v/
v% moisture in the soil zones of the strip-till system in the drier year of 2022. The obtained results showed that the soil moisture measured at 15 cm depth was significantly lower in the first two months of the growing season in the conventional tillage system compared to the others. At a depth of 35 cm, the soil moisture was significantly lower in the conventional farming system than in the other systems during the whole growing period. Rasmussen [
41] came to similar conclusions. The results of this research confirm the conclusions of Hernández [
42]. Based on the performed measurements, the values of 5 MPa in 2021 and 6.8 MPa in 2022 for the compacted layer under conventional tillage prevented root development; therefore, the maize root system was not able to reach the biologically required rooting depth. The maize root system develops laterally, seeking a zone of lower compactness [
43,
44]. This soil condition is not favourable under stress conditions, and the root system is less able to take up water. In all three no-tillage systems, a structurally looser soil structure developed in the reduced-, soil conservation- and strip-tillage systems, which was maintained throughout the growing season, compared to the conventional-tillage system.
An important consideration when choosing a tillage system is that there should be no compacted layer in the soil that inhibits root growth; even under irrigated conditions, a mechanical obstruction to root elongation often reduces root development [
45]. The authors have measured that reduced systems do not develop such an unfavourable layer, which promotes deeper root growth. In maize production, the water requirements of plants should be adapted to their developmental phenology. One of the periods of maize development with the highest water requirements is the silking period in July. Deeper roots are advantageous in years of drought and a lack of rainfall, as they help the crop to better absorb moisture [
46]. The value of the obtained scientific results is enhanced by the fact that the field measurements were made in the 5th–6th years of the tillage system experiments, i.e., the obtained results can be reliably exploited by the duration effects on chernozem-type soils.


