Article

TaqMan qPCR Detection and Quantification of Phytophthora cinnamomi in Soil and Plant Tissues for Walnut Disease Management

Council for Agricultural Research and Economics, (CREA)—Plant Protection and Certification (DC), Via C. G. Bertero 22, 00156 Roma, Italy
*
Author to whom correspondence should be addressed.
Agriculture 2024, 14(7), 999; https://doi.org/10.3390/agriculture14070999
Submission received: 29 May 2024 / Revised: 14 June 2024 / Accepted: 23 June 2024 / Published: 26 June 2024
(This article belongs to the Section Crop Protection, Diseases, Pests and Weeds)

Abstract

:
Phytophthora cinnamomi is a devastating soil-borne plant pathogen. The primary source of P. cinnamomi infection is the soil, where the pathogen can persist for long periods. Effective prevention and management of this pathogen in tree crops requires an early and reliable detection method. In this study, we developed a simple, fast, reliable, and sensitive method based on real-time quantitative PCR (qPCR) for P. cinnamomi detection and quantification directly in plant or soil samples. Primers were developed targeting the nuclear single-copy ras-related protein gene Ypt1, suitable for Phytophthora-specific PCR. The specificity of the assay was confirmed by testing it against genomic DNA from 50 isolates across eight different Phytophthora clades, including the very similar P. parvispora. The efficiency and reliability of the qPCR protocol were evaluated in challenging environmental samples, such as plant tissue of different host trees (walnut, chestnut, oak) and naturally infected soils in walnut orchards. The main outcome was the development of a qPCR method for the specific identification and quantification of P. cinnamomi in natural soil samples. Additionally, this study established a systematic and repeatable soil sampling method and developed an efficient soil DNA extraction technique to apply the developed qPCR in naturally infested soils of walnut orchards.

1. Introduction

Phytophthora, a genus prominent among oomycetes, encompasses over 150 species, with the majority acting as plant pathogens causing collar and root diseases in various plant species. These diseases often lead to the decline and eventual demise of the afflicted plants [1].
Phytophthora cinnamomi is the causal agent of several epidemics globally and across Europe, and it is considered one of the most devastating plant pathogens in the world [2]. Its impact spans forestry, horticulture, and nursery industries [3,4]. With a host range encompassing approximately 5000 woody plant species across 70 countries, P. cinnamomi poses a substantial threat [5,6,7,8].
Although initially prevalent in tropical and subtropical regions, P. cinnamomi has demonstrated adaptability to cooler and drier environments [6,7]. Its ability to thrive saprophytically in soil or persist asymptomatically in non-host plants significantly contributes to its long-term survival. P. cinnamomi is reported to be particularly damaging to oaks [9,10], chestnuts where it causes ink disease [11], and common walnuts (Juglans regia L.). This pathogen has led to substantial economic losses in all walnut-growing regions like southern Europe, the USA, and Chile [5,7,12,13,14,15]. Italy alone has witnessed the uprooting of over 150 hectares of common walnut orchards due to P. cinnamomi attacks [16].
Efforts to combat P. cinnamomi include research on resistant walnut rootstocks [17], the exploration of control strategies such as phosphite application [12,18], and the containment and/or eradication of spot infections [19]. Early detection remains pivotal in managing P. cinnamomi diseases, especially in tree cultivation where plant diagnosis often occurs late. A timely diagnosis, in these cases, could be performed by identifying the pathogen directly in the soil surrounding plants, thus, allowing the prevention and control of primary sources of infection.
The attention surrounding this pathogen is demonstrated by the number of identification methods developed over the years, starting from the first polymerase chain reactions (PCRs) in 2003 up to sniffer dogs in 2023 [20]. Molecular genetic assays designed for P. cinnamomi detection include polymerase chain reaction (PCR) [21], nested [22] and real-time PCR [23,24,25], loop-mediated isothermal amplification (LAMP), and a Recombinase Polymerase Amplification Assay (RPA) [26,27]. However, many lack specificity [28], and only a few are based on real-time PCR capable of quantifying pathogens [24,25].
Naturally infested soils were not quantified in these previous studies; one soil type was usually studied following inoculation with the pathogens. Thus, there are no reports on how the P. cinnamomi population in soil fluctuates in actual production fields.
The selection of diagnostic methods is typically driven by application needs. It depends on the specificity and/or sensibility required and on the necessity to have field applications and/or pathogen quantifications; moreover, a suitable DNA extraction method should be implemented, especially for environmental samples. For the correct management of tree cultivation, like walnut orchards in Northern Italy, we need a new P. cinnamomi early detection method, efficient especially for soil sample analysis, specific enough to distinguish P. cinnamomi from other Phytophthora present in the soil, sensible enough to detect the pathogen in very low amounts typical of soil samples, and with the possibility to quantify the pathogen biomass to know the level of infection.
In this context, the choice of genetic locus and in silico sequence analysis are crucial. While the internal transcribed spacer (ITS) of nuclear DNA is commonly used, it may not effectively discriminate between closely related Phytophthora species. The two existing real-time methods for P. cinnamomi detection [24,25] are both based on multicopy mitochondrial genes. In this work, we choose to design primers and probes on a nuclear single-copy gene containing introns, the ras-related Ypt1 gene, that offers advantages for phylogenetic analysis and species discrimination for diploid organisms like Phytophthora [29]. Moreover, this kind of gene, devoid of intergenomic concerted evolution typical of multicopy genes, could provide accurate quantification of pathogen biomass when analyzed with quantitative real-time PCR.
Successful molecular diagnostics hinge on obtaining sufficient, high-quality DNA from samples. Soil DNA extraction is often challenged by the low amount of DNA of single organisms present in soil and by the presence of polymerase inhibitors such as polyphenols, polysaccharides, and humic acids [30].
Overcoming these obstacles, a highly sensitive and specific qPCR methodology based on the ras-related Ypt1 gene was developed. The objectives of this study were to (i) develop a quantitative PCR (qPCR) assay for the sensitive and specific detection and quantification of P. cinnamomi, (ii) adapt the assay to the analysis of soil samples by improving the DNA extraction method and sampling procedure for the early detection of P. cinnamomi in the field, and (iii) validate the qPCR assays in walnut orchards infected by P. cinnamomi.

2. Materials and Methods

2.1. Phytophthora Isolates and Isolation

The isolates used in this study are listed in Table 1. A total of 50 Phytophthora isolates belonging to clades 1, 2, 4, 6, 7, 8, 9, and 10, plus two Pythium species (Table 1), were used to test the specificity and sensitivity of the primer set developed for P. cinnamomi diagnosis. Several P. cinnamomi isolates obtained from woody plants (walnut, oak, or chestnut) were used (Table 1). DNA from the P. cinnamomi isolate CREADC-Om274 from walnuts was used as a reference to set up real-time PCR conditions.
P. cinnamomi isolates were isolated from symptomatic plants from several Italian regions. Most of them were obtained from naturally infected common walnut (Juglans regia L.) trees grown in commercial fruit orchards in northern Italy. Stock cultures were preserved in the dark both in sterile distilled water at room temperature and at 10 °C, as well as in oatmeal agar (OA—Sigma-Aldrich, Saint Louis, MI, USA) slant tubes with mineral oil at 15 ± 2 °C at the CREA-DC culture collection in Rome. Pure cultures were obtained by transferring a single hyphal tip from the edge of the colonies onto potato dextrose agar (PDA) (Oxoid, Basingstoke, UK).
Tissue fragments were obtained from the collars or stems of infected woody material cut from the margins of necrotic lesions. Tissue fragments obtained from healthy plants were used as controls. Small tissue fragments of about 3–5 mm × 3–5 mm, previously surface disinfested for 1 min in a 1% NaOCl solution and rinsed for 5 min in sterile distilled water, were either plated onto P5ARPH selective medium [31] or placed in a 1.5 mL Eppendorf ® tube for DNA extraction and stored at −20 °C until use.

2.2. DNA Extraction from Pure Colony and Plant Tissue

For all Phytophthora and Pythium isolates used in this study, mycelial DNA was extracted from pure cultures grown on PDA at 25 °C for 5 days in the dark. Mycelium was scraped and ground to a fine powder under liquid nitrogen, placed in a 1.5 mL sterile Eppendorf® tube and stored at −20 °C until use. Total DNA was extracted using a Wizard genomic DNA purification kit (Promega, Madison, WI, USA) following the manufacturer’s instructions.
DNA extraction from plant tissue was performed on approximately 100 mg of tissue fragments. Samples were homogenized by grinding in liquid nitrogen, and total DNA was extracted using the DNeasy Plant Mini kit (QIAGEN GmbH, Hilden, Germany) following the manufacturer’s instructions.

2.3. Real-Time PCR Primer and Probe Design for P. cinnamomi

The single copy ras-related protein gene Ypt1 was chosen to design the primers and probes. For this purpose, 51 Ypt1 gene sequences of Phytophthora spp., representing all ten clades of Phytophthora philogeny and one Ypt1 sequence of Pythium aphanidermatum, were retrieved from the NCBI GenBank Database (Table S1) and aligned using the multiple sequence comparison by the log-expectation (MUSCLE) method [32] to find the unique polymorphic regions of P. cinnamomi. Based on these regions, primers and probes were designed by PRIMER3 0.4.0 (http://frodo.wi.mit.edu/primer3/) (accessed on 14 April 2020) [33]. The probe was labeled at the 5′ end with 6-carboxyfluorescein (FAM) as a reporter dye and modified at the 3′ end with the quencher Black Hole Quencher1 (BHQ1). Primers and probe melting temperatures (TM) were calculated using PRIMER 3 software [34].

2.4. qPCR Conditions

All real-time PCR reactions were run in MultiplateTM PCR 96-well clear plates (Bio-Rad, Hercules, CA, USA) using a CFX96 C1000 Thermal Cycler Real-Time System (Bio-Rad, Hercules, CA, USA). Data acquisition and analysis were obtained using the supplied Bio-Rad CFX Manager software version 3.0 (3.0.1224.1015) according to the manufacturer’s instructions.
Each 15 μL reaction contained 1μL of genomic DNA,1x GoTaq® G2 Hot Start Buffer (Promega), 5 mM of MgCl2, 0.2 mM of each dNTP, 0.33 μM of each primer, 0.13 μM of the probe, and GoTaq® G2 Hot Start DNA Polymerase (Promega). Negative control reactions contained 1 µL of sterile distilled water. Reactions were performed under the following conditions: 10 min at 95 °C, followed by 40 cycles at 95 °C for 20 s, and 62 °C for 20 s. Fluorescence was monitored in each PCR cycle during the annealing–extension phase at 62 °C. The cycle threshold (Ct) value was calculated automatically using software version 3.0 (3.0.1224.1015) by determining the PCR cycle number at which the reporter fluorescence exceeded the background. Triplicate reactions were performed in each assay, and each assay was repeated at least twice.
A nested approach, based on a first-round amplification with Phytophthora genus-specific primers before the real-time method was developed, was used in an attempt to increase sensitivity. Nested real-time PCR conditions were as follows: The first-round PCR was performed with primers YPh1-fwd and YPh1-rev (Table 2) for Phytophthora spp., with amplification in conventional PCR following conditions described by Schena [21]. The second round was carried out with 1μL of the first-round PCR product as a template in real-time PCR using the primer pair and the probe developed in this study at the conditions described above.

2.5. Validation of the Real-Time PCR Method

To assess the analytical sensitivity, a log-linear standard curve was generated with the following concentrations of the P. cinnamomi isolate CREADC-Om274 genomic DNA, 5, 2, and 1 ng/μL, 500, 200, 100, 50, 20, 10, 5, 2, and 1 pg/μL, and 500, 200, 100, and 50 fg/μL, by plotting logarithms of known concentrations of target DNA against the Ct values, considering three replicates for each concentration level. The resulting regression equations were used to calculate the P. cinnamomi DNA amount in unknown samples.
The limit of detection (LOD, expressed in ng) was determined as the lowest amount of target genomic DNA that was amplified in 100% of the replicates. The linearity of the method was evaluated on three different P. cinnamomi isolates: CREADC-Om274 from walnuts, CREADC-Om139 from chestnuts, and CREADC-Om144 from oaks.
To determine the Ct cut-off value, i.e., the Ct above which signals are considered negative, we analyzed serial dilutions, i.e., 10 and 1 ng/μL, 100, 10, and 1 pg/μL, and 100, 50, and 10 fg/μL, of the P. cinnamomi, isolate CREADC-Om274’s genomic DNA; each concentration (group) had five replicates. The cut-off cycle was obtained from the mean Ct of the last group of samples with at least 3 replicates positive for a DNA concentration out of five plus 0.5 (to consider the difference in threshold chosen between runs).
The analytical specificity of the qPCR was tested using 1ng/μL of DNA gDNA from the 50 Phytophthora spp. and the two Pythium spp. isolates listed in Table 1. Prior to the specificity test, all DNA samples were subjected to conventional PCR with primers ITS6 and ITS4, according to Cooke [35], to check their ability to be amplified. For pathogen quantification, a standard curve with ten-fold dilutions from 1 ng/μL to 100 fg/μL of the P. cinnamomi isolates CREADC-Om274’s genomic DNA was performed.

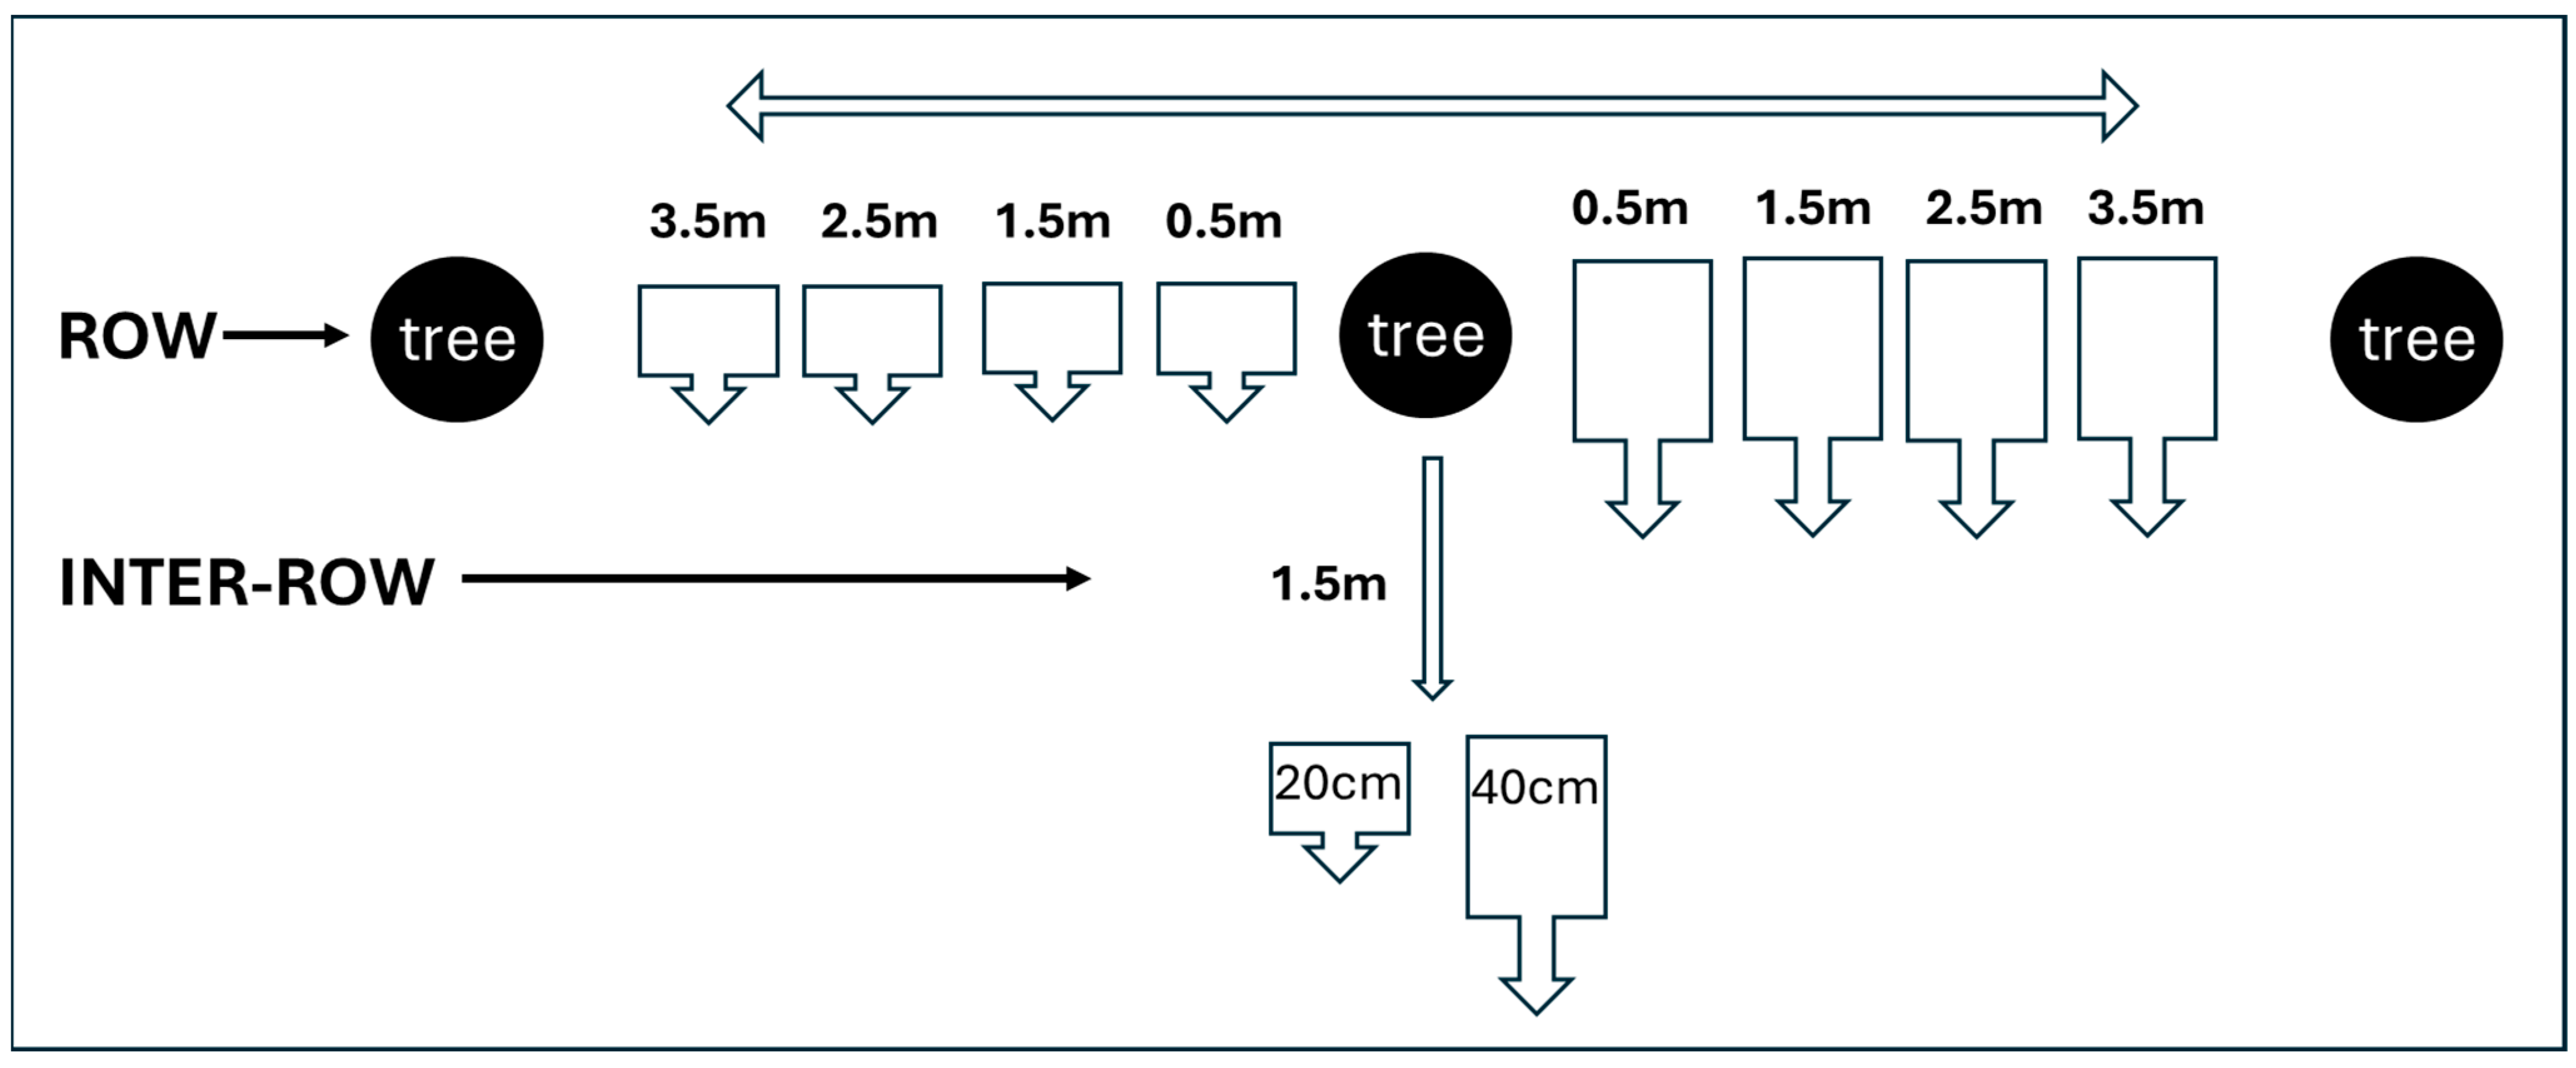
2.6. Soil DNA Extraction and Sampling

For soil DNA extraction from pot plants, Quick-DNATM Fecal/Soil Microbe Midi Prep Kit (Zymo Research, Irvine, CA, USA) on 3–5 g of soil was used following the manufacturer’s instructions. For field soil samples, the following modifications were made: 15 g of soil for each sample was placed in a 50 mL Falcon® containing Bashing BeadsTM, 100 µL of Proteinase K (20 mg/mL; Sigma, Saint Louis, MO, USA), and 27 mL of lysis buffer (0.1 M Tris-HCl pH 8, 0.1 M EDTA, 0.1 M Na2HPO4, 1.5 M NaCl, 1% CTAB (hexadecyltrimethylammonium bromide; pH 8). Homogenization was performed using a Fast-Prep 24 5G (MP Biomedicals, Santa Ana, CA, USA) at a speed of 6.0 m/s for 40 s, using the Adapter BigPrep for a 50 mL Falcon®. Then, 6 mL of 10% SDS was added, and the samples were incubated for 2 h at 65 °C followed by centrifugation at 6000× g for 10 min. The supernatant was taken and filtered using Zymo Spin V-E columns provided in the Quick-DNATM Fecal/Soil Microbe Midi Prep Kit (Zymo Research, Irvine, CA, USA). Subsequent DNA purification steps were performed following the Zymo Research kit manufacturer’s instructions. Total DNA was suspended in 150 µL DNA Elution Buffer. This volume was concentrated to 45 µL by ethanol precipitation. Soil DNA extractions were performed in 3 replicates per sample. After the extraction procedures, the concentration and quality of DNA were checked using Qubit with the dsDNA HS Assay Kit (Invitrogen, Carlsbad, CA, USA) and using the Nanodrop ND-1000 (Thermo Fisher Scientific Inc., Waltham, MA, USA). DNA was stored at −20 °C until use.
To test the effect of the matrix on the amplification efficiency, DNA extractions from the different soils analyzed were spiked with known concentrations of the P. cinnamomi isolate CREADC-Om274 genomic DNA, namely, from 1 ng/μL to 100 fg/μL, as standard curves.
Sampling: Soil samples (250 g) were collected as shown in Figure 1. In the orchard, walnut trees were arranged in rows, at 4–5 m from each other, with approximately 7–8 m between one row and the other. Soil samples were collected at 0.5 m, 1.5 m, 2.5 m, and 3.5 m from the tree along the row at two different depths, 20 cm and 40 cm (Figure 1). Soil samples were also collected between one row and the other (inter-row) at 1.5 m from the tree and at the two depths of 20 cm and 40 cm.
Non-dried soil samples were extracted upon arrival at the laboratory or after storage at −80 °C. Diseased plant material, as well as soil samples, were collected in spring and fall.

3. Results

3.1. Primers and Probe Design

The Ypt1 gene region amplified by YPh1-fwd and YPh1-rev (Figure 2) showed high interspecific variability, allowing the differentiation of P. cinnamomi from all the other species considered. Based on the multiple sequence alignments of this region, conducted with MUSCLE, the primers were designed in the polymorphic region of intron 3 (Figure 2; Table 2). Phytophthora sequences present in the GenBank were used for comparison. A total of 51 Ypt1 gene sequences representative of 48 different Phytophthora species and two Pythium species were compared (Table S1).
The primers and probe were designed to specifically identify P. cinnamomi. The two primers consistently amplified a 75 bp-long amplicon, and the fluorogenic TaqMan probe P. cinn3.31 was designed to anneal to a 35 bp region located between the two primers (Figure 2; Table 2).

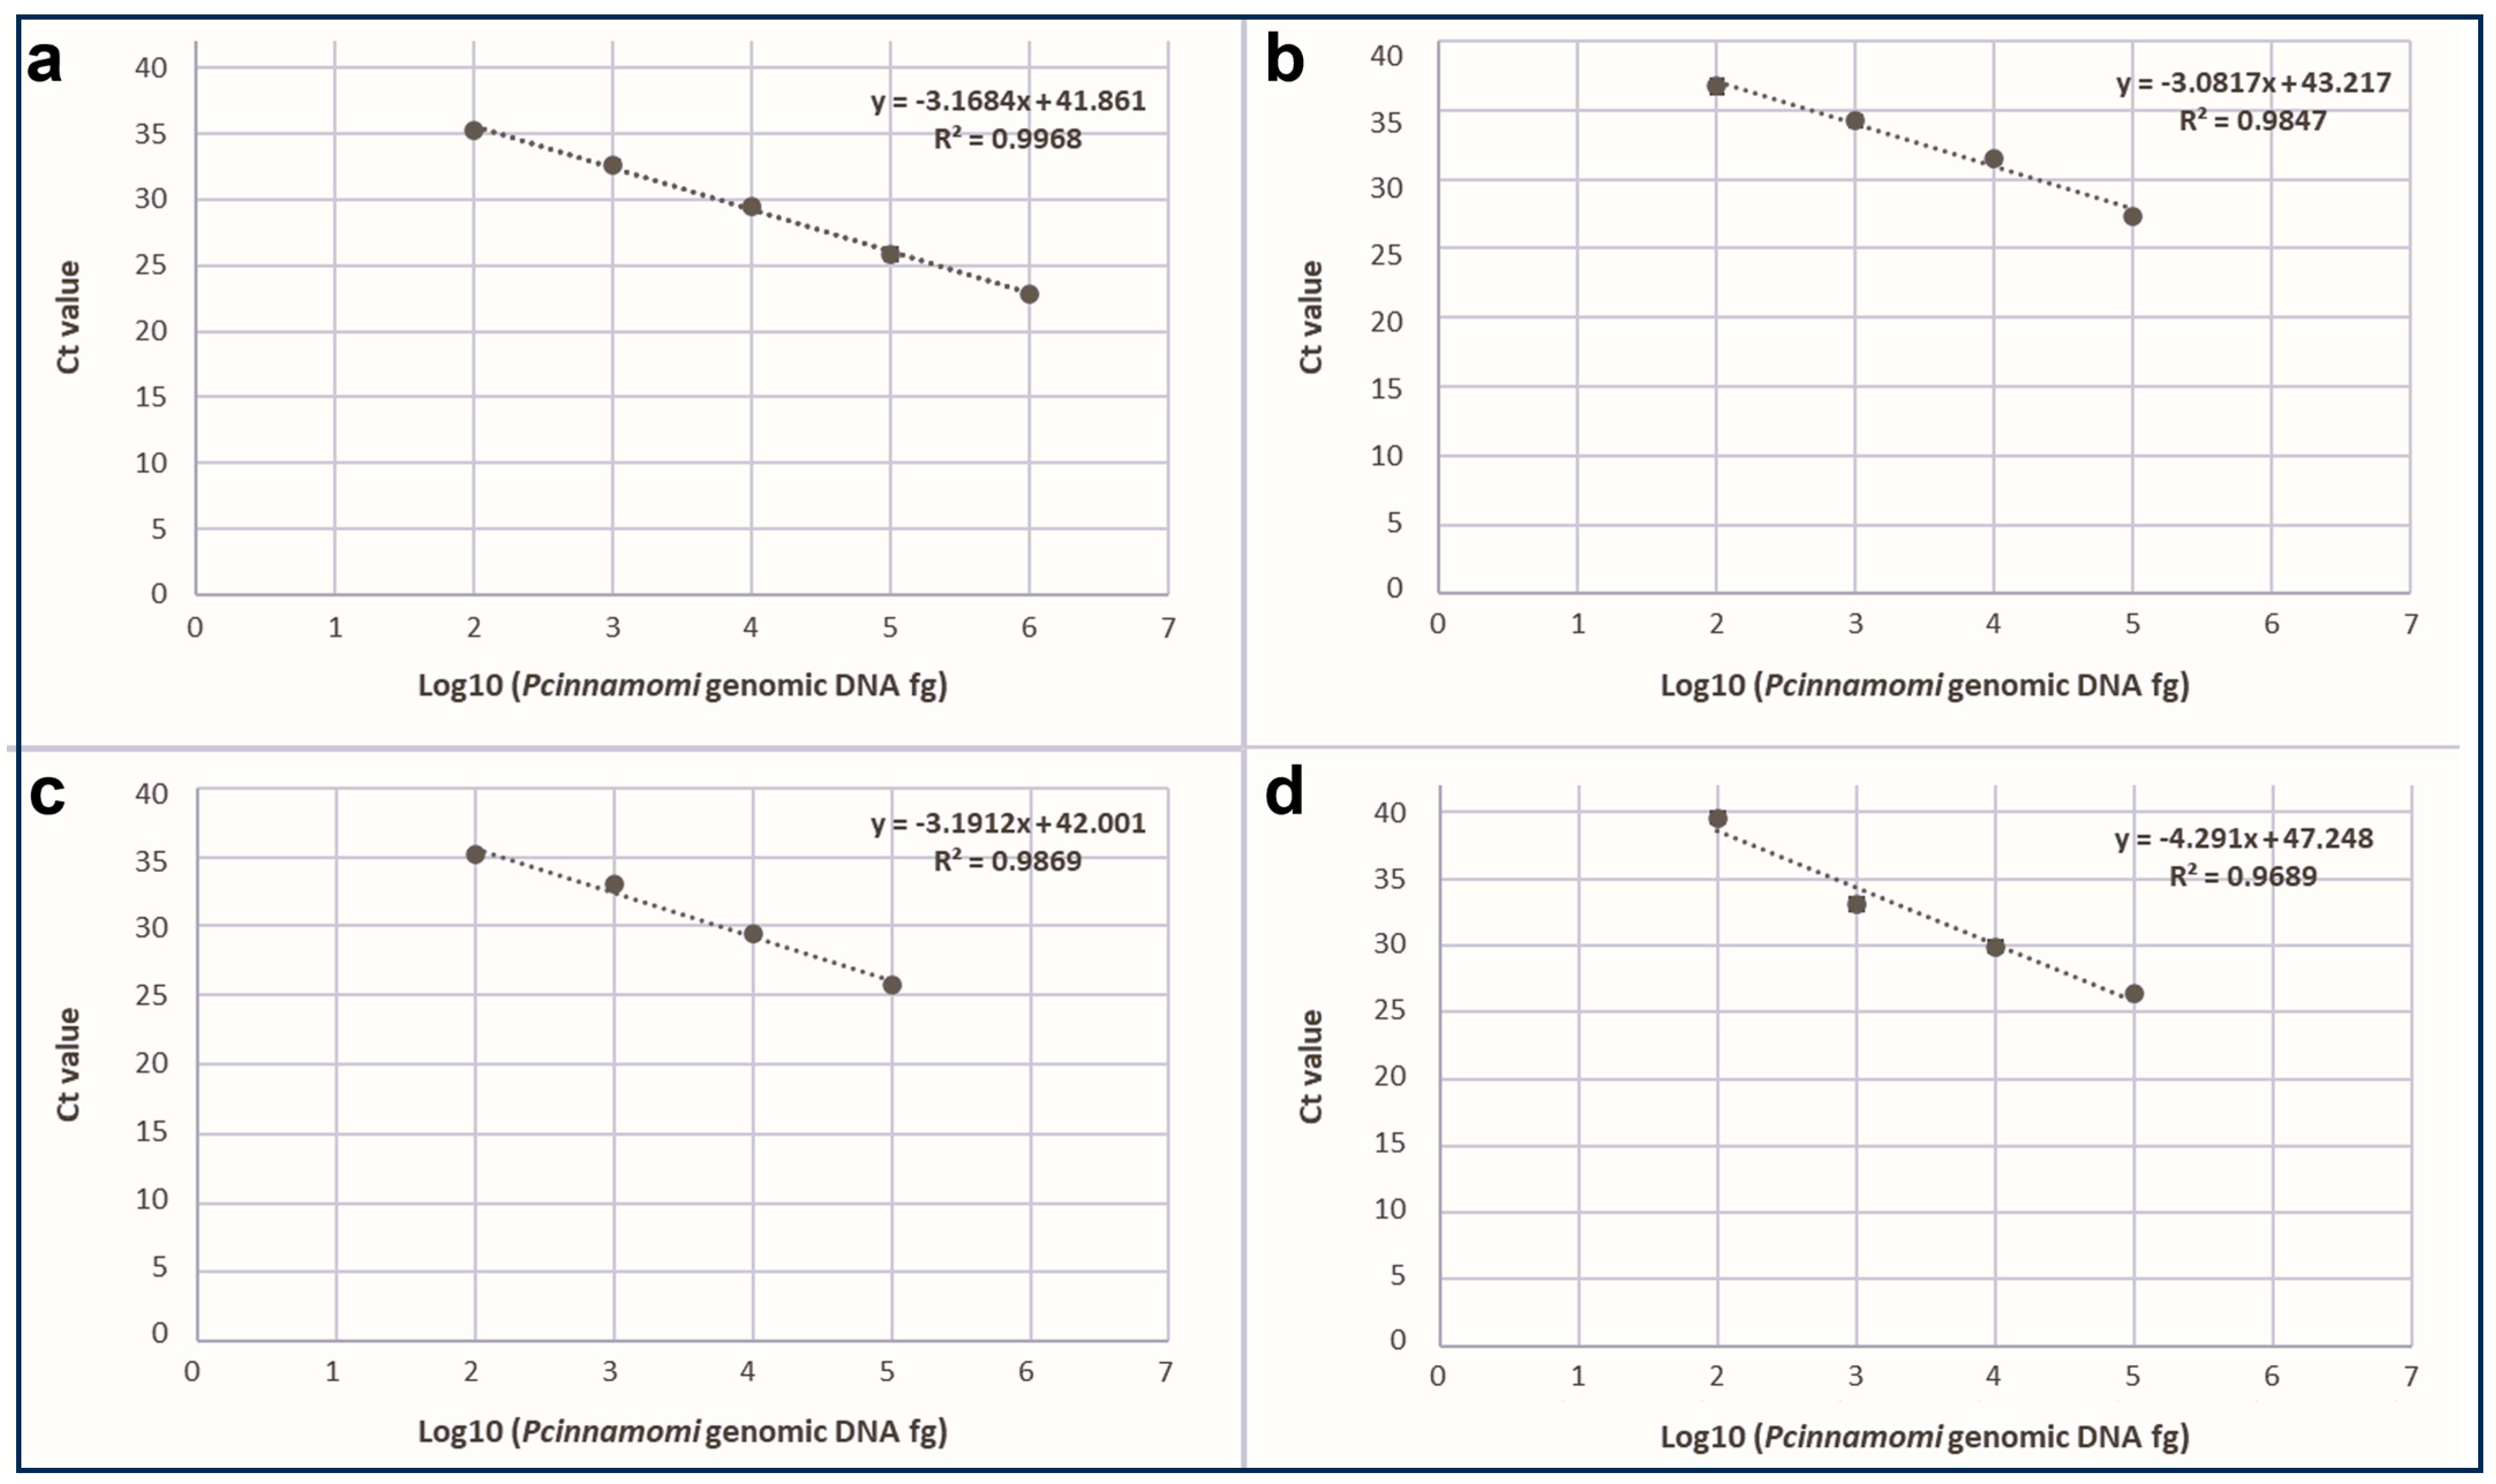
3.2. qPCR Sensitivity and Linearity

The optimized parameters for the reagent mix and real-time PCR conditions (e.g., primers, MgCl2 concentration, temperature, etc.) have been described in the materials and methods section. An analytical standard curve with dilutions from 5 ng/μL to 50 fg/μL of the P. cinnamomi isolates CREADC-Om274’s genomic DNA was performed (Figure 3). Results showed that the sensitivity limit (the smallest DNA quantity able to give a signal) of this qPCR assay was 50 fg since no reaction was observed for a lower amount. The limit of detection (LOD), corresponding to the smallest concentration of DNA detected always in all replicates, was 200 fg (Figure 3). In these conditions, the cut-off Ct value threshold for positive amplification, calculated as described in the materials and methods section, was a Ct of 37.43. The combination of the above-described primer pair and probe showed high qPCR efficiency rates (97.7%) with a high linear relationship (y = −3.381x + 42.82, R2 = 0.9937) (Figure 3) between the P. cinnamomi genomic DNA dilutions (log-transformed) and Ct values. The reaction’s linearity did not change among different isolates of P. cinnamomi obtained from different hosts, i.e., P. cinnamomi CREADC-Om274 from walnuts, CREADC-Om139 from chestnuts, and CREADC-Om144 from oaks (Figure S1). Consequently, standard curves set from 1 ng/μL to 100 fg/μL were used to quantify the amount of P. cinnamomi genomic DNA in samples.
Figure 3 shows the sensitivity of the detection assay when run under optimal conditions with DNA from the pure culture of the pathogen diluted in pure sterile distilled water. When environmental samples were run, especially soil samples, a reduction of sensitivity could be observed that was dependent from soil to soil. To prevent the inhibitor effects of environmental samples, we have used an inhibitor-resistant Taq Polymerase like GoTaq® G2 Hot Start DNA Polymerase (Promega), which really sometimes makes the difference between amplification or not. Nevertheless, a modification of the standard curve could occur.

3.3. Specificity

Specificity was tested on the genomic DNA from 50 isolates belonging to eight different Phytophthora clades, and all the results obtained are summarized in Table 1. Detection in qPCR occurred only for the expected sequences of P. cinnamomi. None of the other Phytophthora species showed cross amplifications, nor did the closely related ones belonging to clade 7. P. alni subsp. alni, P. alni subsp. multiformis, P. alni subsp. uniformis, P.cambivora (subclade 7a), P. niederhauserii (subclade 7b), and P. parvispora (subclade 7c as P. cinnamomi) did not amplify with our method at high DNA concentrations (10 ng).

3.4. Analysis of Naturally Infected Samples

3.4.1. Plant Material

Plant material was obtained both from symptomatic and asymptomatic P. cinnamomi host trees in different Italian regions. The tissue fragments were obtained from collars or stems of infected woody material, cut from the margins of necrotic lesions for symptomatic plants, or from healthy collar woody material for healthy plants. Each sample was analyzed using isolation and the real-time PCR developed in this study. All samples obtained from symptomatic plants were positive for P. cinnamomi in qPCR runs, showing a range going from 24.1 to 1.6 pg of P. cinnamomi DNA per mg of plant tissue. Control samples obtained from healthy plants were all negative (Table 3). P.cinnamomi was isolated from most of the same symptomatic samples. However, the isolation method was not always successful.

3.4.2. Soil

DNA extraction from peat soils, present in Rhododendron potted plants, was performed using a commercial kit ( Quick-DNATM Fecal/Soil Microbe Midi Prep Kit (Zymo Research, Irvine, CA, USA)) following the manufacturer’s instructions, easily obtaining a good amount of DNA (average 60 ng/µL). When testing field soil samples, the results were completely different. First of all, DNA extractions from field soil samples were far less efficient; low levels of total DNA (down to 2–5 ng/µL) and high levels of polymerase inhibitors were obtained. Therefore, a modified extraction method was developed, with a homemade step added before proceeding with the commercial kit (Zymo Research). In this additional step aimed at obtaining higher DNA yields, we used a higher amount of starting soil material (from 3–5 g up to 15 g) and exploited harsher conditions for DNA extraction using proteinase, SDS, and a step of incubation time of two hours at 65 °C.
Moreover, different soil samples tested, especially those coming from agricultural exploited field samples, caused a reduction in qPCR sensitivity when spiked with a known amount of P. cinnamomi DNA. Figure 4 shows some examples: DNA extraction solutions from (4b) and (4d) soils clearly caused a shift in sensitivity of the standard curve compared to the standard curve created with distilled water (4a); the DNA extraction solution from (4c) soil, instead, had very low or no impact on the ‘optimal’ standard curve (4a).
Since different soils affect qPCR efficiency to different extents, qPCRs of environmental samples were normalized with standard curves prepared using the DNA extract of a healthy sample of the soil under examination.
To define the best sampling procedure for soil samples, the distribution of P. cinnamomi in soils of infected walnut orchards was analyzed by systematically sampling soils around infected walnut trees following the schema shown in Figure 1.
The results of the sampling experiment are shown in Table 4. Soil samples (250 g) around two infected trees, Zn3/18 and Zn8/19 (see Table 3), were collected following the schema in Figure 4, both in spring and in autumn, each position being collected two times, 15 days apart, to verify repeatability over time. These samples were then analyzed using the real-time PCR method described above for the presence/absence of P. cinnamomi. The only position that showed the presence of P. cinnamomi in a repeatable manner, both in spring and in autumn, for both samples collected 15 days apart and at 20 and 40 cm in both trees, was the position at 50 cm (0.5 m) from the tree. Therefore, for field soil samples, 250 g of soil was collected right and left along the row at 50 cm from the trunk of diseased or healthy trees and pooled to reach 0.5 kg. This procedure was applied at two different depths, 20 and 40 cm.
The Phytophthora cinnamomi quantification method was first tested on potted soil samples from symptomatic Rhododendron plants, obtaining average quantifications ranging from 140.4 to 390.1 pg of P. cinnamomi DNA/gram soil (Table 5).
The qPCR-developed method was used to assess P. cinnamomi occurrence and inoculum amount in soils where symptomatic walnut plants were present. Soil samples collected from four different walnut orchards (Zn, Tas, Dossei, and BD) were analyzed in these conditions of sampling using DNA extraction and a qPCR/nested qPCR analysis. The results are shown in Table 5.
Soil samples around symptomatic trees were always positive for the presence of P. cinnamomi, both at 20 and 40 cm depth. The qPCR method had a limit of sensitivity of 50 fg/μL comprehensive of technical limits, including the size of the soil sample, since it detects up to 0.25 pg of target DNA/gram of soil.
Many of these naturally infected soil samples contained very low amounts of target DNA, often near to the sensitivity limit (see Ct values in Table 5). To address this, we attempted to increase sensitivity by using a nested approach, starting with a first-round amplification with Phytophthora genus-specific primers before performing real-time PCR. Although this nested approach did not increase sensitivity, it improved signal strength. This resulted in an earlier fluorescence increase, allowing samples with a Ct around 37–38 to be unambiguously considered positive, even if quantification was then compromised. All undetected samples were subjected to nested PCR, and positive samples are reported in Table 5 without quantification data.
In most cases, the soil samples around symptomatic walnut trees were positive using direct qPCR, ranging from 2.49 to 267.0 pg of P. cinnamomi DNA/gram of soil (Table 5). Except for a few walnut trees, like Tas 16/12 and Tas 11/18, the amount of P. cinnamomi DNA/gram of soil was very low, often below 10 pg.
The soil samples around asymptomatic trees in Table 5 (Tas 10/8, 3/9, and 7/12) were negative when tested using qPCR or nested qPCR in the conditions described. These trees were chosen from the same orchard (Tas) of symptomatic trees under study, which were far away from the infection site present in the orchard and were considered healthy. Only one asymptomatic walnut tree, Dossei 2, between two symptomatic plants, Dossei 1 and Dossei 3, gave positive results in nested qPCR. This plant, one year later, showed typical symptoms of P. cinnamomi disease. Also, the other asymptomatic plants with negative results (Table 5) were monitored one year later and did not show any symptoms.

4. Discussion

Soilborne diseases are a major limiting factor for the cultivation of most crops and are costly and difficult to manage. Practical and economical methods of disease control are limited once a crop has been established. Detecting plant pathogens in soil is a critical aspect of plant disease management and agricultural sustainability. Plant pathogens, including bacteria, fungi, oomycetes, nematodes, and viruses, can reside in the soil and pose significant threats to crops by causing diseases that reduce yield and quality. The early detection and accurate identification of soil-borne pathogens is thus essential for implementing effective control measures and minimizing economic losses.
P. cinnamomi is a very invasive soil-borne plant pathogen affecting thousands of known hosts, including ornamental plants, horticultural and tree crops, and natural ecosystems. In tree crops like walnut or chestnut, the decline caused by P. cinnamomi starts from the roots, often remaining unnoticed for years. When symptoms like wilting, yellowing, and the retention of dried foliage become visible on the tree crown, the rot of feeder roots, larger roots, crowns, and stems [5] are so severe and can be fatal. Plant detection analysis at the crown and stem level is destructive, often tardive, and can exacerbate disease spread, resulting in significant economic losses.
The early detection of P. cinnamomi in soil is a promising approach to managing infected tree orchards. However, detecting plant pathogens in soil presents several challenges: (i) Pathogen Diversity: The soil is a complex environment with diverse microbial communities. Phytophthora populations in soils exhibit significant variability in terms of diversity and species richness due to the polyphagy of these species and their ability to adapt to different environments [36]. Distinguishing P. cinnamomi from other Phytophthora species requires highly specific methods; (ii) Low Abundance: Pathogens are often present in low numbers, making detection difficult. Sensitive techniques like real-time PCR or Next Generation Sequencing are essential for identifying these low-abundance pathogens; (iii) Soil Interference: Soil components can inhibit detection methods. Sample preparation and DNA extraction techniques must minimize these interferences to ensure accurate results; (iv) Environmental Variability: Soil properties, such as pH, moisture, and organic matter content, can affect pathogen survival and detection. Standardizing sampling and analysis protocols is crucial for reliable detection.
To address these challenges, we developed a detection procedure, including a new qPCR assay, for early detection of P. cinnamomi in field soil samples from tree crop orchards.
To assure specificity, the qPCR developed here was based on the ras-related protein gene Ypt1 [37], which exhibits high interspecific genetic variability and low intraspecific variation, facilitating diagnostic assays [37].
In addition, this gene is well represented in the GenBank Database, which provides reference material for Phytophthora species identification. In the present study, the alignment of 51 Ypt1 gene sequences belonging to 48 different Phytophthora species and two Pythium species (Table 2) has shown that the intron 3 region of the Ypt1 gene is the most suitable one for designing primers and probes that specifically identify P. cinnamomi. Specificity was tested in vitro against 50 isolates belonging to 21 Phytophthora species of clades 1, 2, 4, 6, 7, 8, 9, and 10, including 10 isolates of P. cinnamomi (Table 1). Kunadiya et al. [28] underlined the importance of directly testing the efficiency and specificity of the primers against the most closely related species. Particular attention was given to Phytophthora species of clade 7, with emphasis on the same subclade (7c) of P. cinnamomi, such as P. parvispora, to avoid false positives.
The qPCR method’s sensitivity limit was 50 fg of total genomic DNA, which is comparable to other real-time diagnostic tools for Phytophthora species [24,37,38]. Schena et al. [37] achieved a sensitivity limit of 100 fg of total genomic DNA using the Ypt1 gene target for real-time PCR of different Phytophthora species. Bilodeau et al. [24] developed real-time methods for detecting 13 Phytophthora species and the P. citricola species complex using primers and probes designed based on the atp9-nad9 mitochondrial locus achieving a sensitivity limit of <100 fg of total genomic DNA. Verdecchia et al. [38] reported that in sensitivity tests, P. cactorum DNA was detected down to 10 fg using the real-time PCR ITS-based assay, while the detection limit for the Ypt1-based assay was 1 pg DNA.
We perform a nested real-time PCR approach to increase sensitivity. However, the increase in sensitivity was not so significant, likely because single copies of a target DNA were amplified by a single round of PCR, and the nested PCR only improved the signal strength (the increase in fluorescence occurred earlier) without increasing sensitivity, as already reported by Schena [37]. Further lowering the sensitivity limit was deemed impractical; instead, improving DNA extraction methods was more effective.
The presence of interference components is a problem of DNA extractions from all environmental samples. DNA extractions from plant material can be challenging, especially from woody plants like walnuts or chestnuts, which contain high amounts of tannins that inhibit DNA polymerase in PCR reactions. Our extraction method and the qPCR assay effectively detected P. cinnamomi in woody host plants, obtaining values around 10–20 pg of pathogen DNA/mg of host tissue (Table 3). Sexual oospores, asexual chlamydospores, intracellular hyphal aggregates, and lignituber formations are thought to enable P. cinnamomi survival for long periods under adverse conditions [39]. The expression of pathogen amounts as DNA amounts would encompass all these different forms of the pathogen, including mycelium.
Soil DNA extraction is even more challenging due to variability in soil’s physical and chemical composition and microbiome profile. The main problems are the occurrence of Taq polymerase inhibitors and the low concentration of the target pathogen DNA. We improved DNA extraction by analyzing larger soil samples (10–15 g). Actually, a further improvement in soil DNA extraction could be obtained by increasing the amount of starting soil material even further, like 20–100 g of soil. The problem of Taq polymerase inhibitors that were not eliminated with the DNA extraction procedure was minimized by using Taq polymerase specifically resistant to inhibitors in the qPCR assay. Despite these improvements, a reduction in the sensitivity of the method can still occur, especially in agricultural exploited field samples characterized by low biomass (low DNA) and high inhibitors (Figure 4). The solution was to normalize the sensitivity of each specific soil by building a standard curve in the presence of soil extracts.
Moreover, standardizing sampling protocols for soil sample collection is essential for consistent results. We studied the pathogen distribution around infected walnut trees in Northern Italy orchards to check if there were typical patterns of P. cinnamomi presence associated with infected trees and to optimize sampling procedures. Results showed that infected trees were consistently associated with P. cinnamomi DNA, while no pathogen DNA was detected around healthy plants. Infected trees were always associated with P. cinnamomi at 50 cm from the tree, both at 20 cm and 40 cm in depth. At the furthest distances from the infected tree, the presence of P. cinnamomi seems more casual, changing at 15 days apart or in spring/autumn. Phytophthora species seem to stay quite above ground. For example, P. infestans did not percolate through the soil but instead remained at the surface [40].
Quantifying pathogens in open-field soils is challenging due to soil complexity and environmental factors. Precisely because of this complexity, simulations in controlled environments with artificial inoculation in pots could not have reflected the situation in the open field; already, just the analysis of P. cinnamomi DNA in pots with Rhododendron showed us that in the pot, the pathogen remains more confined and concentrated, and detection was easier. Thus, we worked directly in the field, necessarily with natural infections.
The results showed that P. cinnamomi infective soil could contain different amounts of the pathogen ranging from the qPCR detection limit, set at 0.25 pg of pathogen DNA/g of soil, to 267 pg of pathogen DNA/g of soil (Table 5). Walnut Tas 11/18 is an exception, with a very high value of P. cinnamomi DNA (Table 5) and with much lower (<10 pg) amounts of pathogen DNA/g of soil being the rule. With nested qPCR, we showed that even lower amounts of P. cinnamomi in soil, <25 pg of pathogen DNA/g of soil (Table 5), were associated with P. cinnamomi infected tree.
Correlations between pathogen population amounts and the development of symptoms as a number of lesions on the plant have already been shown for a Phytophthora species [40]. Further studies are ongoing to establish the correlation between the amount of P. cinnamomi and the rate of disease on walnut trees. However, because the disease begins in the roots and takes years before symptoms become visible on the trunk or canopy, these studies require significant time. Regardless, the availability of a quantification method represents the starting point for such studies.
This work showed that the presence of P. cinnamomi DNA was associated with walnut infected trees, and this has already helped growers to make informed walnut management decisions.

5. Conclusions

In conclusion, we developed a qPCR method to detect and quantify P. cinnamomi DNA in mycelium, plant tissue, and especially in field soil samples. Pathogen quantification may contribute to the estimation of disease potential risk and setting up adequate control strategies to avoid pathogen dissemination. This molecular approach is a valuable tool for managing P. cinnamomi in agricultural commercial activities, including walnut production. In addition, this method allows the detection of P. cinnamomi in soil prior to plantation/cultivation to prevent future damage.

Supplementary Materials

The following supporting information can be downloaded at: https://www.mdpi.com/article/10.3390/agriculture14070999/s1, Table S1: Accession numbers of Ypt1 gene sequences from different Phytophthora and Pythium species used in this study, Figure S1: Standard curves of different P. cinnamomi isolates.

Author Contributions

Conceptualization: A.H. and A.B.; Methodology A.H., L.L. and L.T.; Investigation: A.H., L.L. and S.V.; Data Curation: A.H., L.T., S.V. and L.L.; Writing-original draft: A.H.; Writing-review and editing: A.H. and L.L.; Supervision A.H. and A.B.; Funding acquisition: A.B. All authors have read and agreed to the published version of the manuscript.

Funding

This work was funded by Italian Ministry of Agriculture (MiPAAF prot. 48606-8/11/2018), project PORT NOC: Valutazione di portainnesti per la tolleranza/resistenza a Phytophthora e black-line e valorizzazione di varietà di Juglans regia compatibili. The part on chestnut was also funded by Italian Ministry of Agriculture (MASAF DM n. 667521—30 December 2022) Project VALO.RE IN C.A.M.P.O: Azioni di VALOrizzazione e REcupero per le filiere Italiane di Nocciolo, CAstagno, Mandorlo, Pistacchio e carrubO.

Institutional Review Board Statement

Not applicable.

Data Availability Statement

The original contributions presented in the study are included in the article; further inquiries can be directed to the corresponding author.

Conflicts of Interest

The authors declare no conflicts of interest.

References

  1. Yang, X.; Tyler, B.M.; Hong, C. An expanded phylogeny for the genus Phytophthora. IMA Fungus 2017, 8, 355–384. [Google Scholar] [CrossRef]
  2. Hardham, A.R.; Blackman, L.M.  Phytophthora cinnamomi. Mol. Plant. Pathol. 2018, 19, 260–285. [Google Scholar] [CrossRef] [PubMed]
  3. Erwin, D.C.; Ribeiro, O.K. Phytophthora Diseases Worldwide; APS Press: St. Paul, MN, USA, 1996; p. 562. ISBN 978-0-89054-212-5. [Google Scholar]
  4. Kamoun, S.; Furzer, O.; Jones, J.D.G.; Judelson, H.S.; Ali, G.S.; Dalio, R.J.D.; Roy, S.G.; Schena, L.; Zambounis, A.; Panabières, F.; et al. The Top 10 oomycete pathogens in molecular plant pathology. Mol. Plant Pathol. 2015, 16, 413–434. [Google Scholar] [CrossRef] [PubMed]
  5. Belisario, A.; Maccaroni, M.; Vettorazzo, M. First Report of Phytophthora cambivora Causing Bleeding Cankers and Dieback on Beech (Fagus sylvatica) in Italy. Plant Dis. 2006, 90, 1362. [Google Scholar] [CrossRef]
  6. Burgess, T.I.; Scott, J.K.; Mcdougall, K.L.; Stukely, M.J.C.; Crane, C.; Dunstan, W.A.; Brigg, F.; Andjic, V.; White, D.; Rudman, T.; et al. Current and projected global distribution of Phytophthora cinnamomi, one of the world’s worst plant pathogens. Glob. Chang. Biol. 2017, 23, 1661–1674. [Google Scholar] [CrossRef] [PubMed]
  7. Jung, T.; Orlikowski, L.; Henricot, B.; Abad-Campos, P.; Aday, A.G.; Aguín Casal, O.; Bakonyi, J.; Cacciola, S.O.; Cech, T.; Chavarriaga, D.; et al. Widespread Phytophthora infestations in European nurseries put forest, semi-natural and horticultural ecosystems at high risk of Phytophthora diseases. For. Pathol. 2016, 46, 134–163. [Google Scholar] [CrossRef]
  8. Scanu, B.; Hunter, G.C.; Linaldeddu, B.T.; Franceschini, A.; Maddau, L.; Jung, T.; Denman, S. A taxonomic re-evaluation reveals that Phytophthora cinnamomi and P. cinnamomi var. parvispora are separate species. For. Pathol. 2013, 44, 1–20. [Google Scholar] [CrossRef]
  9. Frisullo, S.; Lima, G.; Magnano di San Lio, G.; Camele, I.; Melissano, L.; Puglisi, I.; Pane, A.; Agosteo, G.E.; Prudente, L.; Cacciola, S.O. Phytophthora cinnamomi Involved in the Decline of Holm Oak (Quercus ilex) Stands in Southern Italy. For. Sci. 2018, 64, 290–298. [Google Scholar] [CrossRef]
  10. Vettraino, A.M.; Barzanti, P.; Bianco, M.C.; Ragazzi, A.; Capretti, P.; Paoletti, E.; Luisi, N.; Anselmi, N.; Vannini, A. Occurrence of Phytophthora species in oak stands in Italy and their association with declining oak trees. For Pathol. 2002, 32, 19–28. [Google Scholar] [CrossRef]
  11. Westbrook, J.W.; James, J.B.; Sisco, P.H.; Frampton, J.; Lucas, S.; Jeffers, S.N. Resistance to Phytophthora cinnamomi in American Chestnut (Castanea dentata) Backcross Populations that Descended from Two Chinese Chestnut (Castanea mollissima) Sources of Resistance. Plant Dis. 2019, 103, 1631–1641. [Google Scholar] [CrossRef]
  12. Belisario, A.; Galli, M.; Wajnberg, E. Evaluation of Juglans species for resistance to Phytophthora cinnamomi: Differences in isolate virulence and response to fosetyl-Al. For. Pathol. 2009, 39, 168–176. [Google Scholar] [CrossRef]
  13. Browne, G.T.; Leslie, C.A.; Grant, J.A.; Bhat, R.G.; SchmidtL, S.; Hackett, W.P.; Kluepfel, D.A.; Robinson, R.; McGranahan, G.H. Resistance to Species of Phytophthora Identified among Clones of Juglans macrocarpa × J. regia. HortScience 2015, 50, 1136–1142. [Google Scholar] [CrossRef]
  14. Guajardo, J.; Saa, S.; Camps, R.; Besoain, X. Outbreak of Crown and Root Rot of Walnut Caused by Phytophthora cinnamomi in Chile. Plant Dis. 2017, 101, 636. [Google Scholar] [CrossRef]
  15. Matheron, M.E.; Mircetich, S.M. Pathogenicity and relative virulence of Phytophthora spp. from walnut and other plants to rootstocks of English walnut trees. Phytopathology 1985, 75, 977–981. [Google Scholar] [CrossRef]
  16. Vitale, S.; Scotton, M.; Vettraino, A.M.; Vannini, A.; Haegi, A.; Luongo, L.; Scarpari, M.; Belisario, A. Characterization of Phytophthora cinnamomi from common walnut in Southern Europe environment. For. Pathol. 2018, 49, e12477. [Google Scholar] [CrossRef]
  17. Vitale, S.; Luongo, L.; Scarpari, M.; Tizzani, L.; Garaguso, I.; Galli, M.; Belisario, A.; Scotton, M.; Mughini, G.; Gras, M.; et al. Sources of resistance to Phytophthora cinnamomi in Juglans spp. for potential rootstocks. Hortscience 2021, 56, 667–671. [Google Scholar] [CrossRef]
  18. Akinsanmi, O.A.; Drenth, A. Phosphite and metalaxyl rejuvenate macadamia trees in decline caused by Phytophthora cinnamomi. Crop Prot. 2013, 53, 29–36. [Google Scholar] [CrossRef]
  19. Dunstan, W.A.; Rudman, T.; Shearer, B.L.; Moore, N.A.; Paap, T.; Calver, M.C.; Dell, B.; Hardy, G.E.S.J. Containment and spot eradication of a highly destructive, invasive plant pathogen (Phytophthora cinnamomi) in natural ecosystems. Biol. Invasions 2010, 12, 913–925. [Google Scholar] [CrossRef]
  20. Carter, Z.T.; McNaughton, E.J.; Fea, M.P.; Horner, I.; Johnson, K.; Killick, S.; Glen, A.S. Evaluating scent detection dogs as a tool to detect pathogenic Phytophthora species. Conserv. Sci. Pract. 2023, 5, e12997. [Google Scholar] [CrossRef]
  21. Schena, L.; Duncan, J.M.; Cooke, D.E.L. Development and application of a PCR-based ‘molecular toolbox’ for the identification of Phytophthora species damaging forests and natural ecosystems. Plant Pathol. 2008, 57, 64–75. [Google Scholar] [CrossRef]
  22. Langrell, S.R.H.; Morel, O.; Robin, C. Touchdown nested multiplex PCR detection of Phytophthora cinnamomi and P. cambivora from French and English chestnut grove soils. Fungal Biol. 2011, 115, 672–682. [Google Scholar] [CrossRef] [PubMed]
  23. Engelbrecht, J.; Duong, T.A.; van den Berg, N. Development of a Nested Quantitative Real-Time PCR for Detecting Phytophthora cinnamomi in Persea americana Rootstocks. Plant Dis. 2013, 97, 1012–1017. [Google Scholar] [CrossRef] [PubMed]
  24. Bilodeau, G.J.; Martin, F.N.; Coffey, M.D.; Blomquist, C.L. Development of a Multiplex Assay for Genus- and Species-Specific Detection of Phytophthora Based on Differences in Mitochondrial Gene Order. Phytopathology 2014, 104, 733–748. [Google Scholar] [CrossRef] [PubMed]
  25. Kunadiya, M.; Dunstan, W.A.D.; White, D.; Hardy, G.E.S.J.; Grigg, A.H.; Burgess, T.I. Assay for the Detection of Phytophthora cinnamomi Including an mRNA Protocol Designed to Establish Propagule Viability in Environmental Samples. Plant Dis. 2019, 103, 2443–2450. [Google Scholar] [CrossRef]
  26. Dai, T.; Yang, X.; Hu, T.; Li, Z.Y.; Xu, Y.; Lu, C.C. A novel LAMP assay for the detection of Phytophthora cinnamomi utilizing a new target gene identified from genome sequences. Plant Dis. 2019, 103, 3101–3107. [Google Scholar] [CrossRef] [PubMed]
  27. Dai, T.; Wang, A.; Yang, X.; Yu, X.; Tian, W.; Xu, Y.; Hu, T. PHYCI_587572: An RxLR Effector Gene and New Biomarker in A Recombinase Polymerase Amplification Assay for Rapid Detection of Phytophthora cinnamomi. Forests 2020, 11, 306. [Google Scholar] [CrossRef]
  28. Kunadiya, M.; White, D.; Dunstan, W.A.D.; Hardy, G.E.S.J.; Grigg, A.H.; Andjic, V.; Burgess, T.I. Pathways to false-positive diagnoses using molecular genetic detection methods; Phytophthora cinnamomi a case study. FEMS Microbiol. Lett. 2017, 364, fnx009. [Google Scholar] [CrossRef]
  29. Ioos, R.; Laugustin, L.; Schenck, N.; Rose, S.; Husson, C.; Frey, P. Usefulness of single copy genes containing introns in Phytophthora for the development of detection tools for the regulated species P. ramorum and P. fragariae. Eur. J. Plant Pathol. 2006, 116, 171–176. [Google Scholar] [CrossRef]
  30. Schrader, C.; Schielke, A.; Ellerbroek, L.; Johne, R. PCR inhibitors—Occurrence, properties and removal. J. Appl. Microbiol. 2012, 113, 1014–1026. [Google Scholar] [CrossRef]
  31. Jeffers, S.N.; Martin, S.B. Comparison of two media selective for Phytophthora and Pythium species. Plant Dis. 1986, 70, 1038–1043. [Google Scholar] [CrossRef]
  32. Edgar, R.C. MUSCLE: Multiple sequence alignment with high accuracy and high throughput. Nucleic Acids Res. 2004, 32, 1792–1797. [Google Scholar] [CrossRef] [PubMed]
  33. Untergasser, A.; Cutcutache, I.; Koressaar, T.; Ye, J.; Faircloth, B.C.; Remm, M.; Rozen, S.G. Primer3-new capabilities and interfaces. Nucleic Acids Res. 2012, 40, e115. [Google Scholar] [CrossRef] [PubMed]
  34. Rozen, S.; Skaletsky, H.J. Bioinformatics Methods and Protocols: Methods in Molecular Biology. In Primer 3 on the WWW for General Users and for Biologist Programmers; Krawetzand, S., Misener, S., Eds.; Humana Press: Totowa, NJ, USA, 2000; pp. 365–386. ISSN 1064-3745. [Google Scholar]
  35. Cooke, D.E.L.; Drenth, A.; Duncan, J.M.; Wagels, G.; Brasier, C.M. A molecular phylogeny of Phytophthora and related oomycetes. Fungal Genet. Biol. 2000, 30, 17–32. [Google Scholar] [CrossRef] [PubMed]
  36. Riolo, M.; Aloi, F.; La Spada, F.; Sciandrello, S.; Moricca, S.; Santilli, E.; Pane, A.; Cacciola, S.O. Diversity of Phytophthora communities across different types of mediterranean vegetation in a nature reserve area. Forests 2020, 11, 853. [Google Scholar] [CrossRef]
  37. Schena, L.; Hughes, J.D.; Cooke, D.E.L. Detection and quantification of Phytophthora ramorum, P. kernoviae, P. citricola, and P. quercina in symptomatic leaves by multiplex real-time PCR. Mol. Plant Pathol. 2006, 7, 365–379. [Google Scholar] [CrossRef] [PubMed]
  38. Verdecchia, E.; Ceustermans, A.; Baets, D.; Ferreira, J.; Bonants, P.; Melis, P.; Van Hemelrijck, W.; Bylemans, S.; Rediers, H.; Lievens, B. Quantitative PCR for detection and quantification of Phytophthora cactorum in the cultivation of strawberry. Eur J Plant Pathol 2021, 160, 867–882. [Google Scholar] [CrossRef]
  39. Jung, T.; Colquhoun, I.J.; Hardy, G.E.S.J. New insights into the survival strategy of the invasive soilborne pathogen Phytophthora cinnamomi in different natural ecosystems in Western Australia. For. Pathol. 2013, 43, 266–288. [Google Scholar] [CrossRef]
  40. Osawa, H.; Suzuki, N.; Akino, S.; Araki, H.; Asano, K.; Akai, K.; Kondo, N. Quantification of Phytophthora infestans population densities and their changes in potato field soil using real-time PCR. Sci. Rep. 2021, 11, 6266. [Google Scholar] [CrossRef]
Figure 1. Scheme of sampling experiment. A total of 250 g of soil was collected in a walnut orchard at different distances from an infected tree (the central tree in the scheme) along the tree row and at 1.5 m in the inter-row. At each distance point, two samples were taken at 20 cm and 40 cm. Long white arrows indicate directions of sampling along the row and in the middle of the inter-row.
Agriculture 14 00999 g001
Figure 2. Schematic representation of the DNA region of the ras-related protein gene Ypt1 amplified by the primers YPh1F and Yph2R containing introns 3, 4, and 5, with the location of primers P. cinn3.4F and P. cinn3.78R, and the probe P. cinn3.31 designed on intron 3 for Phytophthora cinnamomi identification and quantification in real-time PCR. Arrows indicate primer orientation. The arrow directions indicate the orientation of the primers.
Agriculture 14 00999 g002
Figure 3. Standard curve for qPCR quantification (fg) of the Phytophthora cinnamomi strain CREADC-Om274’s genomic DNA obtained with GoTaq® G2 Hot Start DNA Polymerase (Promega). The sensitivity was 50 fg, while the lower limit of detection (LOD) was 200 fg. Three technical repeats for each P. cinnamomi genomic DNA dilution were used, and averaged values are reported in the graph. Bars represent the standard deviations of each point.
Agriculture 14 00999 g003
Figure 4. Comparison between qPCR standard curves obtained with a ten-fold dilutions series of the Phytophthora cinnamomi strain CREADC-Om274’s genomic DNA diluted in sterile distilled water (a) or in different soil extracts coming from Veneto’s orchards soils (b,c), or a soil (d) from the Latium region. qPCR experimental conditions are described in the materials and methods section. All samples, in triplicate, were analyzed on the same qPCR plate to avoid differences between runs.
Agriculture 14 00999 g004
Table 1. Isolates of Phytophthora and Pythium from the CREA-DC collection that were used to test the specificity of the real-time PCR method developed in this study.
SpeciesCREADC
Isolate Number
Clade aHostCountryReal-Time PCR Result
P. x alniOm2937aAlnus glutinosaGermany-
P. x multiformisOm2947aAlnus glutinosaThe Netherlands-
P. uniformisOm295 b7aAlnus glutinosaGermany-
P. cactorumOm601aJuglans regiaItaly-
Om61 Juglans regiaItaly-
P. cambivoraOm1337aFagusItaly-
Om134 FagusItaly-
P. capsiciOm2462bCapsicum annumItaly-
P. cinnamomiOm697cQuercus rubraFrance+
Om70 Juglans regiaItaly+
Om74 Juglans regiaItaly+
Om76 Juglans regiaItaly+
Om119 Juglans regiaItaly+
Om194 Juglans regiaItaly+
Om202 Juglans regiaItaly+
Om274 Juglans regiaItaly+
Om281 Juglans regiaItaly+
Om283 Juglans regiaItaly+
Om139 Castanea sativaSpain+
Om141 Castanea sativaSpain+
Om142 Castanea sativaSpain+
Om144 Quercus sp.Italy+
Om145 Quercus sp.Italy+
P. citricolaOm1612cJuglans regiaItaly-
P. cryptogeaOm268aActinidia deliciosaItaly-
Om28 Actinidia deliciosaItaly-
P. drechsleriOm41 c8aUnknownUnknown-
Om220 UnknownGermany-
P. gonapodyidesOm2616bJuglans regiaItaly-
P. hedraiandraOm681aViburnum tinusItaly-
P. hydropathicaOm2349a1Viburnum tinusItaly-
Om236 Viburnum tinusItaly-
P. kernoviaeOm273 d10 England-
P. megaspermaOm1986bJuglans regiaItaly-
Om199 Juglans regiaItaly-
Om239 Celtis australisItaly-
Om284 Juglans regiaItaly-
P. nicotianaeOm2631cVincaItaly-
Om265 Capsicum annuumItaly-
P. niederhauseriiOm1537bHedera helixItaly-
Om154 Hedera helixItaly-
Om242 Heuchera sp.Germany-
Om404 Hedera helixNorway-
P. palmivoraOm194Pittosporum tobiraItaly-
Om22 Pittosporum tobiraItaly-
P. parvisporaOm298 e7cBeaucameare curvataMexico-
P. ramorumOm2298cViburnus tinusItaly-
P. tropicalisOm2102bRhododendron sp.Italy-
Om212 Rhododendron sp.Italy-
Om2372bAlbizia julibrissinItaly-
Pythium chamaehyphonOm162 Juglans regiaItaly-
Pythium sterilumOm164 Juglans regiaItaly-
a Phylogenetic clade in accordance with Yang et al. [1]. Origin of these isolates are the b Federal Biological Research Centre for Agriculture and Forestry [BBA]7/03-2.3, and the c Centraal Bureau voor Schimmelcultures [CBS]292-35, d CBS 122049, e BBA 65507. + indicates positive result in real time, - indicates a negative result.
Table 2. The primers and hydrolysis probes used in this study: sequences, melting temperature (Tm), DNA region on which they were designed, and the basepair (bp) position with respect to the reference sequence and size (bp) of the amplicon produced.
Primers or ProbeSequences (5′-3′)Tm (°C)DNA RegionPosition a
(bp)
Product Size (bp)Reference
P. cinn 3.4FTTTGTGAGTGCCGAGACAAG58.42Intron3/Ypt14–2375This
study
P. cinn 3.78RGCACAGAAACAACAACGACG58.55Intron3/Ypt131–5275This study
P. cinn 3.31Probe b[FAM]-CCTGTCTGCCCCATTCAACAGA-[BHQ]63.48Intron3/Ypt159–78--This study
YPh1FCGACCATKGGTGTGGACTTT ~450[21]
YPh2RACGTTCTCMCAGGCGTATCT ~450[21]
a Position of the primer or probe considering the GenBank accession no. DQ162959 as a reference sequence. b FAM 6-carboxyfluorescein, BHQ1 Black Hole Quencher 1, a registered trademark of Bioresearch Technologies, Inc., Hoddesdon, UK).
Table 3. qPCR results for Phytophthora cinnamomi detection and quantification in tissue samples from naturally diseased trees.
HostTree ConditionqPCRMean Quantity *
pg of Pathogen DNA/mg Host Tissue
Walnut Zn 3/18SymptomaticPositive24.1
Walnut Zn 8/19SymptomaticPositive19.6
Walnut Tas10/8AsymptomaticNegativeUD
Walnut Tas 3/9AsymptomaticNegativeUD
Walnut Tas 7/12AsymptomaticNegativeUD
Walnut Tas 9/20SymptomaticPositive18.1
Walnut Tas11/18SymptomaticPositive14.5
Walnut Tas13/13SymptomaticPositive9.4
Walnut BD5/6SymptomaticPositive12.75
ChestnutSymptomaticPositive15.4
ChestnutSymptomaticPositive2.3
ChestnutSymptomaticPositive10.1
OakSymptomaticPositive1.6
OakSymptomaticPositive17.3
UD = undetected; * Mean quantity was calculated from Mean Ct by CFX Manager Version software version 3.0 (BioRad). The results shown are from different qPCR plates. qPCR was performed as described in the text, 3 replicates per sample. Walnut trees are from three different orchards (Zn, TAS, BD, double number indicate plant/row), and chestnuts and oaks are from the forest.
Table 4. qPCR analysis for P. cinnamomi presence in soils surrounding infected walnut trees. P = presence of P. cinnamomi (positive in qPCR); X = absence of P. cinnamomi.
Walnut TreeDistance from the TreeDepthSample IqPCR ResultSample IIqPCR Result
Zn 3/18
0.5 m203AP1 P23.1P1 P2
1.5 m203BP1 P23.2P1 X2
2.5 m203CX1 X23.3X1 X2
3.5 m203DP1 X23.4X1 P2
inter-row 1.5 m203EX1 X23.5X1 P2
0.5 m403FP1 P23.6P1 P2
1.5 m403GX1 P23.7P1 P2
2.5 m403HX1 X23.8X1 X2
3.5 m403IX1 X23.9X1 X2
Inter-row 1.5 m403LP1 P23.10P1 P2
Zn 8/19
0.5 m208AP1 P28.1P1 P2
1.5 m208BX1 X28.2P1 P2
2.5 m208CP1 X28.3P1 X2
3.5 m208DP1 X28.4P1 X2
Inter-row 1.5 m208EP1 X28.5X1 X2
0.5 m408FP1 P28.6P1 P2
1.5 m408GP1 X28.7P1 X2
2.5 m408HX1 P28.8X1 P2
3.5 m408IX1 P28.9P1 X2
Inter-row 1.5 m408LX1 P28.10X1 X2
The analyses were performed on soils surrounding infected walnut trees Zn3/18 and Zn8//19 (see Table 3) collected in spring (Sample I) and in autumn (Sample II). Each sample was collected twice (1–2), 15 days apart. Soils surrounding plants considered healthy (asymptomatic and far away from the infection site) were always negative for P. cinnamomi.
Table 5. qPCR results for Phytophthora cinnamomi detection and quantification on potted and field soil samples around symptomatic/asymptomatic plants.
Plant for Soil SamplesTree ConditionSoil Sample and DepthqPCR ResultsMean Ct and Standard DeviationMean Quantity *
pg of Pathogen DNA
/g of Soil
RhododendronSymptomaticPotted soil samplepositive29.95 ± 0.08140.4
RhododendronSymptomaticPotted soil samplepositive30.18 ± 0.03123.5
RhododendronSymptomaticPotted soil samplepositive28.47 ± 0.18390.1
Walnut Zn 7/18Symptomatic20 cmpositive37.98 ± 0.51 a<0.25
40 cmpositivePos nested qPCR<0.25
Walnut Tas 10/8Asymptomatic20 cmnegativeUD-
40 cmnegativeUD-
Walnut Tas 3/9Asymptomatic20 cmnegativeUD-
40 cmnegativeUD-
Walnut Tas 7/12Asymptomatic20 cmnegativeUD-
40 cmnegativeUD-
Walnut Tas 9/20Symptomatic20 cmpositive36.99 ± 1.470.61
40 cmpositivePos nested qPCR<0.25
Walnut Tas 11/18Symptomatic20 cmpositive30.47 ±0.07134
40 cmpositive29.21 ±0.16267
Walnut Tas 13/13Symptomatic20 cmpositive34.47 ±1.02815
40 cmpositive34.99 ±1.5713.9
Walnut Tas 16/12Symptomatic20 cmpositive35.47 ± 1.198.7
40 cmpositive31.21 ± 0.1489.8
Walnut Dossei 1Symptomatic20 cmPositive38.06 ± 1.05 a<0.25
40 cmpositivePos nested qPCR<0.25
Walnut Dossei 2Asymptomatic20 cmpositivePos nested qPCR<0.25
40 cmpositivePos nested qPCR<0.25
Walnut Dossei 3Symptomatic20 cmpositivePos nested qPCR<0.25
40 cmpositive35.32 ± 1.562.8
Walnut BD 5/6Symptomatic20 cmpositive35.47 ± 0.272.49
Walnut
BD 9/10
Symptomatic20 cmpositive33.99 ± 0.126.67
40cmpositive35.16 ± 0.813.03
* Mean quantity was calculated from Mean Ct by CFX Manager Version software version 3.0 (BioRad). UD = undetected; <0.25 = pathogen DNA is below the limit of detection of direct qPCR (in the soil was 0.25 pg of pathogen DNA/g soil), but the nested qPCR was positive (Pos nested qPCR). a sample within the 40 cycles of qPCR but over the cut-off Ct value = undetectable < 0.25 pg, positive in nested qPCR. All negative results shown in the table were also subjected to nested qPCR, resulting in negative. The results shown are from different qPCR plates. qPCR was performed as described in the text, 3 replicates per sample. The grey cell separate Rhododendron potted samples from walnut ones.
Disclaimer/Publisher’s Note: The statements, opinions and data contained in all publications are solely those of the individual author(s) and contributor(s) and not of MDPI and/or the editor(s). MDPI and/or the editor(s) disclaim responsibility for any injury to people or property resulting from any ideas, methods, instructions or products referred to in the content.

