
Effects of Scale, Temporal Variation and Grazing on Diversity in an Endemic Pasture in Sierra de Zapaliname, Coahuila, Mexico

 ,
,  ,
,
Abstract
:1. Introduction
2. Materials and Methods
2.1. Study Area

2.2. Sampling Design and Sample Collection
2.3. Statistical Analysis
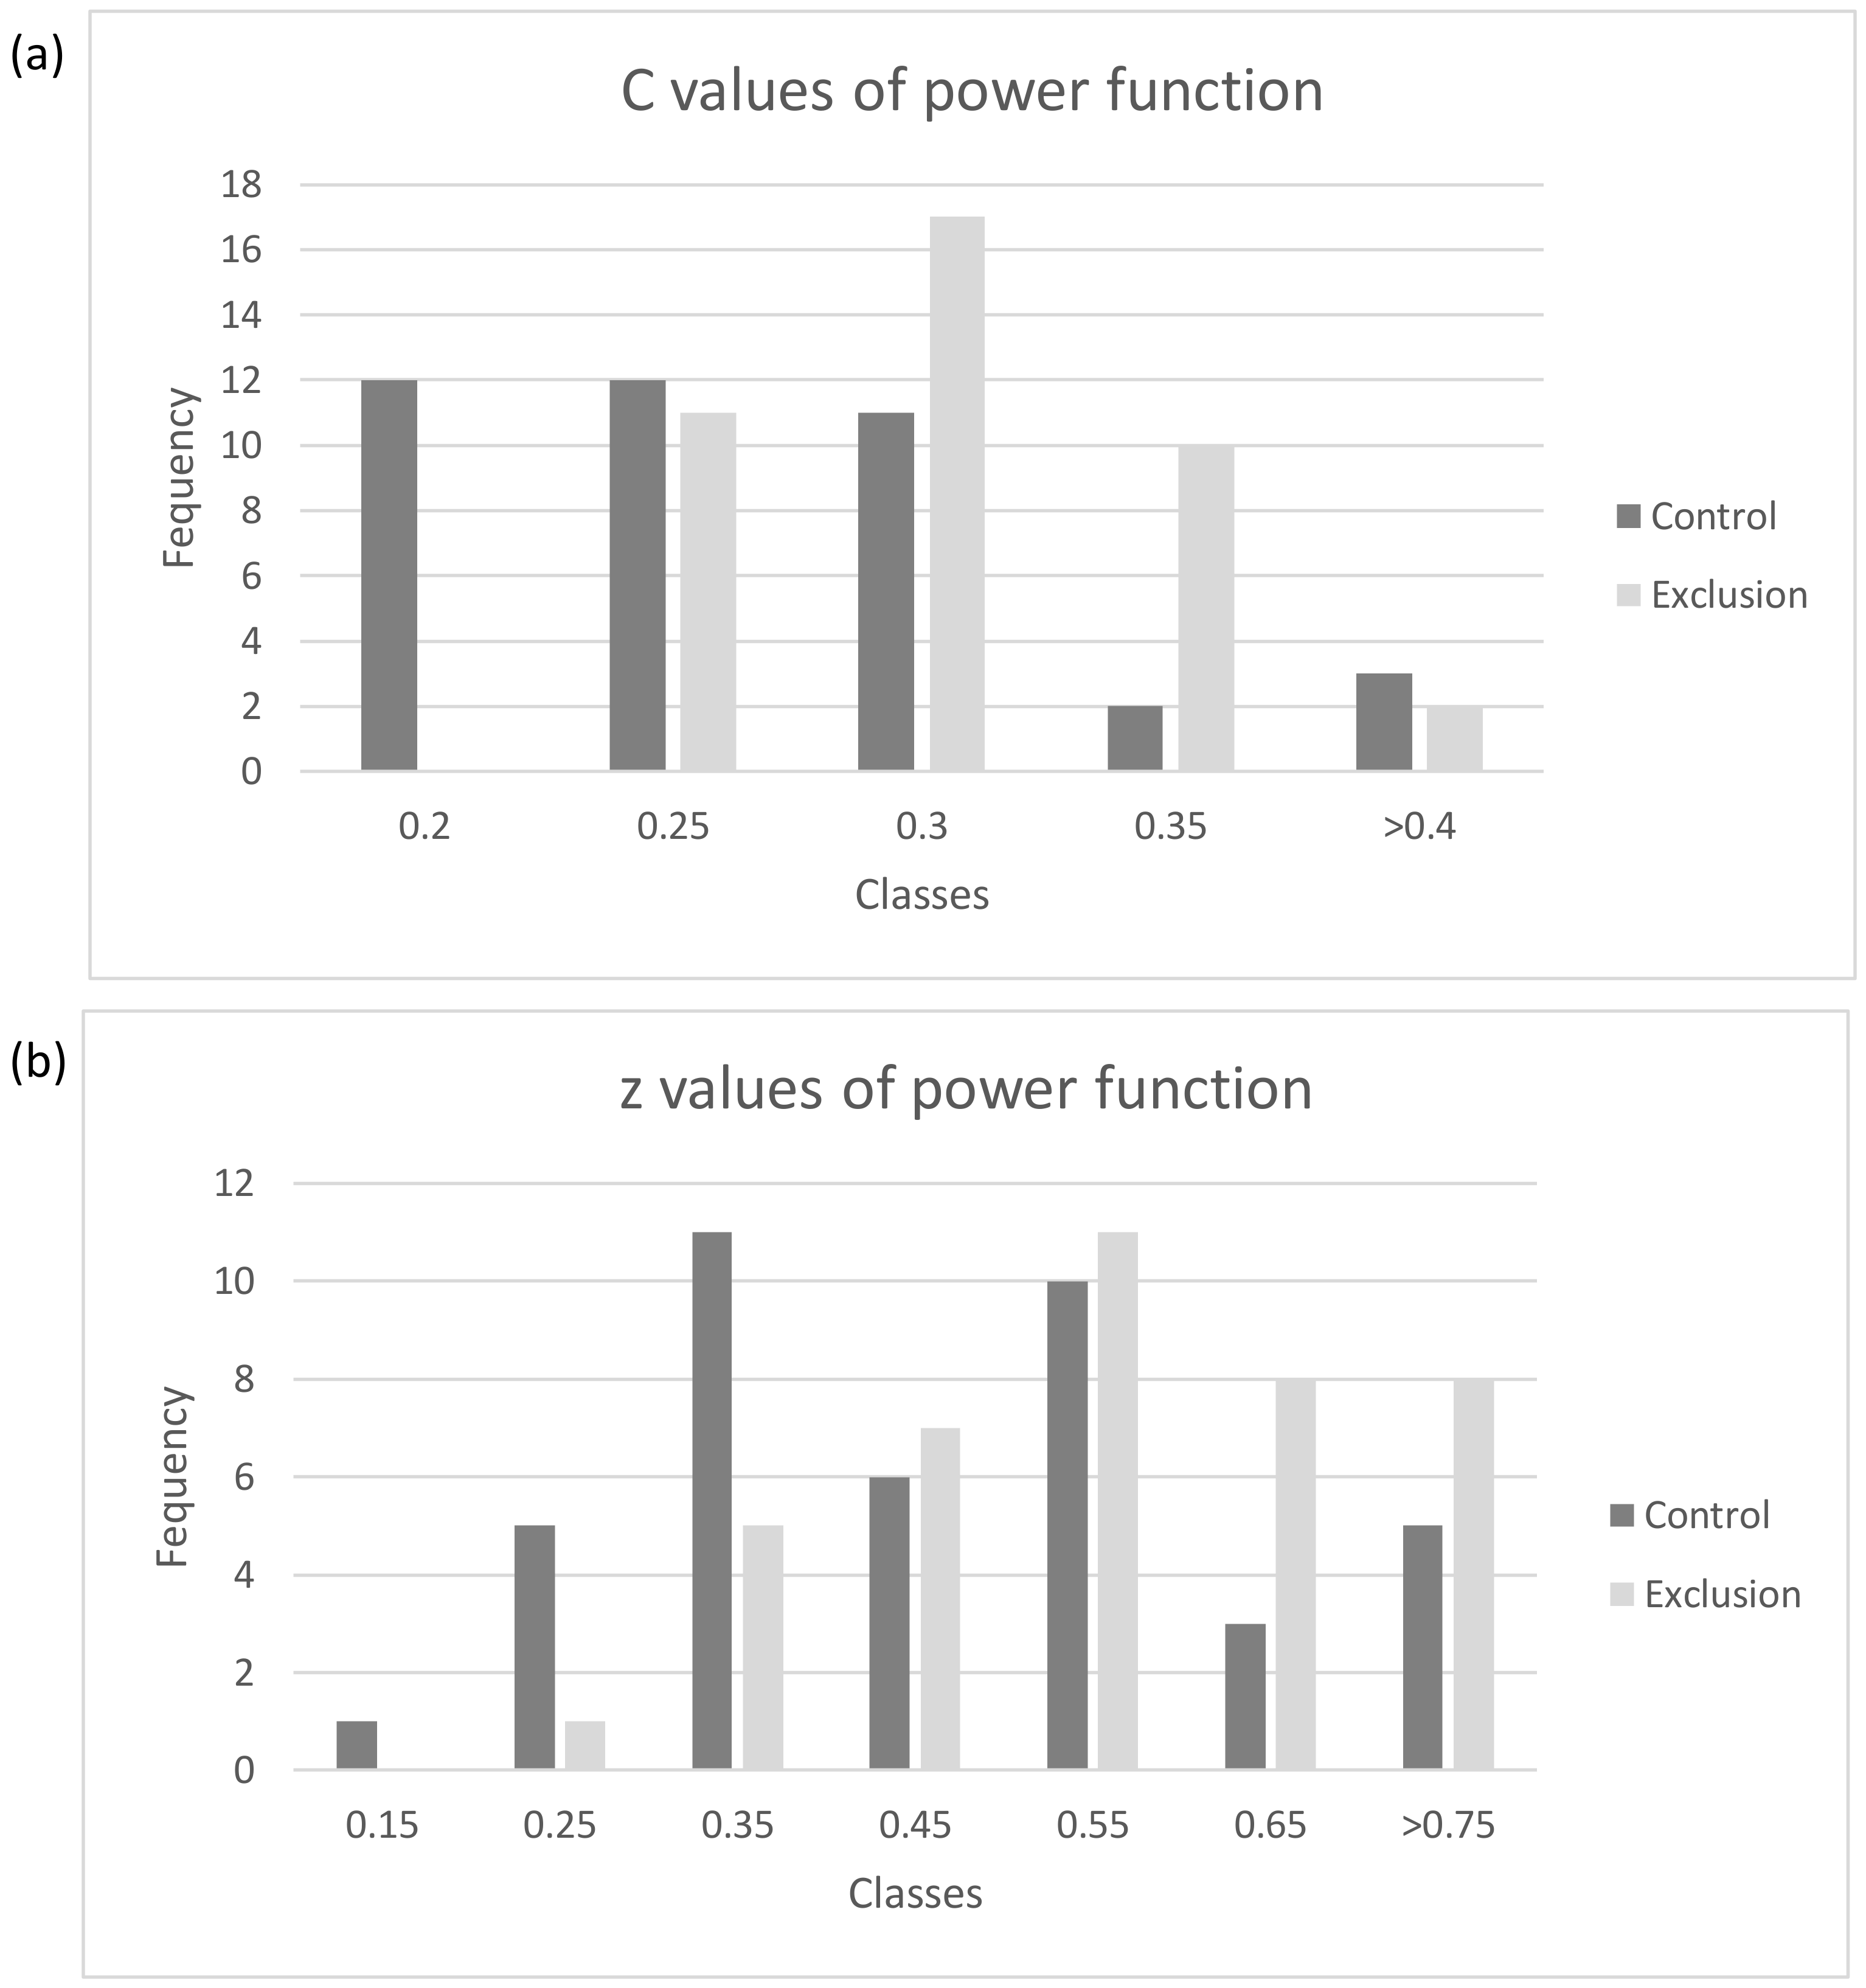
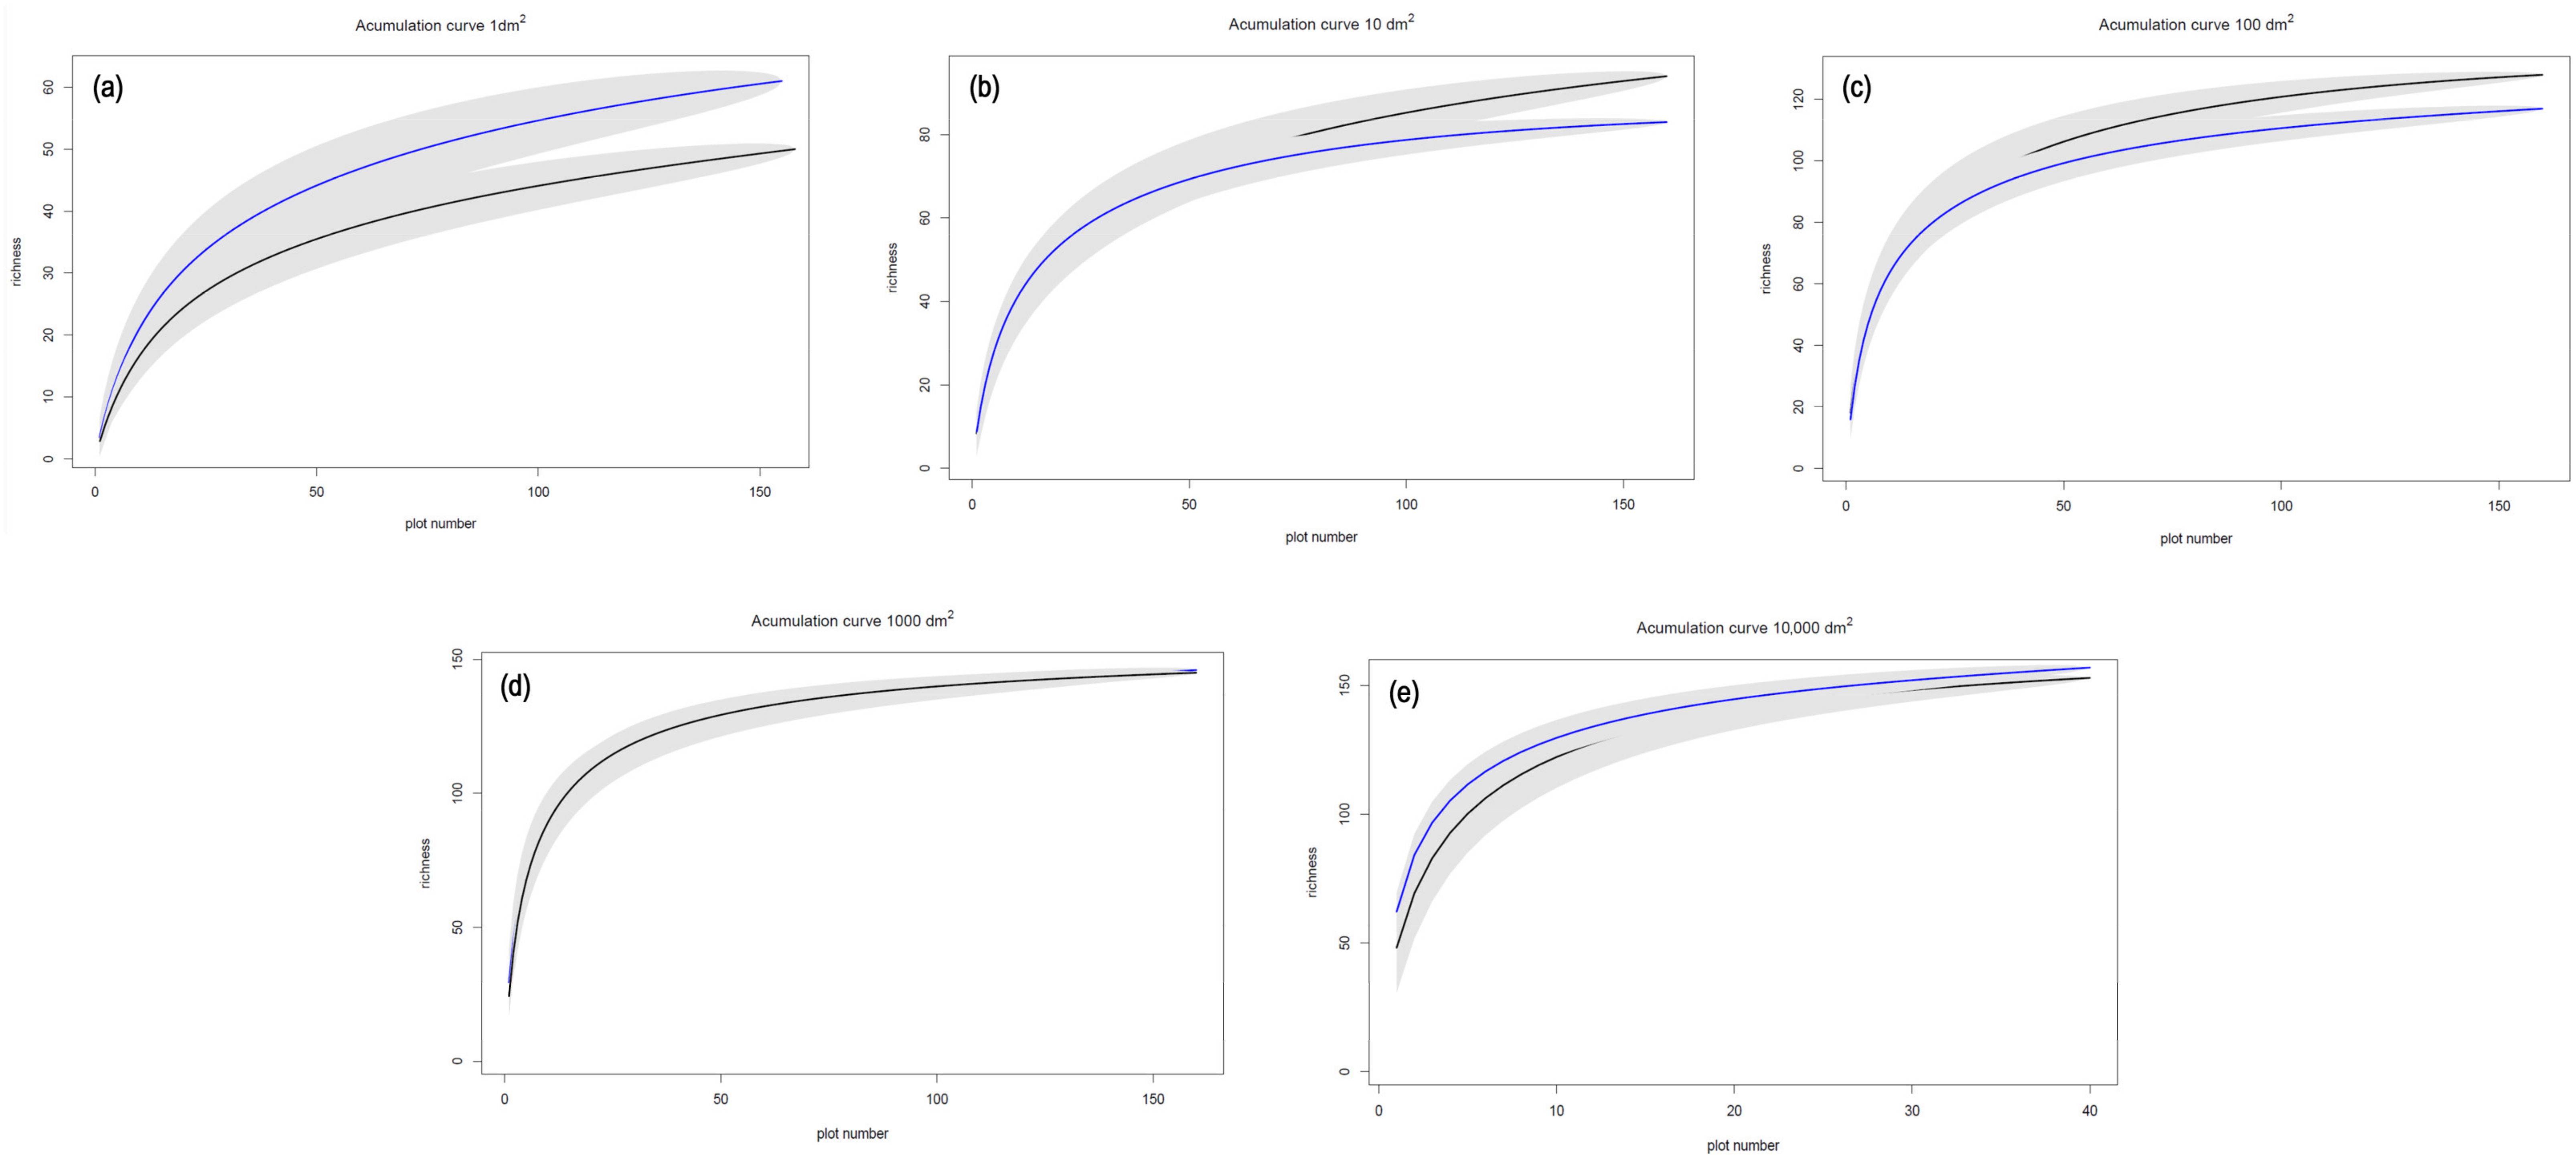
3. Results
4. Discussion
5. Conclusions
Author Contributions
Funding
Institutional Review Board Statement
Data Availability Statement
Acknowledgments
Conflicts of Interest
Appendix A

| Family | Scientific Name | Status | Functional Form | Palatability |
|---|---|---|---|---|
| Euphorbiaceae | Acalypha monostachya Cav. | Native | Forb | Non-palatable |
| Euphorbiaceae | Acalypha phleoides Cav. | Native | Forb | Non-palatable |
| Poaceae | Achnatherum eminens (Cav.) Barkworth | Native | Grasses | Palatable |
| Agavaceae | Agave asperrima Jacobi | Native | Shrub | Palatable |
| Nyctaginaceae | Allionia incarnata L. | Native | Forb | Non-palatable |
| Amaranthaceae | Alternanthera repens (L.) J.F. Gmel. | Native | Forb | Non-palatable |
| Amaranthaceae | Amaranthus blitoides S. Watson | Native | Forb | Palatable |
| Amaranthaceae | Amaranthus hybridus L. | Native | Forb | Palatable |
| Asteraceae | Ambrosia confertiflora DC. | Native | Forb | Non-palatable |
| Malvaceae | Anoda cristata (L.) Schltdl. | Native | Forb | Palatable |
| Euphorbiaceae | Argythamnia neomexicana Müll. Arg. | Native | Forb | Non-palatable |
| Poaceae | Aristida adscensionis L. | Native | Grasses | Non-palatable |
| Poaceae | Aristida curvifolia E. Fourn. | Native | Grasses | Non-palatable |
| Poaceae | Aristida divaricata Humb. and Bonpl. ex Willd. | Native | Grasses | Palatable |
| Poaceae | Aristida havardii Vasey | Native | Grasses | Palatable |
| Poaceae | Aristida pansa Wooton and Standl. | Native | Grasses | Palatable |
| Poaceae | Aristida purpurea Nutt. | Native | Grasses | Palatable |
| Asphodelaceae | Asphodelus fistulosus L. | Introduced | Forb | Non-palatable |
| Fabaceae | Astragalus hypoleucus S. Schauer | Native | Forb | Non-palatable |
| Asteraceae | Baccharis pteronioides DC. | Native | Forb | Non-palatable |
| Asteraceae | Baccharis salicifolia (Ruiz and Pav.) Pers. | Native | Forb | Non-palatable |
| Asteraceae | Bahia absinthifolia Benth. | Native | Forb | Non-palatable |
| Poaceae | Bothriochloa barbinodis (Lag.) Herter | Native | Grasses | Palatable |
| Poaceae | Bouteloua curtipendula (Michx.) Torr. | Native | Grasses | Palatable |
| Poaceae | Bouteloua dactyloides (Nutt.) J.T. Columbus | Native | Grasses | Palatable |
| Poaceae | Bouteloua gracilis (Kunth) Lag. ex Griffiths | Native | Grasses | Palatable |
| Poaceae | Bouteloua hirsuta Lag. | Native | Grasses | Palatable |
| Rubiaceae | Bouvardia ternifolia (Cav.) Schltdl. | Native | Forb | Non-palatable |
| Poaceae | Bouteloua uniflora Vasey | Native | Grasses | Palatable |
| Asteraceae | Brickellia veronicifolia (Kunth) A. Gray | Native | Shrub | Non-palatable |
| Buddlejaceae | Buddleja scordioides Kunth | Native | Shrub | Palatable |
| Onagraceae | Calylophus berlandieri Spach | Native | Forb | Non-palatable |
| Onagraceae | Calylophus hartwegii (Benth.) P.H. Raven | Native | Forb | Non-palatable |
| Cyperaceae | Carex schiedeana Kuntze | Native | Forb | Palatable |
| Orobanchaceae | Castilleja sessiliflora Pursh | Native | Forb | Non-palatable |
| Solanaceae | Chamaesaracha coniodes (Moric. ex Dunal) Britton | Native | Forb | Non-palatable |
| Asteraceae | Chaetopappa ericoides (Torr.) G.L. Nesom | Native | Forb | Non-palatable |
| Amaranthaceae | Chenopodium foetidum Lam. | Native | Forb | Non-palatable |
| Rubiaceae | Clematis drummondii Torr. and A. Gray | Native | Forb | Non-palatable |
| Cactaceae | Corynopuntia schottii (Engelm.) F.M. Knuth | Native | Cacti | Non-palatable |
| Rubiaceae | Crusea diversifolia (Kunth) W.R. Anderson | Native | Forb | Non-palatable |
| Boraginaceae | Cryptantha mexicana (Brandegee) I.M. Johnst. | Native | Forb | Non-palatable |
| Cucurbitaceae | Cucurbita foetidissima Kunth | Native | Forb | Non-palatable |
| Cucurbitaceae | Cucurbita pepo L. | Native | Forb | Palatable |
| Cactaceae | Cylindropuntia imbricata (Haw.) F.M. Knuth | Native | Cacti | Non-palatable |
| Nyctaginaceae | Cyphomeris gypsophiloides (M. Martens and Galeotti) Standl. | Native | Forb | Non-palatable |
| Cyperaceae | Cyperus niger Ruiz and Pav. | Native | Forb | Palatable |
| Fabaceae | Dalea aurea Nutt. ex Pursh | Native | Forb | Palatable |
| Fabaceae | Dalea bicolor Humb. and Bonpl. ex Willd. | Native | Shrub | Palatable |
| Fabaceae | Dalea greggii A. Gray | Native | Shrub | Palatable |
| Fabaceae | Dalea laniceps Barneby | Native | Forb | Palatable |
| Fabaceae | Dalea pogonathera A. Gray | Native | Forb | Palatable |
| Fabaceae | Desmanthus painteri (Britton and Rose) Standl. | Native | Forb | Palatable |
| Convolvulaceae | Dichondra argentea Humb. and Bonpl. ex Willd. | Native | Forb | Non-palatable |
| Poaceae | Disakisperma dubium (Kunth) P.M. Peterson and N. Snow | Native | Grasses | Palatable |
| Caryophyllaceae | Drymaria anomala S. Watson | Native | Forb | Non-palatable |
| Asteraceae | Dyssodia acerosa DC. | Native | Forb | Non-palatable |
| Acanthaceae | Dyschoriste linearis (Torr. and A. Gray) Kuntze | Native | Forb | Non-palatable |
| Asteraceae | Dyssodia papposa (Vent.) Hitchc. | Native | Forb | Non-palatable |
| Asteraceae | Dyssodia pinnata (Cav.) B.L. Rob. | Native | Forb | Non-palatable |
| Asparagaceae | Echeandia flavescens (Schult. and Schult. f.) Cruden | Native | Forb | Non-palatable |
| Cactaceae | Echinocactus horizonthalonius Lem. | Native | Cacti | Non-palatable |
| Cactaceae | Echinocereus pectinatus (Scheidw.) Engelm. | Native | Cacti | Non-palatable |
| Cactaceae | Echinocereus reichenbachii (Terscheck ex Walp.) Haage | Native | Cacti | Non-palatable |
| Poaceae | Elymus elymoides (Raf.) Swezey | Native | Grasses | Palatable |
| Acanthaceae | Elytraria imbricata (Vahl) Pers. | Native | Forb | Non-palatable |
| Poaceae | Enneapogon desvauxii P. Beauv. | Native | Grasses | Non-palatable |
| Poaceae | Erioneuron avenaceum (Kunth) Tateoka | Native | Grasses | Palatable |
| Asteraceae | Erigeron pubescens Kunth | Native | Forb | Non-palatable |
| Euphorbiaceae | Euphorbia cinerascens Engelm. | Native | Forb | Non-palatable |
| Euphorbiaceae | Euphorbia dentata Michx. | Native | Forb | Non-palatable |
| Euphorbiaceae | Euphorbia exstipulata Engelm. | Native | Forb | Non-palatable |
| Euphorbiaceae | Euphorbia serrula Engelm. | Native | Forb | Non-palatable |
| Convolvulaceae | Evolvulus alsinoides (L.) L. | Native | Forb | Non-palatable |
| Convolvulaceae | Evolvulus sericeus Sw. | Native | Forb | Non-palatable |
| Asteraceae | Gaillardia pinnatifida Torr. | Native | Forb | Non-palatable |
| Onagraceae | Gaura coccinea Pursh | Native | Forb | Non-palatable |
| Polemoniaceae | Gilia incisa Benth. | Native | Forb | Non-palatable |
| Verbenaceae | Glandularia bipinnatifida (Nutt.) Nutt. | Native | Forb | Non-palatable |
| Asteraceae | Gymnosperma glutinosum (Spreng.) Less. | Native | Shrub | Non-palatable |
| Polygalaceae | Hebecarpa barbeyana (Chodat) J.R. Abbot | Native | Forb | Non-palatable |
| Rubiaceae | Hedyotis nigricans (Lam.) Fosberg | Native | Forb | Non-palatable |
| Rubiaceae | Hedyotis rubra (Cav.) A. Gray | Native | Forb | Non-palatable |
| Fabaceae | Hoffmannseggia watsonii (Fisher) Rose | Native | Forb | Palatable |
| Poaceae | Hopia obtusa (Kunth) Zuloaga and Morrone | Native | Grasses | Palatable |
| Violaceae | Hybanthus verbenaceus (Kunth) Loes. | Native | Forb | Non-palatable |
| Convolvulaceae | Ipomoea costellata Torr. | Native | Forb | Non-palatable |
| Convolvulaceae | Ipomoea purpurea (L.) Roth | Native | Forb | Palatable |
| Asteraceae | Laennecia coulteri (A. Gray) G.L. Nesom | Native | Forb | Non-palatable |
| Polemoniaceae | Loeselia greggii S. Watson | Native | Forb | Non-palatable |
| Malvaceae | Malva parviflora L. | Introduced | Forb | Palatable |
| Cactaceae | Mammillaria heyderi Muehlenpf. | Native | Cacti | Non-palatable |
| Scrophulariaceae | Mecardonia vandellioides (Kunth) Pennell | Native | Forb | Non-palatable |
| Oleaceae | Menodora coulteri A. Gray | Native | Forb | Palatable |
| Fabaceae | Mimosa aculeaticarpa Ortega | Native | Shrub | Palatable |
| Fabaceae | Mimosa subinermis (S. Watson) B.L. Turner | Native | Forb | Palatable |
| Nyctaginaceae | Mirabilis oblongifolia (A. Gray) Heimerl | Native | Forb | Non-palatable |
| Poaceae | Muhlenbergia arenicola Buckley | Native | Grasses | Palatable |
| Poaceae | Muhlenbergia depauperata Scribn. | Native | Grasses | Non-palatable |
| Poaceae | Muhlenbergia phleoides (Kunth) J.T. Columbus | Native | Grasses | Palatable |
| Poaceae | Muhlenbergia repens (J. Presl) Hitchc. | Native | Grasses | Palatable |
| Poaceae | Muhlenbergia rigida (Kunth) Kunth | Native | Grasses | Palatable |
| Poaceae | Muhlenbergia torreyi (Kunth) Hitchc. ex Bush | Native | Grasses | Palatable |
| Poaceae | Muhlenbergia villiflora Hitchc. | Native | Grasses | Palatable |
| Poaceae | Munroa pulchella (Kunth) L.D. Amarilla | Native | Grasses | Palatable |
| Poaceae | Nassella leucotricha (Trin. and Rupr.) R.W. Pohl | Native | Grasses | Palatable |
| Poaceae | Nassella tenuissima (Trin.) Barkworth | Native | Grasses | Palatable |
| Brassicaceae | Nerisyrenia linearifolia (S. Watson) Greene | Native | Forb | Non-palatable |
| Nostocaceae | Nostoc commune Vaucher ex Bornet and Flahault | Native | Bacteria | Non-palatable |
| Onagraceae | Oenothera berlandieri (Spach) Spach ex D. Dietr. | Native | Forb | Non-palatable |
| Ophioglossaceae | Ophioglossum engelmannii Prantl | Native | Fern | Non-palatable |
| Cactaceae | Opuntia engelmannii Salm-Dyck | Native | Cacti | Palatable |
| Cactaceae | Opuntia lindheimeri Engelm. | Native | Cacti | Palatable |
| Cactaceae | Opuntia stenopetala Engelm. | Native | Cacti | Palatable |
| Poaceae | Panicum hallii Vasey | Native | Grasses | Palatable |
| Asteraceae | Parthenium confertum A. Gray | Native | Forb | Non-palatable |
| Asteraceae | Parthenium incanum Kunth | Native | Shrub | Palatable |
| Plantaginaceae | Penstemon barbatus (Cav.) Roth | Native | Forb | Non-palatable |
| Montiaceae | Phemeranthus aurantiacus (Engelm.) Kiger | Native | Forb | Non-palatable |
| Brassicaceae | Physaria argyraea (A. Gray) O’Kane and Al-Shehbaz | Native | Forb | Non-palatable |
| Brassicaceae | Physaria fendleri (A. Gray) O’Kane and Al-Shehbaz | Native | Forb | Non-palatable |
| Solanaceae | Physalis hederifolia A. Gray | Native | Forb | Non-palatable |
| Phyllanthaceae | Phyllanthus polygonoides Nutt. ex Spreng. | Native | Forb | Non-palatable |
| Polygalaceae | Polygala dolichocarpa S.F. Blake | Native | Forb | Non-palatable |
| Fabaceae | Pomaria canescens (Fisher) B.B. Simpson | Native | Forb | Palatable |
| Portulacaceae | Portulaca pilosa L. | Native | Forb | Non-palatable |
| Fabaceae | Prosopis glandulosa Torr. | Native | Shrub | Palatable |
| Asteraceae | Pseudognaphalium luteoalbum (L.) Hilliard and B.L. Burtt | Native | Forb | Non-palatable |
| Asteraceae | Pseudognaphalium roseum (Kunth) Anderb. | Native | Forb | Non-palatable |
| Polygalaceae | Rhinotropis lindheimeri (A. Gray) J.R. Abbott | Native | Forb | Non-palatable |
| Anacardiaceae | Rhus microphylla Engelm. | Native | Shrub | Non-palatable |
| Anacardiaceae | Rhus virens Lindh. ex A. Gray | Native | Shrub | Non-palatable |
| Fabaceae | Rhynchosia senna Gillies ex Hook. and Arn. | Native | Forb | Palatable |
| Lamiaceae | Salvia ballotiflora Benth. | Native | Shrub | Non-palatable |
| Lamiaceae | Salvia reflexa Hornem. | Native | Forb | Palatable |
| Asteraceae | Sanvitalia ocymoides DC. | Native | Forb | Non-palatable |
| Apocynaceae | Sarcostemma crispum Benth. | Native | Forb | Non-palatable |
| Fabaceae | Senna demissa (Rose) H.S. Irwin and Barneby | Native | Forb | Palatable |
| Malvaceae | Sida abutifolia Mill. | Native | Forb | Palatable |
| Malvaceae | Sida spinosa L. | Native | Forb | Palatable |
| Acanthaceae | Siphonoglossa pilosella (Nees) Torr. | Native | Forb | Non-palatable |
| Solanaceae | Solanum elaeagnifolium Cav. | Native | Forb | Palatable |
| Malvaceae | Sphaeralcea angustifolia (Cav.) G. Don | Native | Forb | Palatable |
| Malvaceae | Sphaeralcea hastulata A. Gray | Native | Forb | Palatable |
| Asteraceae | Stevia tomentosa Kunth | Native | Forb | Non-palatable |
| Brassicaceae | Synthlipsis greggii A. Gray | Native | Forb | Non-palatable |
| Rutaceae | Thamnosma texana (A. Gray) Torr. | Native | Forb | Non-palatable |
| Asteraceae | Thelesperma simplicifolium (A. Gray) A. Gray | Native | Forb | Non-palatable |
| Asteraceae | Thymophylla pentachaeta (DC.) Small | Native | Forb | Non-palatable |
| Asteraceae | Thymophylla setifolia Lag. | Native | Forb | Non-palatable |
| Boraginaceae | Tiquilia canescens (A. DC.) A.T. Richardson | Native | Forb | Non-palatable |
| Asteraceae | Townsendia mexicana A. Gray | Native | Forb | Non-palatable |
| Zygophyllaceae | Tribulus terrestris L. | Introduced | Forb | Non-palatable |
| Cactaceae | Turbinicarpus beguinii (N.P. Taylor) Mosco and Zanov. | Native | Cacti | Non-palatable |
| Poaceae | Urochloa meziana (Hitchc.) Morrone and Zuloaga | Native | Grasses | Palatable |
| Fabaceae | Vachellia glandulifera (S. Watson) Seigler and Ebinger | Native | Shrub | Non-palatable |
| Asteraceae | Verbesina hypomalaca B.L. Rob. and Greenm. | Native | Forb | Non-palatable |
| Verbenaceae | Verbena neomexicana (A. Gray) Small | Native | Forb | Non-palatable |
| Asteraceae | Viguiera dentata (Cav.) Spreng. | Native | Forb | Non-palatable |
| Asteraceae | Xanthisma spinulosum (Pursh) D.R. Morgan and R.L. Hartm. | Native | Forb | Non-palatable |
| Asteraceae | Zinnia acerosa (DC.) A. Gray | Native | Forb | Non-palatable |
References
- Olff, H.; Ritchie, M.E. Effects of herbivores on grassland plant diversity. Trends Ecol. Evol. 1998, 13, 261–265. [Google Scholar] [CrossRef] [PubMed]
- Greenwood, O.; Mossman, H.L.; Suggitt, A.J.; Curtis, R.J.; Maclean, I.M.D. Using in situ management to conserve biodiversity under climate change. J. Appl. Ecol. 2016, 53, 885–894. [Google Scholar] [CrossRef] [PubMed]
- McNaughton, S.J. Ecology of a grazing ecosystem: The Serengeti. Ecol. Monogr. 1985, 53, 291–320. [Google Scholar] [CrossRef]
- Tallowin, J.R.B.; Rook, A.J.; Rutter, S.M. Impact of grazing management on biodiversity of grasslands. Anim. Sci. 2005, 81, 193–198. [Google Scholar] [CrossRef]
- Crawley, M.J. (Ed.) Plant-herbivore dynamics. In Plant Ecology, 2nd ed.; Blackwell Science: Oxford, UK, 1997; pp. 401–474. [Google Scholar]
- Milchunas, D.G.; Sala, O.E.; Lauenroth, W.K. A generalized model of the effects of grazing by large herbivores on grasslands community structure. Am. Nat. 1998, 132, 87–106. [Google Scholar] [CrossRef]
- De Bello, F.; Lepš, J.; Sebastià, M.T. Grazing effects on species-area relationship: Variation along a climatic gradient in NE Spain. J. Veg. Sci. 2007, 18, 25–34. [Google Scholar] [CrossRef]
- Canals, R.M.; Sebastià, M.T. Analyzing mechanisms regulating diversity in rangelands through comparative studies: A case in the south-western Pyrennees. Biodiv. Conserv. 2000, 9, 965–984. [Google Scholar] [CrossRef]
- Austrheim, G.; Eriksson, O. Plant species diversity and grazing in the Scandinavian mountains- patterns and processes at different spatial scales. Ecography 2001, 24, 683–695. [Google Scholar] [CrossRef]
- Pakeman, R.J. Consistency of plant species and trait responses to grazing along a productivity gradient: A meta-analysis. J. Ecol. 2004, 92, 893–905. [Google Scholar] [CrossRef]
- Krahulec, F. Species coexistence in temperate grasslands. Folia Geobot. Phytotax. 1995, 30, 113–117. [Google Scholar] [CrossRef]
- Perkins, L.B.; Ahlering, M.; Larson, D.L. Looking to the future: Key points for sustainable management of northern Great Plains grasslands. Restor. Ecol. 2019, 27, 1212–1219. [Google Scholar] [CrossRef]
- Tracy, B.F.; Sanderson, M.A. Patterns of plant species richness in pasture lands of the northeast United States. Plant Ecol. 2000, 149, 169–180. [Google Scholar] [CrossRef]
- Perevolotsky, A.; Seligman, N.G. Role of Grazing in Mediterranean Rangeland Ecosystems. Inversion of a paradigm. Biosci. 1998, 48, 1007–1017. [Google Scholar] [CrossRef]
- Grace, J.B. The factors controlling species density in herbaceous plant communities: An assessment. PPEES 1999, 2, 1–28. [Google Scholar] [CrossRef]
- Perelman, S.B.; León, R.J.; Bussacca, J.P. Floristic changes related to grazing intensity in a Patagonian shrub-steppe. Ecography 1997, 20, 400–406. [Google Scholar] [CrossRef]
- Palmer, M.W. Variation in species richness—Towards a unification of hypotheses. Folia Geobot. Phytotax. 1994, 29, 511–530. [Google Scholar] [CrossRef]
- Coupland, R.T. (Ed.) Natural temperate grasslands. In Grassland Ecosystems of the World; Cambridge University Press: Cambridge, UK, 1979; pp. 41–111. [Google Scholar]
- Shreve, F. Grassland and related vegetation in northern Mexico. Madroño 1942, 6, 190–198. [Google Scholar]
- Valdés-Reyna, J.; Villaseñor, J.L.; Encina-Domínguez, J.A.; Ortiz, E. The grass family (Poaceae) in Coahuila, Mexico: Diversity and distribution. Bot. Sci. 2015, 93, 119–129. [Google Scholar] [CrossRef]
- Estrada-Castillón, E.; Scott-Morales, L.; Villarreal-Quintanilla, J.A.; Jurado-Ybarra, E.; Cotera-Correa, M.; Cantú-Ayala, C.; García-Pérez, J. Clasificación de los pastizales halófilos del noreste de México asociados con perrito de las praderas (Cynomys mexicanus): Diversidad y endemismo de especies. Rev. Mex. Biodiv. 2010, 81, 401–416. [Google Scholar] [CrossRef]
- Gutiérrez, R.; Medina, G.; Amador, M.D. Carga Animal del Pastizal Mediano Abierto en Zacatecas; Instituto Nacional de Investigaciones Forestales, Agrícolas y Pecuarias: Zacatecas, Mexico, 2007; pp. 1–37. [Google Scholar]
- Van Coller, H.; Siebert, F.; Scogings, P.F.; Ellis, S. Herbaceous responses to herbivory, fire and rainfall variability differ between grasses and forbs. S. Afr. J. Bot. 2018, 119, 94–103. [Google Scholar] [CrossRef]
- Gusha, J.; Mugabe, P.H. Unpalatable and wiry grasses are the dominant grass species in semi-arid communal rangelands in Zimbabwe. Int. J. Dev. Sustain. 2013, 2, 1075–1083. [Google Scholar]
- Manzano, M.G.; Navar, J.; Pando, M.M.; Martínez, A. Overgrazing and desertification in northern Mexico: Highlights on north eastern region. Ann. Arid. Zone 2000, 39, 285–304. [Google Scholar]
- Rosenzweig, M.L. Species Diversity in Space and Time; Cambridge University Press: New York, NY, USA, 1995. [Google Scholar]
- Kunin, W.E. Extrapolating species abundance across spatial scales. Science 1998, 281, 1513–1515. [Google Scholar] [CrossRef] [PubMed]
- Crawley, M.J.; Harral, J.E. Scale Dependence in Plant Biodiversity. Science 2001, 291, 864–868. [Google Scholar] [CrossRef] [PubMed]
- Díaz, S.; Pascual, U.; Stenseke, M.; Martín-López, B.; Watson, R.T.; Molnár, Z.; Hill, R.; Chan, K.M.; Baste, I.A.; Brauman, K.A.; et al. Summary for Policymakers of the Global Assessment Report on Biodiversity and Ecosystem Services; Intergovernmental Science-Policy Platform on Biodiversity and Ecosystem Services: Bonn, Germany, 2019. [Google Scholar]
- Jiang, G.; Liu, Y.; Liu, C.; Yang, G.; Liu, Q. Scale effects of soil moisture spatial heterogeneity on grassland biodiversity in an arid region. Sci. Total Environ. 2020, 739, 139923. [Google Scholar]
- Fahrig, L. Ecological responses to habitat fragmentation per se. Annu. Rev. Ecol. Evol. Syst. 2017, 48, 1–23. [Google Scholar] [CrossRef]
- Gilbert, B.; Bennett, J.R.; Fukami, T. Assembly history dictates ecosystem functioning: Evidence from wood decomposer communities. Ecol. Lett. 2010, 13, 675–684. [Google Scholar]
- Tscharntke, T.; Tylianakis, J.M.; Rand, T.A.; Didham, R.K.; Fahrig, L.; Batáry, P.; Bengtsson, J.; Clough, Y.; Crist, T.O.; Dormann, C.F.; et al. Landscape moderation of biodiversity patterns and processes—Eight hypotheses. Biol. Rev. 2012, 87, 661–685. [Google Scholar] [CrossRef] [PubMed]
- Dornelas, M.; Gotelli, N.J.; McGill, B.; Shimadzu, H.; Moyes, F.; Sievers, C.; Magurran, A.E. Assemblage time series reveal biodiversity change but not systematic loss. Science 2014, 344, 296–299. [Google Scholar] [CrossRef] [PubMed]
- Luck, G.W. A review of the relationships between human population density and biodiversity. Biol. Rev. 2007, 82, 607–645. [Google Scholar] [CrossRef]
- Lindenmayer, D.B.; Fischer, J.; Felton, A.; Crane, M.; Michael, D.; Macgregor, C. Biodiversity monitoring in the era of climate change: A review of methods for detection of species shifts. Clim. Change Responses 2012, 1, 5. [Google Scholar]
- Anon. Programa de Manejo de la Zona Sujeta a Conservación Ecológica “Sierra de Zapalinamé”; Secretaría de Desarrollo Social, Gobierno del Estado de Coahuila: Saltillo, Mexico, 1998; 179p. [Google Scholar]
- Encina-Domínguez, J.A. Riqueza Florística y Comunidades Vegetales de la Sierra de Zapalinamé, Saltillo, Coahuila, México. Ph.D. Thesis, Facultad de Ciencias Forestales, Universidad Autónoma de Nuevo León, San Nicolás de los Garza, Mexico, 2017; 145p. [Google Scholar]
- Arévalo, J.R.; González-Montelongo, C.; Encina-Domínguez, J.A.; García, E.; Mellado, M. Changes in richness and species composition after five years of grazing exclusion in an endemic pasture of northern Mexico. Land 2022, 11, 1962. [Google Scholar] [CrossRef]
- Favret-Tondato, R.C. Apropiación de los recursos naturales y producción en el territorio de la sierra de Zapalinamé. In Guía Para Conocer y Valorar el Área Protegida de la Sierra de Zapalinamé; Arizpe-Narro, A., Ed.; Elemento Cero Ediciones: Saltillo, Mexico, 2013; pp. 89–101. [Google Scholar]
- Wiens, J.A. Spatial scaling in ecology. Funct. Ecol. 1989, 3, 385–397. [Google Scholar] [CrossRef]
- Peet, R.K.; Wentworth, T.R.; White, P.S. A flexible, multipurpose method for recording vegetation composition and structure. Castanea 1998, 63, 262–274. [Google Scholar]
- Arrhenius, O. Species and area. J. Ecol. 1921, 9, 95–99. [Google Scholar] [CrossRef]
- Scheiner, S.M. Six types of species-area curves. Glob. Ecol. Biogeogr. 2003, 12, 441–447. [Google Scholar] [CrossRef]
- Legendre, P.; Legendre, L. Numerical Ecology, 2nd ed.; Elsevier: Amsterdam, The Netherlands, 1998; p. 853. [Google Scholar]
- Oksanen, J.; Blanchet, F.G.; Friendly, M.; Kindt, R.; Legendre, P.; McGlinn, D.; Minchin, P.R.; O’Hara, R.B.; Solymos, P.; Wagner, H. Vegan: Community Ecology Package. R Package Version 4.1-3. 2022. Available online: https://CRAN.R-project.org/package=vegan (accessed on 3 October 2022).
- Fernández-Lugo, S.; de Nascimento, L.; Mellado, M.; Arévalo, J.R. Grazing effects on species richness depends on scale: A 5 year study in Tenerife pastures (Canary Islands). Plant Ecol. 2011, 212, 423–432. [Google Scholar] [CrossRef]
- Colwell, R.K.; Coddington, J.A. Estimating terrestrial biodiversity through extrapolation. Philos. Trans. R. Soc. B Biol. Sci. 1994, 345, 101–118. [Google Scholar]
- Al-Mufti, M.M.; Sydes, C.L.; Furness, S.B.; Grime, J.P.; Band, S.R. A Quantitative analysis of shoot phenology and dominance in herbaceous vegetation. J. Ecol. 1977, 65, 759–791. [Google Scholar] [CrossRef]
- Spiegelberger, T.; Matthies, D.; Muller-Scharer, H.; Schaffner, U. Scale-dependent effects of land use on plant species richness of mountain grassland in the European Alps. Ecography 2006, 29, 541–548. [Google Scholar] [CrossRef]
- Loucougaray, G.; Farruggia, C.; Hoste, H. Effects of two contrasting livestock grazing systems on vegetation dynamics in heterogeneous mountain pastures. Appl. Veg. Sci. 2011, 14, 80–89. [Google Scholar]
- Kozak, J.; Duffy, L.K.; Weathers, K.C.; Giblin, A.E. Spatial scales of plant community composition variation in a temperate grassland. Ecosphere 2018, 9, e02156. [Google Scholar]
- Martín-López, B.; Iniesta-Arandia, I.; García-Llorente, M.; Palomo, I.; Casado-Arzuaga, I.; Amo, D.G.D.; Gómez-Baggethun, E.; Oteros-Rozas, E.; Palacios-Agundez, I.; Willaarts, B.; et al. Uncovering ecosystem service bundles through social Preferences. PLoS ONE 2012, 7, e38970. [Google Scholar] [CrossRef] [PubMed]
- Bakker, E.S.; Olff, H.; Gleichman, J.M. Herbivore Impact on Grassland Plant Diversity Depends on Habitat Productivity and Herbivore Size. Ecol. Lett. 2006, 9, 780–788. [Google Scholar] [CrossRef] [PubMed]
- Leitão, R.P.; Zuanon, J.; Villéger, S.; Williams, S.E.; Baraloto, C.; Fortunel, C.; Mendonça, F.P.; Mouillot, D.; Magnusson, W.E. Rare species contribute disproportionately to the functional structure of species assemblages. Proc. R. Soc. B Biol. Sci. 2016, 283, 20160084. [Google Scholar] [CrossRef] [PubMed]
- Fahrig, L. Effects of habitat fragmentation on biodiversity. Annu. Rev. Ecol. Evol. Syst. 2003, 34, 487–515. [Google Scholar] [CrossRef]
- Turner, M.G.; Bakker, W.L.; Peterson, C.J. Factors influencing succession: Lessons from large, infrequent natural disturbances. Ecosystems 2004, 7, 511–523. [Google Scholar] [CrossRef]
- Fridley, J.D.; Vandermast, D.B.; Kuppinger, D.M.; Manthey, M.; Peet, R.K.; Sutherland, S. Co-occurrence-based assessment of habitat generalists and specialists: A new approach for the measurement of niche width. J. Ecol. 2007, 95, 707–722. [Google Scholar] [CrossRef]

| Plot | Alt (m.a.s.l.) * | Aspect | Slope |
|---|---|---|---|
| E1 | 2243 | 140 | 15 |
| C1 | 2246 | 140 | 15 |
| E2 | 2231 | 140 | 23 |
| C2 | 2235 | 140 | 23 |
| E3 | 2213 | 140 | 20 |
| C3 | 2220 | 140 | 20 |
| E4 | 2194 | 135 | 25 |
| C4 | 2198 | 135 | 25 |
| E5 | 2171 | 140 | 18 |
| C5 | 2180 | 140 | 18 |
| E6 | 2131 | 140 | 12 |
| C6 | 2138 | 140 | 12 |
| E7 | 2129 | 140 | 10 |
| C7 | 2125 | 140 | 10 |
| E8 | 2112 | 140 | 10 |
| C8 | 2115 | 140 | 10 |
| 2017 | 2018 | 2019 | 2020 | 2021 | |||||||
|---|---|---|---|---|---|---|---|---|---|---|---|
| Plot | tre | z | c | z | c | z | c | z | c | z | c |
| 1 | co | 0.23 | 0.69 | 0.32 | 0.55 | 0.31 | 0.55 | 0.30 | 0.61 | 0.25 | 0.75 |
| 2 | co | 0.31 | 0.60 | 0.36 | 0.51 | 0.37 | 0.43 | 0.40 | 0.42 | 0.34 | 0.53 |
| 3 | co | 0.28 | 0.62 | 0.31 | 0.52 | 0.33 | 0.47 | 0.32 | 0.56 | 0.27 | 0.66 |
| 4 | co | 0.29 | 0.65 | 0.35 | 0.50 | 0.27 | 0.69 | 0.33 | 0.62 | 0.25 | 0.76 |
| 5 | co | 0.34 | 0.37 | 0.34 | 0.38 | 0.33 | 0.42 | 0.40 | 0.26 | 0.28 | 0.57 |
| 6 | co | 0.28 | 0.62 | 0.27 | 0.68 | 0.24 | 0.78 | 0.26 | 0.72 | 0.25 | 0.72 |
| 7 | co | 0.23 | 0.54 | 0.24 | 0.56 | 0.23 | 0.62 | 0.20 | 0.77 | 0.24 | 0.64 |
| 8 | co | 0.27 | 0.59 | 0.28 | 0.57 | 0.26 | 0.73 | 0.23 | 0.79 | 0.23 | 0.75 |
| 1 | ex | 0.28 | 0.62 | 0.33 | 0.52 | 0.28 | 0.66 | 0.31 | 0.54 | 0.27 | 0.63 |
| 2 | ex | 0.32 | 0.55 | 0.32 | 0.55 | 0.37 | 0.43 | 0.38 | 0.45 | 0.34 | 0.56 |
| 3 | ex | 0.35 | 0.55 | 0.37 | 0.40 | 0.38 | 0.30 | 0.38 | 0.43 | 0.32 | 0.62 |
| 4 | ex | 0.28 | 0.71 | 0.30 | 0.63 | 0.32 | 0.46 | 0.33 | 0.57 | 0.28 | 0.70 |
| 5 | ex | 0.35 | 0.32 | 0.33 | 0.39 | 0.39 | 0.18 | 0.36 | 0.32 | 0.34 | 0.37 |
| 6 | ex | 0.28 | 0.58 | 0.30 | 0.53 | 0.33 | 0.51 | 0.27 | 0.68 | 0.29 | 0.60 |
| 7 | ex | 0.34 | 0.30 | 0.29 | 0.48 | 0.33 | 0.40 | 0.37 | 0.34 | 0.34 | 0.38 |
| 8 | ex | 0.31 | 0.41 | 0.32 | 0.43 | 0.37 | 0.40 | 0.28 | 0.63 | 0.27 | 0.63 |
Disclaimer/Publisher’s Note: The statements, opinions and data contained in all publications are solely those of the individual author(s) and contributor(s) and not of MDPI and/or the editor(s). MDPI and/or the editor(s) disclaim responsibility for any injury to people or property resulting from any ideas, methods, instructions or products referred to in the content. |
© 2023 by the authors. Licensee MDPI, Basel, Switzerland. This article is an open access article distributed under the terms and conditions of the Creative Commons Attribution (CC BY) license (https://creativecommons.org/licenses/by/4.0/).
Share and Cite
Arévalo, J.R.; Encina-Domínguez, J.A.; González-Montelongo, C.; Mellado, M.; Cruz-Anaya, A. Effects of Scale, Temporal Variation and Grazing on Diversity in an Endemic Pasture in Sierra de Zapaliname, Coahuila, Mexico. Agriculture 2023, 13, 1737. https://doi.org/10.3390/agriculture13091737
Arévalo JR, Encina-Domínguez JA, González-Montelongo C, Mellado M, Cruz-Anaya A. Effects of Scale, Temporal Variation and Grazing on Diversity in an Endemic Pasture in Sierra de Zapaliname, Coahuila, Mexico. Agriculture. 2023; 13(9):1737. https://doi.org/10.3390/agriculture13091737
Chicago/Turabian StyleArévalo, José Ramón, Juan A. Encina-Domínguez, Cristina González-Montelongo, Miguel Mellado, and Arturo Cruz-Anaya. 2023. "Effects of Scale, Temporal Variation and Grazing on Diversity in an Endemic Pasture in Sierra de Zapaliname, Coahuila, Mexico" Agriculture 13, no. 9: 1737. https://doi.org/10.3390/agriculture13091737
APA StyleArévalo, J. R., Encina-Domínguez, J. A., González-Montelongo, C., Mellado, M., & Cruz-Anaya, A. (2023). Effects of Scale, Temporal Variation and Grazing on Diversity in an Endemic Pasture in Sierra de Zapaliname, Coahuila, Mexico. Agriculture, 13(9), 1737. https://doi.org/10.3390/agriculture13091737