
Impact of Varying Mass Concentrations of Ammonia Nitrogen on Biogas Production and System Stability of Anaerobic Fermentation

 ,
,
Abstract
:1. Introduction
2. Materials and Methods
2.1. Test Material
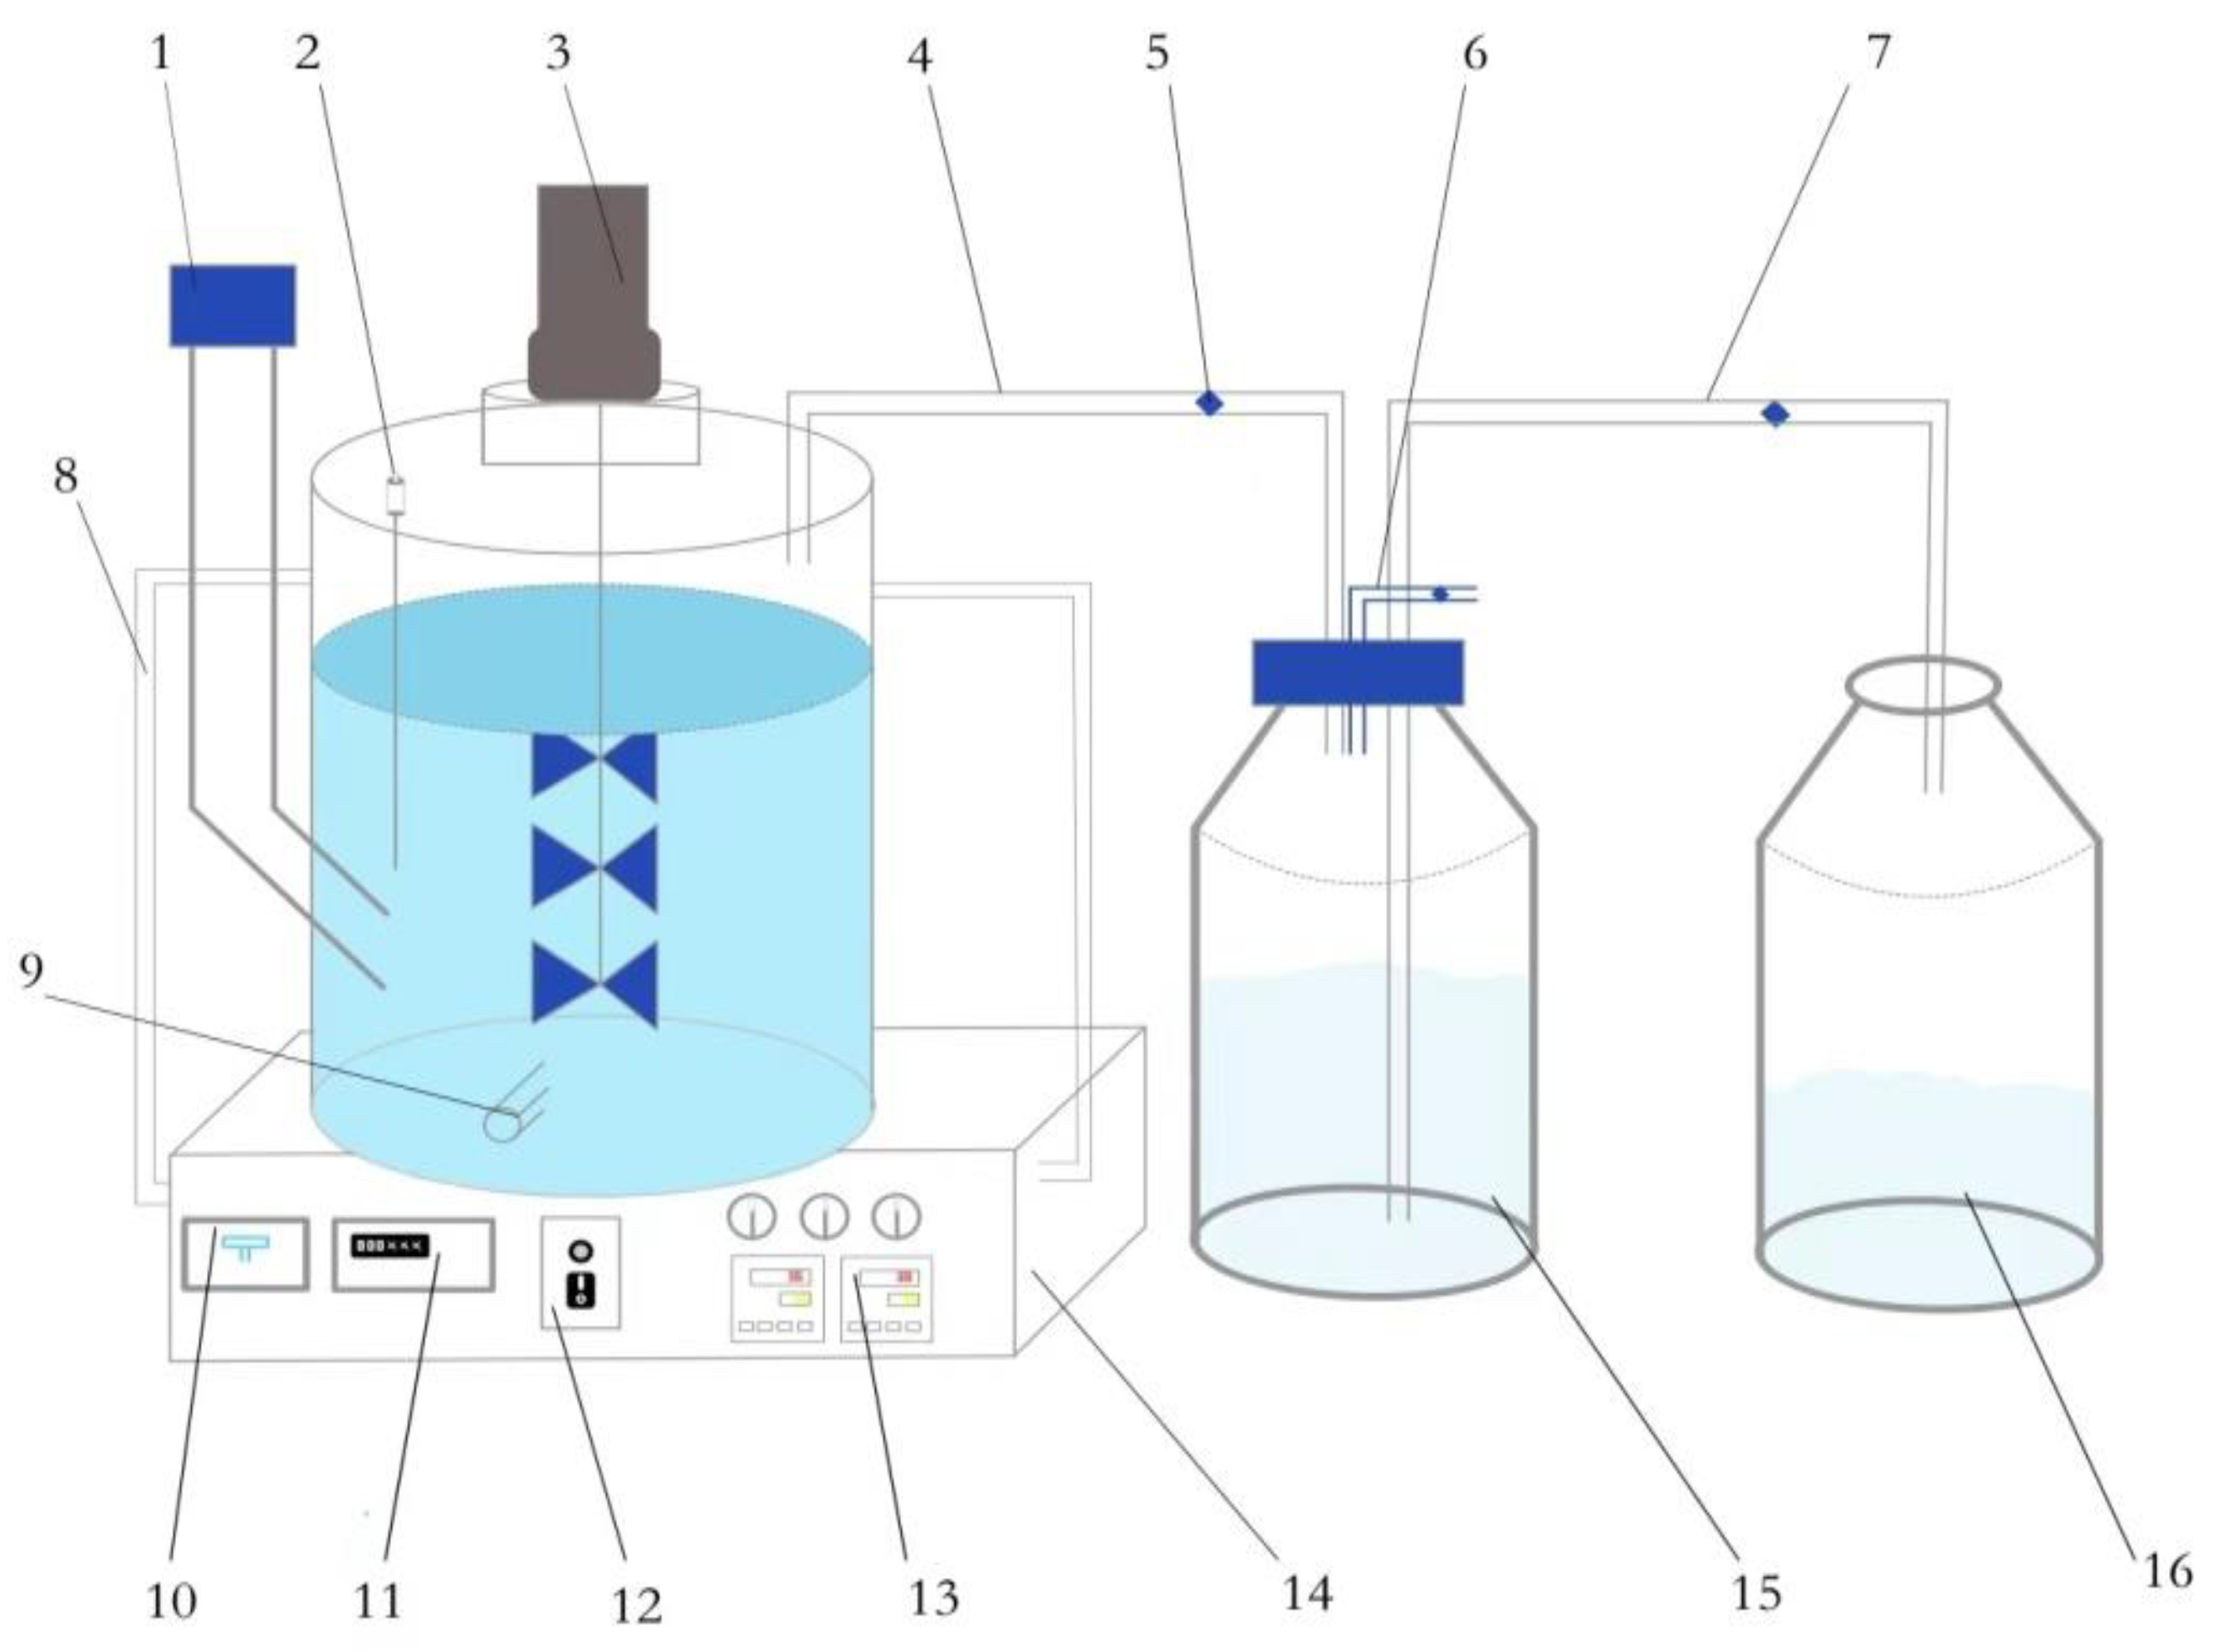
2.2. Test Device
2.3. Experimental Design
2.4. Indicator Determination and Method
2.4.1. Measurement of Performance Indicators of Fermentation Materials
2.4.2. Determination of Performance Indicators of Fermentation-Feed Liquid
2.4.3. Determination of Daily Methane Production and Cumulative Methane Production
2.5. Data Processing
3. Results and Discussion
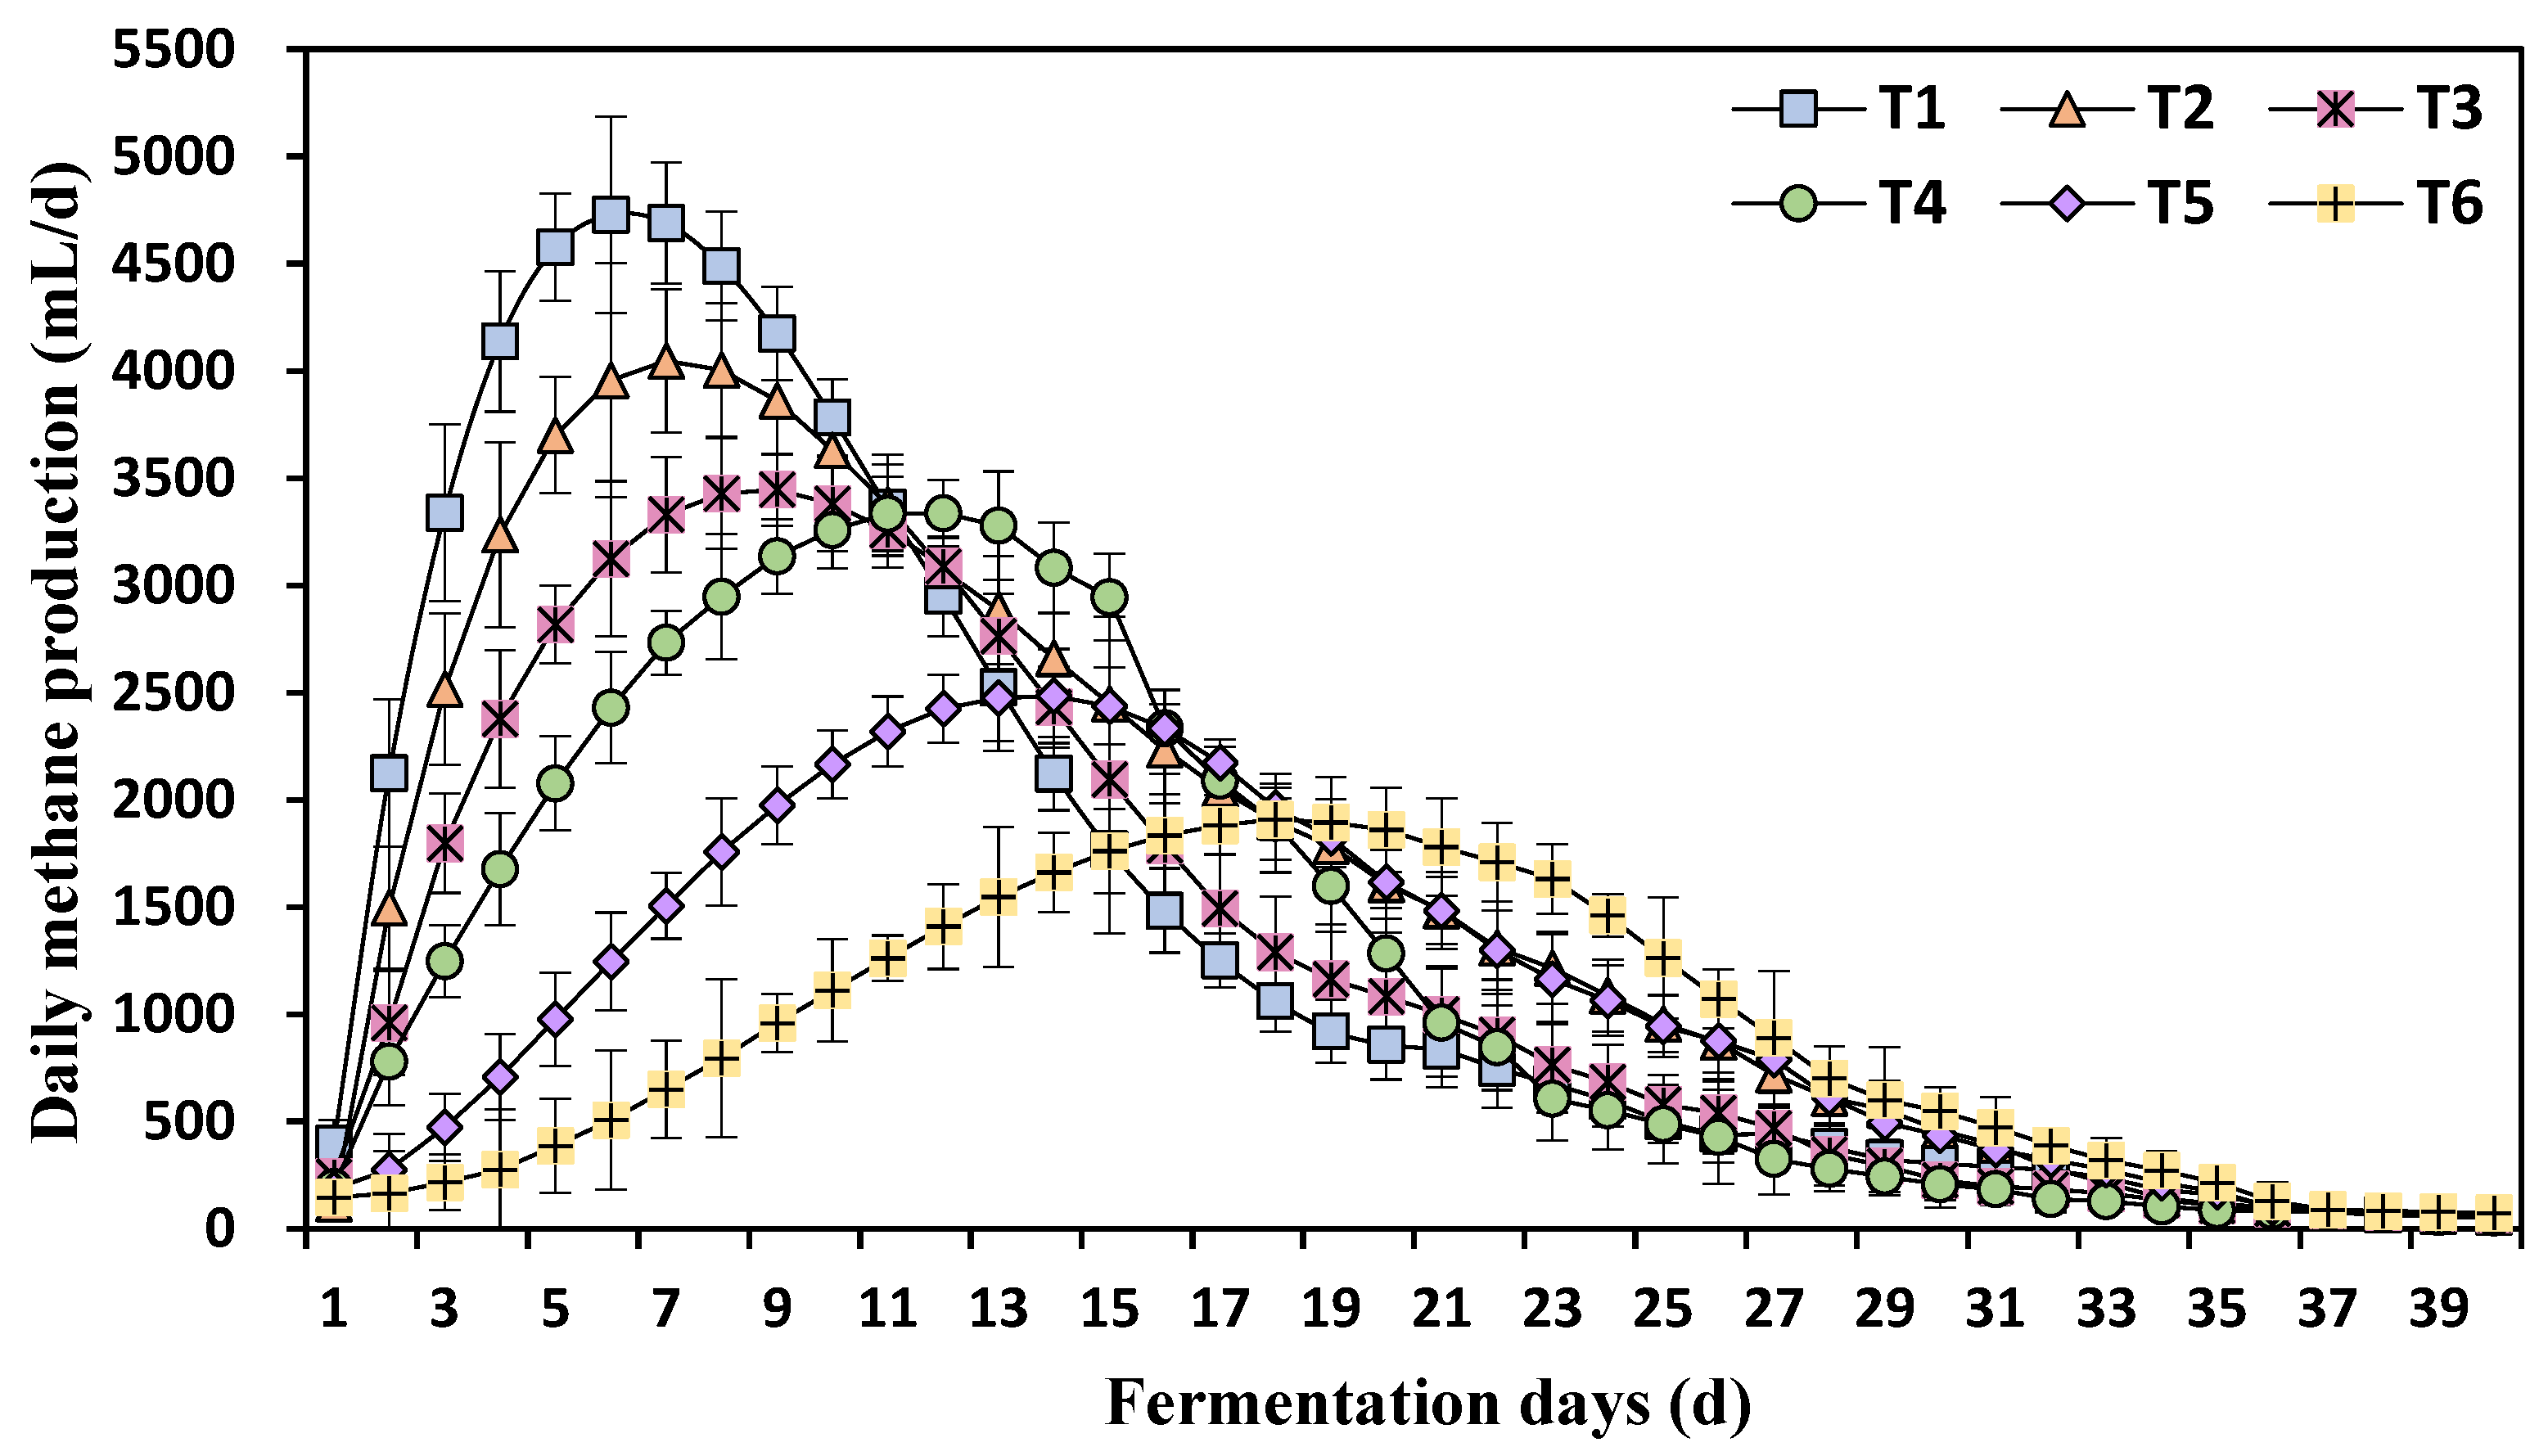
3.1. Effects of Different Ammonia Nitrogen Concentrations on Daily Methane Production
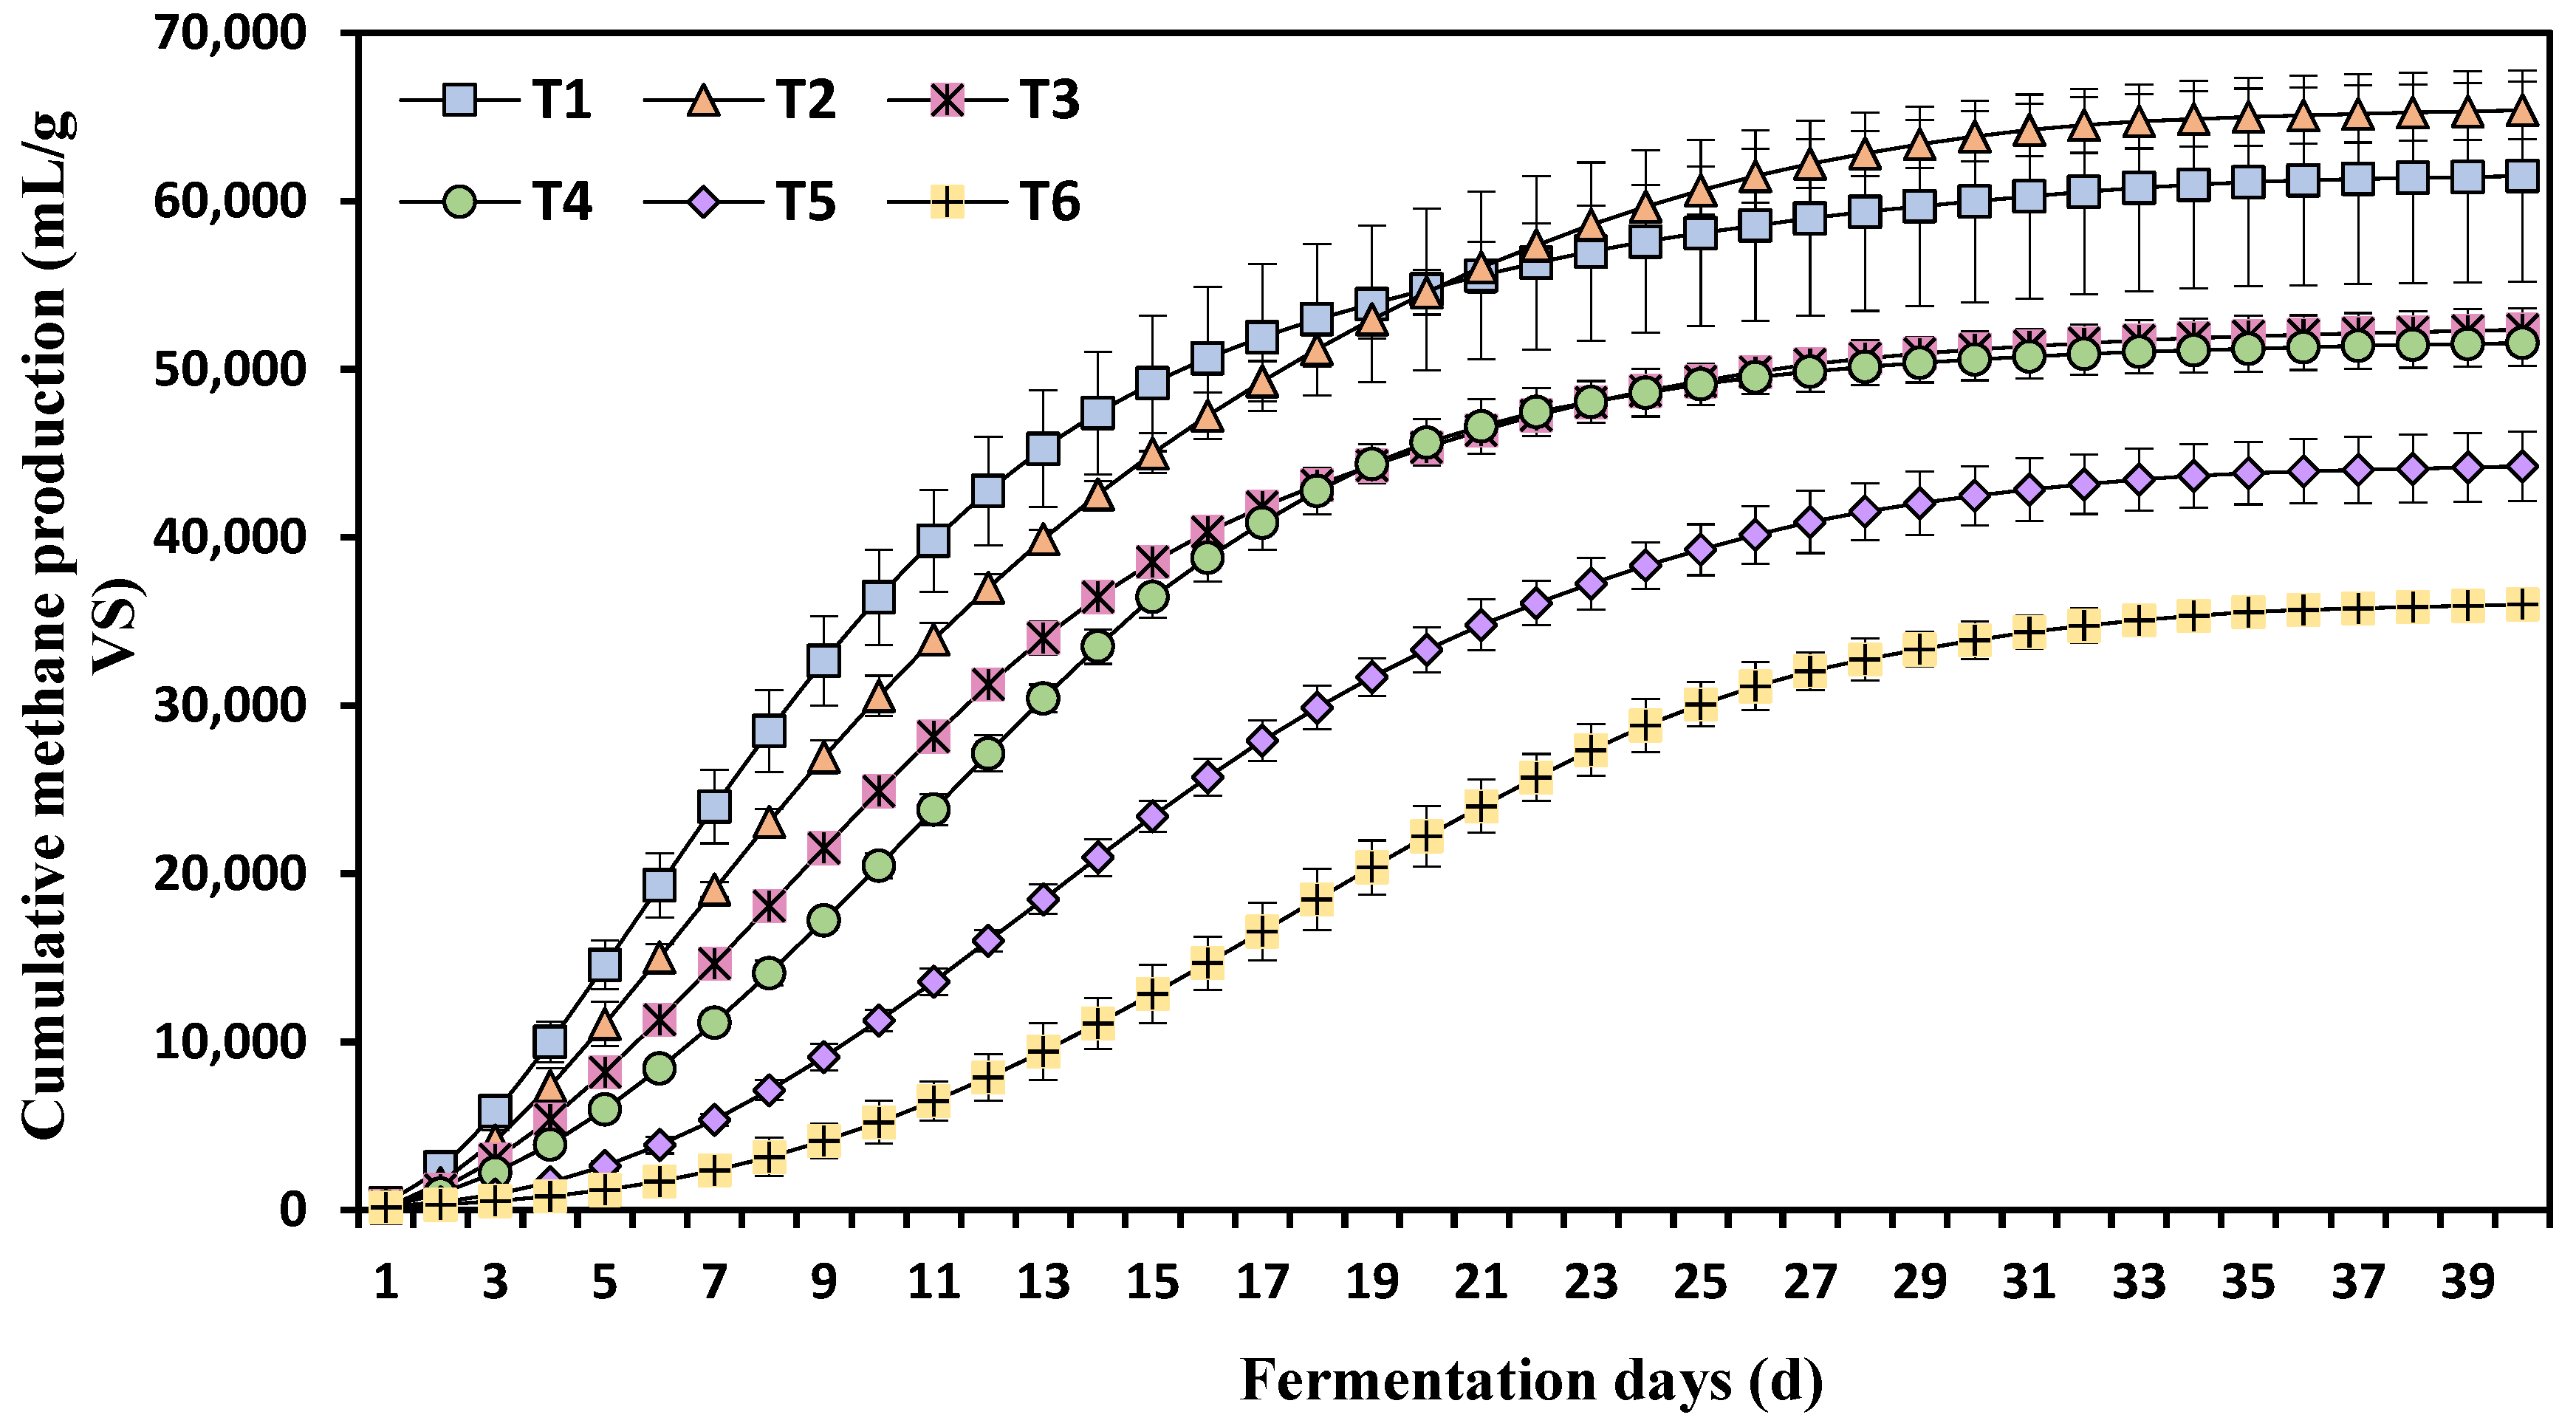
3.2. Effects of Different Ammonia Nitrogen Concentrations on Cumulative Methane Production
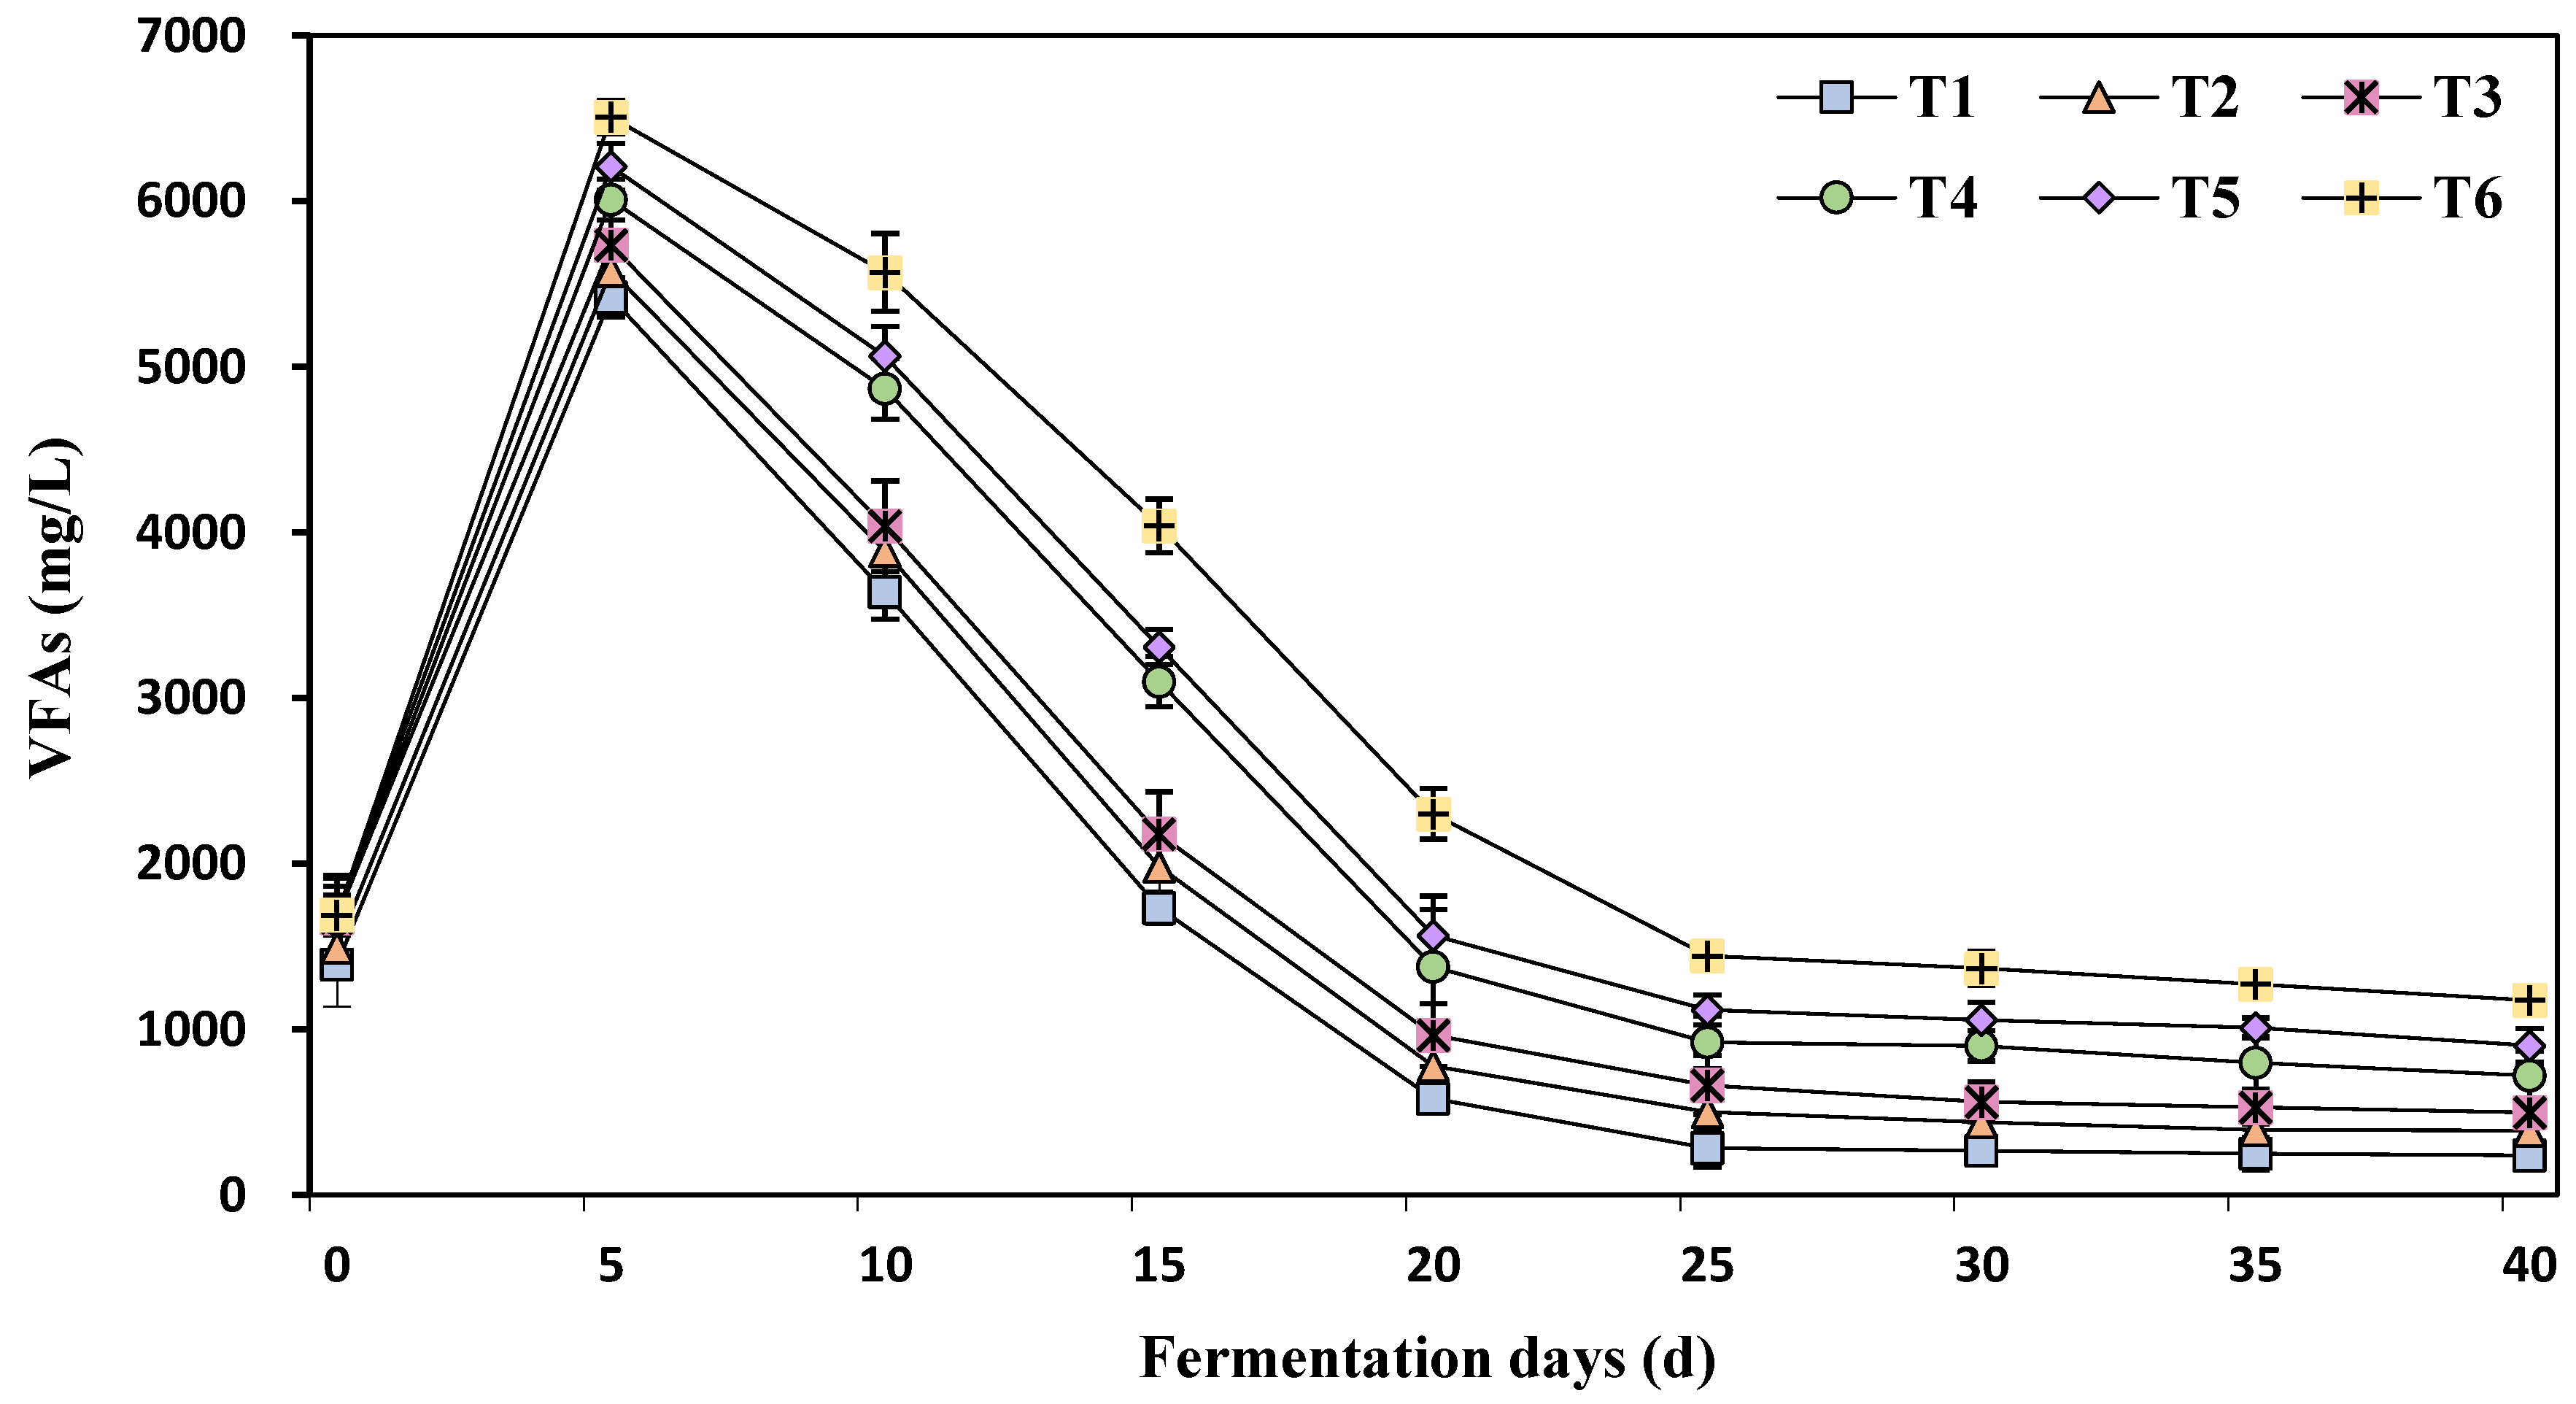
3.3. The Effect of Different Concentrations of Ammonia Nitrogen on Volatile Fatty Acids
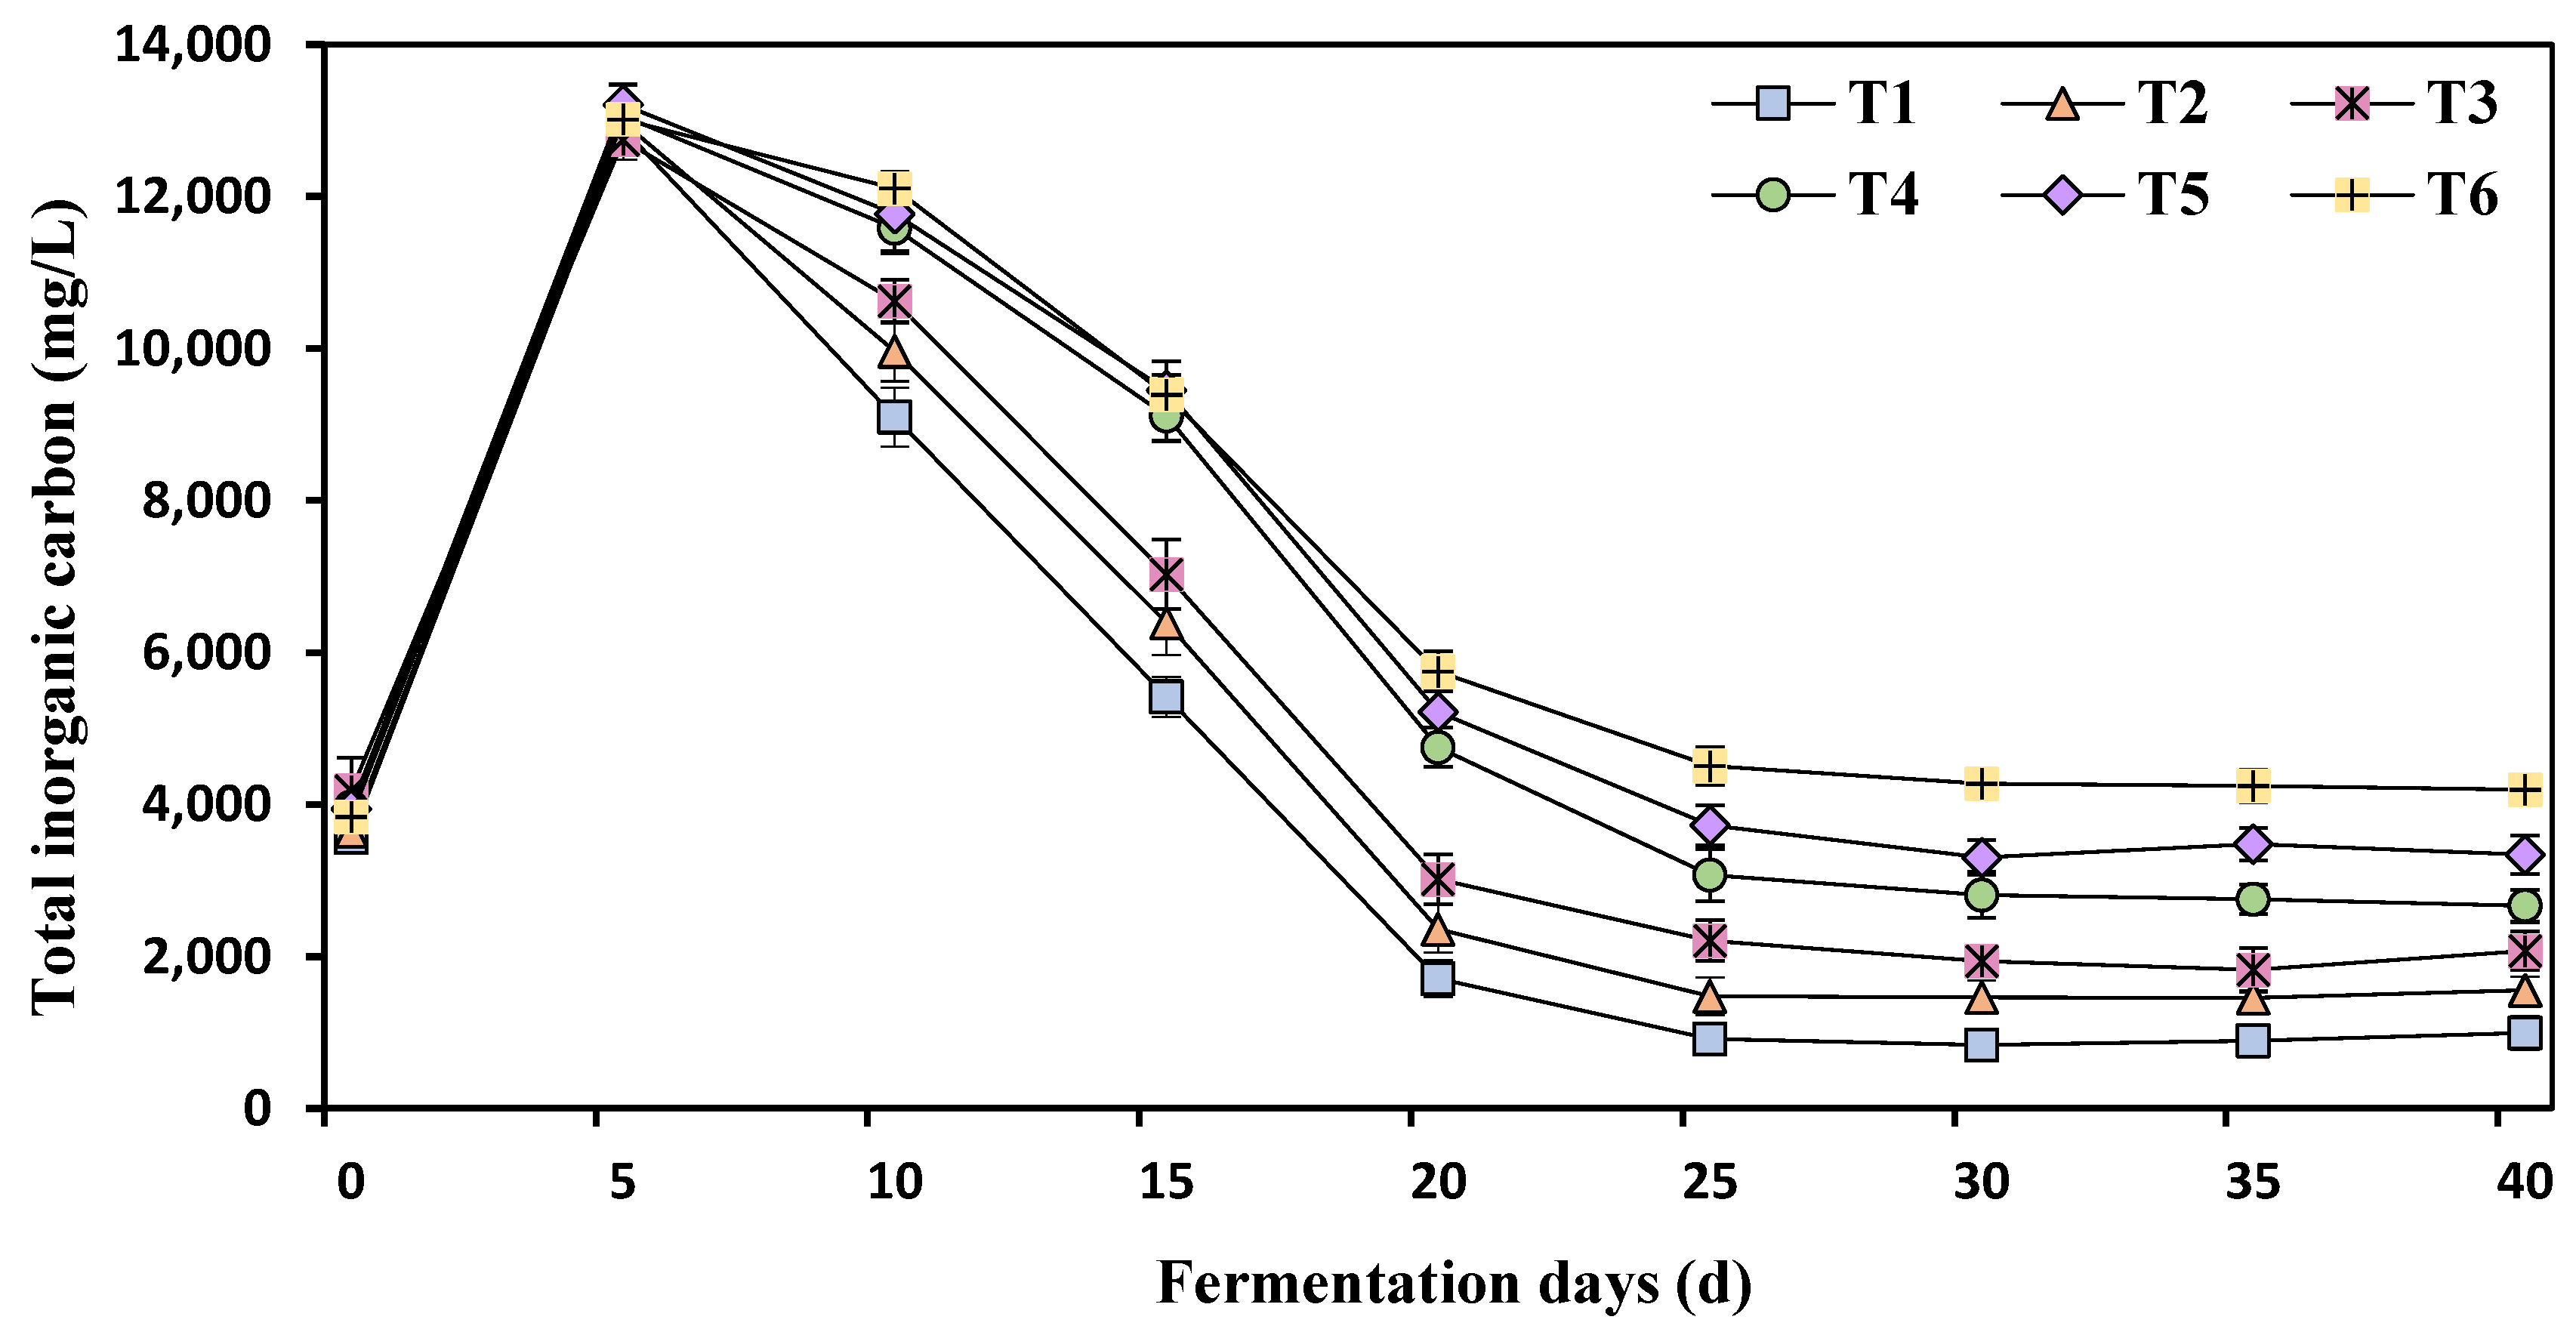
3.4. Effects of Different Ammonia Nitrogen Mass Concentrations on Total Inorganic Carbonate
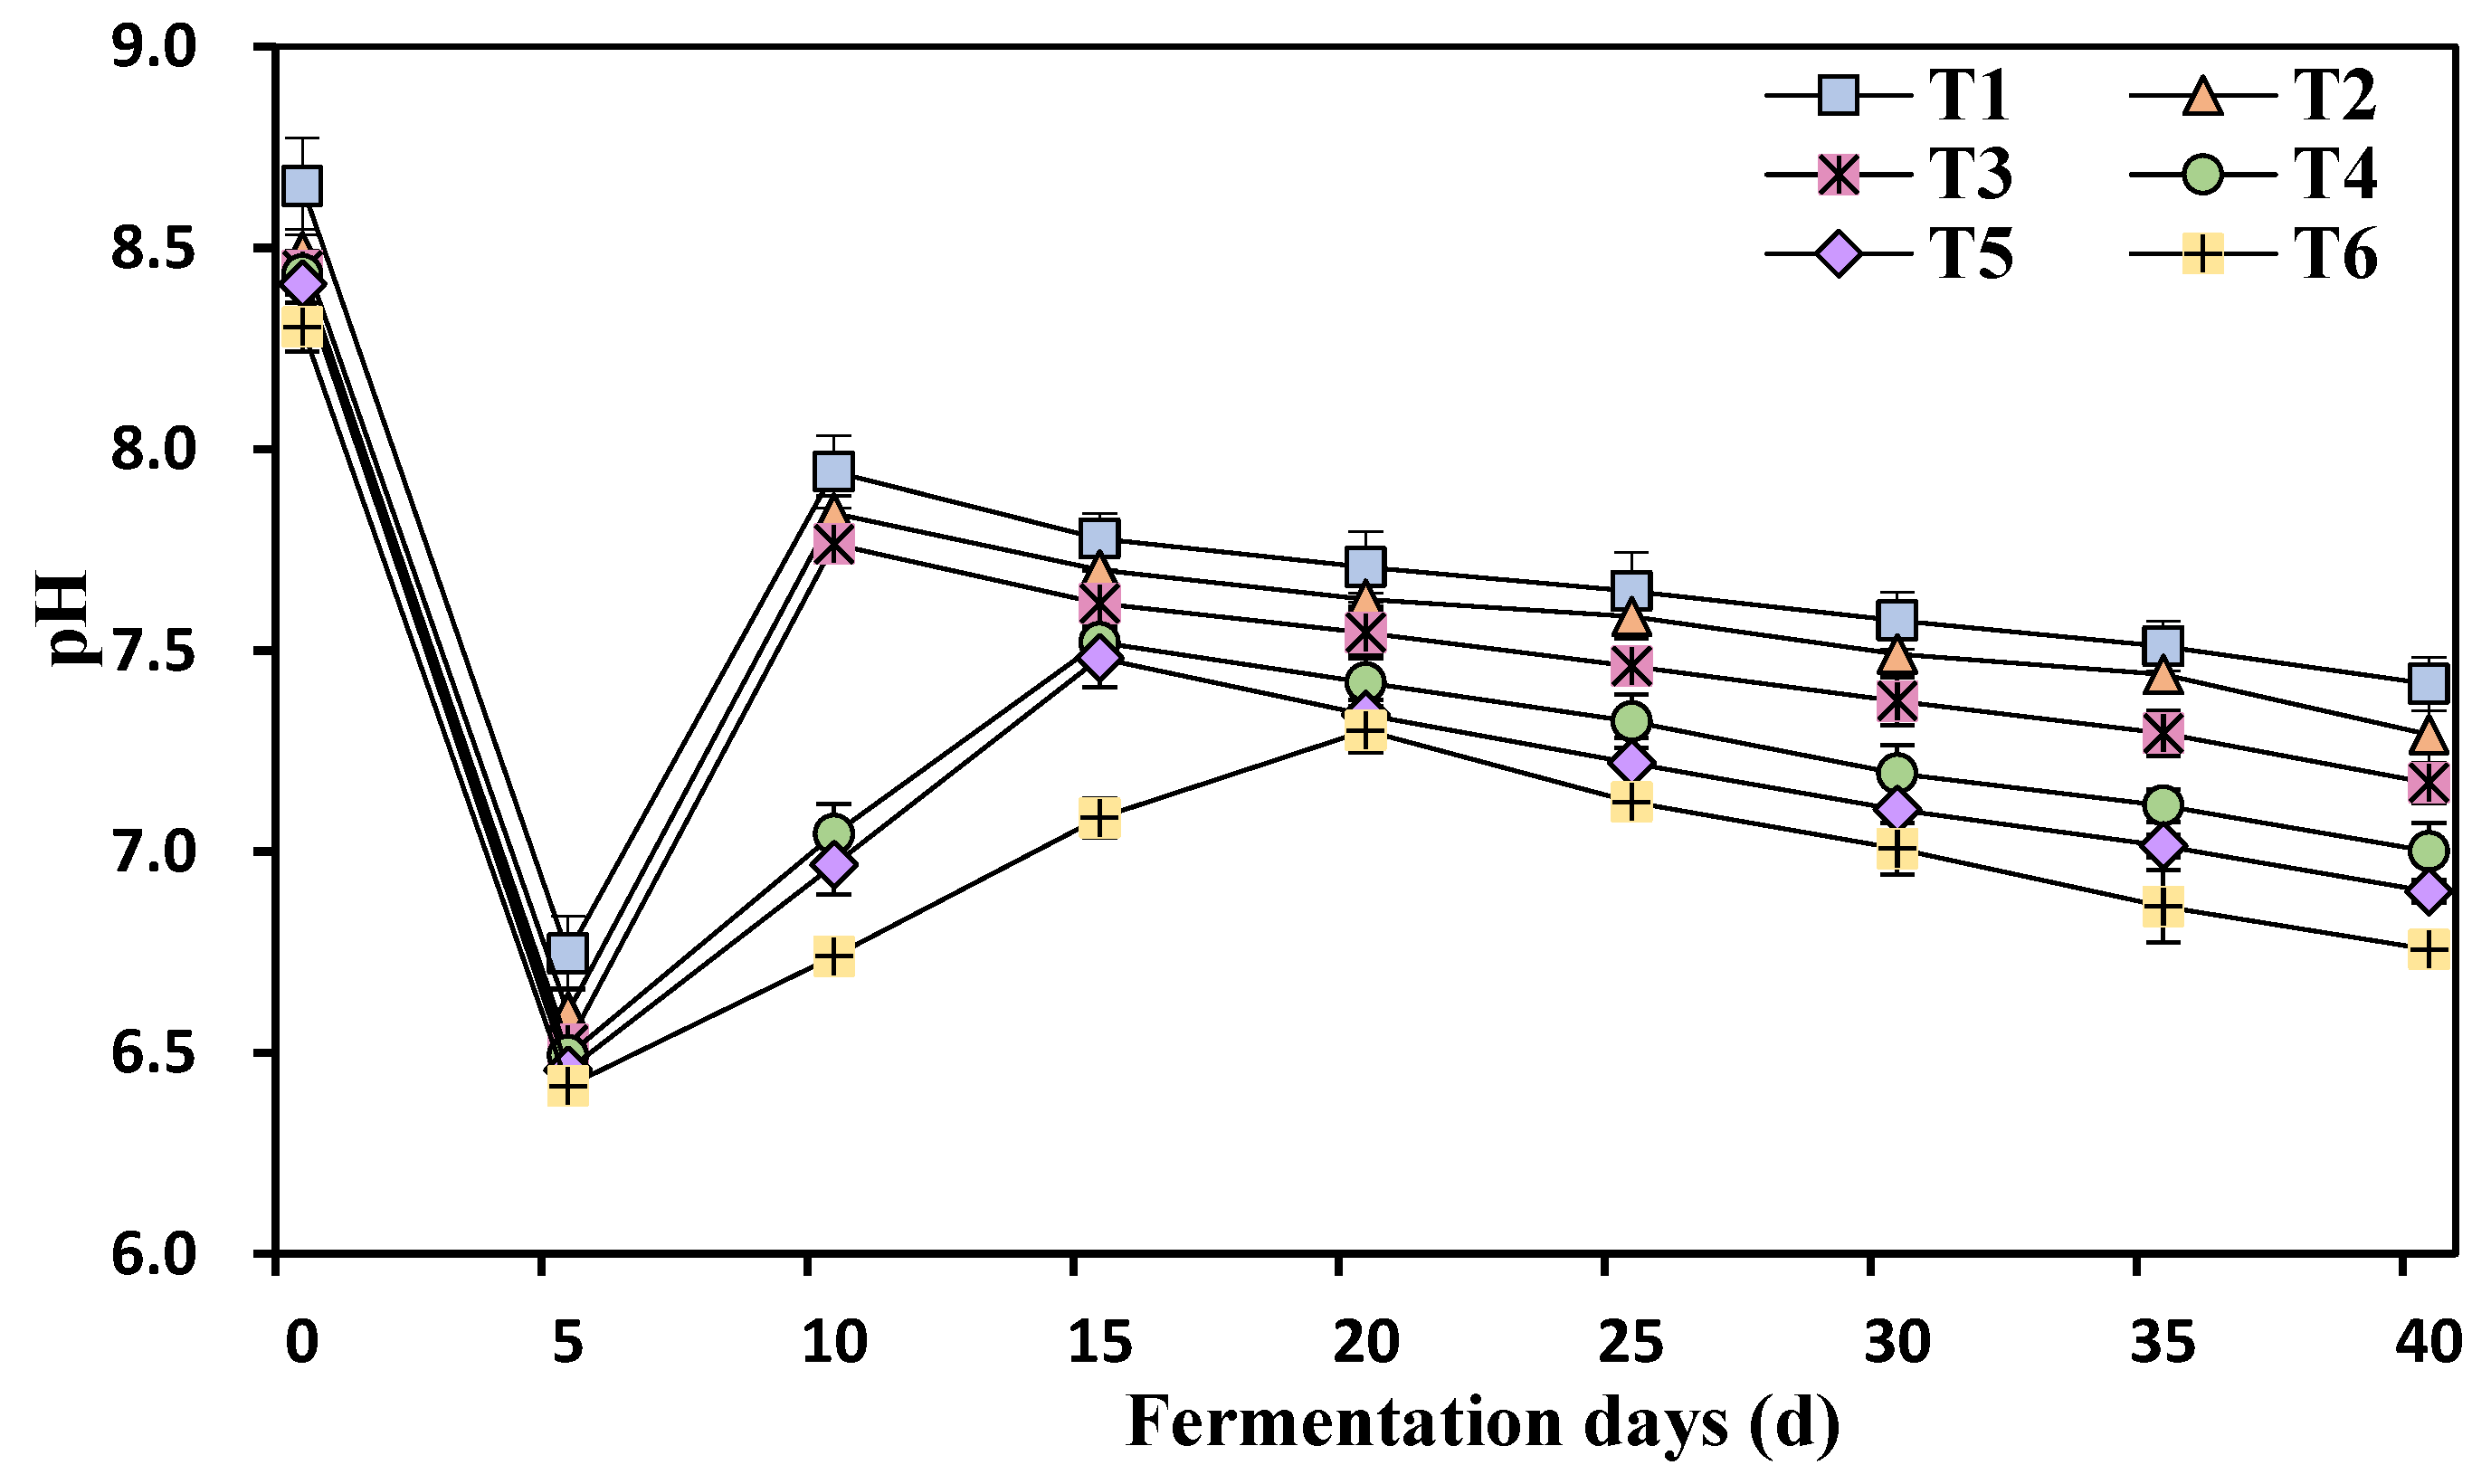
3.5. Kinetic Changes in the pH Values at Different Ammonia Nitrogen Concentrations
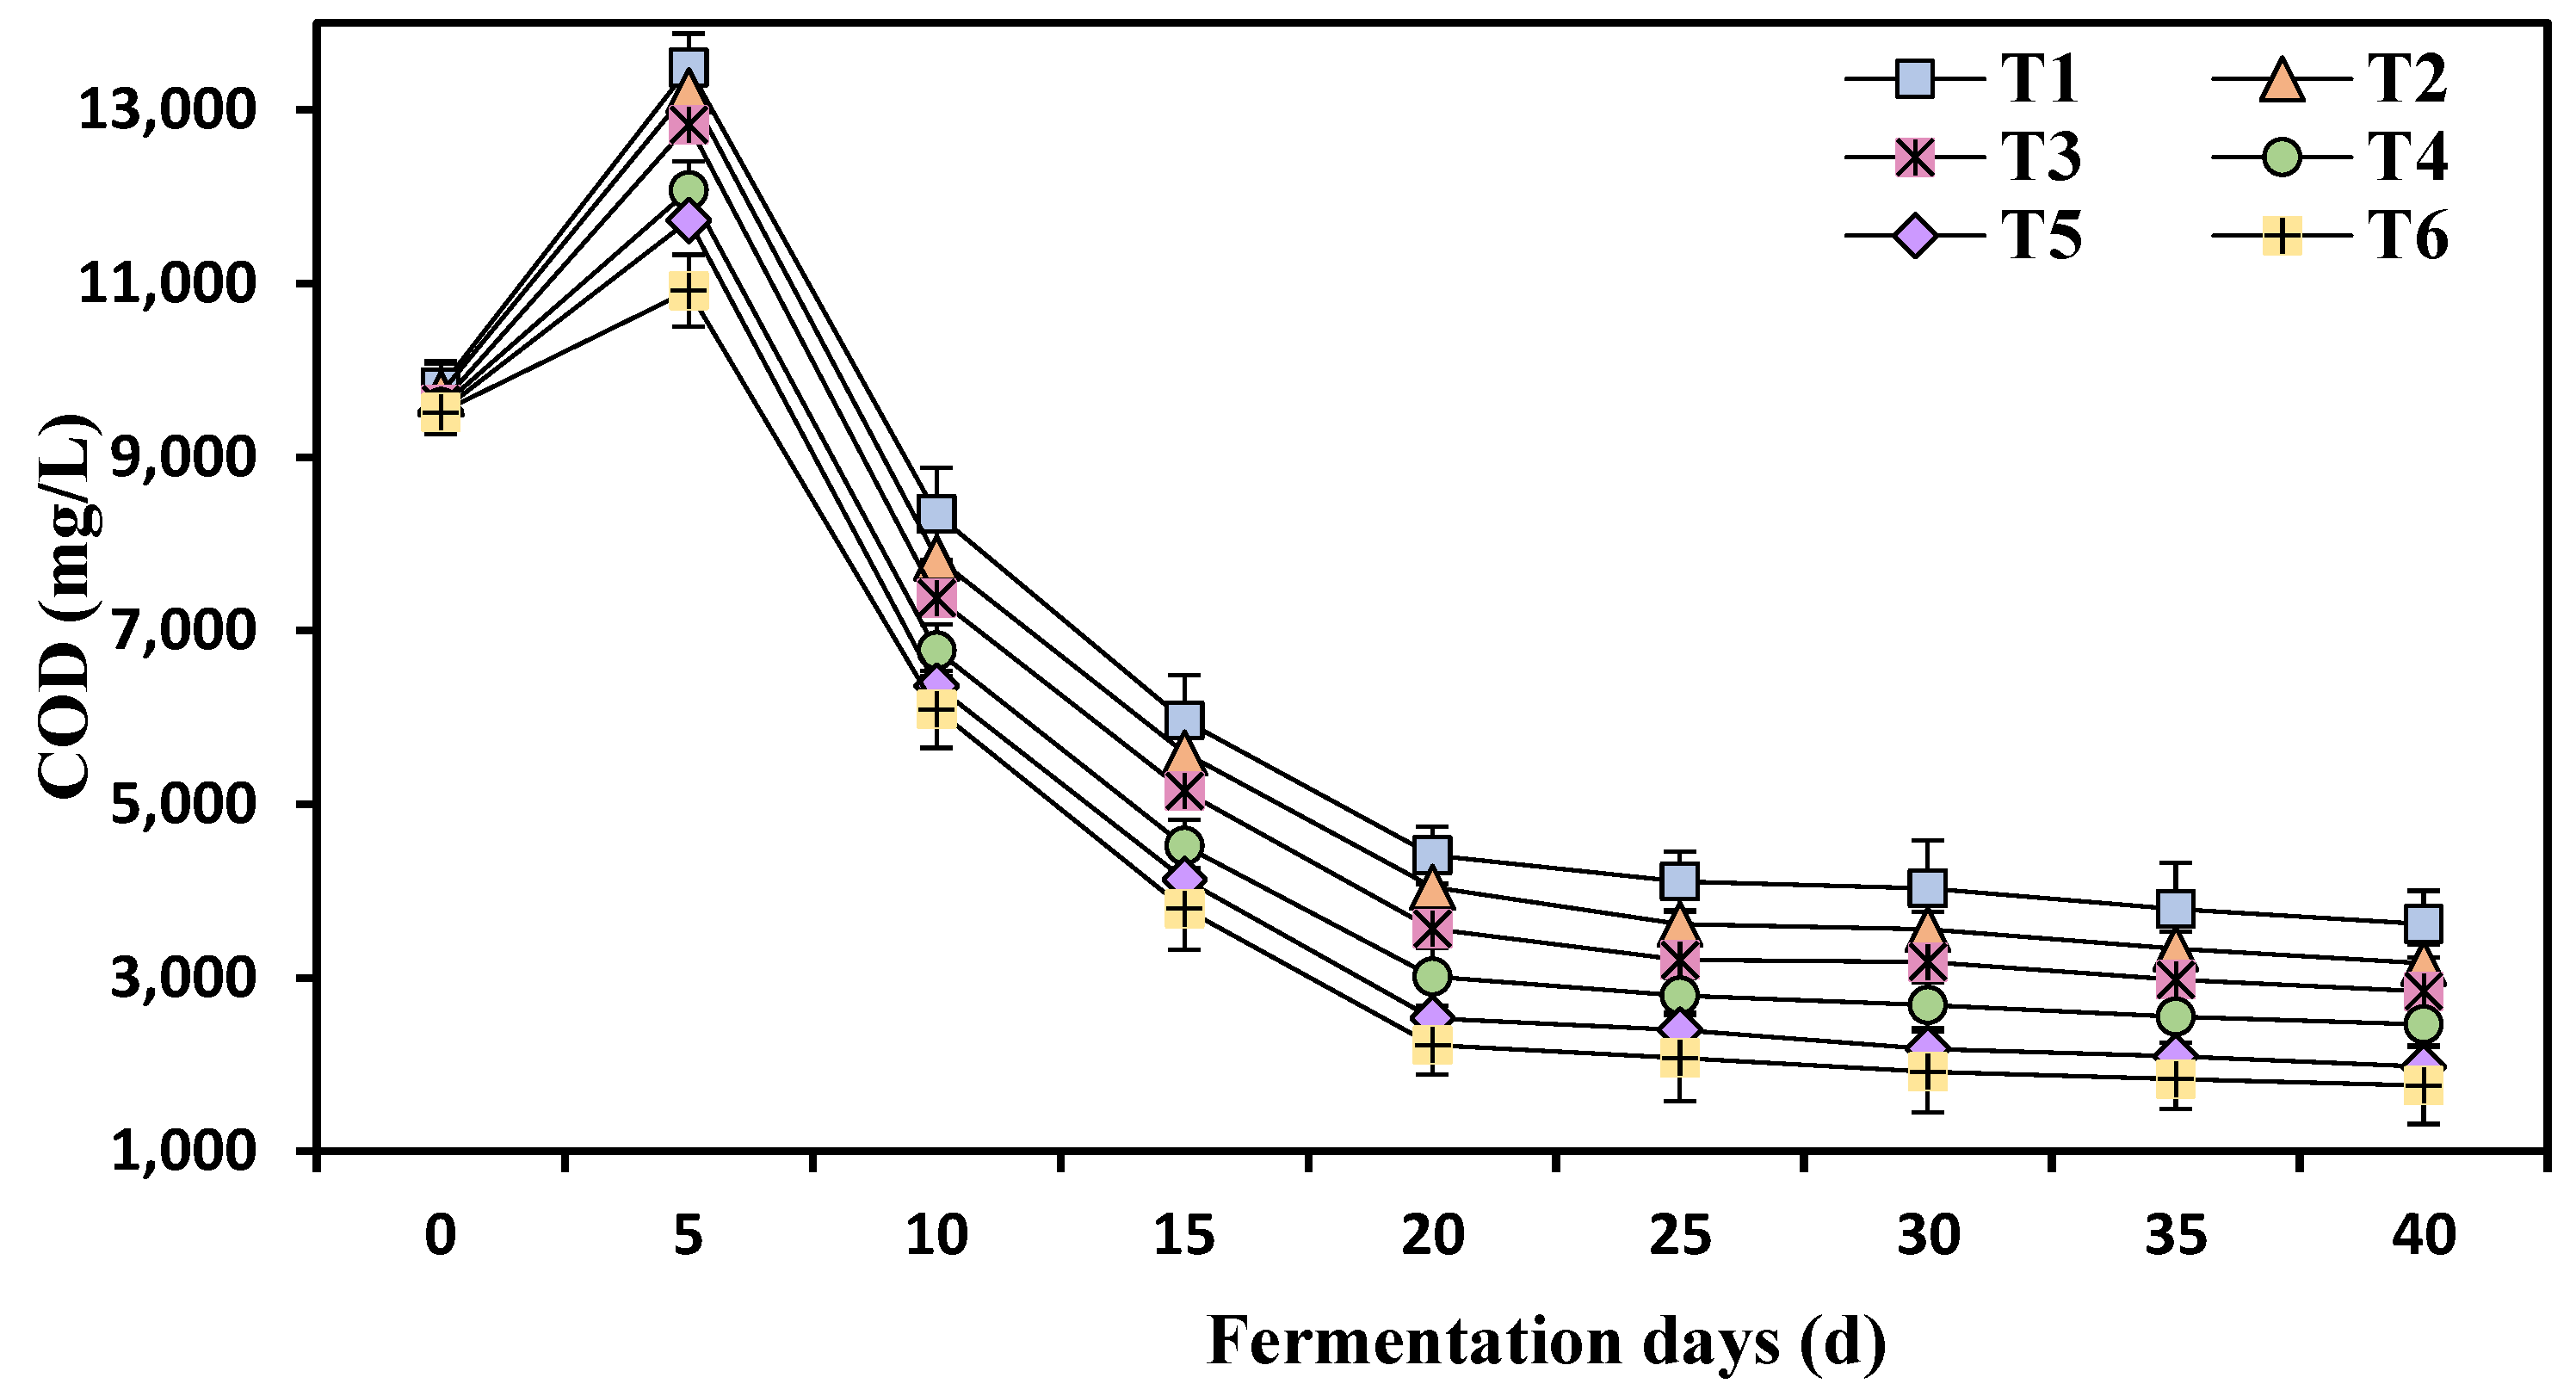
3.6. Effects of Different Ammonia Nitrogen Mass Concentrations on COD
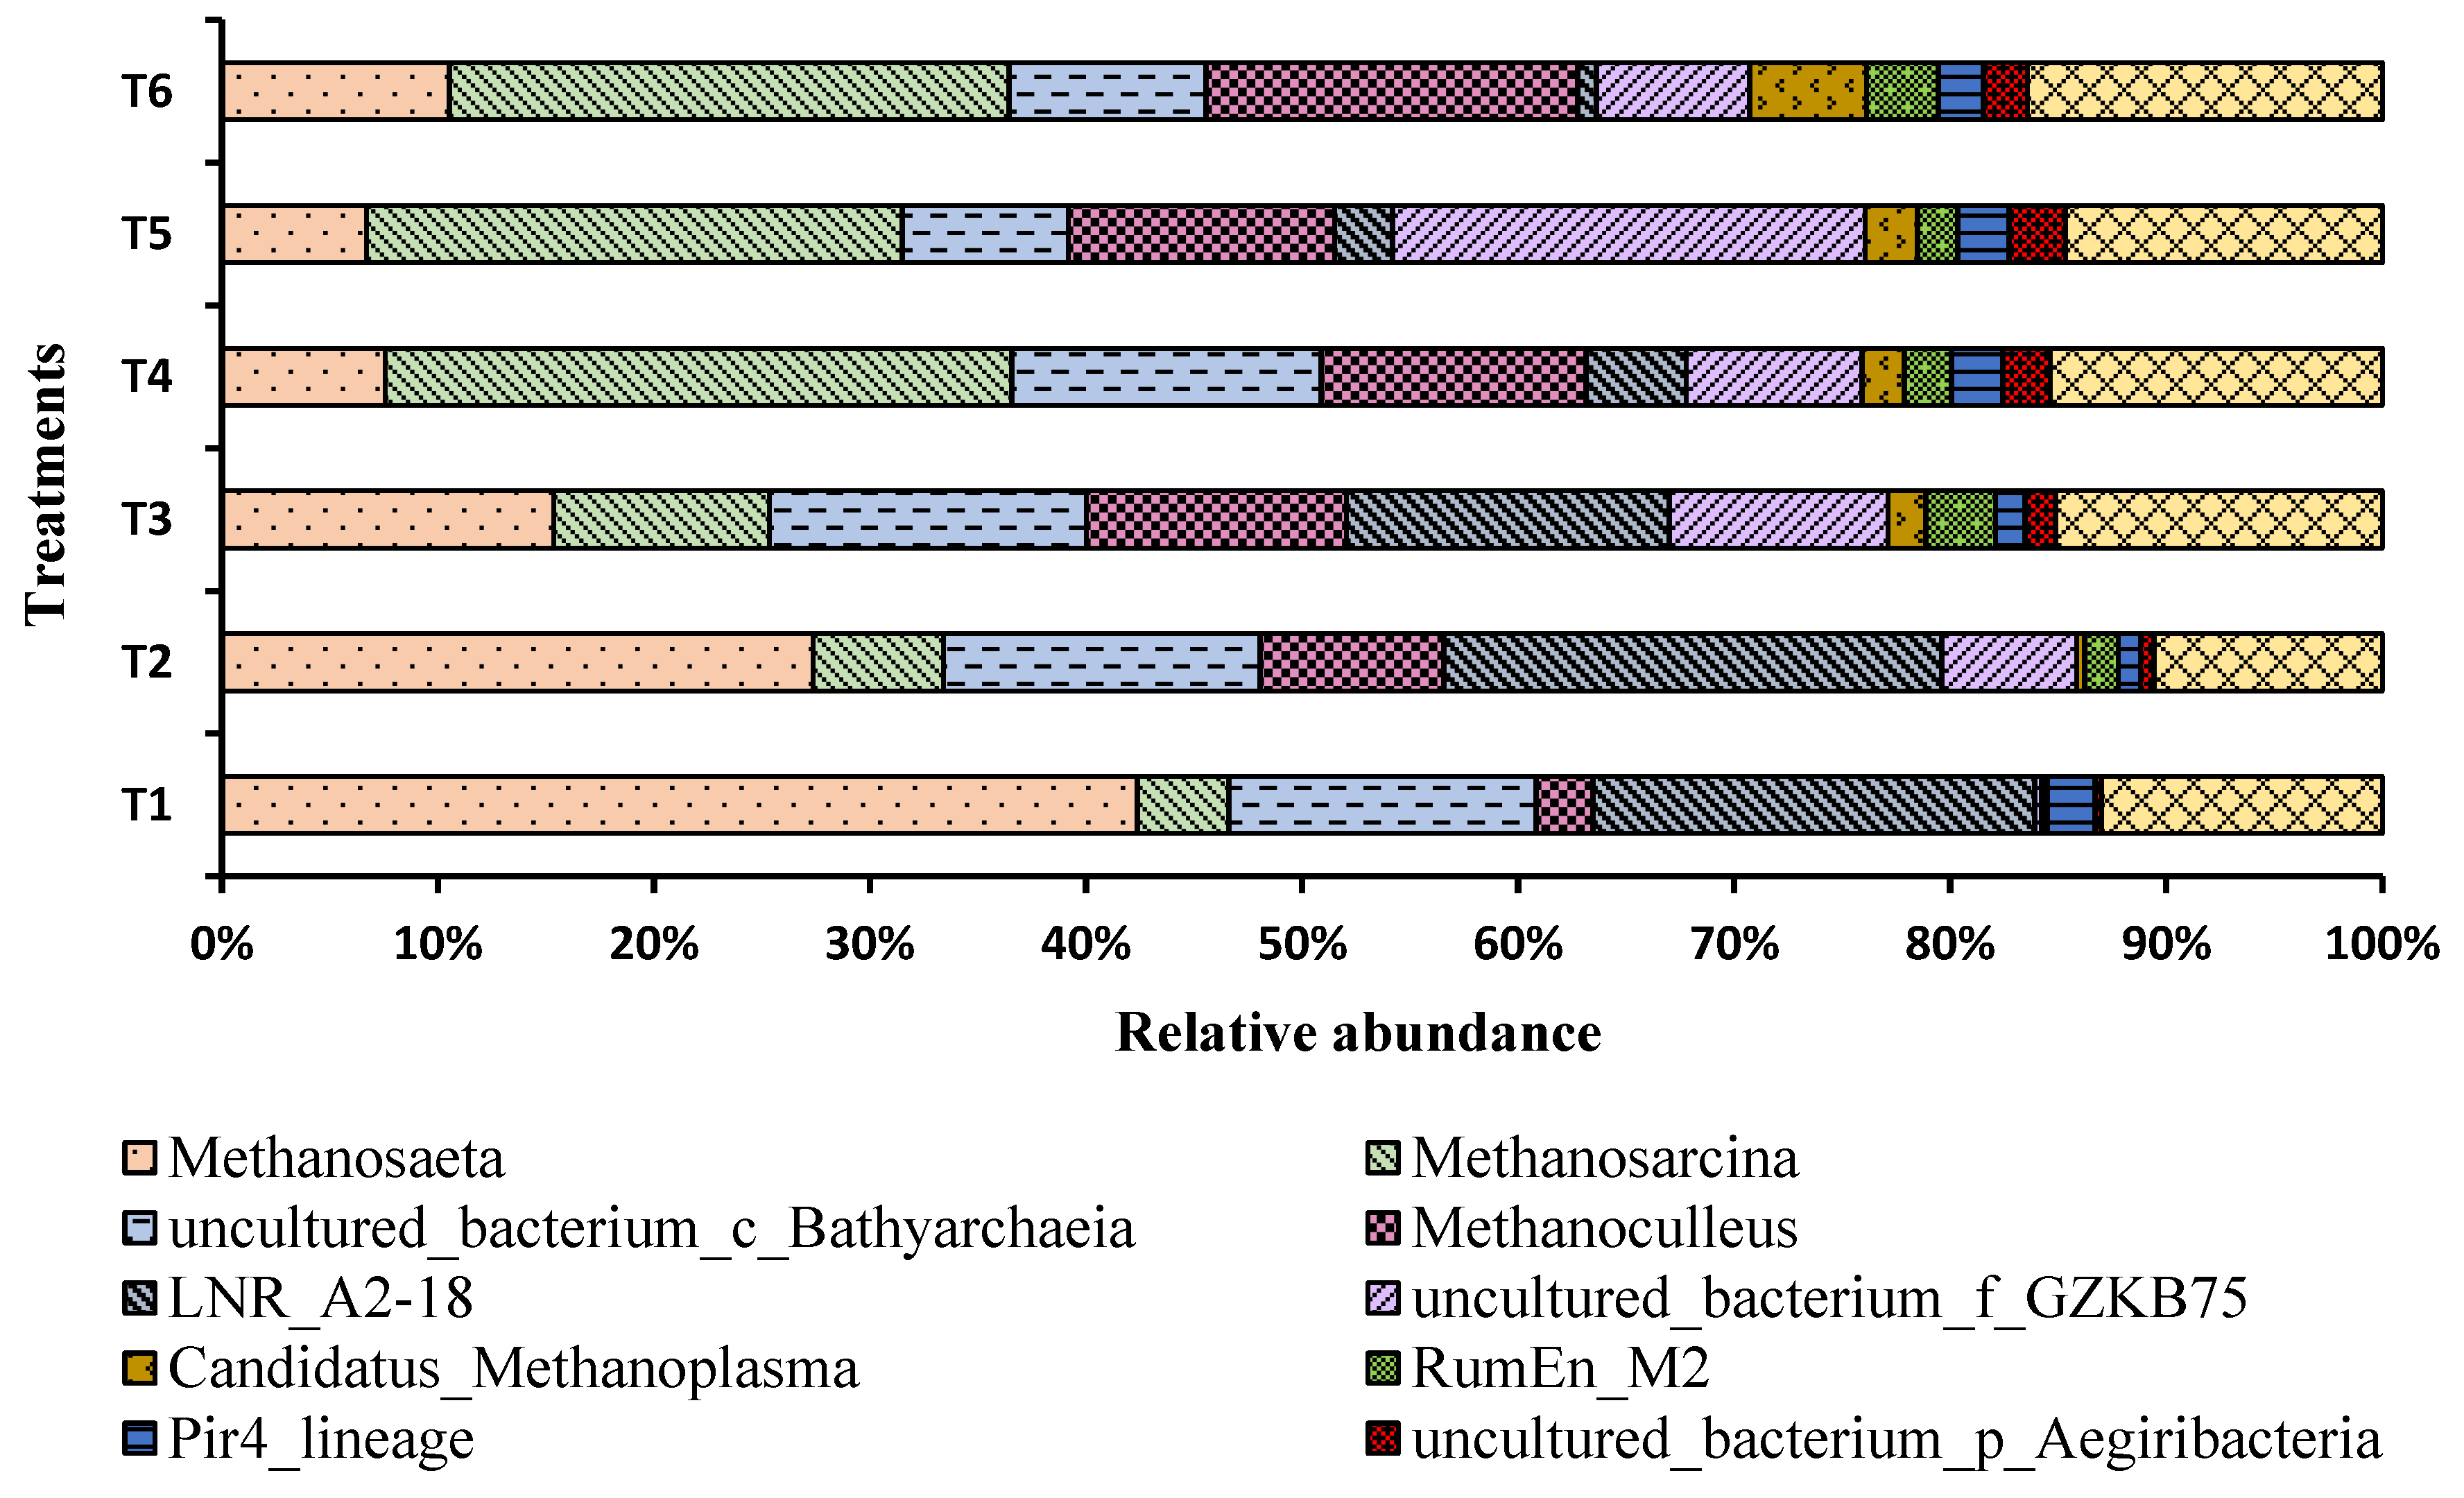
3.7. Variation in the Relative Abundance of Microbial Communities under Different Concentrations of Ammonia Nitrogen
4. Conclusions
Author Contributions
Funding
Data Availability Statement
Conflicts of Interest
References
- Kim, J.K.; Oh, B.R.; Chun, Y.N.; Kim, S.W. Effects of temperature and hydraulic retention time on anaerobic digestion of food waste. J. Biosci. Bioeng. 2006, 102, 328–332. [Google Scholar] [CrossRef] [PubMed]
- Arthurson, V. Closing the Global Energy and Nutrient Cycles through Application of Biogas Residue to Agricultural Land—Potential Benefits and Drawbacks. Energies 2009, 2, 226–242. [Google Scholar] [CrossRef]
- Enzmann, F.; Mayer, F.; Rother, M.; Holtmann, D. Methanogens: Biochemical background and biotechnological applications. Amb Express 2018, 8, 1. [Google Scholar] [PubMed]
- IEA. Outlook for Biogas and Biomethane: Prospects for Organic Growth; IEA: Paris, France, 2002; Available online: https://www.iea.org/reports/outlook-for-biogas-and-biomethane-prospects-for-organic-growth (accessed on 4 April 2023).
- Ulusoy, Y.; Ulukardesler, A.H.; Arslan, R.; Tekin, Y. Energy and emission benefits of chicken manure biogas production—A case study. Environ. Sci. Pollut. Res. Int. 2017, 28, 12351–12356. [Google Scholar] [CrossRef]
- Calbry-Muzyka, A.; Madi, H.; Rüsch-Pfund, F.; Gandiglio, M.; Biollaz, S. Biogas composition from agricultural sources and organic fraction of municipal solid waste. Renew. Energy 2022, 181, 1000–1007. [Google Scholar] [CrossRef]
- FAO. Global egg production from 1990 to 2021. In Statista. Available online: https://www.statista.com/statistics/263972/egg-production-worldwide-since-1990/ (accessed on 4 April 2023).
- Zhongming, Z.; Linong, L.; Xiaona, Y.; Wangqiang, Z.; Wei, L. Turning Chicken Poop and Weeds into Biofuel; ACS News Service Weekly PressPac: Verona, WI, USA, 2017. [Google Scholar]
- Bi, S.; Westerholm, M.; Qiao, W.; Xiong, L.; Mahdy, A.; Yin, D.; Song, Y.; Dong, R. Metabolic performance of anaerobic digestion of chicken manure under wet, high solid, and dry conditions. Bioresour. Technol. 2020, 296, 122342. [Google Scholar] [CrossRef]
- Yin, D.M.; Uwineza, C.; Sapmaz, T.; Mahboubi, A.; De Wever, H.; Qiao, W.; Taherzadeh, M.J. Volatile fatty acids (VFA) production and recovery from chicken manure using a high-solid anaerobic membrane bioreactor (AnMBR). Membranes 2022, 12, 1133. [Google Scholar] [CrossRef]
- Moestedt, J.; Müller, B.; Westerholm, M.; Schnürer, A. Ammonia threshold for inhibition of anaerobic digestion of thin stillage and the importance of organic loading rate. Microb. Biotechnol. 2016, 9, 180–194. [Google Scholar] [CrossRef]
- Chen, Y.; Jay, J.; Cheng, J.J.; Creamer, K.S. Inhibition of anaerobic digestion process: A review. Bioresour. Technol. 2008, 99, 4044–4064. [Google Scholar] [CrossRef]
- El Hadj, T.B.; Astals, S.; Galí, A.; Mace, S.; Mata-Álvarez, J. Ammonia influence in anaerobic digestion of OFMSW. Water Sci. Technol. 2009, 59, 1153–1158. [Google Scholar] [CrossRef]
- Duan, H.; He, P.; Zhang, H.; Shao, L.; Lü, F. Metabolic Regulation of Mesophilic Methanosarcina barkeri to Ammonium Inhibition. Environ. Sci. Technol. 2022, 56, 8897–8907. [Google Scholar] [CrossRef]
- Zhang, T.; Liu, L.; Song, Z.; Ren, G.; Feng, Y.; Han, X.; Yang, G. Biogas production by co-digestion of goat manure with three crop residues. PLoS ONE 2013, 8, e66845. [Google Scholar] [CrossRef]
- Li, Y.; Zhang, R.; Chen, C.; Liu, G.; He, Y.; Liu, X. Biogas production from co-digestion of corn stover and chicken manure under anaerobic wet, hemi-solid, and solid state conditions. Bioresour. Technol. 2013, 149, 406–412. [Google Scholar] [CrossRef] [PubMed]
- Lv, Z.; Feng, L.; Shao, L.; Kou, W.; Liu, P.; Gao, P.; Dong, X.; Yu, M.; Wang, J.; Zhang, D. The Effect of digested manure on biogas productivity and microstructure evolution of corn stalks in anaerobic co-fermentation. BioMed Res. Int. 2018, 2018, 5214369. [Google Scholar] [CrossRef]
- Sterling Jr, M.C.; Lacey, R.E.; Engler, C.R.; Ricke, S.C. Effects of ammonia nitrogen on H2 and CH4 production during anaerobic digestion of dairy cattle manure. Bioresour. Technol. 2001, 77, 9–18. [Google Scholar] [CrossRef] [PubMed]
- Schnürer, A.; Nordberg, Å. Ammonia, a selective agent for methane production by syntrophic acetate oxidation at mesophilic temperature. Water Sci. Technol. 2008, 57, 735–740. [Google Scholar] [CrossRef] [PubMed]
- Li, Y.; Zhang, Y.; Kong, X.; Li, L.; Yuan, Z.; Dong, R.; Sun, Y. Effects of ammonia on propionate degradation and microbial community in digesters using propionate as a sole carbon source. J. Chem. Technol. Biotechnol. 2017, 92, 2538–2545. [Google Scholar] [CrossRef]
- APHA. Standard Methods for the Examination of Water and Wastewater, 21st ed.; American Public Health Association and Water Environment Federation: Washington, DC, USA, 2005. [Google Scholar]
- HJ537–2009; Chinese Standard. Water Quality-Determination of Ammonia Nitrogen-Distillation-Neutralization Titration. Ministry of Environmental Protection of the People’s Republic of China: Beijing, China, 2009. Available online: https://www.chinesestandard.net/PDF/English.aspx/HJ537-2009 (accessed on 4 April 2023).
- GB/T11914-89; Chinese Standard. Water Quality-Determination of the Chemical Oxygen Demand Dichromate Method. Ministry of Environmental Protection of the People’s Republic of China: Beijing, China, 2017. Available online: https://www.chinesestandard.net/PDF/BOOK.aspx/GBT11914-1989 (accessed on 4 April 2023).
- Moody, L.B.; Burns, R.T.; Bishop, G.; Sell, S.T.; Spajic, R. Using biochemical methane potential assays to aid in co-substrate selection for co-digestion. Appl. Eng. Agric. 2011, 27, 433–439. [Google Scholar] [CrossRef]
- Meegoda, J.N.; Li, B.; Patel, K.; Wang, L.B. A review of the processes, parameters, and optimization of anaerobic digestion. Int. J. Environ. Res. Public Health 2018, 15, 2224. [Google Scholar] [CrossRef]
- Hobbs, S.R.; Landis, A.E.; Rittmann, B.E.; Young, M.N.; Parameswaran, P. Enhancing anaerobic digestion of food waste through biochemical methane potential assays at different substrate: Inoculum ratios. Waste Manag. 2018, 71, 612–617. [Google Scholar] [CrossRef]
- Tampio, E.A.; Lucia, B.; Vainio, M.M.; Kahala, M.M.; Rasi, S.E. Volatile fatty acids (VFAs) and methane from food waste and cow slurry: Comparison of biogas and VFA fermentation processes. GCB Bioenergy 2019, 11, 72–84. [Google Scholar] [CrossRef]
- Yin, D.M.; Westerholm, M.; Qiao, W.; Bi, S.J.; Wandera, S.M.; Fan, R.; Jiang, M.M.; Dong, R.J. An explanation of the methanogenic pathway for methane production in anaerobic digestion of nitrogen-rich materials under mesophilic and thermophilic conditions. Bioresour. Technol. 2018, 264, 42–50. [Google Scholar] [CrossRef] [PubMed]
- Bressani-Ribeiro, T.; Almeida, P.; Chernicharo, C.; Volcke, E. Inorganic carbon limitation during nitrogen conversions in sponge-bed trickling filters for mainstream treatment of anaerobic effluent. Water Res. 2021, 201, 117337. [Google Scholar] [CrossRef] [PubMed]
- Pham, V.H.T.; Ahn, J.; Kim, J.; Lee, S.; Lee, I.; Kim, S.; Chang, S.; Chung, W. Volatile Fatty Acid Production from Food Waste Leachate Using Enriched Bacterial Culture and Soil Bacteria as Co-Digester. Sustainability 2021, 13, 9606. [Google Scholar] [CrossRef]
- Harnadek, C.M.W.; Guilford, N.G.; Edwards, E.A. Chemical Oxygen Demand Analysis of Anaerobic Digester Contents. STEM Fellowsh. J. 2015, 1, 2–5. [Google Scholar] [CrossRef]
- Sossa, K.; Alarcón-Vivero, M.; Aspé, E.; Urrutia, H. Effect of ammonia on the methanogenic activity of methylaminotrophic methane producing Archaea enriched biofilm. Anaerobe 2004, 10, 13–18. [Google Scholar] [CrossRef]
- Karakashev, D.; Batstone, D.J.; Trably, E.; Angelidaki, I. Acetate Oxidation Is the Dominant Methanogenic Pathway from Acetate in the Absence of Methanosaetaceae. Appl. Environ. Microbiol. 2006, 72, 5138–5141. [Google Scholar] [CrossRef]
- de Vrieze, J.; Hennebel, T.; Boon, N.; Verstraete, W. Methanosarcina: The rediscovered methanogen for heavy duty biomethanation. Bioresour. Technol. 2012, 112, 1–9. [Google Scholar] [CrossRef]
- Ferry, J. Fermentation of Acetate. In Methanogenesis. Ecology, Physiology, Biochemistry and Genetics; Ferry, J.G., Ed.; Chapman and Hall: New York, NY, USA, 1993; pp. 305–334. [Google Scholar]
- Bassani, I.; Kougias, P.G.; Treu, L.; Angelidaki, I. Biogas upgrading via hydrogenotrophic methanogenesis in two-stage continuous stirred tank reactors at mesophilic and thermophilic conditions. Environ. Sci. Technol. 2015, 49, 12585–12593. [Google Scholar] [CrossRef]
- Yan, M.; Treu, L.; Zhu, X.; Tian, H.; Basile, A.; Fotidis, I.A.; Campanaro, S.; Angelidaki, I. Insights into ammonia adaptation and methanogenic precursor oxidation by genome-centric analysis. Environ. Sci. Technol. 2020, 54, 12568–12582. [Google Scholar] [CrossRef]
- Walker, A.W.; Duncan, S.H.; McWilliam Leitch, E.C.; Child, M.W.; Flint, H.J. pH and peptide supply can radically alter bacterial populations and short-chain fatty acid ratios within microbial communities from the human colon. Appl. Environ. Microbiol. 2005, 71, 3692–3700. [Google Scholar] [CrossRef] [PubMed]
- Esquivel-Elizondo, S.; Parameswaran, P.; Delgado, A.G.; Maldonado, J.; Rittmann, B.E.; Krajmalnik-Brown, R. Archaea and Bacteria Acclimate to High Total Ammonia in a Methanogenic Reactor Treating Swine Waste. Archaea 2016, 2016, 4089684. [Google Scholar] [CrossRef] [PubMed]
- Li, L.; He, Q.; Ma, Y.; Wang, X.; Peng, X. A mesophilic anaerobic digester for treating food waste: Process stability and microbial community analysis using pyrosequencing. Microb. Cell Factories 2016, 15, 65. [Google Scholar] [CrossRef] [PubMed]
- Mulat, D.G.; Jacobi, H.F.; Feilberg, A.; Adamsen, A.P.S.; Richnow, H.-H.; Nikolausz, M. Changing Feeding Regimes to Demonstrate Flexible Biogas Production: Effects on Process Performance, Microbial Community Structure, and Methanogenesis Pathways. Appl. Environ. Microbiol. 2016, 82, 438–449. [Google Scholar] [CrossRef] [PubMed]
- Romano, R.G.; Bendia, A.G.; Moreira, J.C.F.; Franco, D.C.; Signori, C.N.; Yu, T.; Wang, F.; Jovane, L.; Pellizari, V.H. Bathyarchaeia occurrence in rich methane sediments from a Brazilian ría. Estuar.Coast. Shelf Sci. 2021, 263, 07631. [Google Scholar] [CrossRef]
- Loh, H.Q.; Hervé, V.; Brune, A. Metabolic potential for reductive acetogenesis and a novel energy-converting [NiFe] hydrogenase in Bathyarchaeia from termite guts–a genome-centric analysis. Front. Microbiol. 2021, 11, 635786. [Google Scholar] [CrossRef]
- Hou, J.; Wang, Y.; Zhu, P.; Yang, N.; Liang, L.; Yu, T.; Niu, M.; Konhauser, K.; Wang, F. Taxonomic and carbon metabolic diversification of Bathyarchaeia during its co-evolution history with the early Earth surface environment. BioRxiv 2022. [Google Scholar] [CrossRef]
- Lang, K.; Schuldes, J.; Klingl, A.; Poehlein, A.; Daniel, R.; Brune, A. New mode of energy metabolism in the seventh order of methanogens as revealed by comparative genome analysis of “Candidatus Methanoplasma termitum”. Appl. Environ. Microbiol. 2015, 81, 1338–1352. [Google Scholar] [CrossRef]
- Pyzik, A.; Ciezkowska, M.; Krawczyk, P.S.; Sobczak, A.; Drewniak, L.; Dziembowski, A.; Lipinski, L. Comparative analysis of deep sequenced methanogenic communities: Identification of microorganisms responsible for methane production. Microb. Cell Factories 2018, 17, 197. [Google Scholar] [CrossRef]


| Test Raw Materials | Total Solids (%) | Volatile Solids (%) | Total Organic Carbon (%) | Total Nitrogen (%) | C/N (%) |
|---|---|---|---|---|---|
| Chicken manure | 45.11 | 15.64 | 30.77 | 2.013 | 15.28 |
| Corn straw | 90.45 | 84.70 | 40.81 | 0.791 | 51.56 |
| Inoculum | 5.40 | 3.20 | ND | ND | ND |
Disclaimer/Publisher’s Note: The statements, opinions and data contained in all publications are solely those of the individual author(s) and contributor(s) and not of MDPI and/or the editor(s). MDPI and/or the editor(s) disclaim responsibility for any injury to people or property resulting from any ideas, methods, instructions or products referred to in the content. |
© 2023 by the authors. Licensee MDPI, Basel, Switzerland. This article is an open access article distributed under the terms and conditions of the Creative Commons Attribution (CC BY) license (https://creativecommons.org/licenses/by/4.0/).
Share and Cite
Li, Y.; Zhu, J.; Tang, Y.; Shi, X.; Anwar, S.; Wang, J.; Gao, L.; Zhang, J. Impact of Varying Mass Concentrations of Ammonia Nitrogen on Biogas Production and System Stability of Anaerobic Fermentation. Agriculture 2023, 13, 1645. https://doi.org/10.3390/agriculture13081645
Li Y, Zhu J, Tang Y, Shi X, Anwar S, Wang J, Gao L, Zhang J. Impact of Varying Mass Concentrations of Ammonia Nitrogen on Biogas Production and System Stability of Anaerobic Fermentation. Agriculture. 2023; 13(8):1645. https://doi.org/10.3390/agriculture13081645
Chicago/Turabian StyleLi, Yongping, Jiaoning Zhu, Yun Tang, Xiangyuan Shi, Sumera Anwar, Juanling Wang, Li Gao, and Jingxuan Zhang. 2023. "Impact of Varying Mass Concentrations of Ammonia Nitrogen on Biogas Production and System Stability of Anaerobic Fermentation" Agriculture 13, no. 8: 1645. https://doi.org/10.3390/agriculture13081645
APA StyleLi, Y., Zhu, J., Tang, Y., Shi, X., Anwar, S., Wang, J., Gao, L., & Zhang, J. (2023). Impact of Varying Mass Concentrations of Ammonia Nitrogen on Biogas Production and System Stability of Anaerobic Fermentation. Agriculture, 13(8), 1645. https://doi.org/10.3390/agriculture13081645