Article

Spatial Pattern and Influencing Factors of Agricultural Leading Enterprises in Heilongjiang Province, China

1
State Key Laboratory of Black Soils Conservation and Utilization, Northeast Institute of Geography and Agroecology, Chinese Academy of Sciences, Changchun 130102, China
2
College of Resources and Environment, University of Chinese Academy of Sciences, Beijing 100049, China
*
Author to whom correspondence should be addressed.
Agriculture 2023, 13(11), 2061; https://doi.org/10.3390/agriculture13112061
Submission received: 20 September 2023 / Revised: 22 October 2023 / Accepted: 24 October 2023 / Published: 27 October 2023
(This article belongs to the Section Agricultural Economics, Policies and Rural Management)

Abstract

:
As one of the major new agricultural business entities, agricultural leading enterprises (ALEs) are responsible for ensuring national food security, leading agricultural and rural modernization, and increasing farmers’ employment prospects and incomes. From the perspective of headquarters and branches, this study used a point pattern analysis, the local Moran’s index, the rank-size rule, and the geographical detector to depict the spatial pattern of ALEs in Heilongjiang Province, detect influencing factors, and reveal the spatial layout mechanism. The main conclusions are as follows. (1) ALE headquarters and branches in Heilongjiang Province had different location requirements, and their layout orientation, clustering areas, and influencing factors were different. (2) The headquarters displayed a pronounced urban and agglomeration orientation, while branches exhibited a significant farm dependence and raw material orientation. (3) Both the headquarters and the branches showed a significant trend towards spatial clustering. The headquarters were mainly in the Harbin municipal district and surrounding counties, including Wuchang, Zhaodong, and Beilin, which showed a high–high cluster pattern. The branches were mainly in the Sanjiang Plain. Tongjiang, Fujin, Hulin, Mishan, Raohe, Baoqing, and Suibin showed a high–high cluster pattern, while the Harbin municipal district and Bei’an showed a high–low outlier pattern. (4) The ALEs’ regional connection network in Heilongjiang Province was radially distributed with the Harbin municipal district as the centre. The agricultural reclamation system deeply influenced it. (5) The number of supporting enterprises, number of permanent residents, gross domestic product, railway mileage, number of people with Bachelor’s degrees or above, and distance from the provincial capital were the main influencing factors of the headquarters spatial pattern in Heilongjiang Province. The number of state farms in Heilongjiang Province, the per capita grain yield, highway mileage, and distance from the provincial capital were the main influencing factors of the branch spatial patterns in Heilongjiang Province. The interaction results indicated that the explanatory power of two-factor interaction was stronger than that of a single factor regardless of headquarters or branches, and most interaction types were bilinear enhancements. This study aims to provide a decision-making reference for the long-term development of ALEs in Heilongjiang Province at the present stage and accelerate the development of agricultural industrialization in major grain-producing areas.

1. Introduction

As a new type of agricultural business entity, agricultural leading enterprises (ALEs) play an irreplaceable role in building a modern agricultural industrial system, driving farmers’ employment and income growth, and accelerating the implementation of the rural revitalization strategy, etc., due to their large scale, strong competitiveness, and high correlation. The quantity and quality of ALEs in a region largely reflect the level of agricultural development in the region. Therefore, strengthening the research on the spatial pattern and influencing factors of ALEs is not only an important academic proposition but also an urgent need in reality.
The theory of enterprise layout has a long history, but there is relatively little discussion on the spatial layout of ALEs. In geography, the study of the choice of enterprise location can be traced back to classic location theory, which holds that enterprises should be placed to minimize cost or maximize profit [1]. In the late 1960s, behavioural school theory incorporated the individual behavioural differences of decision makers into firm location decisions [2]. Since the 1980s, the institutional school of thought has emphasized the influence of institutional and sociocultural factors on the spatial behaviour of businesses [3]. Given the development of corporate geography, enterprises’ spatial pattern and influencing factors have gradually become a research hotspot [4]. Related research has focused on analysing the macro pattern and spatiotemporal evolution characteristics of a certain type of enterprise while identifying factors that affect the selection of enterprise locations [5]. Although there have been abundant achievements on agricultural enterprises in various aspects, such as the planting industry [6], animal husbandry [7], fishery [8], and the agricultural product processing industry [9], studies on ALEs are relatively scarce. Research on ALEs has focused on topics such as operational models [10], development characteristics [11], production efficiency [12], social effects [13], and competitive advantages [14] and has paid less attention to spatial patterns and influencing factors.
With the development of agricultural industrialization, more and more attention has been paid to the spatial pattern and influencing factors of ALEs. In terms of spatial patterns, scholars have found a spatial correlation in the layout of agricultural enterprises [15,16,17] and have confirmed that they are mainly distributed in an agglomeration pattern at the national, provincial, and urban levels. At the national level, China’s ALEs exhibit a dense layout in the east and a sparse layout in the west, with obvious regional differences that are gradually expanding [18,19]. At the provincial level, ALEs are concentrated in provincial capital cities or core cities rather than in areas with intensive grain cultivation [20,21]. At the municipal level, ALEs are distributed in multiple clusters along core urban areas and economic growth zones [22]. In terms of influencing factors, although the specific choices of scholars are slightly different, they are mostly concentrated in the fields of natural resources and the social economy. In the natural resources field, agricultural enterprises’ resource development capacity is limited by local agricultural resource conditions. Rich agricultural resources can increase enterprises’ competitiveness [23]. In the field of the social economy, the development of agricultural enterprises requires a certain economic environment [24] and market space [25] and is greatly influenced by factors such as technology [26], finance [27], transportation [28], policies [29], and labour [30,31].
As the largest major grain-producing area in China, Heilongjiang Province occupies an important position in agriculture, especially in grain production. It cannot be ignored that the Heilongjiang reclamation area have played an important role. The agricultural reclamation system is a product of China’s specific historical period and has maintained the characteristics of the planned economic system for a long time. During its operation, the agricultural reclamation system has encountered a series of problems, such as a lack of a clear line between the functions of the government and enterprises, extensive management, having a single structure, and a lack of vitality. It is an irresistible trend to promote the reform of state-owned farms to enterprises. Due to the transformation of Heilongjiang Province Farms and Land Reclamation Administration into an agricultural reclamation enterprise group in 2020, the development layout of ALEs in Heilongjiang Province has undergone significant changes. Using Heilongjiang Province as an example to explore the spatial pattern and influencing factors of ALEs in 2020 is of great significance for cultivating, developing, and optimizing local ALEs. In addition, ALEs often have a large production scale and a differentiated organizational management structure, which leads to the emergence of different corporate components. These corporate components can generally be divided into headquarters and branches. Headquarters and branches undertake different functions and have different location requirements [32]. On this basis, this study used the headquarters and branches of ALEs in Heilongjiang Province as its research object and comprehensively applied a point pattern analysis, the local Moran’s index, the rank-size rule, the geographical detector, and other methods to analyse the province’s spatial pattern and influencing factors. The innovation of this study lies in its (1) discussion of the differences in the spatial patterns and influencing factors between ALE headquarters and branches in Heilongjiang Province based on the county scale; (2) depiction of the areal connections between headquarters and branches of ALEs in Heilongjiang Province; (3) inclusion of the factors of agricultural agglomeration and agricultural reclamation in the influencing factor analysis of ALEs’ spatial pattern in Heilongjiang Province; and (4) analysis of the spatial layout mechanism of ALEs in Heilongjiang Province. In the past, Heilongjiang Province ranked first in grain production in China, but its agricultural industrialization development was relatively lagging behind, and there were few ALEs that were popular and had a strong influence at home and abroad. This phenomenon is common in China’s major grain-producing areas. This paper aims to enrich the research results of ALEs, provide a decision-making reference for the long-term development of ALEs in Heilongjiang Province at this stage, offer practical experience for the spatial optimization of ALEs in other major grain-producing areas, and accelerate the development of agricultural industrialization in major grain-producing areas.

2. Materials and Methods
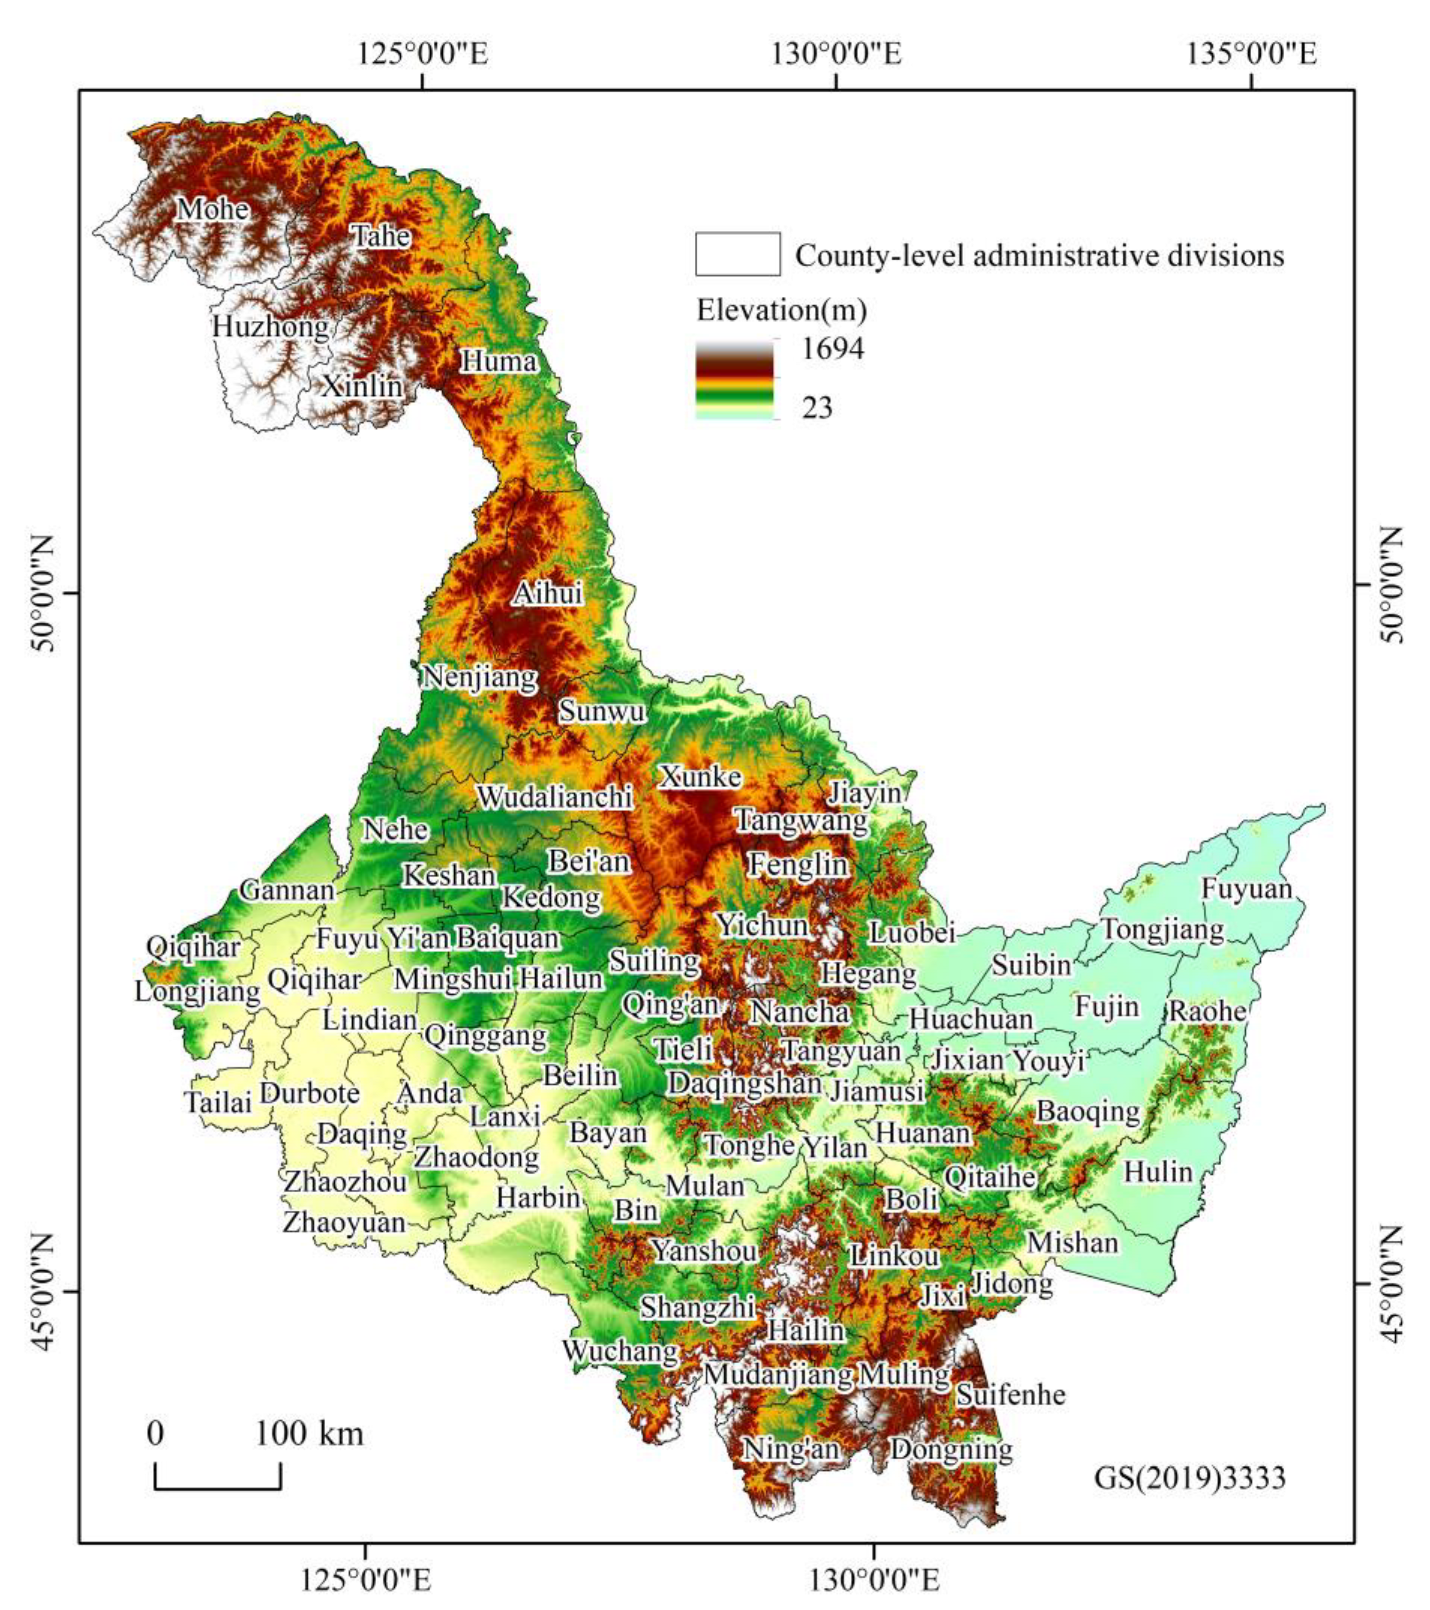
2.1. Study Area

Heilongjiang Province is in the northeast region of China and has a flat terrain, a wide distribution of black soil with thick tillage layer, abundant water resources, and a favourable ecological environment (Figure 1). Numerous advantageous conditions have made Heilongjiang Province the largest major grain-producing area in China. Using 2022 as an example, the grain yield and sown area of Heilongjiang Province are 77.631 million tons and 14.68 million hm2, respectively, both of which rank first in China. In addition, Heilongjiang Province has the largest and most mechanized state-owned land reclamation enterprise group in China. The Heilongjiang Province Farms and Land Reclamation Administration was restructured into an agricultural reclamation enterprise group in 2020, which greatly promoted the development of ALEs in Heilongjiang Province. Heilongjiang Province has formed some powerful ALEs, such as the Beidahuang Group, Jiusan Group, and Wandashan Dairy.

2.2. Data and Processing

2.2.1. Agricultural Leading Enterprise Data

As announced by the Department of Agriculture and Rural Affairs of Heilongjiang Province [33], the top 100 agricultural industrialization enterprises in Heilongjiang Province in 2020 were selected as sample data. These enterprises have high revenues, a wide range of business operations, and diverse ownership structures, which strongly represent the development status of ALEs in Heilongjiang Province. In addition, the announcement also includes the operating income of each enterprise. The address information of the headquarters and subordinate branches of each company were obtained through the Qichacha website (https://www.qcc.com/, (accessed on 18 April 2023)). Then, they were converted into geographic coordinates using the geocoding service of the Baidu Map Open Platform (https://lbsyun.baidu.com/, (accessed on 23 April 2023)). Enterprise headquarters are the headquarters of the top 100 agricultural industrialization enterprises in Heilongjiang Province in 2020, with a total of 100 locations. Enterprise branches refer to 150 branches established by the top 100 enterprises before 1 January 2021 and operating normally within Heilongjiang Province (Figure 2).

2.2.2. Administrative Division Data

The administrative division data of Heilongjiang Province were sourced from the basic geographic information database maintained by the Ministry of Natural Resources of China (https://www.webmap.cn/, (accessed on 18 April 2023)). To maintain consistency in the temporal dimension of the data, the municipal districts of each prefecture-level city in Heilongjiang Province were integrated and subsequently adjusted to the 2020 county-level administrative boundaries. This study involved 81 counties in Heilongjiang Province.

2.2.3. Socioeconomic Data

The socioeconomic data of counties in Heilongjiang Province were derived from the Heilongjiang Statistical Yearbook, Statistical Yearbook of Heilongjiang State Farms, Tabulation on 2020 China Population Census by County, statistical yearbooks of cities, national economic and social development statistical bulletins issued by county governments, and some government and enterprise websites, such as the Ministry of Natural Resources of China, Qichacha and Baidu Map.

2.3. Methods

2.3.1. Point Pattern Analysis

Point pattern analysis refers to a set of methods used for analysing the distribution patterns of geographic entities or events based on their spatial locations, which can be implemented in ArcGIS 10.2. Using headquarters and branches of ALEs in Heilongjiang Province as research objects, this study adopts the nearest neighbour index to determine the clustering relationships of their spatial patterns and the kernel density estimation to describe the distribution trends of their spatial patterns.
The nearest neighbour index was first introduced by Clark and Evans [34] and later applied in spatial pattern analysis by King [35]. This method assesses the agglomeration or dispersion relationship of ALEs’ layout by comparing the average distance between the actual nearest enterprises with the average distance between the closest enterprises in a random distribution pattern. The calculation formula is as follows [36]:
R = R i / R e = 2 i = 1 n d i n n A
where R is the nearest neighbour index; Ri is the actual nearest neighbour distance; Re is the theoretical nearest neighbour distance in a random pattern; di is the actual distance between enterprise i and its nearest neighbour enterprise; n is the number of ALEs; and A is the area of Heilongjiang Province. The results of the nearest neighbour index can be divided into three types: if R < 1, then the enterprises tend to be clustered; if R = 1, then the enterprises are randomly distributed; and if R > 1, then the enterprises tend to be dispersed.
Kernel density estimation, which was proposed by Rosenblatt [37] and later extended by Parzen [38], is commonly used for identifying hotspots in geographic space. The main idea is to interpolate each spatial point in Heilongjiang Province based on the spatial points of ALEs, establish a smoothed search area based on mathematical methods, allocate weights gradually decreasing from the central point to the outer part, and finally generate a spatially varying map. The calculation formula is as follows:
F ( x ) = 1 n h i = 1 n K ( x x i h )
where F(x) is the kernel density estimation value at the estimation point x; K(*) is the kernel function; xxi is the distance from the estimation point x to xi; h is the bandwidth, which is set to 45 km; and n is the number of ALEs within the bandwidth range. The results of the kernel density estimation are continuous. Higher values indicate a denser distribution of ALEs in Heilongjiang Province, while lower values indicate a sparser distribution.

2.3.2. Local Moran’s Index

The local Moran’s index assesses the spatial autocorrelation of the layout of ALEs in Heilongjiang Province at the regional level and identifies potential spatial clustering patterns that may exist in different regions [39,40], which can be implemented in ArcGIS 10.2. The calculation formula is as follows:
I i = ( y i y ¯ ) S 2 j = 1 , j i n w i j ( y j y ¯ )
where Ii is the local Moran’s index for county i; yi and yj are the number of ALEs in county i and county j, respectively; y ¯ and S are the average value and standard deviation of the number of ALEs in each county in Heilongjiang Province, respectively; wij is the spatial weight matrix; and n is the number of counties in Heilongjiang Province. The statistical test for Ii is as follows:
Z ( I i ) = I i E ( I i ) V a r ( I i )
where Z(Ii) is the standardized statistical value of Ii. The results of the local Moran index are divided into four types: high–high cluster, low–low cluster, high–low outlier, and low–high outlier. Note that a high–high cluster is a high-clustering region surrounded by a high-clustering region, and a low–low cluster is a low-clustering region surrounded by a low-clustering region. Both show a positive correlation. A high–low outlier is a high-clustering region surrounded by a low-clustering region, and a low–high outlier is a low-clustering region surrounded by a high-clustering region. Both show a negative correlation.

2.3.3. The Rank-Size Rule

The rank-size rule is based on the rank and size of ALEs to reflect the law of their scale distribution [41,42,43], which can be implemented in SPSS 25. Using the 2019 operating income of ALEs in Heilongjiang Province as a scale indicator, we rank them from large to small, form a corresponding sequence curve with the enterprise ranking, and then evaluate the distribution of enterprises’ scale. The calculation formula is as follows:
P r = P 1 r z
where r is the order of ALEs; Pr is the scale of the rth-ranked ALE; P1 is the scale of the top-ranked ALE in theory; and z is Zipf’s index. We take the logarithm on both sides of Formula (5) to obtain Formula (6).
ln P r = ln P 1 z ln r
where z can be estimated through a linear regression model, and its numerical magnitude is used to measure the degree of balance in the distribution of the ALEs’ scale. If z > 1, then the distribution of enterprise scale is relatively concentrated, and a few top enterprises have a strong monopoly position. If z = 1, then the distribution of enterprise scale is in an equilibrium state, achieving Pareto optimality. If 0 < z < 1, then the distribution of enterprise scale is relatively dispersed, with relatively well-developed middle-ranking enterprises and no prominent leading enterprises.

2.3.4. Geographical Detector

The geographical detector is a statistical method used to detect the spatial differentiation and driving forces of geographical phenomena [44], which can be implemented in Geodetector software (http://www.geodetector.cn/, (accessed on 1 May 2023)). Compared to other traditional models, the geographical detector has advantages such as collinear immunity and the ability to avoid mutual causation between independent and dependent variables. Based on geographic detectors, the influencing factors of the ALEs’ spatial pattern in Heilongjiang Province can be analysed.
Factor detection can explore the explanatory power of various influencing factors on the spatial pattern of ALEs in Heilongjiang Province. The calculation formula is as follows:
q = 1 h = 1 L N h σ h 2 N σ 2
where q is the explanatory power of a certain influencing factor on the spatial pattern of ALEs in Heilongjiang Province, with a value range of [0, 1]; a higher value of q indicates stronger explanatory power of the influencing factor; and L is the classification number of the influencing factors. Based on the natural breakpoint method, each influencing factor is divided into 5 levels. Nh and N are the numbers of counties in the h-layer and Heilongjiang Province, respectively. σ h 2 and σ 2 are the variances in the number of ALEs in the h-layer and Heilongjiang Province, respectively.
Interaction detection can identify whether the pairwise interaction between influencing factors increases or decreases the explanatory power of the ALEs’ spatial pattern in Heilongjiang Province. q(x1) and q(x2) represent the explanatory power of the influencing factors x1 and x2, respectively, and q(x1x2) is the explanatory power when x1 and x2 interact with each other. By comparing the values of q(x1), q(x2), and q(x1x2), interactive types can be classified into five categories (Table 1).

3. Results

3.1. Spatial Pattern of Agricultural Leading Enterprises in Heilongjiang Province

3.1.1. Spatial Distribution Concentration

The nearest neighbour index method can measure the concentration degree of the ALEs’ spatial distribution (Table 2). The headquarters and branches of ALEs in Heilongjiang Province showed a significant tendency towards spatial clustering, with nearest neighbour indices of 0.430 and 0.581, respectively. The statistical significance of both indices was confirmed at the 0.01 level. It is evident that the distribution of ALEs in Heilongjiang Province was characterized by significant spatial nonstationarity. The nearest neighbour index of the headquarters was lower than that of the branches, indicating a stronger agglomeration tendency in the spatial layout of the headquarters.

3.1.2. Spatial Distribution Hotspots

The kernel density analysis method can detect hotspots of the ALEs’ spatial distribution (Figure 3). There were significant differences in spatial hotspots between the headquarters and branches of ALEs in Heilongjiang Province. For the headquarters, the hotspots were mainly concentrated in the southwest region of Heilongjiang Province. Specifically, the areas with the highest headquarter density were in the Harbin municipal district and its northern areas, including Qing’an, Beilin, Wangkui, and Qinggang. Zhaodong—Lanxi, Qiqihar municipal district—Longjiang, Bei’an—Kedong, Hegang—Luobei, Hailin—Ning’an, and Wuchang also formed smaller, high-density areas. For the branches, their hotspots were more scattered than those of the headquarters but were most concentrated in the Sanjiang Plain. The Hegang municipal district—Luobei, Shuangyashan municipal district—Youyi, Fujin—Tongjiang, Mishan—Hulin, and the border area of Fuyuan and Raohe formed large-scale, high-density areas. In addition, the edge area of the Songnen Plain also formed three major high-density areas, namely, the high-density areas of the Harbin municipal district, Bei’an, and Nenjiang—Nehe.

3.1.3. Spatial Agglomeration Pattern

The local Moran’s index method can identify the agglomeration patterns of the ALEs’ spatial distribution (Figure 4). Based on the numbers of headquarters and branches of ALEs in each county of Heilongjiang Province, the spatial agglomeration pattern was analysed. In terms of headquarters, the Harbin municipal district and its surrounding areas, including Wuchang, Zhaodong, and Beilin, showed a high–high cluster pattern. As the capital of Heilongjiang Province, Harbin is the political, economic, and cultural centre of the province. At the same time, it has convenient transportation conditions, abundant talent reserves, and a vast market space. These numerous advantageous conditions attract ALEs, which establish their headquarters near the Harbin municipal district. Wuchang, Zhaodong, and Beilin are also key areas for ALE headquarters in terms of layout due to their abundant agricultural resources, advantageous location near the Harbin municipal district, and relatively low operating costs. In terms of the branches, the Sanjiang Plain exhibited a high–high cluster pattern, including Tongjiang, Fujin, Hulin, Mishan, Raohe, Baoqing, and Suibin. These areas feature a flat terrain, fertile land, abundant water sources, convenient transportation networks, and well-established farming systems. The levels of agricultural intensification, scale, and specialization are relatively high. These conditions help branches engage in agricultural product production, acquisition, processing, warehousing, transportation, and other business activities. The Harbin municipal district and Bei’an showed a high–low outlier pattern. The Harbin municipal district, as the population and commercial hub of Heilongjiang Province, shows thriving market demand for agricultural products. ALEs have chosen to set up branches in the Harbin municipal district to be closer to the market and expand sales. Bei’an is a regional central city in northern Heilongjiang Province. This city boasts abundant agricultural resources and is recognized as an important operating base for the Heilongjiang agricultural reclamation system. As a result, Bei’an had a larger number of branches than the surrounding counties, demonstrating a high–low outlier pattern.

3.1.4. Regional Spatial Connection

There are connections between the headquarters and branches of each ALE. If the headquarters and branches are in different counties, cross-regional connections are formed. The spatial connection network of ALEs in Heilongjiang Province can be obtained by integrating their cross-regional connections at the county level. This directed network consists of connections from the counties where a company’s headquarters are located to the counties where a company’s branches are located. The number of connections on each path is the association strength. The association strength is divided into four levels based on the natural break method (Figure 5). There were two first-level connections, one from the Harbin municipal district to Luobei and the other from the Harbin municipal district to Nenjiang. There were four second-level connections that stemmed from the Harbin municipal district to Bei’an, Tongjiang, Hulin, and Mishan. There were nine third-level connections from the Harbin municipal district to Wudalianchi, Fuyuan, Fujin, Raohe, Suibin, Baoqing, Huachuan, Jixian, and Youyi. There were 29 fourth-level connections, with most of them leading from the Harbin municipal district to the counties in the Songnen Plain and the northern part of the Sanjiang Plain. There were only six connections whose starting points were not in the Harbin municipal district. They were from Wuchang, Zhaodong, and Jixian to the Harbin municipal district; from Ning’an to the Mudanjiang municipal district and Dongning; and from Suifenhe to Aihui.
Overall, the regional connection network of ALEs in Heilongjiang Province was radially distributed with the Harbin municipal district as the centre. It is evident that the ALEs headquartered in the Harbin municipal district have strong capabilities, with their branches radiating throughout most of Heilongjiang Province. The Harbin municipal district has become a key node leading the development of the agricultural industry in the entire province. With the exception of the Harbin municipal district, there were few regional connections among enterprises in other counties, reflecting the low level of agricultural industrialization and significant regional disparities in Heilongjiang Province. In addition, the main directions of regional connections were southwest–northeast and southeast–northwest. The former was mainly from the Harbin municipal district to various counties in the Sanjiang Plain, while the latter was mainly from the Harbin municipal district to various counties in the Songnen Plain.
Our research further found that the agricultural reclamation system has profoundly influenced the regional spatial connection network of ALEs in Heilongjiang Province. The construction of the Heilongjiang Reclamation Area began in 1947 and flourished with the development of the Great Northern Wilderness. It has made significant contributions in developing production, supporting national construction, and ensuring food security. The Beidahuang Group, which was established after the reform of the agricultural reclamation system, has occupied a dominant position in the agricultural industry system of Heilongjiang Province due to its large scale and strong capabilities. The scale characteristics of ALEs in Heilongjiang Province were evaluated using the rank-size rule (Figure 6). The calculated Zipf index was 1.154. Its value was greater than 1, indicating that the distribution of ALEs’ revenues in Heilongjiang Province was relatively concentrated, with a few top enterprises having a significant advantage. The scale of ALEs in Heilongjiang Province conformed to the Pareto principle. The top 20 enterprises accounted for 79.17% of the revenue of the top 100 enterprises, approaching the ideal value of 80%. The top four enterprises accounted for 77.09% of the revenue of the top 20 enterprises, which is still close to the theoretical value of 80%. Enterprises affiliated with the agricultural reclamation system (aka Beidahuang Group) accounted for 76.42% of the revenue of the top 20 enterprises and 92.89% of the revenue of the top four enterprises. Their headquarters are mostly in the Harbin municipal district, while their branch offices are usually established based on the original agricultural reclamation system. They occupied 92.42% of the regional connections of ALEs in Heilongjiang Province. Therefore, the agricultural reclamation system has a profound impact on the regional spatial connection network of ALEs in Heilongjiang Province, especially in the first three levels of network connections. Nenjiang and Luobei, the endpoints of the first-level connection, are distributed with the Jiusan Administration Bureau and Baoquanling Administration Bureau of the original agricultural reclamation system, respectively. As the endpoints of the second-level connection, Bei’an and Mishan are distributed with the Bei’an Management Bureau and Mudanjiang Management Bureau, respectively, while Tongjiang and Raohe also have a large number of Heilongjiang state farms. The terminals of the third-level connection are also concentrated in the Songnen Plain and the northern part of the Sanjiang Plain, where most of the Heilongjiang state farms are located. Focusing on agricultural reclamation systems has become an important approach for the development of ALEs in Heilongjiang Province.

3.2. Influencing Factor Analysis of the Spatial Pattern of Agricultural Leading Enterprises in Heilongjiang Province

3.2.1. Indicator Construction

Location selection has a significant impact on the survival and development of ALEs. The influencing factor analysis of the spatial pattern of ALEs is relatively complicated, not only influenced by the general law of enterprise layout but also constrained by the particularities of the agricultural industry [45]. Due to the distinctive regional nature of agriculture, this study conducted an influencing factor analysis at the county level. Following the principles of indicator scientificity and data availability, nine indicators were selected for the analysis from seven dimensions, including economy, transportation, agglomeration, market, talent, agricultural reclamation, and resources (Table 3).
As a type of enterprise, the location selection of ALEs is constrained by factors such as the economy, transportation, agglomeration, market, and talent, which are general influencing factors for enterprise layouts. In the economic dimension, gross domestic product (GDP) was utilized to quantify the economic scale, while distance from the provincial capital (DFC) was used to measure economic location conditions. In terms of transportation, highways are suitable for short-distance, small-batch, and high-frequency transportation of agricultural products due to their wide coverage, good accessibility, and strong mobility, while railways are suitable for long-distance, large-batch, and low-frequency transportation of agricultural products due to their low transportation costs, high efficiency, and large capacity. Highway mileage (HM) was used to represent highway traffic conditions, while rail mileage (RM) was used to reflect rail traffic conditions. In the agglomeration dimension, the spatial clustering of supporting industries can provide complete upstream and downstream products and services for ALEs’ operation. The number of supporting enterprises (AGGLO) was used to characterize the development status of the agricultural support industry. Supporting enterprises specifically include production, processing, manufacturing, wholesale, and sales enterprises in the field of agriculture, as well as transportation, warehousing, postal, financial, scientific research, and technology service enterprises related to agriculture. From the market perspective, since agricultural products are daily necessities, their market demand is closely related to population size. The number of permanent residents (POP) could represent the size of the market potential, which also reflects the richness of the labour resources in a region. From the talent perspective, the number of people with Bachelor’s degrees or above (BDOA) could represent the richness of talent and reflect the level of technology and education in a region.
As a type of agricultural enterprise, the location selection of ALEs is also influenced by agricultural factors such as agricultural reclamation and agricultural resources. In terms of agricultural reclamation, the agricultural reclamation system in Heilongjiang Province boasts a state-owned farm group that possesses the largest arable land area, the highest level of modernization, and the strongest comprehensive production capacity in China and cultivates a large number of ALEs. ALEs under the reclamation system often plan their business layout based on the distribution of state farms in Heilongjiang. Therefore, the number of state farms in Heilongjiang Province (FARM) was used to reflect the spatial layout of the agricultural reclamation system. In the resource dimension, ALEs take agricultural product production, processing, and sales as their core businesses. When determining the location of their business, these enterprises often consider the agricultural production pattern. Being located near agricultural production bases can provide ALEs with abundant agricultural raw materials for their operations. The per capita grain yield (PG) was used to represent the degree of grain enrichment.

3.2.2. Explanatory Power Analysis of Influencing Factors Based on Geographical Detector

This study selected the number of headquarters and branches of ALEs in each county as the dependent variable to reflect the spatial pattern of the headquarters and branches of ALEs in Heilongjiang Province. In terms of independent variables, socioeconomic indicators often have a certain degree of multicollinearity. However, the geographical detector method is characterized by collinear immunity. Thus, the geographical detector method was used to detect the explanation power of influencing factors. To ensure the scientific and rational results of the evaluation, the natural breakpoint method was first utilized to categorize each indicator into five levels. Subsequently, the geographical detector method was used for factor detection (Table 4) and interaction detection (Figure 7). Due to the lack of relevant data in Huzhong District and Xinlin District of Da Hinggan Ling Prefecture, they were not included in the influencing factor analysis.
The factor detection showed obvious differences in the significant influential factors of the headquarters and branches of ALEs in Heilongjiang Province. As the centre of an entire ALE, its headquarters play a crucial role in strategy formulation, capital allocation, technological innovation, trade negotiation, communication with government departments, connections with financial markets, etc. At the same time, some ALE headquarters take into account the basic functions of processing and sales of agricultural products. Ranked in descending order of explanatory power, the influencing factors were AGGLO > POP > GDP > RM > BDOA > DFC > FARM > HM > PG. The six variables of AGGLO, POP, GDP, RM, BDOA, and DFC passed the significance test at the 0.05 level, indicating that the traditional focus of the enterprise spatial layout, such as agglomeration, market, economy, transportation, and talent, were the core factors affecting the spatial pattern of the ALE headquarters. Among them, AGGLO had the strongest explanatory power for the spatial pattern of the headquarters. POP, GDP, RM, and BDOA also had a strong explanatory power, with q values exceeding 0.8. Compared with other traditional influencing factors affecting the enterprise layout, the explanatory power of DFC was relatively low. This result indicated that although the spatial layout of ALEs was influenced by location conditions, the decentralization and regionalization of agricultural production weakened the intensity of this impact to some extent. The results of FARM and PG were not significant, indicating that the influence of agricultural factors, such as agricultural reclamation and agricultural resources, on the spatial pattern of ALE headquarters was limited. A significant difference in the impact of HM and RM on the spatial pattern of the headquarters was observed, with HM failing to pass the significance test. This result indicated that the layout of ALE headquarters in Heilongjiang Province was more focused on railway transportation than highway transportation and reflected the typical characteristics of outward grain transport in major grain-producing areas, as well as the crucial role of corporate headquarters in decision making and information exchange.
ALE branches are often involved in multiple sectors of the agricultural industry, including production, procurement, processing, sales, and technical services. They are often located near production bases or product markets. Ranked in descending order of explanatory power, the influencing factors were FARM > GDP > PG > POP > RM > BDOA > AGGLO > HM > DFC. The four variables FARM, PG, HM, and DFC passed the significance test at the 0.05 level. The results suggested that agricultural factors, such as agricultural reclamation and agricultural resources, had a strong explanatory power for the spatial pattern of the branches, while the general influencing factors of the enterprise layout, such as agglomeration, market, economy, transportation, and talent, had limited explanatory power. Among them, FARM had the strongest explanatory power for the branches’ spatial pattern, which was significantly higher than the other indicators. PG had a certain degree of explanatory power for the spatial pattern of the branches. The explanatory powers of HM and RM were similar, but RM did not pass the significance test. This result indicated that the layout of the ALE branches in Heilongjiang Province was more focused on highway transportation than on railway transportation. DFC was the only variable that could significantly explain the spatial pattern of the headquarters and branches. However, due to the obvious regional differences in the spatial patterns of the headquarters and branches, the mechanism of DFC’s effect may be completely different for both.
Overall, the spatial layout requirements of the headquarters and branches of ALEs in Heilongjiang Province are significantly different. The headquarters show obvious urban and agglomeration orientations, while the branches show a clear dependence on farms and raw material. The spatial pattern of the ALEs was the result of multiple influencing factors. Specifically, the spatial pattern of the headquarters was largely influenced by factors such as economic scale, railway transportation, enterprise agglomeration, market demand, talent quantity, and economic location, while the spatial pattern of the branches was greatly influenced by factors such as the agricultural reclamation system, agricultural resources, highway transportation, and economic location.
The interaction results showed that the explanatory power between two-factor interaction was stronger than that of a single factor regardless of the headquarters or the branches. At the headquarters level, the explanatory power of the interaction factors was relatively high, with approximately 91.66% of these factors having q values of 0.8 or above. Among them, the q values of five interaction factors, namely, POP∩PG, AGGLO∩PG, AGGLO∩BDOA, GDP∩AGGLO, and DFC∩POP, were above 0.9. Interaction types were divided into bilinear and nonlinear enhancements. Bilinear enhancement was the main type of interaction, while only the interactions between PG and other variables were mainly nonlinear enhancement.
Regarding the branches, the explanatory power of the interaction factors was generally weaker than that of the interaction factors related to headquarters. Only the interactions between FARM and other variables had a relatively strong explanatory power, with q values all above 0.8. The q values of FARM∩DFC and FARM∩PG reached 0.89 or above. Interaction types were also divided into bilinear and nonlinear enhancements. Bilinear enhancement was still the main type of interaction, while only the interactions among DFC, PG, and other variables were mainly nonlinear enhancements.

3.2.3. Action Direction Judgement of Influencing Factors Based on the Correlation Coefficient

The explanatory power of the influencing factors on the spatial pattern of the ALE headquarters and branches in Heilongjiang Province was analysed through geographical detectors; however, the action direction of the influencing factors could not be determined. This study calculated the Pearson correlation coefficient between the number of headquarters or branches and each significant influencing factor to identify whether there is a positive or negative impact (Table 5). Nonsignificant indicators in the factor detection were not used to determine the direction of action.
In terms of headquarters, GDP, RM, AGGLO, POP, and BDOA were significantly positively correlated with the number of ALE headquarters, which passed the significance test at the 0.01 level. This result indicates that the growth in the economic scale, improvements in railway transportation, the development of enterprise agglomeration, the expansion of market demand, and increase in talent quantity can effectively increase the possibility of ALE headquarters’ layouts. In terms of the branches, HM, FARM, and PG showed a significant positive correlation with the number of ALE branches, passing the significance test at the 0.01 level. This indicates that ALEs branches are more likely to be established in areas with more state-owned farms, richer agricultural resources, and more developed highway transportation.
DFC was significantly negatively correlated with the number of headquarters but not significantly correlated with the number of branches. This indicates that the influence of the distance from the provincial capital on the layout of ALEs is rather complex. Centred on Harbin railway station, 10 multiring buffer zones were constructed with a radius of 100 km to cover the entire province. The numbers of headquarters and branches of ALEs within each buffer zone were counted (Figure 8). The spatial pattern of the headquarters presented a centralizing trend around the Harbin municipal district. As the distance from the Harbin municipal district increased, the number of headquarters decreased accordingly, while the number of branches fluctuated. Within 200 km from Harbin, the number of branches decreased as the distance increased; within 200 km to 400 km from Harbin, the number of branches increased as the distance increased; and 400 km beyond Harbin the number of branches decreased rapidly as the distance increased. The buffer zone between 300 km and 400 km from the provincial capital, which passed through the border area of the Songnen Plain and Lesser Khingan Mountains, as well as the western area of the Sanjiang Plain, had the highest number of branches. There was a nonlinear relationship between the number of branches and the distance from Harbin. As a result, the correlation coefficient between the two did not pass the significance test.

4. Discussion

4.1. Spatial Layout Mechanism of Agricultural Leading Enterprises in Heilongjiang Province

The headquarters of ALEs are responsible for the development planning and strategic decision making of the entire enterprise and coordinate the branches in various regions. Branches are responsible for managing agricultural operations in their respective regions under the leadership of the headquarters. Both headquarters and branches are important components of ALEs. Their location choices collectively shape the spatial pattern of ALEs. The layout orientation, clustering areas, and influencing factors of the two are different (Figure 9).
ALE headquarters display a pronounced urban and agglomeration orientation, with most of them concentrated around the Harbin municipal district and its surroundings. The selection of headquarter location is highly influenced by general factors related to enterprise layouts. Specifically, more developed socioeconomic conditions, more convenient railway transport, more complete supporting industries, stronger market demand, richer talent reserves, and more obvious location advantages in a region result in a greater likelihood that ALEs establish their headquarters in that region. In terms of economic scale, a developed social economy means abundant business activities and industry exchanges. Headquarters can gain more commercial opportunities and communication platforms, obtain market information in a timely manner, and establish high-quality brand images. Simultaneously, economically developed regions tend to have a higher level of agricultural industrialization, providing a favourable industrial base for headquarter development [46]. In terms of railway transportation, north-to-south grain transport is the main mode of today’s grain transport in China [47]. As the largest major grain-producing area in China, Heilongjiang Province undertakes the important mission of exporting grain products to other areas and ensuring the overall food security of the country. As an important means for the long-distance transport of agricultural products, railway transportation has become a bridge between Heilongjiang Province and the main grain sales areas. Transport costs often account for a large proportion of agricultural product prices. Having ALE headquarters near railway hubs is advantageous for timely access to market information and the centralized procurement and distribution of agricultural products. Relying on railway transport, the cross-regional flow of people and goods is more convenient, which can effectively expand the radiation range of enterprise headquarters. In terms of enterprise agglomeration: a well-developed supporting industry can effectively reduce transaction costs for headquarters, accelerate information exchange, share infrastructure, form synergies, and promote the formation of agricultural industry clusters centred on ALEs [48]. Different government/industry/university/research institutes in a cluster spatially aggregate and closely collaborate, continuously enhancing the ALEs’ strength and regional agricultural competitiveness [49]. In terms of market demand, a dense population often means a vast market space and a large labour force, which enables ALE headquarters to acquire strategic development resources at low costs and increase profitability. In terms of talent quantity, ALEs urgently need intellectual support in technology innovation, product development, brand building, and other aspects [50]. Talent-intensive areas often have strong educational and technological strengths, which can provide a talent base for headquarters development. In terms of economic location, there is a significant negative correlation between the distance from the provincial capital and the number of corporate headquarters. The spatial pattern of enterprise headquarters is clustered around the Harbin municipal district. The number of headquarters decreases as the distance from the Harbin municipal district increases.
ALE branches exhibit a significant dependence on farms and raw materials, with their distribution mostly concentrated in the Sanjiang Plain. The branches’ selection of location is greatly influenced by agriculture-related factors, while the general factors of enterprise layouts have limited influence. Specifically, more convenient highway transportation, larger numbers of state farms, and richer per capita grain resources result in a greater likelihood that ALEs establish their branches there. In terms of highway transportation, ALE branches often focus on regional business and technical services, with a relatively small radiation range. They directly serve farmers and agribusinesses and have higher requirements for transport accessibility and flexibility. A convenient and flexible highway transport network allows for branches to purchase agricultural raw materials, explore rural markets, and provide technical services [51]. In terms of the agricultural reclamation system, it is a characteristic of agricultural production in Heilongjiang Province [52]. ALEs affiliated with the agricultural reclamation system mostly establish branch systems and provide basic services based on the distribution of state farms. At the same time, the Heilongjiang reclamation area’s vast land, sparse population, abundant resources, efficient production, and centralized scale are also conducive to branch development. As a result, regions with higher numbers of state-owned farms tend to have a larger presence of ALE branches. Apart from the Sanjiang Plain, the Harbin municipal district, as the location of the former Heilongjiang Provincial Land Reclamation Administration’s headquarters, also has a large number of branches. These branches are close to the consumer market and serve the important functions of obtaining market information and building sales networks. The agricultural reclamation system constitutes an important advantage for the development of agricultural industrialization in Heilongjiang Province; however, its outdated management system and heavy social burden are not conducive to stimulating business vitality [53]. How to promote benign competition and the common development of diversified ownership economies is an important issue in the development of agricultural industrialization in Heilongjiang Province. In terms of agricultural resources, ALE branches focus on agricultural products to carry out business operations, and the selection of their locations is inevitably affected by the agricultural production pattern. Richer per capita grain resources mean a better foundation for the development of the agricultural industry, which can attract more ALEs to establish branches in the area [54].
The exploration of the spatial layout mechanism of ALEs in Heilongjiang Province has reference value for the development of agricultural industrialization in other major grain-producing areas in China. The common characteristics of the layout of ALEs in Heilongjiang Province and other major grain-producing areas in China are as follows: the regional differences in the layout of ALEs are significant, with the headquarters clustered in core cities rather than in areas with intensive grain cultivation. Meanwhile, the branches are relatively dispersed, with a stronger preference for agriculturally advantageous regions, but the core cities are still important. However, a development model that overly emphasizes the importance of core cities could potentially contribute to a widening gap in regional economic development. Although there are similar enterprise layout rules, the development of ALEs in Heilongjiang Province has its own characteristics. The unique advantages of Heilongjiang Province are its vast territory with a sparse population, high grain commodity rate, and strong agricultural reclamation system, while its main challenges are that it is far away from coastal markets as well as its general location conditions and its high transportation costs.
Rural decline is a global problem. With the rapid development of urbanization in China, the gap between urban and rural areas is widening, mainly due to the lack of industrial support in rural areas. As a major agricultural province, Heilongjiang Province has insufficient development of agricultural industrialization and ALEs with limited competitiveness. The advantages of agricultural resources have not been effectively transformed into economic advantages. This problem also exists in other major grain-producing areas in China. Agriculture is still the dominant industry in the vast rural areas. It is of great practical significance for Heilongjiang Province and even China to understand the spatial layout mechanism of ALEs, accelerate the optimization and upgrading of agricultural industry, and promote rural revitalization by industrial revitalization.

4.2. Development Suggestions for Agricultural Leading Enterprises in Heilongjiang Province

4.2.1. Promoting the Development of Agricultural Industry Clusters

Using the Harbin municipal district as the core node, Heilongjiang Province should push the spatial concentration of companies, form agricultural industry clusters driven by ALEs, establish an agricultural association network covering the entire province, and accelerate the development of agricultural industrialization. It is essential to fully leverage the organizational, exemplary, and leading roles of ALEs in clusters. The connection between ALEs and grassroots farmers should be strengthened, the agricultural service system should be improved, farmers’ yield and income should be increased, and a community of shared interests, outcomes, and responsibility should be built.

4.2.2. Accelerating the Transformation of Agricultural Reclamation Systems

The Heilongjiang Agricultural Reclamation Administration is the grain production base with the largest scale of arable land, the highest degree of modernization, and the strongest comprehensive production capacity in China. Heilongjiang Province should make full use of the advantageous technological and industrial resources of agricultural reclamation systems, deepen institutional reforms, stimulate endogenous forces, promote coordinated development, and develop a group of highly competitive ALEs that effectively drive the high-quality development of agriculture and the revitalization of rural areas.

4.2.3. Developing a Diversified Ownership Economy

The decisive role of the market in allocating resources should be fully leveraged, and the role of the government should be given better play. The positive competition and common development of multieconomic sectors should be promoted. Asset restructuring of agricultural enterprises should be encouraged across regions, industries, and ownerships to establish large-scale enterprise groups. The ownership forms of ALEs in Heilongjiang Province should be enriched by various methods. Foreign-funded enterprises should be introduced, private enterprises should be expanded, the construction of an agricultural product market system should be strengthened, and a competitive agricultural industrial chain should be jointly built.

4.2.4. Actively Expanding External Markets

Based on the north-to-south grain transportation strategy, ALEs should extend the agricultural industry chain, raise the local processing rate, increase the added value of products, promote the construction of the “Black Soil Premium Products” brand, and focus on developing markets in the main grain sales areas. The government should actively guide local ALEs to implement the “going out” strategy and support them in establishing product marketing networks covering domestic and international markets. Both domestic and international markets and resources should be fully utilized to convert advantages in resources and production into economic advantages.

5. Conclusions

From the perspective of headquarters and branches, this study used a point pattern analysis, the local Moran’s index, the rank-size rule, and the geographical detector method to analyse the spatial pattern and influencing factors of ALEs in Heilongjiang Province. On this basis, our research summarized the spatial layout mechanism of ALEs in Heilong Province and provided suggestions for future development. Our main research conclusions are divided into five parts.
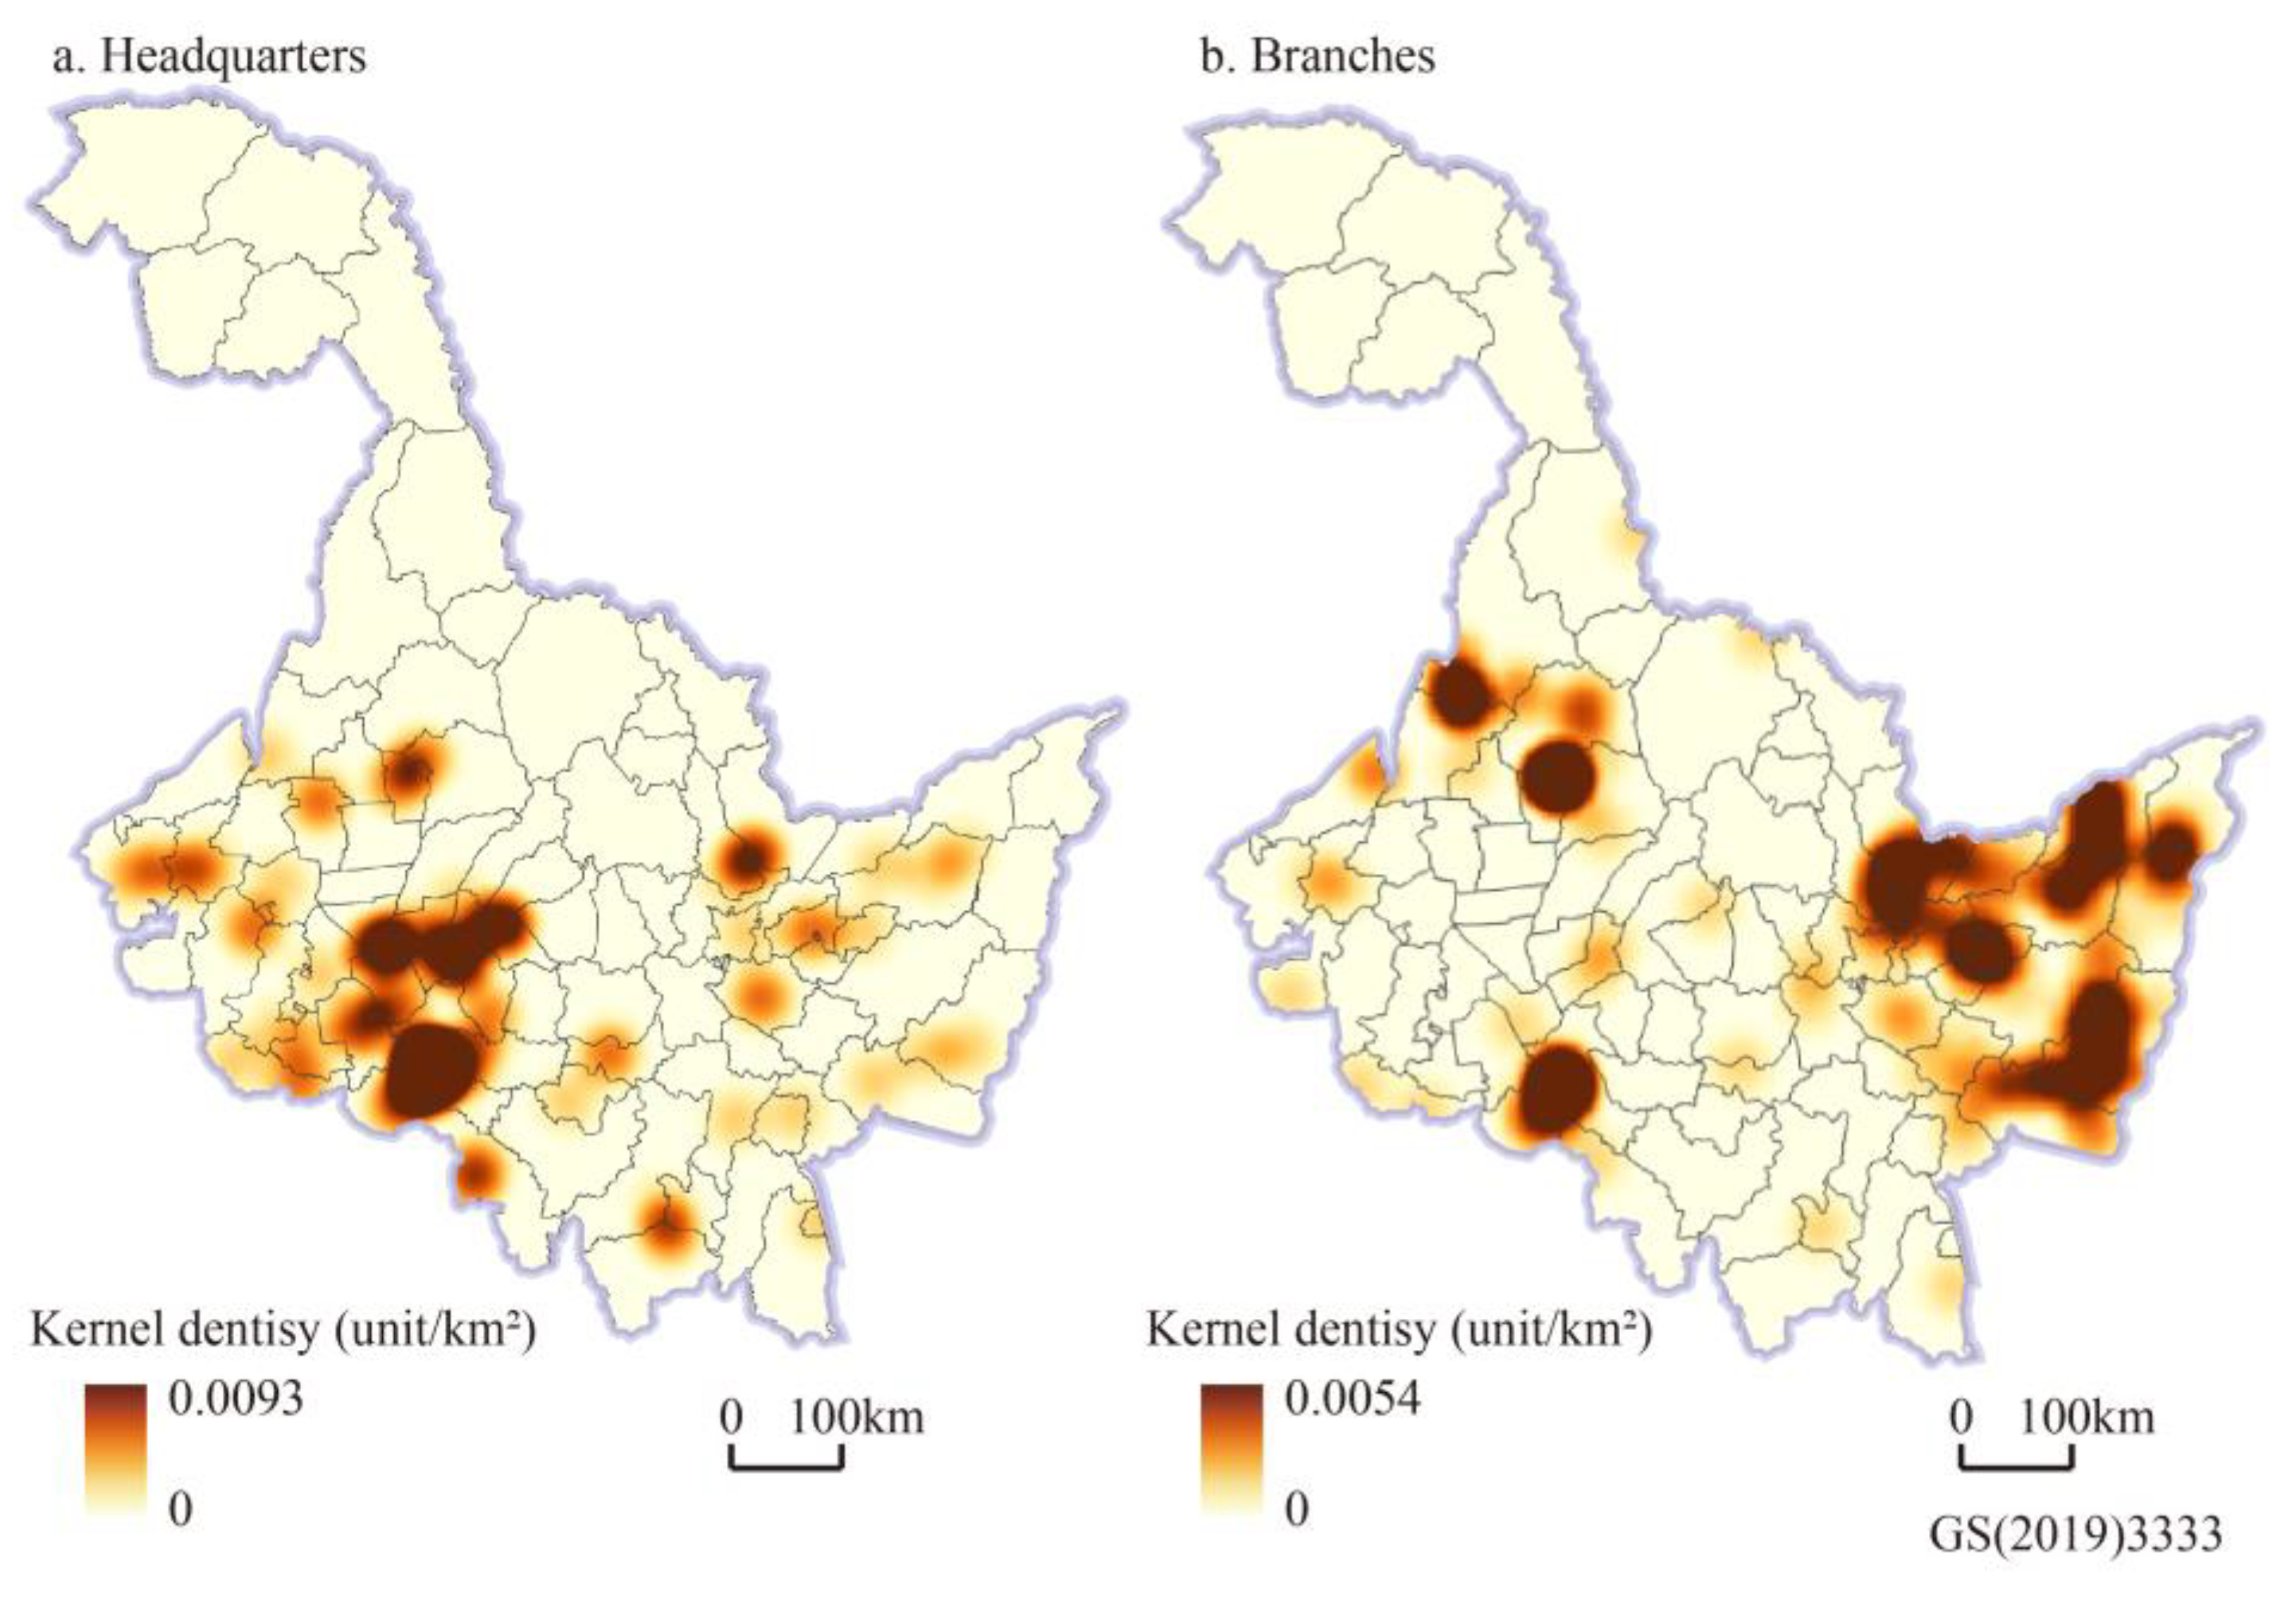
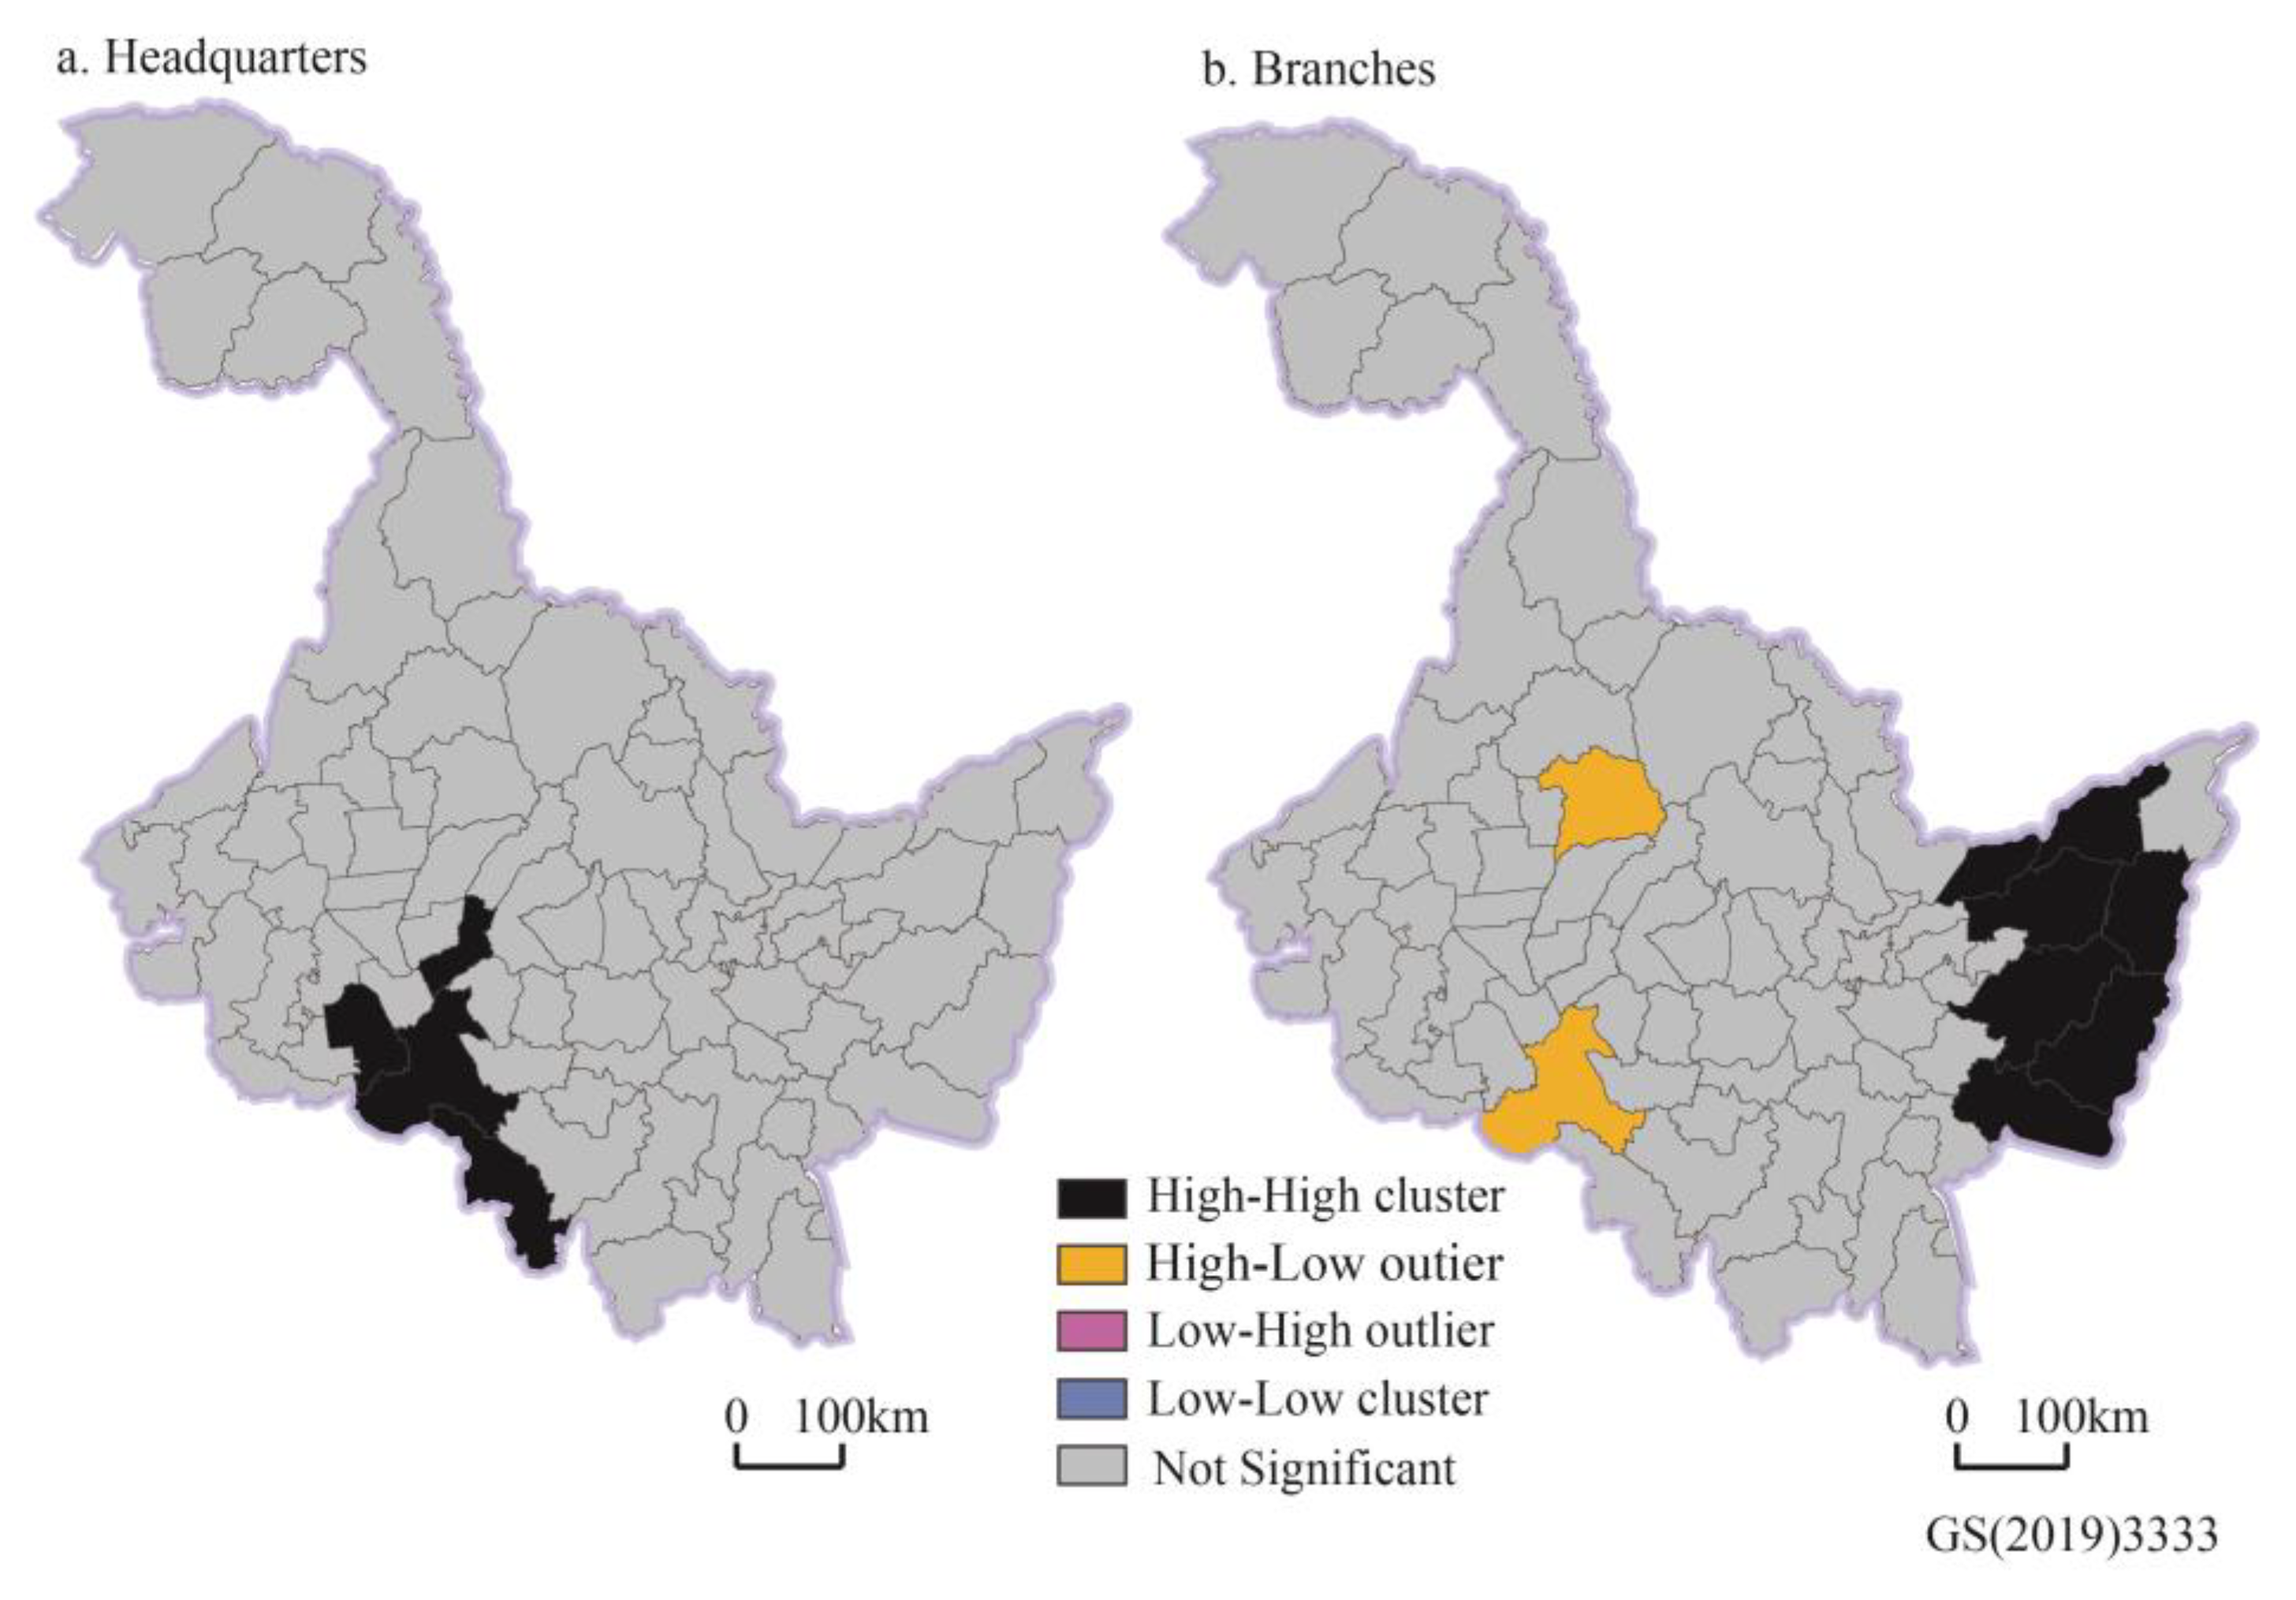
  • In terms of the spatial pattern of headquarters, ALE headquarters in Heilongjiang Province exhibited a significant tendency for spatial clustering, mainly in the Harbin municipal district and surrounding counties, including Wuchang, Zhaodong, and Beilin. These counties showed a high–high cluster pattern.
  • In terms of the branches’ spatial pattern, ALE branches in Heilongjiang Province also showed a spatial agglomeration distribution, and their degree of agglomeration is weaker than that of headquarters. The spatial distribution of branches is more scattered, mainly in the Sanjiang Plain area. Tongjiang, Fujin, Hulin, Mishan, Raohe, Baoqing, and Suibin showed a high–high cluster pattern, while the Harbin municipal district and Bei’an showed a high–low outlier pattern.
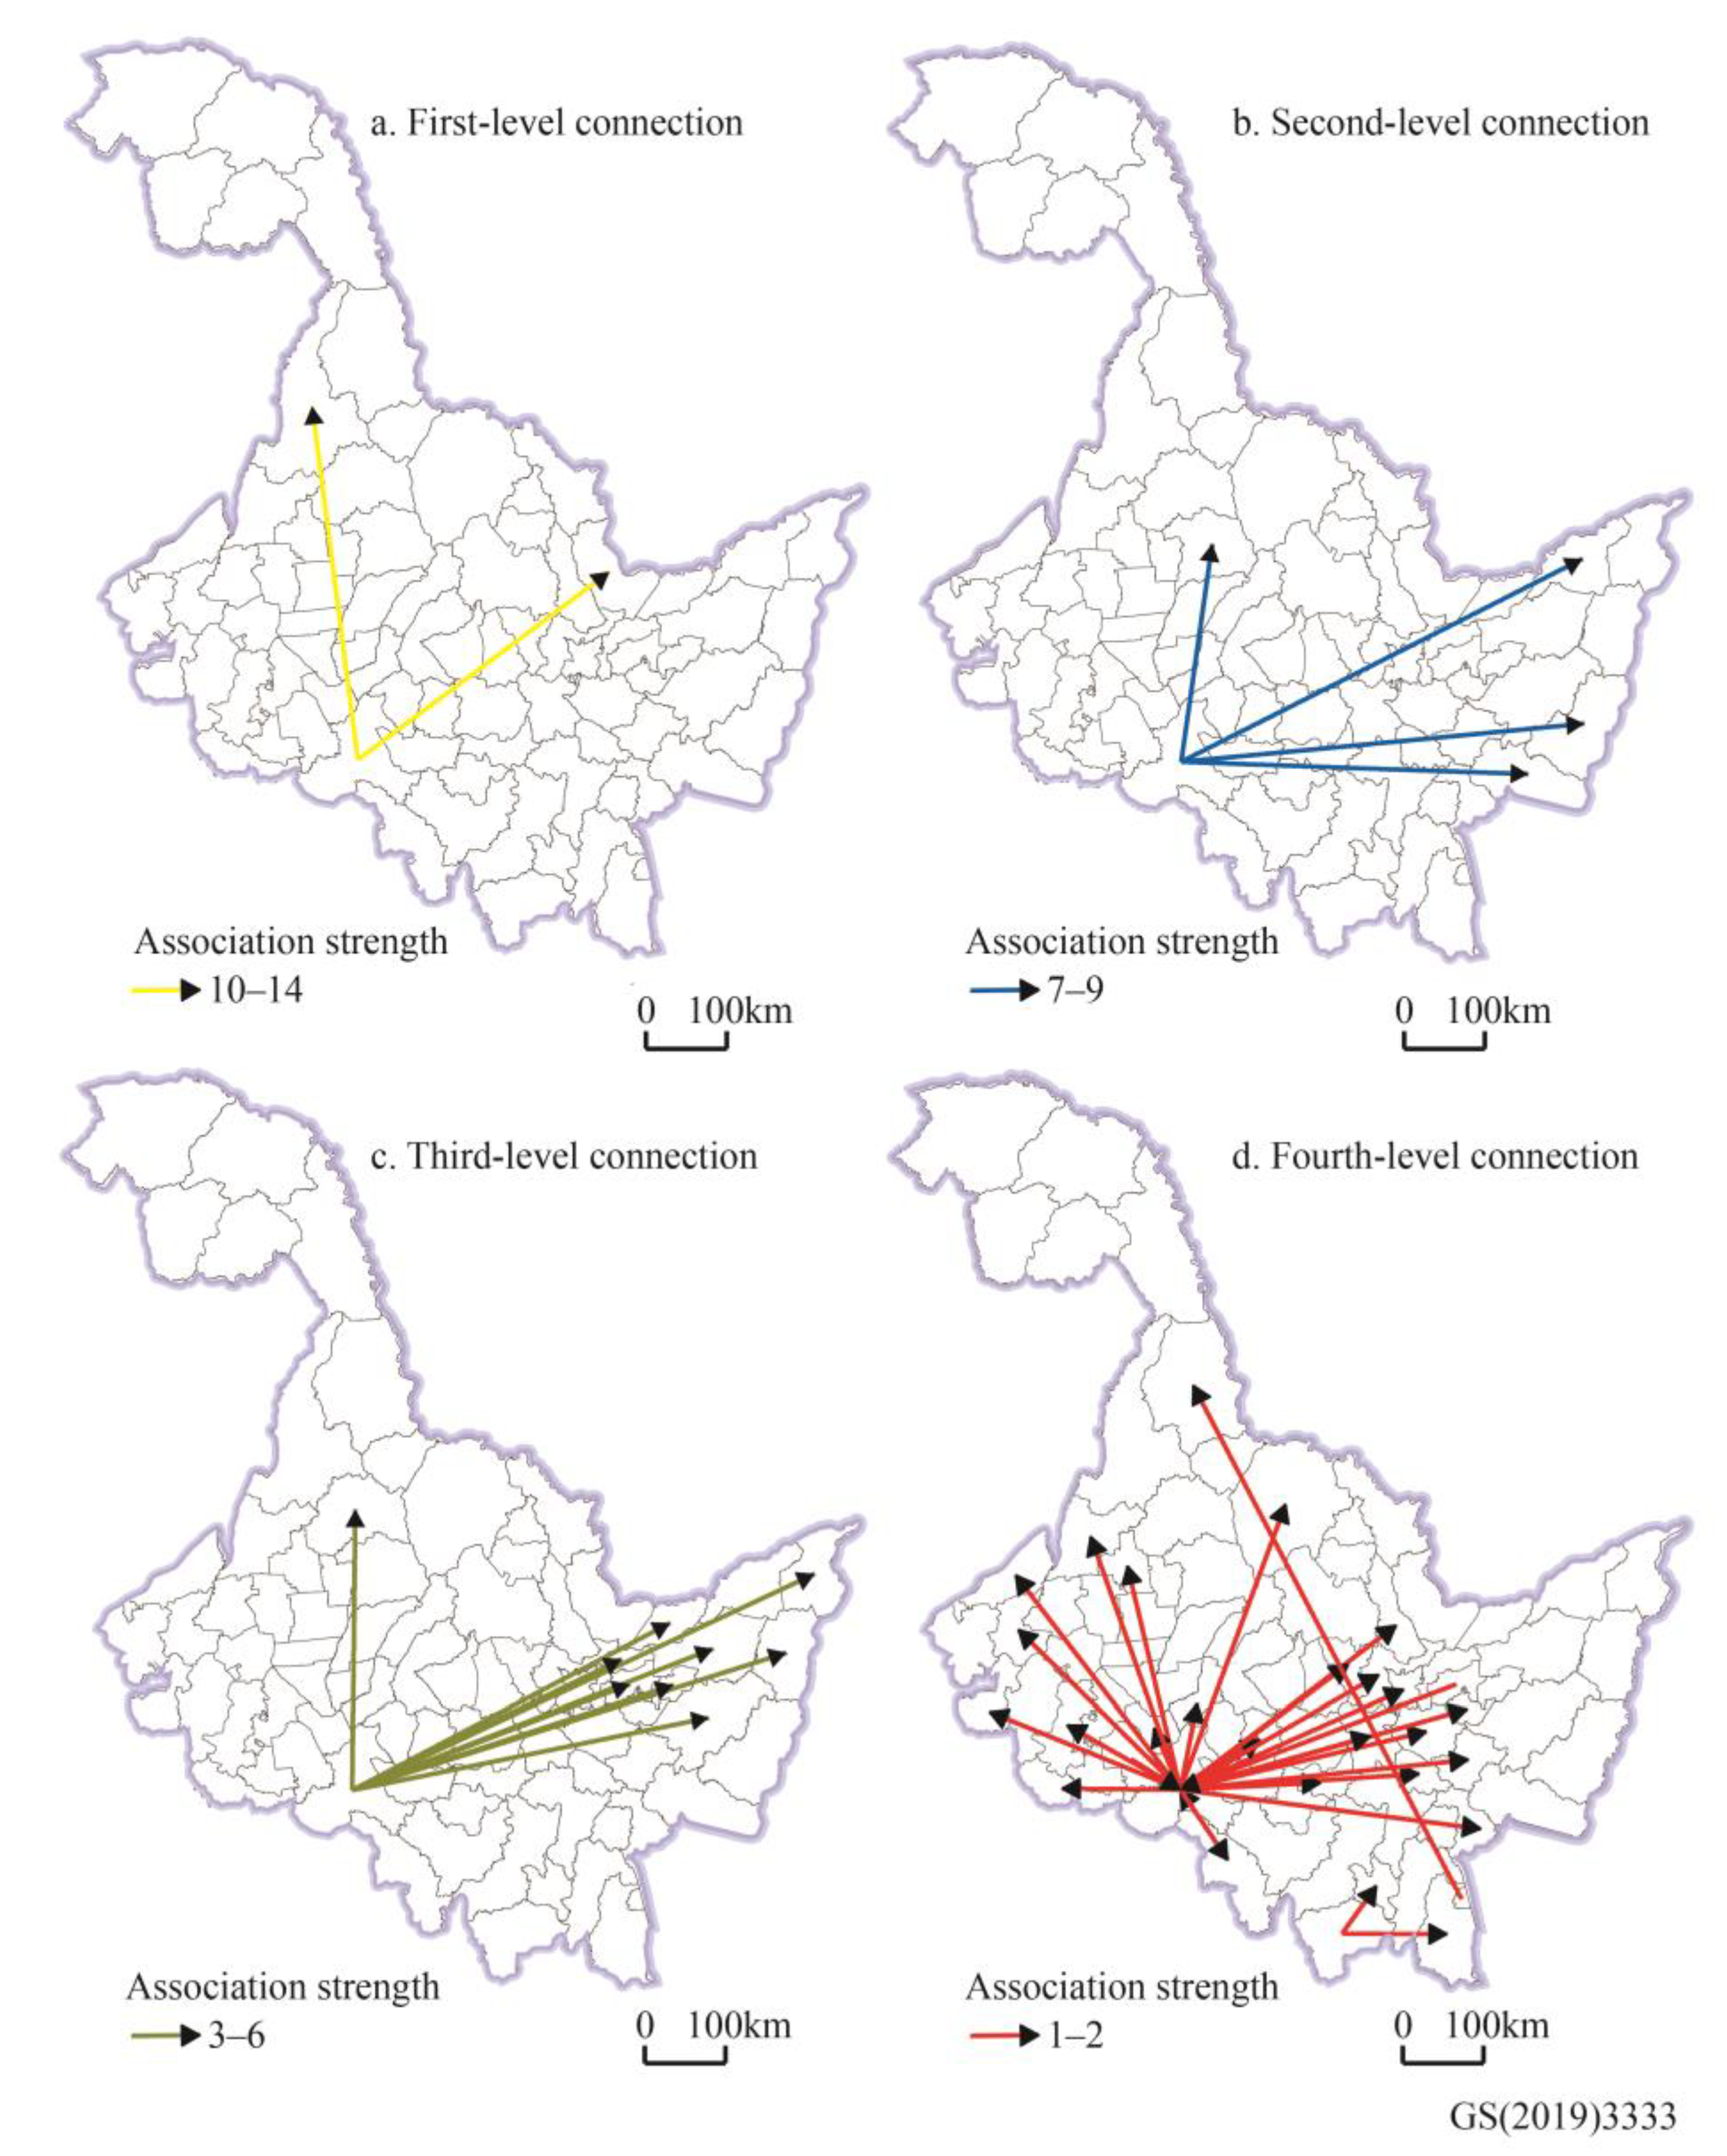
  • In terms of the regional spatial connection of enterprises, the regional connection network of ALEs in Heilongjiang Province was radially distributed with the Harbin municipal district as the centre. Except for the Harbin municipal district, there were few regional connections among enterprises in other counties. In addition, the main directions of regional connections were southwest–northeast and southeast–northwest. The agricultural reclamation system has deeply influenced the regional spatial connection network of ALEs in Heilongjiang Province.
  • In terms of the influencing factors of headquarters, AGGLO, POP, GDP, RM, BDOA, and DFC were the main influencing factors of the spatial pattern of ALE headquarters in Heilongjiang Province. The first five variables were significantly positively correlated with the number of ALE headquarters, and only DFC showed a significant negative correlation. The explanation power between two-factor interaction was stronger than that of a single factor. The main type of two-factor interaction was bilinear enhancement, while only the interactions between PG and other variables were mainly nonlinear enhancement.
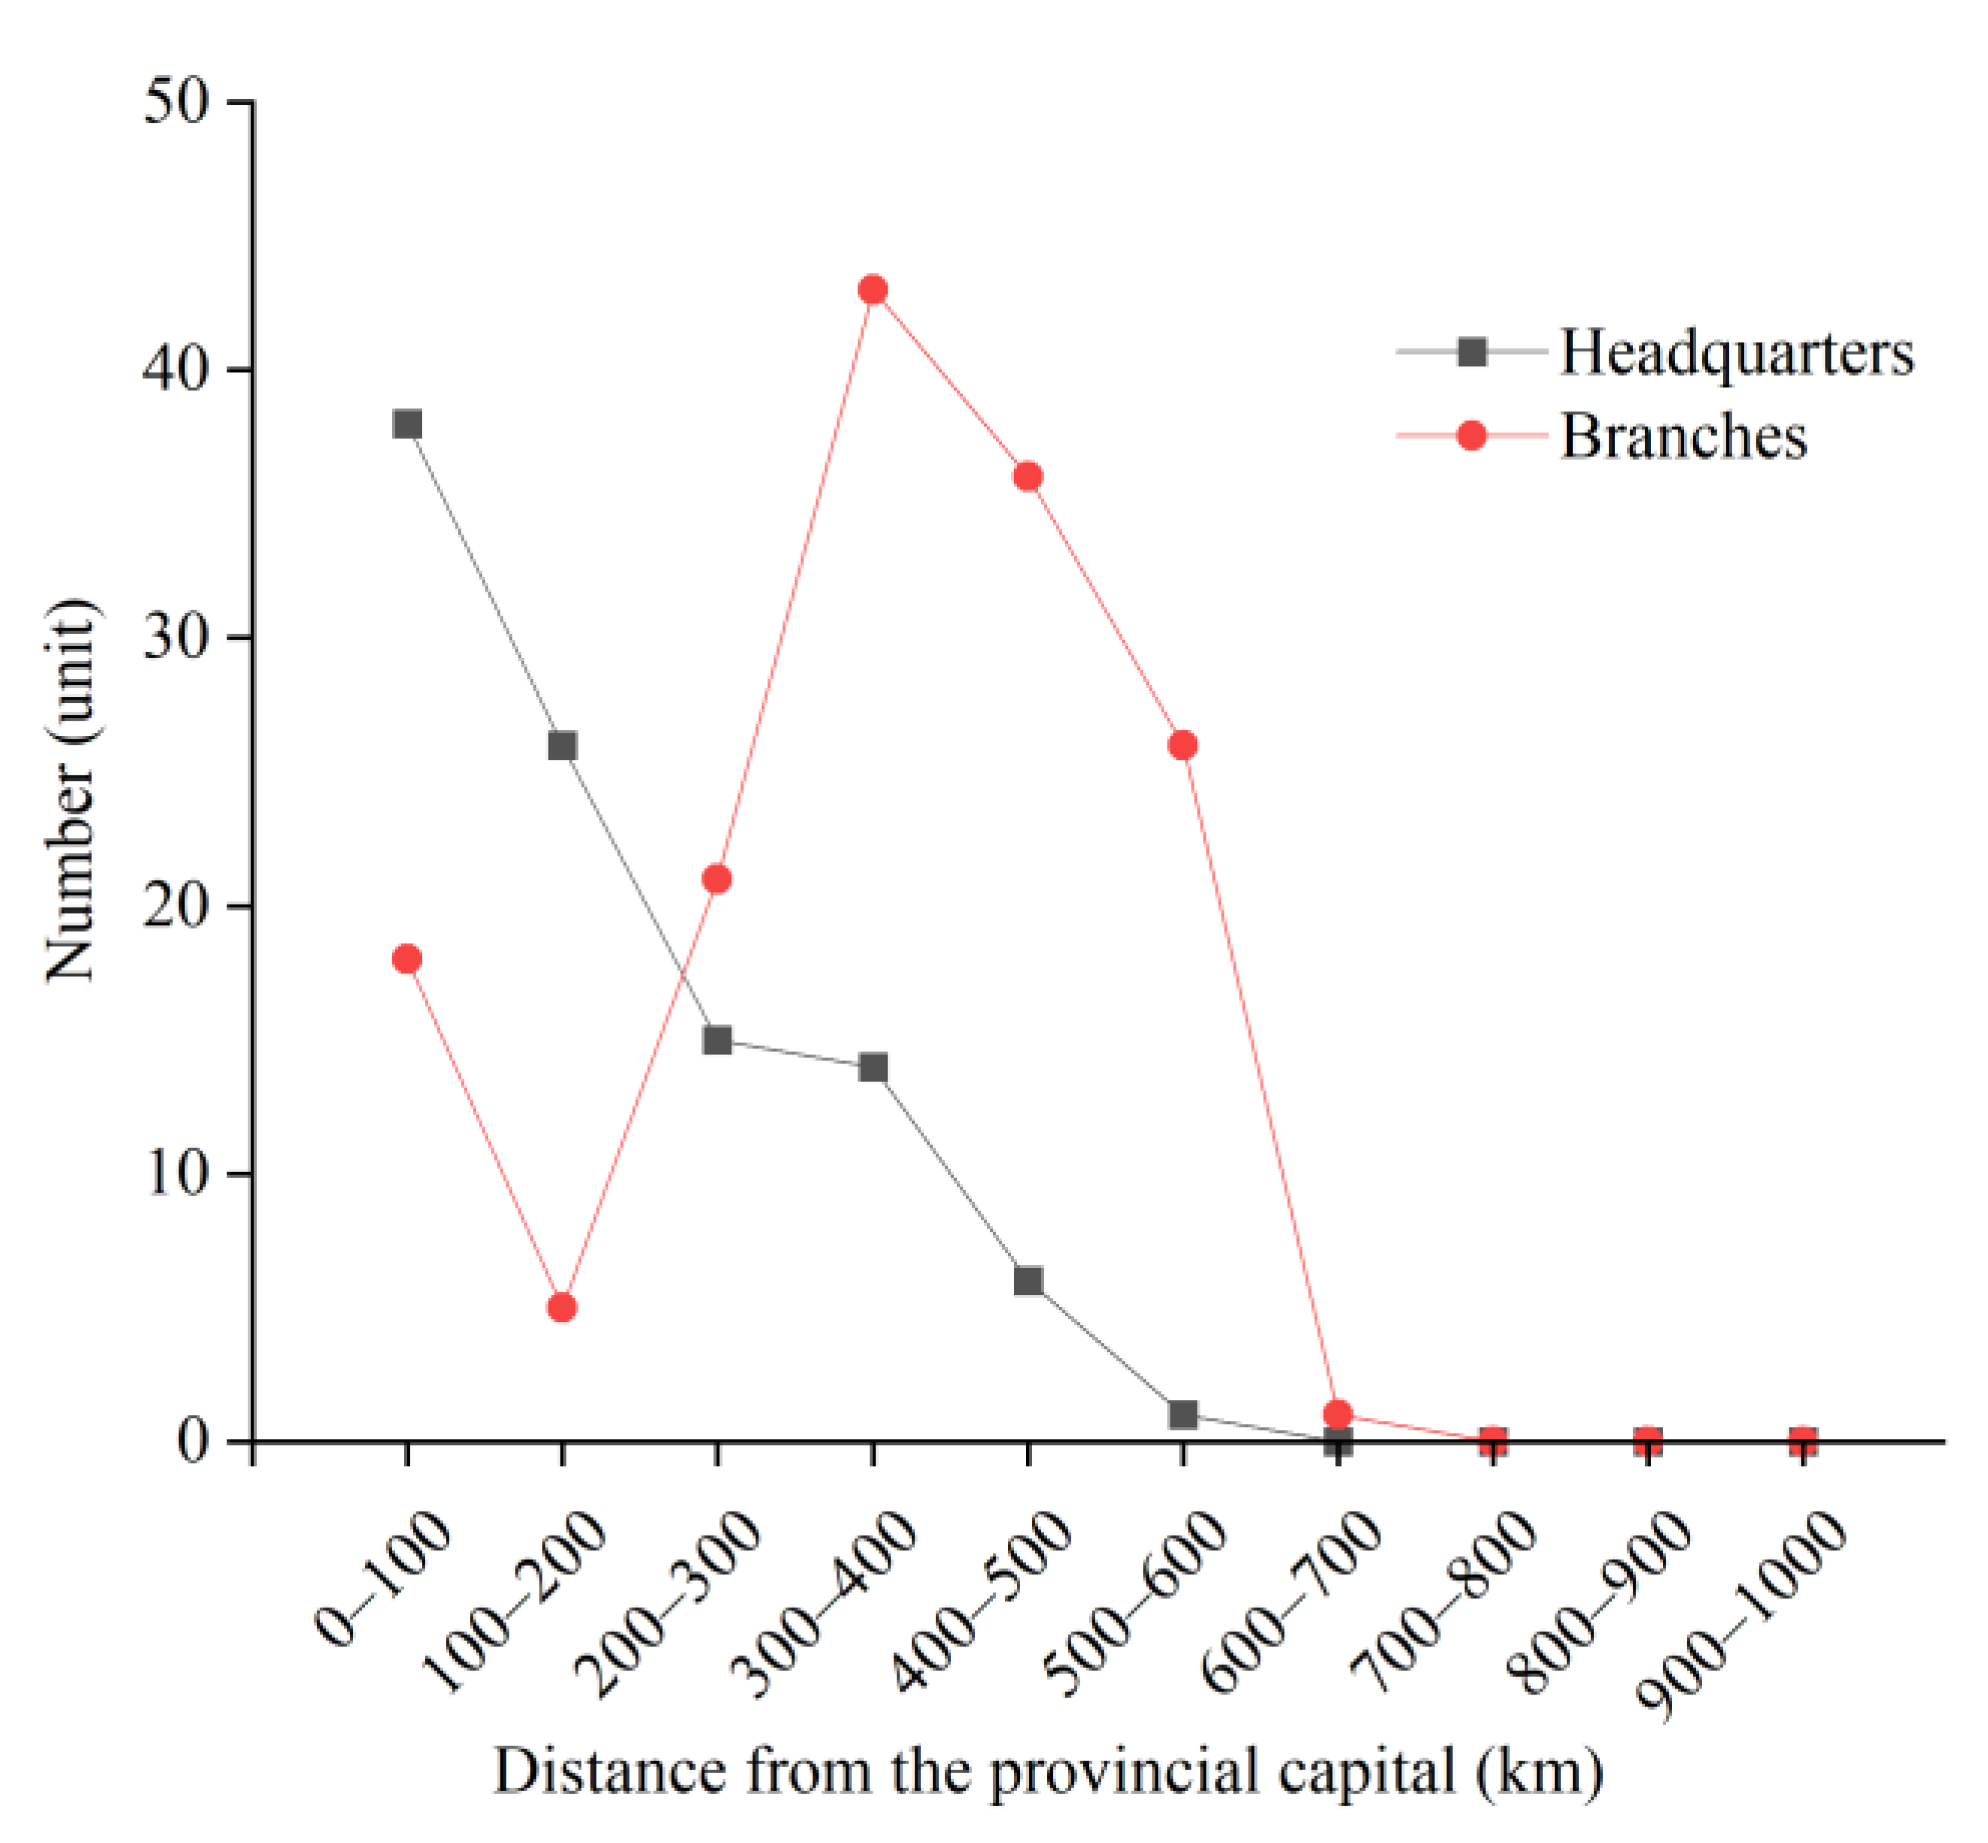
  • In terms of the influencing factors of branches, FARM, PG, HM, and DFC were the main influencing factors of the spatial pattern of ALE branches in Heilongjiang Province. The first three variables were significantly positively correlated with the number of ALE branches, and only the correlation coefficient between DFC and the number of branches did not pass the 0.05 significance test. The trend in the change in the number of branches was nonlinear with increasing DFC, and the number of branches was the highest within the range of 300 km to 400 km from the provincial capital. The explanatory power between two-factor interaction was stronger than that of a single factor. The main type of two-factor interaction was bilinear enhancement, while only the interactions among DFC, PG, and other variables were mainly nonlinear enhancement.
This study analysed the spatial pattern and influencing factors of ALE headquarters and branches in Heilongjiang Province at the county level, explored their spatial layout mechanisms, characterized their regional spatial connections, and included agricultural agglomeration and agricultural reclamation in our influencing factor analysis. While enriching the current research on ALEs, this paper still has some limitations that demand more thorough explorations in the future. On the one hand, due to limitations in data collection, the selection of variables for the influencing factor analysis was restricted, which prevented a more detailed exploration. For example, financial and technological factors were only considered in the AGGLO variable. Although the results of the county-level analysis are more accurate, difficulties in obtaining data can easily lead to a lack of some key variables. On the other hand, because of significant differences in spatial scope, research scale, and sample size, the analysis in this paper did not include ALE branches outside Heilongjiang Province and only studied branches within the province. There are differences in the main functions and spatial layout mechanisms between the branches within and outside the province. In the future, the comparative analysis of ALE branches both within and outside the province should be strengthened. In addition, the interprovincial and international connections between ALEs are crucial for understanding regional agricultural trade and industrial cooperation, which also deserve attention.

Author Contributions

T.W.: Conceptualization, Methodology, Software, Visualization, Writing Original draft preparation, Writing—Reviewing and Editing. Y.M.: Investigation, Supervision, Validation. S.L.: Data curation. All authors have read and agreed to the published version of the manuscript.

Funding

The research was funded by the Strategic Priority Research Program of the Chinese Academy of Sciences under Grant number XDA28070501.

Institutional Review Board Statement

Not applicable.

Data Availability Statement

Not applicable.

Acknowledgments

We would like to express our gratitude to the editors and anonymous reviewers for their helpful suggestions and corrections.

Conflicts of Interest

The authors declare no conflict of interest.

References

  1. Zhang, W. The Economics of Location; The Commercial Press: Beijing, China, 2022; pp. 123–176. (In Chinese) [Google Scholar]
  2. Townroe, P.M. Rationality in industrial location decisions. Urban Stud. 1991, 28, 383–392. [Google Scholar] [CrossRef]
  3. Granovetter, M. Economic action and social structure: The problem of embeddedness. Am. J. Sociol. 1985, 91, 481–510. [Google Scholar] [CrossRef]
  4. Li, X.; Hu, X. Progress of corporate geography research in China. Econ. Geogr. 2021, 41, 33–41. (In Chinese) [Google Scholar] [CrossRef]
  5. Song, Y.; Wang, T.; Zhang, Y.; Qian, S.; Wang, S. Spatial pattern evolution and import factors of location choice of enterprises in Northeast China. Sci. Geogr. Sin. 2021, 41, 1199–1209. (In Chinese) [Google Scholar] [CrossRef]
  6. Ma, R.; Liu, L.; Wu, L.; Li, J.; Zhang, W.; Luo, M.; Yuan, J. Spatio-temporal evolution and influencing factors of agricultural and animal husbandry enterprises in Qinghai-Tibet Region. Econ. Geogr. 2022, 42, 133–141. (In Chinese) [Google Scholar] [CrossRef]
  7. Zhao, Q.; Wang, Y. The spatial pattern and influencing factors of China’s organic livestock enterprises under the link of functional location. Trop. Geogr. 2022, 42, 878–888. (In Chinese) [Google Scholar] [CrossRef]
  8. Han, Z.; Hu, Y. Spatial pattern evolution of cluster and the impacts of firms’ location choices of marine fisheries sector in Dalian. Sci. Geogr. Sin. 2021, 41, 634–644. (In Chinese) [Google Scholar] [CrossRef]
  9. Yang, X.; Liu, A.; Jia, P.; Xue, L. Spatial pattern and evolution mechanism of China’s soybean processing plants. J. Nat. Resour. 2019, 34, 1440–1456. (In Chinese) [Google Scholar] [CrossRef]
  10. Chen, R.; Yang, W.; Zhang, Z. Problems and countermeasures in benefit linkage between agricultural leading enterprises and farmers. Asian Agric. Res. 2020, 12, 17–23. [Google Scholar] [CrossRef]
  11. Schneider, M. Dragon head enterprises and the state of agribusiness in China. J. Agrar. Chang. 2017, 17, 3–21. [Google Scholar] [CrossRef]
  12. Lin, G.; Takahashi, Y.; Nomura, H.; Yabe, M. Policy incentives, ownership effects, and firm productivity—Evidence from China’s agricultural leading firms program. Econ. Anal. Policy 2022, 73, 845–859. [Google Scholar] [CrossRef]
  13. Zhang, Y.; Cai, Z.; Zhang, L. Empirical research on leading agricultural enterprises’ knowledge spillover effects on family farms: Example in Heilongjiang Province. Issues Agric. Econ. 2014, 35, 10–16. (In Chinese) [Google Scholar] [CrossRef]
  14. Yu, Q.; Zhang, L. On core competitiveness of agricultural leading enterprises in Jilin Province. J. Beihua Univ. (Soc. Sci.) 2021, 22, 96–102. (In Chinese) [Google Scholar] [CrossRef]
  15. Schmidtner, E.; Lippert, C.; Engler, B.; Häring, A.M.; Aurbacher, J.; Dabbert, S. Spatial distribution of organic farming in Germany: Does neighbourhood matter? Eur. Rev. Agric. Econ. 2012, 39, 661–683. [Google Scholar] [CrossRef]
  16. Filippi, M.; Triboulet, P.; Chantelot, S.; Peres, S. The spatial distribution of French agricultural cooperatives: An exploratory spatial data analysis. Eur. Plan. Stud. 2015, 23, 710–732. [Google Scholar] [CrossRef]
  17. Corsi, A.; Novelli, S.; Pettenati, G. Producer and farm characteristics, type of product, location: Determinants of on-farm and off-farm direct sales by farmers. Agribusiness 2018, 34, 631–649. [Google Scholar] [CrossRef]
  18. Xiong, Y.; Zhang, M.; Liu, Y.; Jin, S.; Li, R. Spatial distribution characteristics of agricultural leading enterprises in agricultural industrialization. Prog. Geogr. 2009, 28, 991–997. (In Chinese) [Google Scholar]
  19. Jiang, H.; Liu, Z. The spatial distribution and influencing factors of the Leading Enterprises in China’s Agricultural Industrialization. J. Jishou Univ. (Soc. Sci.) 2020, 41, 94–101. (In Chinese) [Google Scholar] [CrossRef]
  20. Liu, S.; Zhang, P. Agglomeration and geographic pattern of agricultural industry in northeast China. Res. Agric. Mod. 2013, 34, 591–596. (In Chinese) [Google Scholar]
  21. Wang, R.; Zhao, M. The distribution characteristics and influencing factors of agriculture-related leading enterprises in Shanxi Province under the background of rural revitalization. J. Agric. 2022, 12, 92–100. (In Chinese) [Google Scholar]
  22. Bai, R.; Zhang, J.; Wei, Y.; Lv, L. Data mining of spatial distribution characteristics of agricultural leading enterprises in Fuyang City. J. Fuyang Norm. Univ. (Nat. Sci.) 2019, 36, 95–100. (In Chinese) [Google Scholar] [CrossRef]
  23. Matyja, M. Resources based factors of competitiveness of agricultural enterprises. Management 2016, 20, 368–381. [Google Scholar] [CrossRef]
  24. Wojtyra, B.; Kossowski, T.M.; Březinová, M.; Savov, R.; Lančarič, D. Geography of craft breweries in Central Europe: Location factors and the spatial dependence effect. Appl. Geogr. 2020, 124, 102325. [Google Scholar] [CrossRef]
  25. Spoor, M.; Visser, O. Restructuring postponed? Large Russian farm enterprises ‘coping with the market’. J. Peasant Stud. 2004, 31, 515–551. [Google Scholar] [CrossRef]
  26. Xie, Y.; Chen, Z.; Boadu, F.; Tang, H. How does digital transformation affect agricultural enterprises’ pro-land behavior: The role of environmental protection cognition and cross-border search. Technol. Soc. 2022, 70, 101991. [Google Scholar] [CrossRef]
  27. Huang, S.; Nik Azman, N.H. Enhancing Food Security through Digital Inclusive Finance: Evidence from Agricultural Enterprises in China. Int. J. Environ. Res. Public Health 2023, 20, 2956. [Google Scholar] [CrossRef]
  28. Zhou, J.; Fan, X.; Yu, A. The impact of high-speed railway accession on agricultural exports: Evidence from Chinese agriculture-related enterprises. Complexity 2021, 2021, 4225671. [Google Scholar] [CrossRef]
  29. Bojnec, Š.; Latruffe, L. Farm size, agricultural subsidies and farm performance in Slovenia. Land Use Policy 2013, 32, 207–217. [Google Scholar] [CrossRef]
  30. Gillespie, J.; Mishra, A. Off-farm employment and reasons for entering farming as determinants of production enterprise selection in US agriculture. Aust. J. Agric. Resour. Econ. 2011, 55, 411–428. [Google Scholar] [CrossRef]
  31. Gerbeau, Y.M.; Avallone, G. Producing cheap food and labour: Migrations and agriculture in the capitalistic world-ecology. Soc. Chang. Rev. 2016, 14, 121–148. [Google Scholar] [CrossRef]
  32. Li, X. Corporate Geography; Science Press: Beijing, China, 1999; pp. 5–12. (In Chinese) [Google Scholar]
  33. Announcement of the List of “Top 100” Agricultural Industrialization Enterprises in Heilongjiang Province in 2020. Available online: http://nynct.hlj.gov.cn/nynct/c115378/202102/c00_31224157.shtml (accessed on 17 April 2023).
  34. Clark, P.J.; Evans, F.C. Distance to nearest neighbor as a measure of spatial relationships in populations. Ecology 1954, 35, 445–453. [Google Scholar] [CrossRef]
  35. King, L.J. The analysis of spatial form and its relation to geographic theory. Ann. Assoc. Am. Geogr. 1969, 59, 573–595. [Google Scholar] [CrossRef]
  36. Shi, Z.; Zhou, Y. Theory and Practice of Spatial Analysis; Science Press: Beijing, China, 2020; pp. 70–79. (In Chinese) [Google Scholar]
  37. Rosenblatt, M. Remarks on some nonparametric estimates of a density function. Ann. Math. Stat. 1956, 27, 832–837. [Google Scholar] [CrossRef]
  38. Parzen, E. On estimation of a probability density function and mode. Ann. Math. Stat. 1962, 33, 1065–1076. [Google Scholar] [CrossRef]
  39. Anselin, L. Local indicators of spatial association—LISA. Geogr. Anal. 1995, 27, 93–115. [Google Scholar] [CrossRef]
  40. Wang, J.; Liao, Y.; Liu, X. Tutorial of Spatial Data Analysis, 2nd ed.; Science Press: Beijing, China, 2019; pp. 90–92. (In Chinese) [Google Scholar]
  41. Chen, Y.; Liu, J. Reconstructing Steindl’s Model: From the law of allometric growth to the Rank—Size Rule of urban systems. Sci. Geogr. Sin. 2001, 21, 412–416. (In Chinese) [Google Scholar] [CrossRef]
  42. Li, X.; Xu, J.; Hai, B. The changing distribution patterns of rural settlements during the process of urbanization: The case of Gongyi (1929–2013), China. Acta Geogr. Sin. 2015, 70, 1870–1883. (In Chinese) [Google Scholar] [CrossRef]
  43. Ma, C.; Wang, H.; Tan, B.; Zhou, J.; Dai, X.; Wang, X. Characteristics and spatial reconstruction of an urban-rural settlement scale system in a typical oasis in Xinjiang: A case study of the Ugan-Kuqa River Delta Oasis. Acta Geogr. Sin. 2022, 77, 852–868. (In Chinese) [Google Scholar] [CrossRef]
  44. Wang, J.; Xu, C. Geodetector: Principle and prospective. Acta Geogr. Sin. 2017, 72, 116–134. (In Chinese) [Google Scholar] [CrossRef]
  45. Tang, H.; Luo, Q. Introduction to Regional Development of Agriculture; Science Press: Beijing, China, 2008; pp. 213–215. (In Chinese) [Google Scholar]
  46. Li, Y.; Sheng, K.; Lu, C. Regional differences and influencing factors in the development of agricultural industrialization. Jiangsu J. Agric. Sci. 2021, 37, 763–771. (In Chinese) [Google Scholar] [CrossRef]
  47. Liu, Z.; Zhong, H.; Li, Y.; Wen, Q.; Liu, X.; Jian, Y. Change in grain production in China and its impacts on spatial supply and demand distributions in recent two decades. J. Nat. Resour. 2021, 36, 1413–1425. (In Chinese) [Google Scholar] [CrossRef]
  48. Zhao, L.; Ruan, J.; Shi, X. Local industrial policies and development of agricultural clusters: A case study based on a tea cluster in China. Int. Food Agribus. Manag. Rev. 2021, 24, 267–288. [Google Scholar] [CrossRef]
  49. Li, E.; Yao, F.; Xi, J.; Guo, C. Evolution characteristics of government-industry-university-research cooperative innovation network for China’s agriculture and influencing factors: Illustrated according to agricultural patent case. Chin. Geogr. Sci. 2018, 28, 137–152. [Google Scholar] [CrossRef]
  50. Yang, J.; Zhang, Y.; Chen, L. Fuzzy-set qualitative comparative analysis of factors that influence skilled talents scarcity in agricultural industry: Case study of 14 cities in Hunan Province. Agronomy 2022, 12, 3155. [Google Scholar] [CrossRef]
  51. Weng, Y.; Zeng, Y.; Lin, W. Do rural highways narrow Chinese farmers’ income gap among provinces? J. Integr. Agric. 2021, 20, 905–914. [Google Scholar] [CrossRef]
  52. Ye, Y.; Qi, Q.; Jiang, L.; Zhang, A. Impact factors of grain output from farms in Heilongjiang reclamation area based on geographical detector. Geogr. Res. 2018, 37, 171–182. (In Chinese) [Google Scholar] [CrossRef]
  53. Han, C. The governmental responsibilities of state-owned farms and their transformation. Chin. Rural Econ. 2018, 5, 2–18. (In Chinese) [Google Scholar]
  54. Zang, S. Geography of Heilongjiang Province; Beijing Normal University Press: Beijing, China, 2014; pp. 199–201. (In Chinese) [Google Scholar]
Figure 1. Location of Heilongjiang Province.
Agriculture 13 02061 g001
Figure 2. Headquarters and branches of ALEs in Heilongjiang Province.
Agriculture 13 02061 g002
Figure 3. Spatial distribution hotspots of ALEs in Heilongjiang Province.
Agriculture 13 02061 g003
Figure 4. Spatial agglomeration pattern of ALEs in Heilongjiang Province.
Agriculture 13 02061 g004
Figure 5. Regional spatial connections of ALEs in Heilongjiang Province.
Agriculture 13 02061 g005
Figure 6. The rank-size model of ALEs in Heilongjiang Province.
Agriculture 13 02061 g006
Figure 7. Results of interaction detection.
Agriculture 13 02061 g007
Figure 8. The change in the number of enterprises with increasing distance from the provincial capital.
Agriculture 13 02061 g008
Figure 9. Spatial layout mechanism of ALEs in Heilongjiang Province.
Agriculture 13 02061 g009
Table 1. Interaction type determination.
CriterionType
q(x1x2) < Min(q(x1),q(x2))Weakened, nonlinear
Min(q(x1),q(x2)) < q(x1x2) < Max(q(x1),q(x2))Weakened, unique
q(x1x2) > Max(q(x1),q(x2))Enhanced, bilinear
q(x1x2) = q(x1) + q(x2)Independent
q(x1x2) > q(x1) + q(x2)Enhanced, nonlinear
Note: Min(q(x1),q(x2)) and Max(q(x1),q(x2)) refer to the smaller and larger values between q(x1) and q(x2), respectively.
Table 2. Nearest neighbour analysis results.
SampleNumber (Unit)Nearest Neighbour IndexZ Scorep ValueSpatial Distribution Relationship
Headquarters1000.430−10.8860.000Significant agglomeration
Branches1500.581−9.7940.000Significant agglomeration
Table 3. Indicator selection and description.
DimensionIndicatorDescriptionUnit
EconomyGross domestic product (GDP)From the 2021 Heilongjiang Statistical Yearbook108 yuan (CNY)
Distance from the provincial capital (DFC)Calculated the nearest driving distance between each county government and Harbin railway station according to the Baidu mapkm
TransportationHighway mileage (HM)The data were from the 1:1,000,000 basic geographic information data (public edition) released by the Ministry of Natural Resources of China, including expressways, national highways, provincial highways, county highways, township roads, and ordinary streets.km
Railway mileage (RM)The data were from the 1:1,000,000 basic geographic information data (public edition) released by the Ministry of Natural Resources of China, including only railways.km
AgglomerationNumber of supporting
Enterprises (AGGLO)
From the Qichacha website, the data timeframe is before 1 January 2021unit
MarketNumber of permanent
residents (POP)
From the 2021 Heilongjiang Statistical Yearbookperson
TalentNumber of people with Bachelor’s degrees or above (BDOA)From the Tabulation on 2020 China Population Census by Countyperson
Agricultural
reclamation
Number of state farms in
Heilongjiang Province (FARM)
The farm list was derived from the 2021 Statistical Yearbook of Heilongjiang State Farms. Each farm’s coordinates were obtained through the Baidu map location system. After coordinate correction, the state farm numbers in each county were statistically counted by administrative boundaries.unit
ResourcePer capita grain yield (PG)Grain yield in each county/number of permanent residents in each county. The data were from the 2021 Heilongjiang Statistical Yearbook.t/person
Table 4. Results of factor detection.
IndicatorHeadquartersBranches
GDP0.829 **/
DFC0.153 *0.182 *
HM/0.188 *
RM0.819 **/
AGGLO0.868 **/
POP0.858 **/
BDOA0.812 **/
FARM/0.805 **
PG/0.281 **
Note: * and ** represent 0.05 and 0.01 significance levels, respectively; / represents that the significance test fails.
Table 5. Results of the Pearson correlation coefficient.
IndicatorHeadquartersBranches
Correlation CoefficientAction DirectionCorrelation CoefficientAction Direction
GDP0.835 **+
DFC−0.339 **//
HM 0.432 **+
RM0.632 **+
AGGLO0.909 **+
POP0.985 **+
BDOA0.882 **+
FARM 0.773 **+
PG 0.436 **+
Note: ** represents 0.01 significance level; / represents nonsignificant correlation; + indicates the direction of action is positive; − indicates the direction of action is negative.
Disclaimer/Publisher’s Note: The statements, opinions and data contained in all publications are solely those of the individual author(s) and contributor(s) and not of MDPI and/or the editor(s). MDPI and/or the editor(s) disclaim responsibility for any injury to people or property resulting from any ideas, methods, instructions or products referred to in the content.

