Abstract
During variable-rate spraying in orchards, the atomization characteristics and distribution of droplets in and out of the target area can be affected by the sprayer pressure. In this study, a variable-rate spraying control system test bench was designed, and a hollow cone nozzle QY82.317.22 was selected. The droplet atomization characteristics, including volume median diameter (Dv0.5), the relative span of the droplet spectrum, and droplet velocity at different spray pressures, were studied at distances ranging from 0.4 to 2.4 m from the nozzle orifice with an air velocity of 10 m/s at the nozzle orifice position. The effects of longitudinal distance, transverse distance, and spray pressure on Dv0.5, relative span, and droplet velocity were analysed by multiple linear regression analysis, and the regression model was established. The experimental results show that at a longitudinal distance of 1.8 m, Dv0.5 ranges from 120 to 150 μm, meeting the requirements for optimal droplet size for controlling crawling pests and plant diseases on crop leaves; and the relative span is 1.2, indicating a wide droplet spectrum. At different pressure conditions, Dv0.5 decreases as pressure increases. Through multiple linear regression analysis, the longitudinal distance, the transverse distance, and the spray pressure have high significance for Dv0.5 and the droplet velocity. The longitudinal distance and the transverse distance have a highly significant effect on the relative span. In this study, the mathematical relational model of droplet characteristics at different spatial positions and different pressures was established, providing an agricultural reference for predicting the droplet characteristics at different spatial positions to achieve the best application effect. This model is conducive to the effective use of pesticides and reduces environmental pollution.
1. Introduction
The purpose of variable-rate spraying in orchards is to spray the target area with a reasonable amount of pesticide solution, depositing it evenly on the leaves to meet the requirements of orchard tree pest control. The atomization characteristics of the spraying will be affected by factors such as the spray position and spray angle, which will cause droplet drift and environmental pollution. Droplet drift is the phenomenon in which the sprayer forms a droplet group through the nozzle to the target area during the spraying process and deposits in the nontarget area with the airflow direction [1,2,3,4]. The main factor affecting the drift of droplets is the droplet size. Droplets with small particle sizes have a good coverage density and deposition uniformity, which can form Brownian motion with the direction of the wind movement inside the canopy and have good penetration ability. Small-particle-size droplets are well deposited on the front and back of the blade, which is a performance that large-particle-size droplets do not have [5,6,7]. At present, to improve the droplet deposition performance, surfactants are added during the spray process, but it is easy to cause the droplets to become so small that they increase the risk of droplet drift. The droplet size and velocity will affect their spatial deposition and distribution on the target. Studying the atomization characteristics of droplets can provide a basis for the effective deposition of droplets during spray operations [8,9,10].
Droplet size and spray droplet deposition have an important influence on the control of orchard tree pests and diseases. According to research on pesticide application technology, there is a relationship between the particle size of droplets and the efficacy of pesticides, and the most efficacious diameter of the droplets is called the biological optimal particle size. For flying insect pests, the optimal biological particle size is 10~50 μm. The best biological particle size for crop leaf reptile larvae is 30~150 μm. Fungicide has a good effect on the size of 30~150 μm for plant disease. The coarse droplet size of 100~300 μm is more suitable for controlling weeds [11]. Washington [12] studied two kinds of fungicides at different droplet sizes and deposition densities on banana Black Sigatoka disease. It was concluded that the two fungicides resulted in no germination of banana Black Sigatoka when Dv0.5 was 250 μm and the deposition density was 50 droplets , or when Dv0.5 was 602 μm and the deposition density was 10 droplets . Thus, the droplet size and droplet deposition density have a significant impact on the prevention and control of pests and diseases.
Droplet velocity is an important factor in the effective use of pesticides. Due to the kinetic energy of the droplets themselves, when the droplets hit the surface of the crop object, the droplets will expand on the surface of the leaves. The surface tension of the droplet will absorb this kinetic energy, which prevents the droplet from spreading outwards. If the kinetic energy loss is small, the droplet will bounce off the object; otherwise, it will adhere to the surface of the object [13,14,15,16]. If the droplets hit the surface at a high speed, the surface tension may not be sufficient to maintain its integrity, and the droplets will shatter into finer droplets [17]. Research on the atomization characteristics of droplets aims to minimize the risk of droplet drift during air delivery and to ensure the blade surface adheres to the most reasonable droplet characteristics under the premise of satisfying the spraying effect.
The droplet evaluation indexes of sprayers mainly include the droplet size, droplet spectrum and droplet uniformity, which also affect the deposition effect of droplets. Measuring the droplet size is important for evaluating spray technologies [18,19,20]. Dai et al. [21] studied the impacts of the pipeline spray pressure and nozzle spray aperture on the droplet parameters of hollow cone nozzles. Moreover, they used a comprehensive experimental platform and laser particle analyser to measure the droplet size scattering spectrum of hollow cone nozzles with three different apertures at different pressures. The results show that the larger the pressure and the smaller the aperture are, the smaller the droplet size and the more uniform the particle size. Li et al. [22] analysed and compared the droplet size and velocity distribution in the atomization area of three nozzle types at different pressure conditions and studied the distribution of droplet size and velocity space in different nozzle atomization areas at different adjuvants and spray pressures. The results showed that Dv0.5 did not change significantly in the vertical direction of the nozzle centre but increased gradually in the horizontal direction with an increasing distance. At the same position, the droplet size decreased as pressure increased, and the droplet velocity increased. This experiment can provide a basis for the selection of adjuvants and nozzles in pesticide applications. It also provides a data basis for studying the distribution of droplets on the target. Nuyttens et al. [23] studied the velocity characteristics of droplet sizes measured at 0.5 m below the nozzle by using a droplet measuring device according to 13 combinations, such as the spray pressure, nozzle type, and nozzle size. The experimental results show that the size of the droplets and the velocity of the droplets were affected by the above three factors. The droplet velocity is related to the droplet size and spray speed; the larger the droplet size is, the higher the droplet velocity, and the smaller the droplet size is, the smaller the droplet velocity. Aiming at the problems of less mathematical description of flat-fan nozzle atomization characteristics and insufficient pesticide application theories, Li et al. [24] analysed relevant spray parameters and studied the influences of the spray angle, spray pressure, nozzle equivalent hole diameter, and spatial atomization position on the atomization characteristics of the nozzle. The droplet size is positively correlated with the nozzle equivalent hole diameter at a certain spray pressure and spray angle. The spray angle and spray distance are negatively correlated with the droplet velocity, which has a great influence on the droplet velocity and particle size in the horizontal direction of the X-axis, and the spray distance has no effect on the droplet size in the axial direction of the spray.
For air-assisted spraying in orchards, air is required to transport droplets into the canopy, which affects the particle size and speed of droplets. There are few studies on the atomization characteristics of droplets moving along the air direction to the canopy space area [25]. Most of the studies are based on the spray angle, spray pressure, equivalent orifice diameter of nozzles, and spatial position under a low-pressure spray environment. There are few studies on the reasonable atomization parameters of nozzles suitable for high-pressure spraying in orchards. The working direction of orchard air-assisted spraying nozzles is different from that of field spraying. Compared with the vertical downwards direction of field spraying, the gravity of droplets should be considered in orchard air-assisted spraying. Small spray droplets are attached to the surface of leaves, and the deposition state of droplets on the surface of orchard trees is greatly affected by the physicochemical properties of the droplets [26]. The existing research on droplet characteristics has not considered the spatial variation characteristics of droplets affected by gravity in the air field.
Changing the spraying pressure will cause changes in parameters such as the droplet size, droplet velocity, and droplet spectrum in space, resulting in unsatisfactory pest control effects and environmental pollution. In this manuscript, variable-rate spraying was completed by changing the spraying pressure. The atomization characteristics of hollow cone nozzles at different pressure conditions were studied. According to the changes and spatial distributions of droplet atomization characteristics in spray field space at different pressure conditions, the variation of the droplet size, droplet velocity, and relative span of the droplet spectrum at different positions in space were studied. This study provides a reliable basis for the follow-up development of droplet anti-drift in the prevention and control of pests and diseases in different orchard trees and has important guidance and reference significance for the design of orchard air-assisted sprayers and the adjustment of operating parameters.
2. Materials and Methods
2.1. Overall Design of the Test Bench
The overall design of the test bench system for the atomization characteristics of the hollow cone nozzle mainly includes the variable-rate spraying control system and the droplet size measuring system.
2.1.1. System Hardware Structure
The composition of the variable-rate spraying control system is shown in Figure 1. The system consists of four parts: a spray pressure control module, air speed control module, a spray module, and a host computer. The main hardware models and parameters of the system are shown in Table 1.
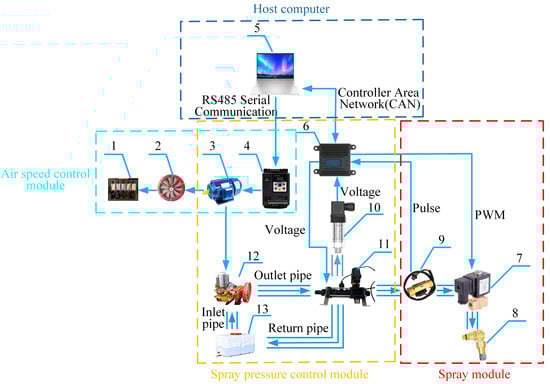
Figure 1.
Variable-rate spraying control system composition. 1. anemometer, 2. fan, 3. three-phase asynchronous motor, 4. frequency converter, 5. notebook computer, 6. C37 controller, 7. solenoid valve, 8. nozzle, 9. flow sensor, 10. pressure sensor, 11. pressure-regulating valve, 12. plunger pump and 13. water tank.

Table 1.
Main hardware models and parameters.
As shown in Figure 2, the droplet size measuring instrument is an Oxford laser VisiSize P15 portable particle image velocimetry and particle/droplet image analysis (PDIA) (British, OXFORD LASERS Ltd., Didcot, UK). VisiSize software obtains graphics through the camera and performs threshold processing, and up to 1000 particles can be processed per frame. The measurement area is a field of view of 10,965 6246 μm, and the detection depth is 50,000 μm. The centre of the measurement area is 0.35 m away from the edge of the lifting platform and 0.97 m away from the ground. The PDIA is fixed on the lifting platform. The height is determined by adjusting the height of the lifting platform. To ensure the central measurement area, the measurement positions on the ground are vertically arranged in a cross pattern with grid lines. The lifting platform moving wheel always moves along the grid line to ensure each measurement position. The vertical position calibration plate is arranged at the lifting platform. The vertical scale line is drawn on the position calibration plate, which is coplanar with the centre point of the droplet size measurement area. The specific implementation process of droplet characteristic measurement is as follows. First, the PDIA is moved to the measurement point of the space spray field. Second, the spray control system test bench provides a stable spray field. According to the host computer display interface and the anemometer, the spray pressure and air speed are observed to meet the preset target. After the pipeline pressure and air speed are stabilized, the computer is controlled to open the PDIA. The light source projection module of the PDIA emits a laser beam, and the droplets irradiated to the measurement area form a shadow image in front of the lens. Finally, according to the size of the droplet shadow image, Dv0.5 and the droplet spectrum are measured. For the measurement of the droplet velocity, the relative moving position of the droplet in the measurement area is obtained by setting the emission time interval of the laser beam before and after, and then the droplet velocity is calculated.
Figure 2.
Experimental platform of the droplet size measuring instrument: 1. variable-rate spraying control system test bench, 2. droplet particle size measurement area, 3. droplet particle size measuring instrument, 4. lifting platform, 5. position calibration plate, and 6. grid line.
2.1.2. System Software
The frequency of the converter was set with the host computer. The frequency converter controls the speed of the three-phase asynchronous motor according to the frequency value to adjust the air speed. The anemometer displays the air speed in real time to determine whether the fan is adjusted to the target speed.
The three-phase asynchronous motor is also used as the power for the fan and the plunger pump. It is necessary to adjust the pipeline pressure of the system under the condition that the air speed is constant. The pressure of the pipeline can be changed by adjusting the opening of the pressure-regulating valve. The pipeline pressure of the system is adjusted by the incremental PID control method. The host computer sends the target pipeline pressure to the C37 controller through the CAN communication command. The pressure sensor collects the pipeline pressure data of the system in real time, converts it into a voltage signal of 0~5 V, and outputs it to the C37 controller. The C37 controller converts the voltage signal transmitted by the pressure sensor into a digital signal for pressure calculation to obtain the real-time pressure of the pipeline. The incremental PID control method is used to calculate the actual increment by comparing the target pressure with the actual pressure. The C37 controller determines the opening direction of the pressure-regulating valve according to the actual increment value and outputs a voltage signal of ±12 V to the pressure-regulating valve. The pressure control is completed by controlling the opening size of the pressure-regulating valve.
The flow sensor obtains the pipeline flow in real time and transmits the data to the C37 controller in real time through the pulse signal. The C37 controller calculates the system pipeline flow in real time through the pulse signal. The C37 controller transmits the system pipeline pressure data and pipeline flow to the host computer in real time through CAN communication. Through the host computer nozzle flow pulse width modulation (PWM) control software, the PWM duty cycle is set to 0 and 100% to control the closing and opening of the solenoid valve, respectively.
2.2. Measurement Method
During spraying in orchards, the droplets were significantly affected by gravity and the distance between the nozzle and the orchard tree. There were droplets that had not yet reached the target area and landed on the ground. To study the atomization characteristics of the hollow cone nozzle in space, the lowest nozzle of the spraying test bench was selected as the research object. The droplets were most likely to cause droplet drift. To study the droplet variation characteristics of the conical nozzle in the whole air field, the droplet variation characteristics of the nozzle at this position in the whole spraying test typhoon field were selected. The atomization characteristics of unilateral conical nozzles in the space of 02.5 m were studied with a standardized row spacing of 45 m of the orchard. To reduce the complexity of the experiment, 0.4 m was used as the initial distance detection point. The measuring points of the hollow cone nozzle in the spatial field were arranged as shown in Figure 3. With the increase in the longitudinal distance X, the air speed of the fan runs from a fast operating speed to the slowest operating speed and the space measurement area interval was divided from small to large. The intervals are 0.4 m, 0.6 m, 0.8 m, 1.2 m, 1.8 m, and 2.4 m (Figure 3). The centre point of the measurement area was at the same height as the centreline of the nozzle. According to the existing research, the spray field of the hollow cone nozzle has a centrally symmetric ring shape [27]. The left red area in the whole spray field is the measurement position of the droplet characteristics.
Figure 3.
Layout of the spatial spray field measurement points of a hollow cone nozzle.
The experiment was carried out in the Precision Spray Laboratory of the National Agricultural Intelligent Equipment Engineering Technology Research Center in Xiaotangshan Town, Changping District, Beijing. In this paper, the air speed of the nozzle orifice position of the experimental platform was 10 m/s; the liquid being measured was water; the pipe pressures were 0.6 MPa, 0.7 MPa, 0.8 MPa, 0.9 MPa, and 1.0 MPa, and the corresponding flow rates of the nozzle were 0.66 L/min, 0.71 L/min, 0.76 L/min, 0.80 L/min, and 0.83 L/min, respectively. The average indoor temperature was 20 °C. The variation characteristics of Dv0.5, relative span of the droplet spectrum, and droplet velocity were studied. To ensure the reliability of the experimental data, each measurement was repeated three times, and at least 10,000 droplet data points were measured each time [28,29,30]. The droplet measurement range was 05000 μm, and the droplet velocity measurement range was 050 m/s.
2.3. Droplet-Related Parameters
Droplet velocity: the average velocity of all particles is measured at each measurement position.
- Dv0.1: 10% of the total volume is carried by droplets lower than Dv0.1.
- Dv0.5: 50% of the total volume is carried by droplets lower than Dv0.5.
- Dv0.9: 90% of the total volume is carried by droplets lower than Dv0.9.
Relative span of the droplet spectrum: relative span is used to describe the ranges of droplet size spectra within a spray, which is a dimensionless parameter.
The smaller the dimensionless value A is, the narrower the droplet spectrum is. If the required range of the best biological control droplet size is known, the appropriate droplet size range can be obtained by changing the relevant parameters [31,32].
To improve the atomization of droplets, spraying in orchards generally requires higher pressure for spraying operations. Combined with the existing orchard field test research, a 1 MPa pipeline pressure was selected for the droplet atomization characteristics test [33,34,35]. It is used to study the atomization characteristics and spatial distribution characteristics of droplets at different spatial distances.
2.4. Data Processing and Analysis
To study the characteristics of droplets at different spatial positions under different pressure conditions, Excel 2021 and Origin 2021 software were used to sort and draw the experimental results. MATLAB 2021 software was used to analyse the data and establish a multiple linear regression model.
3. Results
3.1. The Characteristics of Volume Median Diameter and Multiple Linear Regression Significance Analysis
3.1.1. The Characteristics of Volume Median Diameter
The nozzle spray field is approximately a hollow cone. The farther the cross-section is from the nozzle orifice, the larger the annular section. There are few droplets at the centre of the spray field cross-section and more droplets at the edge position. At a pressure of 1 MPa, the Dv0.5 distributions along the X-axis and Y-axis directions on each axis are shown in Figure 4. Figure 4a shows that Dv0.5 at three measurement points at a close distance of X = 0.4 m increases with an increasing Y-value. At the other X distances, Dv0.5 increases first and then decreases. When the distance from the nozzle orifice is X = 1.8 m and X = 2.4 m, Dv0.5 is 120 μm140 μm in the Y-axis direction. The Dv0.5 fluctuation is more stable. The peak value of Dv0.5 is less than the peak diameter at X = 0.6 m, X = 0.8 m, and X = 1.2 m. When Y = 0.4 m, Dv0.5 at X = 1.8 m is larger than that at X = 2.4 m.
Figure 4.
Change in Dv0.5 at a pressure of 1 MPa. (a) Dv0.5 change in the transverse direction; (b) Dv0.5 change in the longitudinal direction.
Figure 4b shows the direction of the nozzle centreline longitudinal X at section divisions of Y = 0 m, Y = 0.1 m, Y = 0.2 m, Y = 0.3 m, Y = 0.4 m, and Y = 0.5 m. Moreover, the Y-axis is analysed along the nozzle orifice from different distances X on the Dv0.5 change trend. At the centreline of the nozzle Y = 0 m, as the X value increases, Dv0.5 increases, but it is smaller than Dv0.5 at each point on Y = 0.1 m, Y = 0.2 m, and Y = 0.3 m. Dv0.5 at the positions of Y = 0.1 m, Y = 0.2 m, and Y = 0.3 m first increases, then decreases, and finally increases along the X-axis direction. At Y = 0.4 m, Dv0.5 first increases and then decreases. The change in Dv0.5 at the two measurement points at Y = 0.5 m is not obvious.
Dv0.5 at different pressures is shown in Figure 5. To compare and analyse as much as possible with more data, the cross-section of the position X = 1.8 m from the nozzle orifice is selected. The distance of X = 1.8 m is also closer to the position of the unilateral sprayer to the centreline of the tree row in the orchard (Figure 5a). The longitudinal section at the centreline of the nozzle at Y = 0 was selected to analyse the change in Dv0.5 at different pressures (Figure 5b). From the analysis of Figure 5a, it can be seen that Dv0.5 decreases as spray pressure increases. With an increasing Y-value, Dv0.5 first increases and then decreases. The distance from the centreline of the nozzle is Y 0.4 m, and Dv0.5 at different pressure conditions does not change significantly.
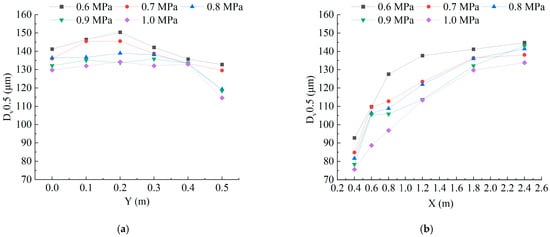
Figure 5.
Change in Dv0.5 at different pressures: (a) X = 1.8 m transverse Dv0.5 change; (b) Y = 0 m longitudinal droplet Dv0.5 change.
As shown in Figure 5b, the position of each point at different pressure conditions decreases as spray pressure increases. When X = 2.4 m, the effect of this law is not obvious. Dv0.5 increases with an increasing distance from the nozzle orifice. When X = 0.4 m and X = 0.6 m, the growth rate of Dv0.5 is the largest at various pressure conditions. When the pressure is 0.7 MPa, 0.8 MPa, and 0.9 MPa, the effect of increasing Dv0.5 at the position of X = 0.6 m to X = 0.8 m is not obvious.
3.1.2. Multiple Linear Regression Significance Analysis of Volume Median Diameter
The multifactor variance analysis and multiple regression analysis of the Dv0.5 of each point in the space at different pressures of 0.6 MPa, 0.7 MPa, 0.8 MPa, 0.9 MPa, and 1.0 MPa were carried out using MATLAB software. To determine whether the factors influencing longitudinal distance X, transverse distance Y, and spray pressure P have a significant influence on Dv0.5 and the response law, it is assumed that the relationship between the dependent variable Dv0.5 and the independent variables longitudinal distance, transverse distance, and spray pressure is a ternary quadratic polynomial.
The significance test of the influence of each factor and the whole model on Dv0.5 is shown in Table 2. In the analysis of Dv0.5, the interaction of spray pressure P2, longitudinal distance X, spray pressure P, transverse distance Y, and spray pressure P have no significant effect on Dv0.5. In order to determine the significance of each factor on the evaluation index, stepwise regression and backward elimination approach were used to analyse the data, and analysis of variance (ANOVA) was performed at a significant level of p = 0.05 [36]. p < 0.001 is used as the probability p-value obtained by the statistical test to be less than the significance level. The model can accurately represent the relationship between the longitudinal distance X, the transverse distance Y, the spray pressure P, and Dv0.5. In the subsequent table, the insignificant items are no longer displayed.
Table 2.
A significance test of the influence of each factor and the whole model on the volume median diameter was carried out.
The longitudinal distance X, the transverse distance Y, and the spray pressure are highly significant for Dv0.5. Therefore, the volume median diameter is changed by changing three factors. The Dv0.5 significance test of the whole model has a highly significant impact, and the determination coefficient R2 = 0.7769. The regression model is:
where Dv0.5 (mm) is the volume mean diameter; X (m) is the longitudinal distance; Y (m) is the transverse distance; and P (MPa) is the spray pressure.
Dv0.5 = 112.8672 + 32.9753X + 204.8911Y − 29.2415P − 5.556X2 − 366.3529Y2 − 30.3372XY
3.2. The Characteristics of Relative Span and Multiple Linear Regression Significance Analysis
3.2.1. The Characteristics of Relative Span
At a pressure of 1 MPa, the relative span distribution along the X-axis and the Y-axis is shown in Figure 6. From Figure 6a, it can be concluded that the relative span at the positions of X = 0.4 m, X = 0.6 m, X = 0.8 m, and X = 1.2 m from the nozzle orifice increases in the Y direction near the edge of the measurement point. When X = 1.8 m and X = 2.4 m, the relative span first increases and then decreases. Moreover, the fluctuation range of the relative span at X = 2.4 m is larger than that at other positions.
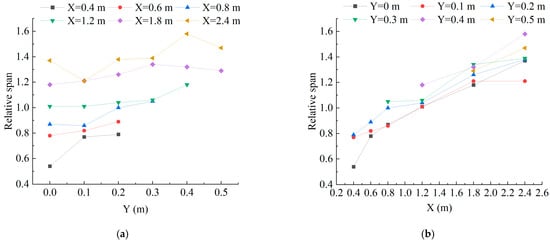
Figure 6.
Change in the relative span at a pressure of 1 MPa. (a) Relative span change in the transverse direction; (b) relative span change in the longitudinal direction.
As shown in Figure 6b, the relative span along the X-axis gradually increases. When the distance from the nozzle orifice is X 1.8 m, the relative span of each Y-value cross-section is significantly different. When X 1.8 m, the relative span at the farthest distance Y = 0.5 m is less than the relative span at Y = 0.4 m.
The relative span at different pressure conditions was analysed on the axis of X = 1.8 m, which is shown in Figure 7. From the analysis of Figure 7a, it can be seen that the relative span is approximately 1.2 at different pressure conditions. The relative span at a pressure of 0.6 MPa has a larger fluctuation range than that at other pressure conditions. As pressure increases, the relative span changes more stably. Compared with other pressures, the relative span gradually increases further away from the nozzle orifice along the centreline of the nozzle at a low pressure of 0.6 MPa. Under the other pressure conditions, the relative span first increases and then decreases. At the cross-section position of X = 1.8 m from the nozzle orifice, the relative span appears to be cross-distributed at different pressure conditions.
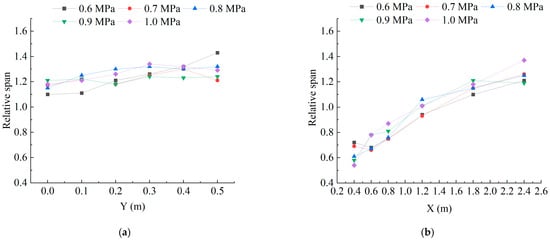
Figure 7.
Change in the relative span at different pressures. (a) X = 1.8 m transverse relative span change; (b) Y = 0 m longitudinal relative span change.
As shown in Figure 7b, the relative span increases further away from the nozzle orifice at different spray pressure conditions. When X = 0.4 m, the relative span decreases as spray pressure increases. However, when X 0.6 m, the relative span at the centreline of the nozzle is in the cross-distribution. Moreover, the change in the relative span at the initial position is no longer obvious. The relative span gradually increases. The effect of the relative span at the centre position is not obvious.
3.2.2. Multiple Linear Regression Significance Analysis of Relative Span
The multifactor variance analysis and multiple regression analysis of each factor and the whole model on the relative span are shown in Table 3. The longitudinal distance X and the transverse distance Y are highly significant to the relative span. The interaction between spray pressure P and transverse distance Y has a significant effect on the relative span. Therefore, the relative span can be well changed by changing the longitudinal distance X and the transverse distance Y. The relative span significance test of the whole model has a highly significant impact. The determination coefficient R2 = 0.9409, and the fitting degree is high. It is assumed that the relationship between the relative span of the dependent variable and the longitudinal distance X, transverse distance Y, and spray pressure P of the independent variable is a ternary quadratic polynomial. According to the McLaughlin expansion, the multiple regression model is as follows:
where A is the relative span; X (m) is the longitudinal distance; Y (m) is the transverse distance; and P (MPa) is the spray pressure.
A = 0.5136 + 0.4423X + 1.4840Y − 0.0623X2 − 1.3516Y2 − 0.4884YP
Table 3.
A significance test of the influence of various factors and the whole model on the relative span was carried out.
3.3. The Characteristics of Droplet Velocity and Multiple Linear Regression Significance Analysis
3.3.1. The Characteristics of Droplet Velocity
At a pressure of 1 MPa, the distribution characteristics of the droplet velocity along the X-axis and the Y-axis are shown in Figure 8. Figure 8a shows that the change rate of the droplet velocity increases with an increasing Y-value at the positions of X = 0.4 m, X = 0.6 m, X = 0.8 m, and X = 1.2 m. At the X = 0.4 m, X = 0.6 m, and X = 0.8 m points, the droplet velocity at the centreline position is significantly greater than the velocity on the other same axis. When X = 1.2 m, X = 1.8 m, and X = 2.4 m, the droplet velocity at the centre of the spray field on the same axis first increases and then decreases as the Y-value increases. With an increasing X value, the peak value of the droplet velocity on the same axis gradually deviates from the centreline position of the nozzle. When X = 1.8 m and X = 2.4 m, there is no significant difference in the droplet velocity at the axis at two different distances, and the droplet velocity at the two positions is stable at approximately 1 m/s.
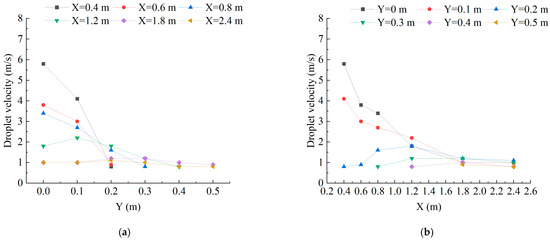
Figure 8.
Change in droplet velocity at a pressure of 1 MPa. (a) Droplet velocity change in the transverse direction; (b) droplet velocity change in the longitudinal direction.
As shown in Figure 8b, the different axes from the centreline of the nozzle along the Y-axis with the change trend of the distance from the nozzle orifice X are analysed. At the positions of Y = 0 m and Y = 0.1 m, the droplet velocity gradually decreases with an increasing X value. It can be seen from the tilt degree of each line in the figure that the velocity change rate gradually decreases. When Y = 0.2 m, Y = 0.3 m, and Y = 0.4 m, the droplet velocity first increases and then decreases with an increasing X-axis distance.
The droplet velocity at X = 1.8 m at different pressure conditions is analysed, as shown in Figure 9. From the analysis of Figure 9a, it can be seen that the droplet velocity at different pressures does not change significantly. The droplet velocity at Y = 0.5 m is the smallest. The droplet velocity is approximately 1 m/s. The difference in the velocity at other points is still not obvious.
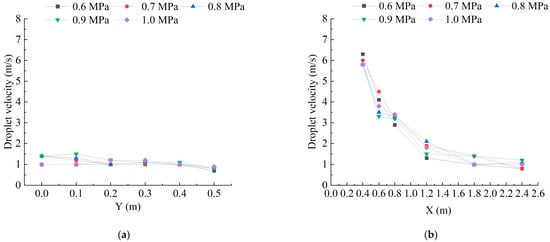
Figure 9.
Change in the droplet velocity at different pressures. (a) X = 1.8 m transverse droplet velocity change; (b) Y = 0 m longitudinal droplet velocity change.
As shown in Figure 9b, at distances of X = 0.4 m, X = 0.6 m, X = 0.8 m, and X = 1.2 m, the velocity change rate at lower pressures of 0.6 MPa and 0.7 MPa is higher than that at other pressures. The velocity of droplets at low pressure at X = 0.4 m and X = 0.6 m is significantly higher than that at high pressure. However, with an increasing distance, this situation is no longer obvious. The velocity of droplets with low pressure at 0.6 MPa decreases significantly less than that of droplets at other pressures after X = 0.8 m.
3.3.2. Multiple Linear Regression Significance Analysis of Droplet Velocity
The significance test of the influence of each factor and the whole model on the droplet velocity is shown in Table 4. The longitudinal distance X, the transverse distance Y, and the spray pressure are highly significant for the droplet velocity. Therefore, the droplet velocity is changed by changing the three factors. The droplet velocity significance test of the whole model has a highly significant impact, and the determination coefficient R2 = 0.8779. The regression model is:
where V (m/s) is the droplet velocity; X (m) is the longitudinal distance; Y (m) is the transverse distance; and P (MPa) is the spray pressure.
V = 6.8079 − 3.607X − 13.3425Y − 1.661P + 0.3390X2 + 6.2268XY + 1.0590XP
Table 4.
A significance test of the influence of various factors and the whole model on droplet velocity was carried out.
4. Discussion
The spray field formed by the hollow cone nozzle has the following spray characteristics at the same horizontal height as the nozzle orifice:
- 1.
- Through the analysis of the multiple linear regression equation and Figure 4a, it can be seen that when the pressure is 1 MPa, along the Y-axis direction, farther away from the centreline of the nozzle, Dv0.5 first increases and then decreases rapidly. The main reason is that the spray field of the nozzle is a hollow cone, and the centre position entrains small droplets. With the increase in the distance from the centreline of the nozzle, Dv0.5 gradually increases until the maximum peak of the axis (the fog-shaped edge of the cone spray), and Dv0.5 far away from the fog-shaped edge drops sharply. This part is mainly due to the influence of the air at the edge of the droplet field, which has a certain amount of small droplets outside the edge of the drifting spray field. In Figure 4b, when Y = 0.1 m, Y = 0.2 m, Y = 0.3 m, and Y = 0.4 m, Dv0.5 increases first, then decreases and then increases with an increasing longitudinal X-axis distance. The main reason is that in the measurement process, the first measurement is the drift of small droplets outside the edge of the hollow cone spray field. As the distance increases, Dv0.5 gradually increases. There are small droplets in the interior of the hollow cone spray field, all of which are small droplets. Dv0.5 drops sharply. When the X value is further increased, the hollow effect of the droplets affected by their own gravity is no longer obvious. The large droplets above the same horizontal plane of the nozzle gradually fall to the measurement point, resulting in Dv0.5 gradually increasing with an increasing X distance. When X = 1.8 m and X = 2.4 m, Dv0.5 along the Y direction is in the range of 120~140 μm. Compared with Dv0.5 at distances of X = 0.6 m, X = 0.8 m, and X = 1.2 m, the peak value is small, and the fluctuation of Dv0.5 at each point is relatively stable. The main reason is that the peak measuring point of Dv0.5 is located at the edge of the spray field at X = 0.6 m, X = 0.8 m, and X = 1.2 m. Through the analysis of Hu et al. [37], it can be seen that droplets with large particle sizes have a short propagation distance, uneven distribution, and poor spray effect. Due to the influence of the droplet’s own gravity, as the distance from the nozzle orifice increases, the air speed effect at the edge position is no longer obvious, resulting in droplets with larger values of Dv0.5 that cannot be measured at the next point. Therefore, the peak value of the Dv0.5 falling at a close distance is greater than the peak value of Dv0.5 falling at a long distance. The optimal biological particle size for flying insects is 10~50 μm. According to the linear regression equation, even if the longitudinal distance X, the transverse distance Y, and the spray pressure P reach the best state, the droplet size cannot be satisfied in the range of 10~50 μm. The spray pressure is negatively correlated with droplet size. If the system continues to increase the pressure to reduce the volume medium diameter, the hardware requirements of the system will be enhanced. Nuyttens et al. [23] found that the nozzle type, equivalent hole diameter, and other factors can reduce the droplet size. The droplet size under the influence of other factors can continue to be improved in the future.At different pressure conditions, Dv0.5 decreases as spray pressure increases at the same measurement position. Dv0.5 increases with an increasing X value and the variation law along the Y-axis is the same as that at a pressure of 1 MPa. Since the standardized orchard row spacing is 4~5 m, the median diameter of the volume gradually increases along the centreline of the nozzle. When the distance is greater than 2.5 m, the air force has little effect on the droplets, and it can be ignored. Dv0.5 gradually decreases with an increasing X value. When the farthest distance from the centreline of the nozzle is Y = 0.5 m, Dv0.5 does not change significantly with an increasing X value. The main reason is that small-volume droplets with stable drift are measured outside the spray field.
- 2.
- Through the analysis of the multiple linear regression equation, it can be seen that when the pressure is 1 MPa, as the X value increases, the relative span increases gradually. By comparing and analysing the relationship between the relative span and Dv0.5, Hewitt [38] found that the laws of relative span and Dv0.5 are similar. The relative span gradually increases when Dv0.5 increases. Through Dv0.5 in Figure 4b and the relative span in Figure 6b, when Y = 0.1, Y = 0.2, Y = 0.3, and Y = 0.4 m, with an increasing distance in the X direction, Dv0.5 varies greatly from outside the edge of the spray field to the edge of the spray field and into the spray field, resulting in the relative span not changing positively with the change in Dv0.5. However, under relatively stable conditions inside the spray field, the relative span still satisfies the above law. At distances of X = 0.4 m, X = 0.6 m, X = 0.8 m, and X = 1.2 m, due to the hollow effect of the close-range conical spray field, the range of the droplet size near the edge of the spray field gradually increases. The relative span gradually increases in the Y direction. The relative span outside the edge of the spray field continues to increase, but Dv0.5 decreases. The main reason is that the air at the edge of the spray field is unstable, so the fluctuation range of the measured droplet size is large, resulting in a large relative span of the actual measurement. With an increasing X value, the relative span increases because the hollow effect of the cone spray gradually decreases. Different from the variation trend of the relative span at distances of X = 0.4 m, X = 0.6 m, X = 0.8 m, and X = 1.2 m, the relative span first increases and then decreases with an increasing Y-value when X = 1.8 m and X = 2.4 m. The main reason for this result is that as the X value increases, the Y-value from the centreline of the nozzle is at the edge of the spray field, and the large droplets are less affected by the air field. When it has not yet reached X = 1.8 m, it falls below the measurement point, resulting in a decrease in the relative span.At different pressure conditions, the relative span at X = 1.8 m does not change significantly at each measurement position, and the size fluctuates by approximately 1.2. Hewitt [32] proposed some reasonable suggestions on how to reduce the relative span of the droplet spectrum. For example, using a rotating disk and studying the shear viscosity of the liquid can change the relative span of the droplet. At the centreline of the nozzle, Y = 0 m, the relative span gradually increases with an increasing X distance. The main reason for this result is that as X increases, the hollow effect gradually decreases, the larger droplet size gradually falls to the measurement point, and the droplet size range increases. Through the study of Maciel et al. [39], it is found that the relative span decreases with the increase in air speed, and a small relative span can better show a narrow droplet spectrum. In the future, the optimal effective particle size range can be determined by studying the variation of spatial droplet size and relative span under different air speed conditions and combining it with the needs of pest control.
- 3.
- Through the analysis of the multiple linear regression equation, it can be seen that when the pressure is 1 MPa, with the distance from the nozzle orifice being farther, the droplet velocity value decreases with the Y-axis, and its change rate is also smaller. The main reason for this result is that the X value is small. The cross-section of the spray field is small. The droplet velocity at the centre position is high and varies greatly at each measurement point position. The droplet velocity at the edge of the spray field decreases more obviously. When X = 1.8 m and X = 2.4 m, the droplet velocity fluctuates less at each measurement point. The droplet velocity increases first and then decreases from the centre of the spray field to the edge, which is inconsistent with the gradual decrease in the droplet velocity from the centre to the edge studied by Li et al. [24]. The main reason is that in the actual spraying process, the axial flow fan will produce a certain amount of air direction offset after a certain distance from the outlet of the fan, which leads to the maximum air speed position not being on the centreline of the nozzle X = 1.8 m and X = 1.2 m. The change in the droplet velocity at the positions of Y = 0.2 m, Y = 0.3 m, and Y = 0.4 m from the centreline of the nozzle first increases and then decreases with an increasing X value. The main reason for this result is that when the X value is small, the three measurement points are at the edge of the air field and the velocity is small. As the X value increases, the air field section gradually increases, approaching the centre of the air field. The droplet velocity gradually increases. When the X value continues to increase, the droplet velocity gradually decreases due to the influence of air resistance.Under different pressure conditions, the droplet velocity does not change significantly at each measurement position under the condition of an external air field. The variation trend of the droplet velocity is similar to the droplet velocity at the X = 1.8 m transverse position and Y = 0 m longitudinal position at a pressure of 1 MPa.
5. Conclusions
- 1.
- At the position of X = 1.8 m, Dv0.5 at different pressure conditions is in the range of 120150 μm, which is within the range of the best droplet size of 30150 μm for the control of crop leaf reptile larvae and plant diseases. The significance analysis of multiple linear regression showed that the longitudinal distance, transverse distance, and spray pressure had significant effects on droplet size. The multiple linear regression model of the volume median diameter was established. The determination coefficient R2 of the model fitting degree is 0.7769.
- 2.
- The significance analysis of multiple linear regression shows that the spatial position has a significant effect on the relative span. When the spray pressure P and the lateral distance Y interact with each other, the relative span has a significant effect. The multiple linear regression model of the relative span was established. The model fitting degree determination coefficient R2 is 0.9409, and the fitting degree is high. According to the analysis of the experimental results, as the distance from the nozzle orifice increases, the hollow effect of the spray field gradually decreases, resulting in a gradual increase in the relative span. For different types of pest control requirements, it is necessary to more accurately control the droplet size and study how to reduce the relative span at a long distance from the nozzle orifice.
- 3.
- The significance analysis of multiple linear regression shows that the longitudinal distance X, the transverse distance Y, and the spray pressure have a significant effect on the droplet velocity. The multiple linear regression model of the droplet velocity was established. The model fitting coefficient R2 is 0.8779. To determine the spraying effect at each position, the droplet deposition effect under the same conditions can be carried out in the orchard. The optimal speed of droplets can be determined by measuring the deposition characteristics and the control effect of pests and diseases. According to the multiple linear regression equation of speed, the reference is provided for the subsequent adjustment of fan speed to improve the droplet speed.
- 4.
- The phenomenon of droplet evaporation will exist in the process of movement, and the evaporation rate is affected by the physical properties of the liquid, the initial droplet size, and the ambient temperature, humidity, air speed, and other conditions during spray release. In the future, the evaporation law of droplets will be studied for different agents under different vapour pressure deficits and air speed conditions. Considering various experimental factors, the atomization characteristics of droplets will be explored, the variation law of droplet characteristics at different positions in space will be analysed, and a mathematical relationship model will be established to provide a theoretical basis for reducing droplet drift and evaporation.
Author Contributions
Conceptualization, C.G. and F.Y.; Methodology, F.Y., C.Z. and C.G.; Validation, K.Y. and H.D.; Formal analyses, S.L., S.Y. and W.Z.; Resources, C.Z. and C.G.; Data curation, F.Y.; Writing—original draft, F.Y. and C.G.; Writing—review and editing, C.Z.; Funding acquisition, C.Z. and C.G.; Supervision, C.Z. All authors have read and agreed to the published version of the manuscript.
Funding
This research was funded by The National Key Research and Development Plan Project, grant number 2022YFD1000102; The Natural Science Foundation of China, grant number NSFC32301684; Reform and Development Project of Beijing Academy of Agriculture and Forestry Sciences; Postdoctoral Fund Project of Beijing, grant number 2023-ZZ-107; Postdoctoral Fund Project of Beijing Academy of Agriculture and Forestry Sciences, grant number 2022-ZZ-007.
Institutional Review Board Statement
Not applicable.
Data Availability Statement
Not applicable.
Conflicts of Interest
The authors declare no conflict of interest.
References
- Lv, X.; Fu, X.; Song, J.; He, X. Influence of spray operating parameters on spray drift. Trans. Chin. Soc. Agric. Mach. 2011, 42, 59–63. [Google Scholar]
- Hewitt, A.J. Droplet size spectra classification categories in aerial application scenarios. Crop Prot. 2008, 27, 1284–1288. [Google Scholar] [CrossRef]
- Dou, H.; Zhai, C.; Chen, L.; Wang, X.; Zou, W. Comparison of orchard target-oriented spraying systems using photoelectric or ultrasonic sensors. Agriculture 2021, 11, 753. [Google Scholar] [CrossRef]
- Li, H.; Zhai, C.; Weckler, P.; Wang, N.; Yang, S.; Zhang, B. A canopy density model for planar orchard target detection based on ultrasonic sensors. Sensors 2016, 17, 31. [Google Scholar] [CrossRef] [PubMed]
- Dorr, G.; Hanan, J.; Adkins, S.; Hewitt, A.; O’Donnell, C.; Noller, B. Spray deposition on plant surfaces: A modelling approach. Funct. Plant Biol. 2008, 35, 988–996. [Google Scholar] [CrossRef] [PubMed]
- Griesang, F.; Spadoni, A.B.D.; Ferreira, P.H.U.; Ferreira, M.D.C. Effect of working pressure and spacing of nozzles on the quality of spraying distribution. Crop Prot. 2022, 151, 105818. [Google Scholar] [CrossRef]
- Gu, C.; Zou, W.; Wang, X.; Chen, L.; Zhai, C. Wind loss model for the thick canopies of orchard trees based on accurate variable spraying. Front. Plant Sci. 2022, 13, 1010540. [Google Scholar] [CrossRef]
- Zhai, C.; Wang, X.; Ge, J.; Ma, W. Design of droplet size measuring system of air-assisted spraying and experiment on its influencing factors. Trans. Chin. Soc. Agric. Eng. 2012, 28, 33–38. [Google Scholar] [CrossRef]
- Ellis, M.C.B.; Tuck, C.R.; Miller, P.C.H. How surface tension of surfactant solutions influences the characteristics of sprays produced by hydraulic nozzles used for pesticide application. Colloids Surf. A Physicochem. Eng. Asp. 2001, 180, 267–276. [Google Scholar] [CrossRef]
- Fritz, B.K.; Hoffmann, W.C. Measuring spray droplet size from agricultural nozzles using laser diffraction. J. Vis. Exp. 2016, 115, e54533. [Google Scholar] [CrossRef]
- Yuan, H.; Wang, G. Effects of droplet size and deposition density on field efficacy of pesticides. J. Plant Prot. 2015, 41, 9–16. [Google Scholar]
- Washington, J.R. Relationship between the spray droplet density of two protectsant fungicides and the germination of Mycosphaerella fijiensis ascospores on banana leaf surfaces. Pestic. Sci. 1997, 50, 233–239. [Google Scholar] [CrossRef]
- Jiang, Y.; Yang, Z.; Xu, X.; Shen, D.; Jiang, T.; Xie, B.; Duan, J. Wetting and deposition characteristics of air-assisted spray droplet on large broad-leaved crop canopy. Front. Plant Sci. 2023, 14, 1079703. [Google Scholar] [CrossRef] [PubMed]
- Forster, W.A.; Mercer, G.N.; Schou, W.C. Spray Droplet Impaction Models and their use within AGDISP Software to Predict Retention. N. Z. Plant Prot. 2012, 65, 85–92. [Google Scholar] [CrossRef]
- Li, J.; Li, Z.; Ma, Y.; Cui, H.; Yang, Z.; Lu, H. Effects of leaf response velocity on spray deposition with an air-assisted orchard sprayer. Int. J. Agric. Biol. Eng. 2021, 14, 123–132. [Google Scholar] [CrossRef]
- Li, L.; Hu, Z.; Liu, Q.; Yi, T.; Han, P.; Zhang, R.; Pan, L. Effect of flight velocity on droplet deposition and drift of combined pesticides sprayed using an unmanned aerial vehicle sprayer in a peach orchard. Front. Plant Sci. 2022, 13, 981494. [Google Scholar] [CrossRef]
- Durickovic, B.; Varland, K. Between Bouncing and Splashing: Water Drops on a Solid Surface; University of Arizona: Tucson, AZ, USA, 2005. [Google Scholar]
- Himel, C.M. The optimum size for insecticide spray droplets. J. Econ. Entomol. 1969, 62, 919–925. [Google Scholar] [CrossRef]
- Salyani, M. Droplet size effect on spray deposition efficiency of citrus leaves. Trans. ASAE 1988, 31, 1680–1684. [Google Scholar] [CrossRef]
- Fritz, B.K.; Kirk, I.W.; Hoffmann, W.C.; Martin, D.E.; Hofman, V.L.; Hollingsworth, C.; McMullen, M.; Halley, S. Aerial application methods for increasing spray deposition on wheat heads. Appl. Eng. Agric. 2006, 22, 357–364. [Google Scholar] [CrossRef]
- Dai, Q.; Hong, T.; Song, S.; Li, Z.; Chen, J. Influence of pressure and pore diameter on droplet parameters of hollow cone nozzle in pipeline spray. J. Trans. Chin. Soc. Agric. Eng. 2016, 32, 97–103. [Google Scholar]
- Li, X.; Chen, L.; Tang, Q.; Li, L.; Cheng, W.; Hu, P.; Zhang, R. Characteristics on the spatial distribution of droplet size and velocity with difference adjuvant in nozzle spraying. Agronomy 2022, 12, 1960. [Google Scholar] [CrossRef]
- Nuyttens, D.; Schampheleire, M.D.; Verboven, P.; Brusselman, E.; Dekeyser, D. Droplet size and velocity characteristics of agricultural sprays. Trans. ASABE 2009, 52, 1471–1480. [Google Scholar] [CrossRef]
- Li, S.; Chen, C.; Wang, Y.; Kang, F.; Li, W. Study on the atomization characteristics of flat fan nozzles for pesticide application at low pressures. Agriculture 2021, 11, 309. [Google Scholar] [CrossRef]
- Zwertvaegher, I.K.; Verhaeghe, M.; Brusselman, E.; Verboven, P.; Lebeau, F.; Massinon, M.; Nicolaï, B.M.; Nuyttens, D. The impact and retention of spray droplets on a horizontal hydrophobic surface. Biosyst. Eng. 2014, 126, 82–91. [Google Scholar] [CrossRef]
- Li, J.; Cui, H.; Ma, Y.; Xun, L.; Li, Z.; Yang, Z.; Lu, H. Orchard spray study: A prediction model of droplet deposition states on leaf surfaces. Agronomy 2020, 10, 747. [Google Scholar] [CrossRef]
- Wei, X.; Yu, D.; Bai, J.; Jiang, S. Static spray deposition distribution characteristics of PWM-based intermittently spraying system. Trans. Chin. Soc. Agric. Eng. 2013, 29, 19–24. [Google Scholar]
- Wei, Z.; Zhu, H.; Zhang, Z.; Salcedo, R.; Duan, D. Droplet size spectrum, activation pressure, and flow rate discharged from PWM flat-fan nozzles. Trans. ASABE 2021, 64, 313–325. [Google Scholar] [CrossRef]
- Adams, A.J.; Chappie, A.C.; Hall, F.R. Droplet spectra for some agricultural fan nozzles, with respect to drift and biological efficiency. In Pesticide Formulations and Application Systems; Bode, L., Hazen, J., Chasin, D., Eds.; American Society for Testing and Materials: West Conshohocken, PA, USA, 1990; pp. 156–169. [Google Scholar]
- Fritz, B.K.; Hoffmann, W.C.; Bagley, W.E.; Kruger, G.R.; Czaczyk, Z.; Henry, R.S. Measuring droplet size of agricultural spray nozzles-measurement distance and airspeed effects. At. Sprays 2014, 24, 747–760. [Google Scholar] [CrossRef]
- Carvalho, F.K.; Antuniassi, U.R.; Chechetto, R.G.; Mota, A.A.B.; de Jesus, M.G.; de Carvalho, L.R. Viscosity, surface tension and droplet size of sprays of different formulations of insecticides and fungicides. Crop Prot. 2017, 101, 19–23. [Google Scholar] [CrossRef]
- Hewitt, A.J. Spray optimization through application and liquid physical property variables–I. Environmentalist 2007, 28, 25–30. [Google Scholar] [CrossRef]
- Dong, X.; Zhang, T.; Yan, M.; Yang, X.; Yan, H.; Sun, X. Design and experiment of 3WPZ-4 type air-assisted grape sprayer. Trans. Chin. Soc. Agric. Mach. 2018, 49, 205–213. [Google Scholar]
- Dou, H.; Zhai, C.; Wang, X.; Zou, W.; Li, Q.; Chen, L. Design and experiment of the orchard target variable spraying control system based on LiDAR. Trans. Chin. Soc. Agric. Eng. 2022, 38, 11–21. [Google Scholar] [CrossRef]
- Marin, E.; Matache, M.; Nitu, M.; Gheorghe, G. Experimental researches regarding assessment of coverage degree obtained by orchard spraying machine. In Proceedings of the 16th International Scientific Conference Engineering for Rural Development, Jelgava, Letonia, 24–26 May 2017; pp. 1239–1243. [Google Scholar] [CrossRef]
- Wang, Y.; Sui, S. Mathematical Statistics and MATLAB Data Analysis, 2nd ed.; Tsinghua University Press: Beijing, China, 2014; pp. 177–193. [Google Scholar]
- Hu, G.; Xu, L.; Zhou, H.; Cui, Y. Analysis of multi-factor influence on droplet size distribution of hollow cone nozzle. J. Nanjing For. Univ. Nat. Sci. Ed. 2014, 38, 133–136. [Google Scholar] [CrossRef]
- Hewitt, A.J. Droplet size spectra produced by air-assisted atomizers. J. Aerosol. Sci. 1993, 24, 155–162. [Google Scholar] [CrossRef]
- Maciel, C.F.S.; Teixeira, M.M.; Fernandes, H.C.; Zolnier, S.; Cecon, R. Droplet spectrum of a spray nozzle under different weather conditions. Cienc. Agron. 2018, 49, 430–436. [Google Scholar] [CrossRef]
Disclaimer/Publisher’s Note: The statements, opinions and data contained in all publications are solely those of the individual author(s) and contributor(s) and not of MDPI and/or the editor(s). MDPI and/or the editor(s) disclaim responsibility for any injury to people or property resulting from any ideas, methods, instructions or products referred to in the content. |
© 2023 by the authors. Licensee MDPI, Basel, Switzerland. This article is an open access article distributed under the terms and conditions of the Creative Commons Attribution (CC BY) license (https://creativecommons.org/licenses/by/4.0/).