Article

Analysis of Exogenous Factors to Thailand Coffee Price Volatility: Using Multiple Exogenous Bayesian GARCH-X Model

by
Yaovarate Chaovanapoonphol
1,
Jittima Singvejsakul
1,2,* and
Aree Wiboonpongse
1
1
Department of Agricultural Economy and Development, Faculty of Agriculture, Chiang Mai University, Chiang Mai 50200, Thailand
2
Centre of Excellence in Econometrics, Chiang Mai University, Chiang Mai 50200, Thailand
*
Author to whom correspondence should be addressed.
Agriculture 2023, 13(10), 1973; https://doi.org/10.3390/agriculture13101973
Submission received: 21 August 2023 / Revised: 26 September 2023 / Accepted: 4 October 2023 / Published: 10 October 2023

Abstract

:
Price volatility is a significant risk factor affecting the income of farmers in the agriculture sector, especially for international trade in products such as coffee in Thailand. This study proposes an alternative model to analyze the major factors in terms of internal and external factors, which are expected to affect price volatility simultaneously, by applying multiple exogenous Bayesian GARCH-X models. The empirical results of the comparison between the multiple exogenous Bayesian GARCH-X model and the standard Bayesian GARCH-X model, which estimated the impact of individual exogenous variables separately, show that the standard error of the first model is the smallest compared to the others, which means the multiple exogenous Bayesian GARCH-X model is more fitted to the data than the others. The results indicate that the increase in demand for manufactories for coffee beans in Thailand (TDD) and coffee bean export volume in Indonesia (INEX) leads to an increase in the volatility of raw coffee prices. On the other hand, if coffee bean export volume in Brazil (BEX) increases, this will cause a decrease in the volatility of raw coffee bean prices. Therefore, the Thai government should carefully consider the changes in the production and marketing policies of those countries in the formulation of the coffee policy. The appropriate policy on coffee price volatility in Thailand should not concern only reduce the uncertainty in the coffee bean market but also consider the impact on the long-term income and livelihoods of coffee growers. Therefore, external factors of the competing countries should be taken into account in the coffee production policy.

1. Introduction

Price volatility poses a significant risk to the agricultural sector, leading to uncertainty for both producers and consumers while also impacting the income of those involved in agriculture. This issue is particularly crucial for key exported agricultural products in Thailand, such as rice, cassava, and coffee. Especially, coffee stands as the ninth most exported agricultural product in Thailand for the year 2020 [1]. Despite government support, the coffee industry in Thailand has faced continual challenges, with declining harvested areas and reduced product quantities. In contrast, domestic coffee demand has been on the rise. Between 2016 and 2020, Thailand’s average annual demand for raw coffee beans reached 78,953 tons [2]. This demand surged to 91,036 tons in 2022 [3]. Conversely, Thailand’s average annual production of raw coffee beans during this same period was 26,162 tons, decreasing to 18,054 tons. In 2022, the demand for raw coffee beans in the country exceeded the production volume by five times. Consequently, Thailand had to bridge this supply demand gap by importing 61,982 tons of raw coffee beans, valued at 5423.66 million baht, from countries like Vietnam, Laos, and Indonesia. Additionally, 24,467 tons of instant coffee, worth 3230.07 million baht, were imported from Malaysia, Vietnam, and Indonesia [4].
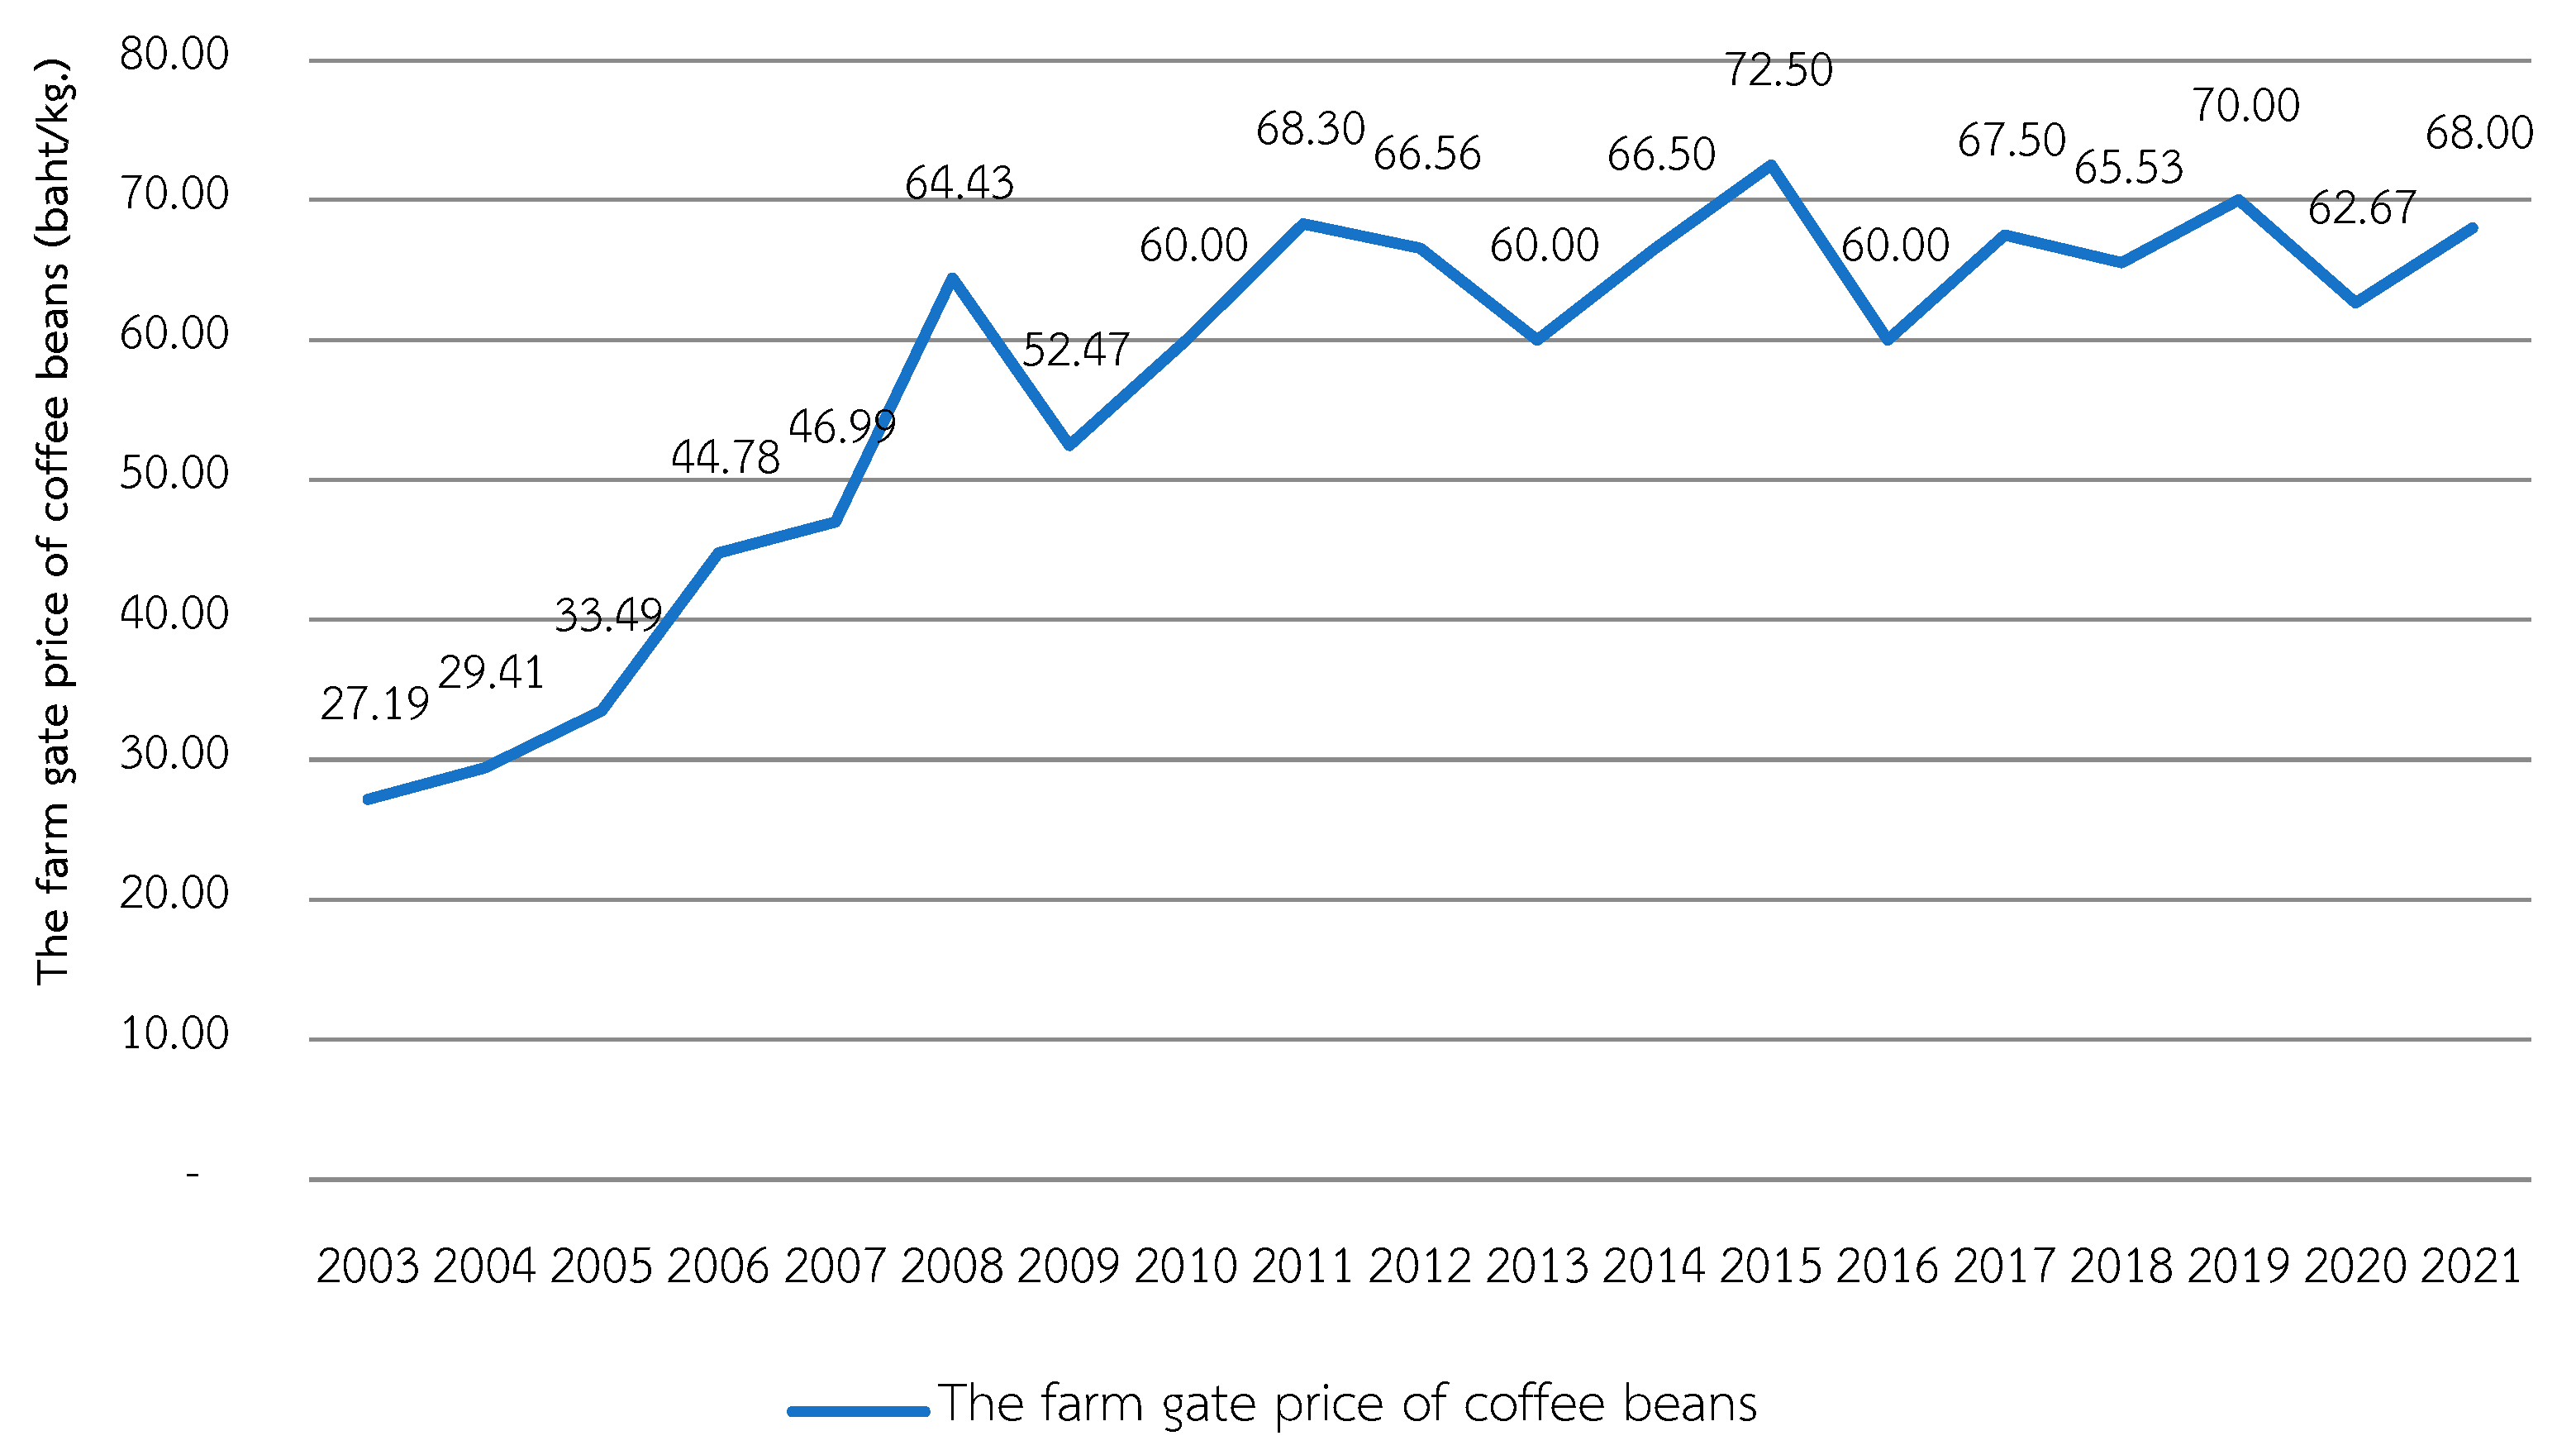
When examining the farmgate pricing of raw coffee beans in Thailand over the period from 2003 to 2021, it becomes evident that these prices underwent continual fluctuations, displaying an overall upward line and peaking in 2015 at 72.50 baht per kilogram (Figure 1) [5]. The volatility in the farmgate pricing of raw coffee beans is anticipated to be influenced by a combination of domestic and international factors. On the domestic front, factors such as the imbalance between the supply and demand for coffee within Thailand and government support policies will play an important role. In addition, external determinants, including exports from major coffee-producing nations such as Brazil, Vietnam, and Indonesia, as well as international trade policies like the ASEAN Free Trade Area Agreement (AFTA), which Thailand has been obliged to adhere to since 1 January 2010, will exert a significant impact. Furthermore, remarkable adjustments have been made to import taxes on both coffee beans and instant coffee beans, with rates reduced to 5% and 0%, respectively.
Historically, researchers investigating early-stage product price fluctuations predominantly employed the Generalized Autoregression Conditional Heteroscedastic Model (GARCH). This model gained widespread acceptance, particularly within the financial sector. In the agriculture sector, several studies also applied the GARCH model, including the works of Paul and Ghosh [6], Ghosh et al. [7], Yang et al. [8], Paul and Ghosh [9], Sendhi et al. [10], Paul [11], and Cermák [12]. However, the GARCH Model exhibited limitations, particularly in accurately explaining volatility beyond the sample data [13]. Additionally, it proved inadequate when dealing with datasets exhibiting extreme fluctuations [14]. As a response to these weaknesses, the GARCH-X model, introduced by Braun et al. [15], emerged as a valuable alternative. This model incorporates exogenous variables into the analysis, allowing for the assessment of the impact of environmental factors on conditional variance. Various agricultural product studies, such as Wang et al. [16], investigated corn price volatility using a GARCH-X model with oil prices as exogenous variables, and Verma and Mohanty [17] applied a GARCH-X model to separately analyze the impact of macroeconomic variables on wheat price volatility. Similarly, Smith et al. [18] explored wheat price volatility dynamics by employing a GARCH-X model with weather conditions as exogenous variables, whereas Johnson and Brown [19] utilized a GARCH-X model with macroeconomic influences as exogenous variables to forecast cattle prices. In the case of cocoa prices, Thompson et al. [20] harnessed a GARCH-X model with exchange rates and production shocks as exogenous variables to assess volatility patterns. The GARCH-X Model offers an effective means of explaining the influence of external variables on fluctuations while concentrating solely on conditional variance. However, Anggraeni et al. [21] enhanced the GARCH-X model by dissecting the effect of exogenous variables on both the mean and variance models of GARCH-X individually. Their research revealed that these exogenous variables exerted an impact on both the mean and variance models. In recent years, the GARCH-X model has seen further refinement, exemplified by the work of Md Yeasin et al. [22], who adapted it to capture the influence of exogenous variables, such as the international price index of edible oil and the India and U.S. foreign exchange rate, on the volatility of both the mean and variance models of the domestic price index of edible oil in India. Their findings reinforced the significance of considering exogenous factors in volatility modeling, repeating the insights gained from prior studies.
This manuscript introduces an innovative approach for analyzing the anticipated influences on price volatility in the Thai raw coffee bean market. The methodology employed is the Multiple Exogenous Bayesian GARCH-X model. This study not only presents a comprehensive volatility model but also includes multiple exogenous variables, such as coffee bean export data from prominent coffee-producing nations like Brazil, Vietnam, and Indonesia. It concurrently estimates the impact of these factors on price volatility. Unlike the conventional Maximum Likelihood technique used for parameter estimation in the general GARCH model, our study adopts a Bayesian approach for more precise results than the conventional GARCH-X model, which provides fixed parameters [23]. The Bayesian approach treats parameters as random variables with probability distributions, offering distinct advantages, including robust estimation, model discrimination, model combination, and probabilistic insights into model parameters [24]. This research then proceeds to compare the outcomes of the general GARCH-X model with the Multiple Exogenous Bayesian GARCH-X model to clarify volatility patterns. This comparison enhances the accuracy of volatility forecasts, ultimately contributing to more effective risk management strategies and informed decision-making within Thailand’s coffee markets.
This paper is structured as follows: in Section 2, we explore into a comprehensive review of the relevant literature. Section 3 outlines our research methodology, encompassing the utilization of Bayesian methods for unit root testing and the application of the Multiple Exogenous Bayesian GARCH-X model. Section 4 showcases the empirical data results, highlighting both stationary testing outcomes and the estimation of the covariance of variables using the Multiple Exogenous Bayesian GARCH-X Model. We initiate a discussion in this same section. Finally, in the concluding section, we offer our insights and policy recommendations.

2. Literature Review

Historically, the previous studies of agricultural price volatility show continued modeling development, starting with a fundamental model such as the GARCH Model. The GARCH model is utilized to analyze agricultural price volatility over various periods and situations. Coffee is one of the agricultural commodities that has been widely traded in the global market with a volatile price history, making it crucial to understand and forecast its price dynamics. Several studies have employed GARCH-X models to analyze and forecast price volatility in the coffee market, shedding light on the factors driving volatility and aiding risk management strategies. For example, one significant research contribution in this area was conducted by Silva and Carvalho [25], who investigated the volatility of coffee prices using a GARCH-X model with weather conditions as an exogenous variable in Algeria. Their study revealed that weather factor indicated significantly influence on coffee price volatility, highlighting the importance of considering climatic variations in coffee market analysis. Moreover, Jones and Lee [26] examined the relationship between coffee price volatility and global economic indicators by employing a GARCH-X model. Their findings suggested that global economic conditions, such as gross domestic product (GDP) growth and exchange rates, have a notable impact on coffee price volatility. This research emphasized the significance of macroeconomic factors in understanding and forecasting coffee price movements. For example, the assumption of normal distribution may not fully capture the extreme price movements observed in the coffee market. To address this drawback, Jones and Lee [27] proposed the use of heavy-tailed distributions in GARCH-X models for more accurate modeling of coffee price volatility.
Furthermore, Chandra and Sikdar [28] studied the spillover effects between coffee prices and global weather conditions using a GARCH-X model in Pakistan. Their analysis demonstrated that weather-related events, such as droughts or frost, can have spill-over effects on coffee price volatility across different regions. This study highlighted the interconnectedness of coffee markets in the country and the importance of considering global weather phenomena in volatility analysis. Additionally, Li and Tian [29] conducted a comprehensive investigation of coffee price volatility, incorporating a GARCH-X model with exogenous variables such as exchange rates and coffee production shocks. Their findings revealed that both exchange rate fluctuations and unexpected supply shocks significantly contribute to coffee price volatility. Although the GARCH-X model incorporates external factors to improve upon the GARCH model and allows for a more comprehensive understanding of volatility patterns and facilitates more accurate volatility forecasting, it still faces certain limitations. One drawback of the GARCH-X model is that it relies on the maximum likelihood estimation (MLE) method, which has its disadvantages. MLE is an optimization technique that can be complex and sensitive to the initial optimization values, potentially leading to inaccurate parameter estimates when dealing with small sample sizes [30]. Furthermore, in place of the fixed parameters obtained through maximum likelihood estimation, the Bayesian estimation treats the model’s parameters as random variables. The current study employs Bayesian approach in the GARCH-X Model, utilizing the Markov Chain Monte Carlo (MCMC) algorithm for sampling estimation, aiming to obtain reliable estimators that can closely approach the true parameter values even when the sample size is limited.
To sum up, the development of GARCH-X in the previous study employs GARCH-X to incorporate one or more exogenous variables and estimate factors separately by using maximum likelihood as the estimator, and that estimation of parameters is fixed. For example, the study of Md Yeasin et al. [22] improved the GARCH-X model to capture the impact of more exogenous variables on the volatility of both the mean and variance model of the domestic price index of edible oil in India. The results shown highlight the significance of considering exogenous factors in volatility modeling. Therefore, this study aims to use the concept of estimation of the mean and variance model that incorporates exogenous variables into consideration, including adjusting the estimation of parameters by adopting Bayesian estimation. That is more accurate than the GARCH-X model, which provides fixed parameters [23], a method for estimating price fluctuations that provide more accurate values. Then, the study applies this methodology to analyze price volatility in coffee, aiming to rectify the deficiencies of the GARCH-X model and to derive more accurate parameter estimates, which have not yet been explored in the context of agricultural commodity price volatility analysis.

3. Methodology

3.1. The Unit Root Test Using Bayesian

The standard unit root test is investigated using the ADF test, which shows the ratio between the stationary data and non-stationary data of the null hypothesis [31,32]. The significant statistical issues associated with the autoregressive unit root test (AR) are defined as
x t = c + ρ x t 1 + ε t ,   ε t ~ N ( 0 , σ 2 ) ,
The prior density ρ is formulated and expressed as follows:
p ( θ ) = p ( ϕ ) p ( a * ϕ ) ,
The marginal likelihood ϕ is.
l ( ϕ | D ) α l ( ρ D ) ϕ ( a * ϕ ) d a * ,
In the context of Bayesian, the above hypothesis is combined with the Bayes factor (BF) to interpret the hypothesis of stationary data. The null hypothesis is defined by M i , and the alternative hypothesis is denoted by M j . The ratio of posterior odds of M i and M j is
p ( M i y ) p ( M j y ) = p ( y M i ) p ( y M j ) × π ( M i ) M j ,
The interpretation in Bayes factor can be interpreted in Table 1.

3.2. The Multiple Exogenous Bayesian GARCH-X Model

To model the volatility of a commodity price, autoregressive conditional heteroscedasticity (ARCH) of Engle (1982) and generalized ARCH (GARCH) of Bollerslev (1986) is an evident method to measure volatility, as in Equations (5) and (6)
y t = X β ^ + ε t
where y t = ( y 1 , , y T ) is the dependent parameter, X = [ 1 y t 1 ] , is the vector of parameters, β = ( c , ϕ ) , and, ε t = ( ε 2 , , ε T ) , is the error term. To understand the GARCH-X model, the GARCH model is introduced to be written as
h t = ω + α ε t 1 2 + β h t 1
where the variance of ε t 2 is 1 and this only works if α + β < 1 and α > 0 , β > 0 , ω > 0 . The GARCH-X model aims to model conditional variance. Then, the specification equation of the GARCH model can be expressed as
h t = ω + α ε t 1 2 + β h t 1 + γ 1 x 1 + γ 2 x 2 + γ 3 x 3 + γ 4 x 4
where h t is the variance for ε t 2 > 0 , it is assumed that ω > 0 , and α , β 0 . Hence, for many purposes, the GARCH (1,1) model is the volatility model of choice for returns.
To write the likelihood function, the vectors are defined as ϖ = ϖ 1 , , ϖ T ,   α = α 0 , , α t ,   β = ( β 0 , , β t ) , and γ = ( γ 0 , , γ t ) , and the model parameters are regrouped into the vector ψ = ω , α , β , γ . Then, the T × T diagonal matrix is defined as follows (Koop, 2003)
= ( φ , ) = d i a g ( { h t ( ω , α , β , γ ) } t 1 )
where h t α , β = α 0 + α 1 ε t 1 2 + β h t 1 α , β , which can express the likelihood of ψ as
L ( φ y ) α ( det ) 1 / 2 = exp [ 1 2 y 1 y ]
The Bayesian approach considers ψ as a random variable that is characterized by a prior density denoted by p ψ . The prior is specified with the help of parameters, called hyperparameters, which are initially assumed to be known and constant. Moreover, depending on the researcher’s prior information, this density can be informative Koop [33]. Then, by coupling the likelihood function of the model parameters with the prior density, one can transform the probability density using Bayes’ rule to obtain the posterior density p ψ   y as follows:
p ( φ | y ) = L ( φ | y ) p ( φ ) L ( φ | y ) p ( φ ) d φ ,
This posterior is a quantitative, probabilistic description of the knowledge about the model parameters after observing the data. For an excellent introduction to Bayesian econometrics, we refer the reader to Koop [33]. The joint prior distribution is then formed by assuming prior independence between the parameters as
p ψ = p a p β   .
The recursive nature of the GARCH-X variance equation implies that it cannot be expressed in a closed form. Therefore, the simple Gibbs sampler method is based on the assumption that, even if the joint probability is intractable, the conditional distribution of a single dimension given the others can be computed. This needs to rely on a more elaborated Markov Chain Monte Carlo (MCMC) simulation strategy to approximate the posterior density. The idea of MCMC sampling was first introduced by Metropolis et al. [34] and was subsequently generalized by Hastings (1970). MCMC methods comprise a class of algorithms for sampling from a probability distribution. The sampling strategy relies on the construction of a Markov chain with realizations ψ 0 , , ψ j , in the parameter space.

4. Empirical Results

4.1. Data Descriptive

The raw coffee beans price data in Thailand and the other variables considered in this study consist of five variables data, including raw coffee beans price in Thailand (TFP) representing farm price, demand of manufactory for coffee beans in Thailand (TDD), Vietnam coffee bean export volume (VEX), Indonesia coffee bean export volume (INEX), and Brazil coffee bean export volume (BEX). All are annual data, with a total of 23 observations (1999–2021), which are collected from the secondary data. The basic statistics presented that there are three of a right skewness (VEX, INEX, and BEX), where the rest (TFP and TDD) are of left skewness. The highest Kurtosis is 6.96, which is VEX, and the lowest kurtosis is 1.99 (TFP). Furthermore, there are two variables (TFP and TDD) that are normally distributed random numbers from the Jarque–Bera test, which are represented in Table 2.

4.2. The Stationary Testing and Covariance of Variables

In this paper, the unit root test based on the Bayesian method is used to investigate the stationary data. The null hypothesis (H0) is non-stationary, and the alternative hypothesis (H1) is stationary. The results show that all variables are stationary or (I(0)), which is strong evidence for Mj, which is shown in Table 3. Furthermore, the covariance of five variables shows that all of the variables are positive relations, and the highest value of covariance is 0.0221 (BEX and VEX). However, there is only one relation between TDD, and InEX is the negative value (−0.0008), represented in Table 4.

4.3. The Estimation of Multiple Exogeneous Bayesian GARCH-X Model

In this research work, we employ Bayesian estimation techniques to analyze the volatility of raw coffee bean prices in Thailand (TFP) using the GARCH-X model. This investigation considers the influence of one domestic factor (TDD) and three external factors. To accomplish this, we leverage the Markov Chain Monte Carlo (MCMC) method as our Bayesian estimator. The utilization of MCMC is preferred due to its effectiveness in deriving the posterior probability density function (PDF) conditions. Furthermore, it allows for the estimation of expected values for various properties within the GARCH-X model. To ensure the reliability of our analysis, we perform 10,000 iterations of the Markov chain sampling, designating the initial 2000 iterations as a burn-in phase. This practice allows the MCMC to reach its equilibrium distribution, especially when initiated from an unfavorable starting point. Consequently, we consider a Monte Carlo sample size of 8000. The findings, including posterior means and standard deviations, are presented in Table 5.
The empirical findings reveal the existence of five distinct models. Among these, the initial model stands out as a Bayesian GARCH-X model with multiple exogenous variables, involving four such variables. The remaining models are characterized by having only a single exogenous variable in each corresponding equation, with TDD, VEX, INEX, and BEX being the respective exogenous variables. To determine the most suitable Bayesian GARCH-X model for this research, we conducted a comparative analysis based on the standard error. The model with the smallest standard error emerges as the best-fitting choice, and our estimates affirm that the initial model holds this distinction.
The initial model reveals that the ARCH effect (alpha) is concentrated closely around a unity value, signifying its adherence to a random walk pattern. The posterior estimates of both the ARCH effect (alpha) and GARCH effect (beta) confirm their statistical significance within the invertible range. In contrast, the intercept term (Omega) is notably diminutive, suggesting a limited impact of volatility on the prices of raw coffee beans in Thailand (TFP). Furthermore, the posterior mean comfortably resides within the credible interval value (CI), underscoring its statistical significance. Empirical findings point to three external factors exerting influence on the volatility of raw coffee bean prices in Thailand (TFP): TDD, BEX, and INEX. The estimates demonstrate that the Demand of manufactories for coffee beans in Thailand (TDD) and Coffee bean export volume in Indonesia (INEX) hold statistical significance, with coefficients of 0.00075 and 0.00405, respectively. Consequently, an upswing in the demand for manufactories for coffee beans in Thailand (TDD) and an increase in coffee bean export volume in Indonesia (INEX) correspond to heightened fluctuations in raw coffee prices in Thailand. On the other hand, coffee bean export volume in Brazil (BEX) exerts a negative impact on the volatility of raw coffee bean prices in Thailand, with a coefficient of −0.0051. This suggests that an escalation in coffee bean export volume in Brazil (BEX) leads to a reduction in the volatility of raw coffee prices.
In contrast to the first model, the posterior means of the ARCH effect (alpha) and the GARCH effect (beta) in the other models (from the second to the fifth model) are also found to be statistically significant within the invertible region. Furthermore, when estimating the posterior means of the TDD, INEX, and BEX variables using Bayesian GARCH-X separately, it becomes evident that these variables exhibit a consistent direction with the first model. Specifically, TDD and INEX show statistically significant positive coefficients, whereas BEX exhibits a negative coefficient. The details are shown below in Table 5.

5. Discussion

This manuscript presents empirical findings indicating that the multiple exogenous GARCH-X model exhibits the best fit among five models considered, as evidenced by the smallest standard error. The study identifies three external factors influencing the volatility of raw coffee bean prices in Thailand (TFP), including the demand for coffee beans in Thai manufacturing (TDD), coffee bean export volumes in Brazil (BEX), and coffee bean export volumes in Indonesia (INEX). Remarkably, only a limited number of studies have employed GARCH-X models to analyze and predict price volatility within the coffee market. These studies contribute valuable insights into the driving forces of volatility and enhance risk management strategies. Notable among these researchers are Silva and Carvalho (2012), Jones and Lee (2017), Jones and Lee (2019), Chandra and Sikdar (2020), and Li and Tian (2021). Notable among these researchers are [25,26,27,28,29]. Each of these empirical investigations employ GARCH-X models, although with varying exogenous variables, such as weather conditions [25], global economic indicators [27], global weather conditions [28], and the impact of exchange rate fluctuations and unexpected supply shocks [29]. It is worth noting that, apart from Jones and Lee [27], all previous research followed the standard GARCH-X model. In contrast, Jones and Lee [27] introduced the concept of incorporating heavy-tailed distributions into GARCH-X models to achieve more precise modeling of coffee price volatility. Importantly, the empirical results from these diverse studies collectively reveal that exogenous variables employ varying and significant impacts on coffee price volatility across different countries.
This study distinguishes itself from prior research in several ways. Firstly, it enhances the conventional GARCH-X model, which incorporates one or more external variables and estimates factors separately through maximum likelihood. Furthermore, the estimation approach employed in this paper differs from the one proposed by Md Yeasin et al. [22], as previously mentioned. In this study, we improve upon the GARCH-X model by adopting a Bayesian approach and utilizing the Markov Chain Monte Carlo (MCMC) method to investigate the volatility of raw coffee bean prices in Thailand (TFP). The empirical results reveal that the exogenous variables examined in this study exert a significant influence on the volatility of raw coffee bean prices, consistent with earlier empirical studies conducted in various countries. Nevertheless, only a limited number of empirical studies have explored the impact of external factors on coffee bean price fluctuations in Thailand. Consequently, this paper represents one of the initial investigations to establish that coffee bean prices are influenced by the supply and demand dynamics in both domestic and global coffee markets. Furthermore, price volatility is shown to be linked to external factors associated with the major coffee-producing nations worldwide. These findings hold significant importance as they can inform government policies related to managing price volatility in agricultural commodities, particularly in the case of coffee beans. It underscores the necessity of considering macroeconomic factors such as global weather patterns, global economic indicators, fluctuations in exchange rates, and unexpected supply disruptions in the global market when formulating policies in this regard.

6. Conclusions and Policy Recommendation

This manuscript investigates the dynamics of volatility in Thailand’s raw coffee prices and their correlation with external variables. It evaluates five different models using various selection criteria, ultimately determining that the multiple exogenous GARCH-X model stands out as the most appropriate, consistently demonstrating smallest standard error. The study’s findings reveal that exogenous variables utilize a statistically significant impact on Thailand’s raw coffee price volatility, even if in diverse directions. Specifically, the demand for coffee beans from Thai manufacturers (TDD) and the export volume of coffee beans from Indonesia (INEX) exhibit positive statistical significance. Conversely, the export volume of coffee beans from Brazil (BEX) exerts an opposing influence. These results underline that the fluctuations in domestic raw coffee prices in Thailand are not solely reliant on domestic demand but are also subject to external influences, particularly from the primary coffee-producing and exporting countries like Brazil and Indonesia.
Based on the empirical findings of this study, it is evident that Brazil, being the world’s leading coffee producer, exerts a substantial influence on global coffee production and pricing dynamics. The increase in Brazil’s coffee bean exports, denoted as BEX, consistently expands the global coffee supply, producing fluctuations in the prices of raw coffee beans. A pivotal factor impacting Brazil’s coffee production lies in its alternating production cycles, resulting in periodic fluctuations. Furthermore, environmental shifts also play a role; for instance, the Black Frost event in 1975 led to a staggering 75% reduction in the following year’s coffee yield. Similarly, in the years 2000 and 2001, consecutive declines in coffee yield were followed by an upswing in 2002, aligning with prolonged stagnation in coffee prices [35]. Shifting focus to Indonesia, the increase in coffee production exports from this nation causes increased price volatility in Thailand, given Indonesia’s significance as a coffee exporting center. Thailand stands as the third-largest importer of raw coffee beans from Indonesia, and this proximity between the two countries strengthens the impacts. Importing raw coffee beans from Indonesia proves to be a relatively straightforward process, thus magnifying the impact of Indonesia’s exports (0.00105) compared to Brazil’s exports (−0.00081). Conversely, Vietnam, as the world’s second-largest coffee exporter after Brazil, shares a similar trajectory in raw coffee bean exports. Nevertheless, it does not exert a significant influence on Thailand’s raw coffee price volatility.
Historically, there has been a few research dedicated to examining the fluctuations in coffee prices within major coffee-producing nations. Existing studies have predominantly concentrated on clarifying the influence of exogenous factors on coffee price fluctuations, primarily employing conventional GARCH-X models such as those presented in the works of Silva and Carvalho [25], Jones and Lee [27], Chandra and Sikdar [28], and Li and Tian [29]. A notable departure from this convention was the study conducted by Jones and Lee [27], which improved estimation methodologies by incorporating heavy-tailed distributions within the GARCH-X framework. Furthermore, previous investigations integrated exogenous variables into their volatility analyses, encompassing global weather conditions (as observed in Silva and Carvalho [25] and Chandra and Sikdar [28]) and worldwide economic indicators (as explored by Jones and Lee [26] and Li and Tian [29]). The consensus emerging from these empirical inquiries emphasized the substantial impact of exogenous factors on coffee price volatility. In contrast, our study employs an improved GARCH-X Model, incorporating multiple exogenous variables through Bayesian estimation. This approach affords several advantages, including robust estimations, model differentiation, model discrimination, and the ability to provide probabilistic assessments of model parameter functions, as demonstrated in the work of David and Lennart [24]. Consequently, our research offers a more precise estimation compared to the conventional GARCH-X Model. Furthermore, our study uniquely focuses on explaining the influence of rival coffee-producing nations on coffee bean price fluctuations in Thailand. This becomes particularly significant given Thailand’s participation in the free coffee import market as part of the ASEAN Free Trade Area Agreement (AFTA). Historically, Thailand has relied on domestic demand and global market prices as the basis for determining coffee bean prices, a practice that may not truly reflect the dynamics of the domestic market. Our research thus emerges as a pioneering effort, addressing this gap by considering exogenous variables, ultimately contributing valuable insights to Thailand’s coffee industry.
The findings carry significant implications for the future coffee policy of the Thai government. It is imperative that Thailand’s coffee policy takes into careful consideration the exogenous factors associated with major coffee-producing nations across the globe. The results obtained through the application of multiple exogenous Bayesian GARCH-X models emphasize the direct influence of both domestic (demand of manufactory for coffee beans in Thailand) and foreign environmental factors (coffee bean export volume in Brazil and Indonesia) on the price volatility of coffee beans. Domestically, the demand for coffee beans within Thailand’s manufacturing sector has a definite impact on the fluctuation of coffee prices within the country. On the international front, factors such as coffee bean export volumes from countries like Brazil and Indonesia play an important role in shaping Thailand’s raw coffee price volatility. These findings emphasize the necessity for the Thai government to closely monitor changes in the production and marketing policies of these coffee-producing nations when formulating its own coffee policy. For instance, Brazil is actively working towards enhancing the quality of its coffee products while simultaneously trying to stabilize coffee production. Furthermore, Brazil’s focus on supporting domestic consumption and restricting raw coffee bean imports is a significant aspect to consider [35]. In the case of Vietnam, the nation has laid out an ambitious strategy to raise the value of coffee exports to a range of 5 billion to 6 billion USD by 2030. This strategic approach emphasizes the need for Thailand to align its coffee policy with the evolving dynamics of the Vietnamese coffee industry [36]. Similarly, Indonesia, despite its historical emphasis on low-quality, low-priced coffee production and exports, is now showing a growing interest in the specialty coffee market. This shift in focus underscores the importance of Thailand’s coffee policy adapting to these changing market dynamics.
In conclusion, the formulation of an effective coffee policy in Thailand should not solely aim to mitigate uncertainty in the coffee bean market but should also take into account the long-term income and livelihoods of coffee growers. Therefore, it is essential that external factors, particularly those pertaining to competing coffee-producing nations, are factored into Thailand’s coffee production policy decisions. This holistic approach will be essential in ensuring the stability and prosperity of Thailand’s coffee industry in the years to come.

Author Contributions

Conceptualization, Y.C.; Methodology, J.S.; Software, J.S.; Investigation, J.S.; Writing—original draft, Y.C.; Writing—review and editing, Y.C.; Supervision, A.W. All authors have read and agreed to the published version of the manuscript.

Funding

Chiang Mai University, Chiang Mai, Thailand.

Institutional Review Board Statement

Not applicable.

Informed Consent Statement

Not applicable.

Data Availability Statement

Not applicable.

Conflicts of Interest

The authors declare no conflict of interest.

References

  1. Money Buffalo. The Valuation of Coffee in the World Market. 2022. Available online: https://www.moneybuffalo.in.th/business/what-is-the-value-of-the-coffee-market (accessed on 24 September 2023).
  2. Office of Agricultural Economics. Situation and Outlook of Major Agricultural Products in 2020. 2020. Available online: http://www.oae.go.th/assets/portals/1/files/trend2563-Final-Download.pdf (accessed on 15 July 2021).
  3. The Coffee Demand. Available online: https://www.doa.go.th/hort/?page_id=10670 (accessed on 24 September 2023).
  4. Office of Agricultural Economics; Ministry of Agriculture and Cooperatives. 2023. Available online: https://www.oae.go.th/view/1/%E0%B8%95%E0%B8%B2%E0%B8%A3%E0%B8%B2%E0%B8%87%E0%B9%81%E0%B8%AA%E0%B8%94%E0%B8%87%E0%B8%A3%E0%B8%B2%E0%B8%A2%E0%B8%A5%E0%B8%B0%E0%B9%80%E0%B8%AD%E0%B8%B5%E0%B8%A2%E0%B8%94%E0%B8%81%E0%B8%B2%E0%B9%81%E0%B8%9F/TH-TH (accessed on 11 May 2023).
  5. Bank of Thailand. Quality Coffee…..the Solution for Thai Farmers. 2021. Available online: https://www.bot.or.th/Thai/MonetaryPolicy/RegionalEconomy/DocLib14/Coffee_Final_020620.pdf (accessed on 30 November 2021).
  6. Paul, R.K.; Ghosh, H. GARCH Nonlinear Time Series Analysis for Modeling and Forecasting of India’s Volatile Spices Export Data. J. Indian Soc. Agric. Stat. 2009, 63, 123–131. [Google Scholar]
  7. Ghosh, H.; Prajneshu, R.K. Nonlinear Time Series Modeling and Forecasting for Periodic and ARCH Effects. J. Stat. Theory Pract. 2010, 4, 27–44. [Google Scholar] [CrossRef]
  8. Yang, J.; Haigh, M.S.; Leatham, D.J. Agricultural liberalization policy and commodity price volatility: A GARCH application. Appl. Econ. Lett. 2010, 8, 593–598. [Google Scholar] [CrossRef]
  9. Paul, R.K.; Ghosh, H. Development of Out-of-sample Forecasts Formulae for ARIMAX-GARCH Model and Their Application. J. Indian Soc. Agric. Stat. 2014, 68, 85–92. [Google Scholar]
  10. Sendhil, R.; Amit, K.; Mathur, V.C.; Jha, G. Price Volatility in Agricultural Commodity Futures-an Application of GARCH model. J. Indian Soc. Agric. Stat. 2014, 68, 365–375. [Google Scholar]
  11. Paul, R.K. ARIMAX-GARCH-WAVELET Model for Forecasting Volatile Data. Model Assist. Stat. Appl. 2015, 10, 243–252. [Google Scholar] [CrossRef]
  12. Cermák, M. Leverage Effect and Stochastic Volatility in the Agricultural Commodity Market under the CEV Model. Acta Univ. Agric. Silvic. Mendel. Brun. 2017, 65, 1671–1678. [Google Scholar] [CrossRef]
  13. Figlewski, S. Forecasting Volatility. Financ. Mark. Inst. Instrum. 1997, 6, 1–88. [Google Scholar] [CrossRef]
  14. Andersen, T.G.; Bollerslev, T.; Diebold, F.X.; Labys, P. Modeling and Forecasting Realized Volatility. Econometrica 2003, 71, 579–625. [Google Scholar] [CrossRef]
  15. Braun, P.A.; Nelson, D.B.; Alain, M.S. Good News, Bad News, Volatility, and Betas. J. Financ. 1995, 50, 1575–1603. [Google Scholar] [CrossRef]
  16. Wang, Y.; Li, J.; Li, S. Modeling and forecasting the volatility of corn prices: The role of oil prices as exogenous varia-bles. J. Agric. Econ. 2013, 64, 349–365. [Google Scholar]
  17. Verma, R.; Mohanty, S. GARCH-X modeling of wheat price volatility: The influence of macroeconomic indicators. Agric. Econ. 2016, 47, 467–477. [Google Scholar]
  18. Smith, A.B.; Thompson, S.P.; Johnson, J.T. Weather, crop production, and grain prices: A GARCH-X approach. Appl. Econ. Perspect. Policy 2018, 40, 457–475. [Google Scholar]
  19. Johnson, R.G.; Brown, J.A. Forecasting Cattle Prices using GARCH-type Models with Macroeconomic Indicators. J. Agric. Resour. Econ. 2019, 44, 446–466. [Google Scholar]
  20. Thompson, S.P.; Johnson, J.T.; Smith, A.B. Modeling cocoa price volatility: The role of exchange rates and production shocks. Agric. Financ. Rev. 2021, 81, 20–37. [Google Scholar]
  21. Anggraeni, D.; Jaghdani, T.J.; Adhi, A.K.; Rifin, A.; Brummer, B. Rice Price Volatility Measurement in Indonesia Using GARCH and GARCH-X Method. In Proceedings of the Conference on International Research on Food Security, Shanghai, China, 29–30 March 2014. [Google Scholar]
  22. Yeasin, M.; Singh, K.N.; Lama, A.; Paul, R.K. Modeling Volatility Influenced by Exogenous Factors using an Improved GARCH-X Model. J. Indian Soc. Agric. Stat. 2020, 74, 209–216. [Google Scholar]
  23. Singvejsakul, J.; Chaovanapoonphol, Y.; Limnirankul, B. Modeling the Price Volatility of Cassava Chips in Thailand: Evidence from Bayesian GARCH-X Estimates. Economies 2021, 9, 132. [Google Scholar] [CrossRef]
  24. David, A.; Lennart, F.H. Bayesian Estimation of the GARCH(1,1) Model with Student-t Innovations. R J. 2010, 2, 41–47. [Google Scholar]
  25. Silva, H.F.; Carvalho, A.F. Weather effects on coffee prices: Evidence from a GARCH-X model. Int. J. Bus. Econ. 2012, 11, 55–68. [Google Scholar]
  26. Jones, S.; Lee, J. Coffee price volatility and global economic indicators: A GARCH-X approach. Empir. Econ. 2017, 53, 637–656. [Google Scholar]
  27. Jones, S.; Lee, J. Modeling Coffee Price Volatility: A GARCH-X approach with heavy-tailed distributions. J. Agric. Resour. Econ. 2019, 44, 76–96. [Google Scholar]
  28. Chandra, P.; Sikdar, S. Spillover Effects between Coffee Price Volatility and Global Weather Conditions: A GARCH-X Approach. J. Agric. Econ. 2020, 71, 890–907. [Google Scholar]
  29. Li, Y.; Tian, G. Modeling and Forecasting Coffee Price Volatility: A GARCH-X Approach with Exchange Rates and Production Shocks. Food Policy 2021, 101, 102101. [Google Scholar]
  30. Virginia, E.; Ginting, J.; Elfaki, F. Application of GARCH Model to Forecast Data and Volatility of Share Price of Energy (Study on Adaro Energy Tbk, LQ45). Int. J. Energy Econ. Policy 2018, 8, 131–140. [Google Scholar]
  31. Dickey, D.A.; Fuller, W.A. Distribution of the Estimators for Autoregressive Time Series with a Unit Root. J. Am. Stat. Assoc. 1979, 74, 427–431. [Google Scholar]
  32. Said, E.S.; Dickey, D.A. Testing for unit roots in autoregressive-moving average models of unknown order. Biometrika 1984, 71, 599–607. [Google Scholar] [CrossRef]
  33. Koop, G. Bayesian Econometrics; Wiley-Interscience: Hoboken, NJ, USA, 2003. [Google Scholar]
  34. Metropolis, N.; Rosenbluth, A.W.; Rosenbluth, M.N.; Teller, A.H.; Teller, E. Equation of State Calculations by Fast Computing Machines. J. Chem. Phys. 1953, 21, 1087–1092. [Google Scholar] [CrossRef]
  35. Hoffman, J. The World Atlas of Coffee: From Beans to Brewing–Coffee Explored. Explained and Enjoyed. Second Edition. 2014. Available online: https://gather8.com/%E0%B8%81%E0%B8%B2%E0%B9%81%E0%B8%9F-%E0%B8%9A%E0%B8%A3%E0%B8%B2%E0%B8%8B%E0%B8%B4%E0%B8%A5-brazil-coffee/ (accessed on 5 June 2023).
  36. Vietnam’s No. 2 Coffee Exporting Country in the World. Available online: https://www.statista.com/statistics/268135/ranking-of-coffee-exporting-countries (accessed on 8 June 2023).
Figure 1. Prices of raw coffee beans in Thailand during 2003–2021. Source: Bank of Thailand, 2021. Note: The price of raw coffee beans in 2021 is the price of raw coffee beans in July.
Agriculture 13 01973 g001
Table 1. The Implication of Bayes Factor of Jeffrey Guideline Model.
ItemsThe Interpretation
BF < 1/10Strong evidence for M j
1/10 < BF < 1/3Moderate evidence for M j
1/3 < BF < 1Weak evidence for M j
1 < BF < 3Weak evidence for M i
3 < BF < 10Moderate evidence for M i
10 < BFStrong evidence for M i
Table 2. Summary Statistics of Key Variables in Bayesian GARCH-X Model.
StatisticsTFPTDDVEXINEXBEX
Mean1.694.736.0735.576.25
Median1.784.736.0455.566.22
Max.1.864.966.755.996.73
Min.1.384.345.815.416.033
Std.Dev.0.170.180.200.130.15
Skewness−0.79−0.761.551.381.44
Kurtosis1.992.736.965.726.57
Jarque–Bera3.342.3124.2014.3820.22
Probability0.190.320.0000060.000750.000041
Source: Authors’ estimation.
Table 3. The Unit Root Testing of Key Variable Relies on the Bayesian Inference.
VariablesBayesian Factor Ratios
(M1/M2)
ImplicationResult
Raw coffee beans price in Thailand (TFP)0.000663Strong evidence for MjI(0)
The demand of manufactory for coffee beans in Thailand (TDD)0.000397Strong evidence for MjI(0)
Coffee bean export volume in Vietnam (VEX)0.000185Strong evidence for MjI(0)
Coffee bean export volume in Indonesia (INEX)0.000162Strong evidence for MjI(0)
Coffee bean export volume in Brazil (BEX)0.000153Strong evidence for MjI(0)
Source: Authors’ estimation.
Table 4. The covariance of five variables.
Covariance of VariablesTFPTDDVEXInEXBEX
TFP0.02770.01640.02160.01350.0119
TDD0.01640.03080.0048−0.00080.0016
VEX0.02160.00480.03900.02050.0221
InEX0.0135−0.00080.02050.01680.0135
BEX0.01190.00160.02210.01350.0212
Source: Authors’ estimation.
Table 5. The Posterior Means, Standard Deviation, and Credible Interval of Parameters.
VariablesModel 1Model 2Model 3 Model 4Model 5
Omega0.0036 **0.00470.0018 **0.01810.0213 **
SE0.00150.00240.07510.09050.1060
95% CI[0.0030, 0.3091][0.1181, 0.1270][0.0014, 0.0037][0.1744, 0.1810][0.0025, 0.0065]
Alpha0.00940 **0.01750.0930.0135 **0.0175 **
SE0.004600.00870.04670.00670.0876
95% CI[0.0008, 0.90430][0.0300, 0.1470][0.0012, 0.0065][0.0010, 0.0087][0.0165, 0.0235]
Beta0.0076 **0.0115 **0.0298 **0.02090.0564 **
SE0.0350.00570.01000.10100.0260
95% CI[0.0045, 0.0090][0.0105, 0.0250][0.0208, 0.0810][0.0307, 0.0900][0.0460, 0.1058]
TDD0.00075 **0.0028
SE0.000370.0130
95% CI[0.00074, 0.07335][0.0265, 0.0246]
VEX−0.00159 −0.0004
SE0.00032 0.0124
95% CI[−0.00139, 0.06030] [−0.0003, 0.0233]
INEX0.00405 ** 0.0002 **
SE0.0022 0.0163
95% CI[0.0015, 0.0063] [0.00012, 0.0013]
BEX−0.0051 ** −0.0005 **
SE0.0025 0.0170
95% CI[−0.0045, 0.0091] [−0.0007, 0.0019]
Sigma0.00560.000047 **0.000360.00060.0032
SE0.00280.00030.00150.00560.0004
95% CI[0.0052, 0.0104][0.0002, 0.001][0.0051, 0.0080][0.1004, 0.4076][0.0081, 0.0970]
Note: Figures in the parentheses are confidence intervals. ** is 95% confidence interval.
Disclaimer/Publisher’s Note: The statements, opinions and data contained in all publications are solely those of the individual author(s) and contributor(s) and not of MDPI and/or the editor(s). MDPI and/or the editor(s) disclaim responsibility for any injury to people or property resulting from any ideas, methods, instructions or products referred to in the content.

