Abstract
Insurance purchase and organization participation in risk management is of great practical significance for stabilizing agricultural production and household income. The aims of this study were to analyze farm households’ choices of insurance purchase and organization participation, and their effects on crop revenue and its higher-order moments using the multinomial switching endogenous regression (MESR) model. The results showed that the adoption of insurance and organization was significantly affected by household head characteristics, farm household characteristics, and cropland attributes. Insurance purchase, organization participation, and their joint adoption contributed to the increase in crop revenue and decrease in crop revenue variance, and the benefits were larger when adopting two risk management tools in combination. When skewness was taken into account in risk management analysis, insurance purchase, organization participation, and their joint adoption resulted in a reduction in the probability of crop failure, of which, participating in organizations was the most effective. Efforts should be put forth to improve the functioning and effectiveness of agricultural insurance and organization to promote the adoption of risk management tools.
1. Introduction
Uncertainty is a common phenomenon in agricultural production [1], and farm households are frequently exposed to a variety of risks in their production process [2,3]. To reduce the uncertainty or losses caused by risks, farm households usually use a variety of risk management strategies [4,5]. Agricultural insurance is an instrument of choice in many countries for helping farm households cope with risks and compensate for losses [6,7], and China is no exception. According to the Ministry of Finance of China, China’s agricultural insurance premiums reached CNY 119.20 billion in 2022, of which the central government contributed CNY 43.45 billion as premium subsidies and agricultural insurance provided risk protection of CNY 5.46 trillion for 167 million farm households. Both ex-ante risk management effects and ex-post income effects on farming practices could result from purchasing agricultural insurance [8]. On the other hand, various organizations such as cooperatives and leading enterprises are expanding rapidly in China. Taking cooperatives as an example, about 2.24 million cooperatives were operating nationwide by the end of 2022, according to data from the State Administration of Market Regulation of China. For farm households, participation in various organizations is also an important risk management tool, and can redistribute risks between the contracting parties by signing sales or production contracts, prompting other entities in the industrial chain to jointly cope with risks through risk-sharing mechanisms [9]. In the new development period, in which various types of uncertainties and risks are superimposed and interacting, the diversification of production practices, the cultivation of low-yielding but resistant varieties, and other informal risk-sharing mechanisms either cost too much or offer inadequate protection [3]. Therefore, it is of great significance to analyze the effects had by insurance purchase and organization participation in risk management, which is beneficial for stabilizing agricultural production, ensuring food security, and protecting household income.
Studies have revealed that agricultural insurance could transfer part of the losses caused by risks and uncertainties from farm households to insurance institutions [2,7]; this helps farm households to reduce substantial risks, which directly results in highly volatile incomes [3,10], and contributes to a decline in the distress sale of productive assets to stabilize agricultural production [11,12]. Meanwhile, agricultural insurance could improve farm households’ planting decisions by protecting them from the downside [3], and the investments in agricultural production as well as the adoption of improved technology could increase after farm households purchase agricultural insurance [13,14,15]; this is expected to generate higher yields or revenues for farms [3,8].
Cooperatives and other similar organization forms play a significant role in helping farm households connect with modern agricultural production by giving full play to various service functions [16,17], where farm households can enjoy technical or information services, the unified purchase of agricultural production materials, or the unified sale of products and other services [18,19,20]. Organizations could also increase household incomes through the pathways of reducing the transaction costs caused by incomplete or asymmetric information and asset specialization [21,22], uniting dispersed farm households to enhance their market bargaining power [20,23,24], and improving the quality of agricultural products to obtain premiums [25,26,27,28]. Additionally, organizations could promote the establishment of a stable profit linkage mechanism between agricultural leading enterprises and farm households, and contractual models such as ‘farm households + leading enterprises’ could offer farm households quality inputs, advanced technology, adequate information, and extension services, helping share production risk with farm households, and help them to gain benefits from higher yields or better quality [9,25,26].
However, farm households’ adoption of risk management tools is likely influenced by many factors, such as personal and household characteristics, farm characteristics and production conditions, and natural conditions [29,30,31]. Farm households can adopt different risk management tools individually or jointly [32], and decisions about risk management are often made simultaneously [31]. The majority of previous studies have examined the impacts of insurance purchase or organization participation individually, and since the total effect is not necessarily equal to the sum of the effects of using each tool separately [33], the estimates may be biased if they fail to consider the possibility that farm households may use two risk management tools in combination. It is necessary to consider a unified framework for analyzing their effects, and since agricultural insurance is the most used risk management measure in China, it is important to consider the relative impact of agricultural insurance compared to other risk management tools. On the other hand, most of the studies that have been conducted to analyze the effects of insurance purchase or organization participation focus only on the impact on revenue itself and less on the impact on its higher-order moments (i.e., variance and skewness), whereas assessing the dispersion of the actual revenue and the probability of it being lower than the expected revenue is an important aspect of measuring risk management effects. Therefore, based on 2020–2022 China Land Economic Survey (CLES) data with a sample of 2921 staple grain crop growers, this study employs the MESR model, which is used to correct for the selection bias and endogeneity originating from both observed and unobserved heterogeneity [30], to analyze farm households’ insurance purchase and organization participation in decision-making and its influencing factors, as well as the effects of insurance purchase, organization participation, and their joint adoption on farm households’ crop revenue and its higher-order moments. Less information, to the authors’ knowledge, is available on this issue, and it might be something that this study adds.
2. Materials and Methods
2.1. Data Source
All the data used in this study came from the Nanjing Agricultural University-China Land Economic Survey (CLES). CLES completed the baseline survey in 2020, which covered 13 cities in Jiangsu Province, with 2 counties in each city and 2 villages in each county, totaling 52 administrative villages and 2600 farm households. In 2021, CLES completed tracking surveys in 48 villages in 24 counties in 12 cities, with an average tracking rate of 63.8%. In 2022, CLES completed tracking surveys in 24 villages in 12 counties in 6 cities, collecting 1203 questionnaires from farm households, with an average tracking rate of 56.4%. In this study, farm households that grew three staple grain crops (rice, wheat, corn) were selected as the study samples. Based on this, the final sample of this study, after the treatment of vacancies, extremes, etc., consisted of 2921 farm households, of which the samples for years 2020, 2021, and 2022 were divided into 1325, 1122, and 474 farm households, respectively.
2.2. Estimation Strategy
The adoption of risk management tools by farm households is not exogenous but is influenced by a combination of observable and unobservable factors, and the unobservable factors may affect farm households’ income and its higher-order moments at the same time, which gives rise to sample self-selection problems and endogeneity problems. Therefore, this study addresses the above issues using the MESR approach, which belongs to the category of instrumental variables approach [31] and is able to simultaneously model the choice of different risk management tools within a unified analytical framework and to analyze the complementarity or substitutability between different tools [29]. The MESR starts by using a multinomial logit selection model to estimate a choice equation for farm households’ risk management tools and then incorporates the inverse Mills ratio, which is estimated in the first stage, as a choice correction term in the second-stage outcome equation to control for selection bias [32,34].
2.2.1. Adoption of Risk Management Tools
The first stage of MESR analyzes farm households’ adoption of risk management tools utilizing the multinomial logit selection model. In this study, farm households face four mutually exclusive choices of risk management tools, including insurance purchase, organization participation (organizational forms include cooperatives, leading enterprises, cooperatives + leading enterprises, and others), the joint adoption of both, and the adoption of neither. A rational farm household will adopt a risk management tool if the expected utility of adopting is larger than the expected utility of not adopting, and since risk management involves the use of limited resources, farm households usually choose the risk management tool that brings the largest expected utility [29]. The level of utility associated with the choice of different risk management tools is represented by the latent variable Uij*:
where , that is, the farm household i will choose the j (j = 1, …, 4) risk management tool if the expected utility of the j tool is larger than that of any other tool k (k ≠ j). Zi denotes a series of explanatory variables, including household head characteristic variables, such as age, gender, education, non-farm employment, and risk preference; farm household characteristic variables, such as households with the Communist Party of China (CPC) members, household size, and access to different kinds of technology; and cropland characteristic variables, such as land size, fragmentation, irrigation capacity, fertility, and disaster-affected [29,30]. Moreover, the estimates of the multinomial logit selection model may be inconsistent if unobserved factors are correlated with the explanatory variables; therefore, the means of all the time-varying explanatory variables were included [35,36]. Additionally, assuming that the random error term εij is identically and independently Gumbel distributed (IIA hypothesis), the probability that farm household i chooses the j risk management tool can be expressed as follows [37]:
The fundamental limitation of estimating the multinomial logit selection model is the IIA assumption that the relative probability of adopting any risk management tool is independent of other available choices, whereas the methodology employed by Bourguignon et al. (2007) [34] showed that the use of a multinomial logit selection model offered robust selection bias corrections for the outcome equation, even if the IIA assumption was violated [38].
2.2.2. Effects of Risk Management Tools
The second stage of MESR estimates the impacts of different risk management tools by constructing the following equation:
where Yi denotes the crop revenue and its higher-order moments of farm household i in Regime 1 to J. Factors influencing farm households’ choice of risk management tools may also influence their crop revenue, so the second-stage outcome Equation (3) could share the explanatory variables included in the first-stage choice Equation (1), with input variables such as seed, fertilizer, machinery, and labor [29,39]. The means of all time-varying explanatory variables are also included. The random error term μi has a mean of 0 and a variance of σ2. If the error term μi of the outcome Equation (3) and the error term εi of the choice Equation (1) are correlated, the OLS estimates of Equation (3) are inconsistent. Therefore, following Kassie et al. (2015) [40] and Khonje et al. (2018) [30], the second stage of MESR with consistent estimates can be specified as follows:
where σ is the covariance of the error terms μi and εi. is the Inverse Mills Ratio , which is calculated from the estimated probabilities in Equation (2), and ρ is the correlation coefficient of the error terms μi and εi. θi is the random error term. In addition, to correctly identify the MESR model, it is necessary to ensure that Zi includes at least one explanatory variable that is not included in Xi [31,32,40], which affects farm households’ choice of risk management tool but does not directly affect their crop revenue and its higher-order moments. In this study, cadre households and information services were selected as instrumental variables. Cadre households may affect farm households’ access to information, and information may affect farm households’ perception of agricultural risk management and their ability to shift production resources to agricultural risk management [39,41], which satisfies the relevance constraints of the instrumental variables. This study further verifies the acceptability of the instrumental variables through a simple falsification test [41] and endogeneity tests [42,43].
Additionally, the residuals of the revenue equation were used to compute the higher-order moments of the crop revenue based on the moment-based approach [44], which has been widely used in studies analyzing risk and risk management [39,45,46,47]. Consider a stochastic production function for a risk-averse farm household , where y denotes crop revenue, and the explanatory variables X are the same as in Equation (3). υ is a random variable denoting risk, i.e., uncontrollable factors affecting crop revenue. Assume that:
where is the first-order central moment (mean), and the higher-order moments of can be expressed as:
where is the second-order central moment (variance), which represents the dispersion of revenue from its mean, and is the third-order central moment (skewness), which represents the probability that the actual revenue is lower than the expected revenue.
2.2.3. Counterfactual Analysis and Treatment Effects
The third stage of MESR estimates the average treatment effect on the treated (ATT) of choosing different risk management tools by comparing the level of farm households’ crop revenue and its higher-order moments when choosing to take a certain risk management measure (factual outcome) with the outcomes when not choosing a certain risk management measure (counterfactual outcome).
Adopters with adoption (factual outcome):
Adopters had decided not to adopt (counterfactual outcome):
The unbiased estimate of ATT can be obtained by taking the difference between Equations (7) and (8),
3. Results
3.1. Statistical Description
Farm households’ adoption of different risk management tools is presented in Figure 1. For the full sample, 47.72% of the farm households neither purchased insurance nor participated in organizations. In total, 48.96% of the farm households only purchased insurance, 1.44% of the households only participated in organizations, and 1.88% of the farm households jointly purchased insurance and participated in organizations.
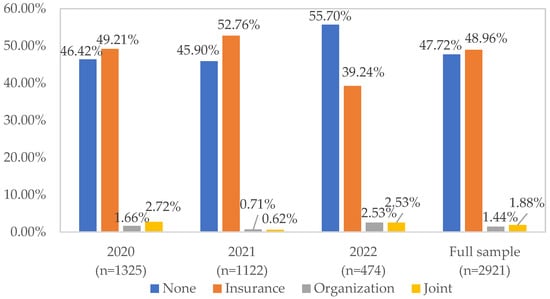
Figure 1.
Adoption of risk management tools by farm households.
Table 1 provides a statistical description of the main variables used in this study. In total, 92.8% of the farm household heads were males. The average age of the household heads was approximately 63 years, and their average education level was about 7 years. In total, 31.8% of the household heads had non-agricultural employment, and most of them (77.4%) were risk-averse. Farm households with CPC members accounted for 26.7% of all farm households, and the number of people permanently living in a household was about 3 persons. In total, 24.0% and 19.7% of the farm households had received planting technical services and disaster reduction technical services, respectively. The average size of the cropland operated by farm households was about 33 mu, and the average number of cropland plots was 8. In total, 60.5% of the cropland was conveniently irrigated, and 29.3% of the cropland had good fertility. The average number of times cropland had been affected by disasters in the past three years was 0.4. The costs per mu for seed, fertilizer, machinery, and hired labor were about CNY 138, CNY 316, CNY 218, and CNY 47, respectively. Meanwhile, farm households themselves worked approximately 32 days per mu to grow crops. The output value of the three staple grain crops per mu was about CNY 1922.

Table 1.
The statistical description of model variables.
3.2. Results of Multinomial Logit Selection Model
The coefficients and robust standard errors from the pooled multinomial logit selection model are reported in Table 2. The result of the Wald test (χ2(102) = 5154.52; p = 0.000) rejected the null hypothesis that all coefficients for explanatory variables were jointly equal to zero. The risk management measure of “None”, that is, households that neither purchased insurance nor participated in organization, was the reference category.
Table 2.
Multinomial logit model estimates of adoption of risk management tools.
The relative probability of purchasing insurance was significantly positive for farm household heads’ characteristics age and education, suggesting that older and better-educated household heads were more likely to purchase agricultural insurance. Male and older household heads had a higher probability of jointly adopting insurance and organization. Farm household heads who had off-farm employment were more likely to jointly adopt insurance and organization. The relative probability of jointly adopting insurance and organization decreased with the farm household size. Farm households that had received planting technical services provided by government agricultural extension departments, universities, research institutes, new agricultural business entities, or specialized agricultural technology service institutions were more likely to participate in organizations or jointly adopt insurance and organization. The relative probability of participating in organizations increased with cropland size, while the relative probability of jointly adopting insurance and organization decreased with cropland plots.
Additionally, the district dummies were included to account for possible heterogeneity in other factors (such as geographical conditions and climatic conditions) affecting farm households’ adoption of risk management tools. The joint significance of district dummies indicates that there were considerable differences in the locational characteristics among the districts of Sunan, Suzhong, and Subei.
3.3. Results of Treatment Effects
The bias-corrected estimates of the functions of crop revenue mean, variance, and skewness are presented in Appendix A (Table A1, Table A2 and Table A3). Table A1, Table A2 and Table A3 show that some of the inverse Mills ratios were statistically significant, indicating the presence of self-selection in the adoption of risk management tools. Additionally, a falsification test was used to verify the relevance and exclusion restrictions of the instrumental variables, that is, to check whether the instrument variables were significant in the choice equation, but not in the outcome equation. The results showed that the instrument variables were significant in the choice equation (χ2(6) = 18.04; p = 0.006), as shown in Table 2, but that they had no significant impact on revenue and its higher-order moments, as shown in Table A1, Table A2 and Table A3. Meanwhile, the two-stage least square (2SLS) and the generalized method of moments (GMM) estimators were used to examine the exogeneity of the instrumental variables. The Durbin and Wu–Hausman tests for the 2SLS and C-statistics for the GMM were insignificant; therefore, the null hypothesis that the instrument variables were exogenous could not be rejected, as shown in Table A4.
The average treatment effects of the adoption of risk management tools on revenue and its higher-order moments are presented in Table 3. The results in column (3) of the first part of Table 3 reveal that insurance purchase and organization participation were associated with a significant increase in crop revenue. It can be observed that in each case, farm households who adopted risk management tools would have earned less revenue had they not adopted them. Farm households who jointly purchased agricultural insurance and participated in organizations had the highest revenue gain of CNY 440.330, followed by those participating in organizations alone, with CNY 296.847, and those purchasing agricultural insurance alone, with CNY 121.137. More precisely, column (4) showed that revenue increased by 6.92%, 20.15%, and 29.09% for farm households who purchased agricultural insurance, participated in organizations, and jointly purchased agricultural insurance and participated in organizations, respectively.
Table 3.
ATT of risk management tools on revenue and its higher-order moments.
The results in column (3) of the second part of Table 3 show that purchasing agricultural insurance and participating in organizations reduced variance in crop revenue, and the extent of reduction was larger when two risk management tools were adopted in combination. Nevertheless, participating in organizations appeared to be more effective than purchasing agricultural insurance. More precisely, revenue variance decreased by 28.54%, 57.48%, and 69.98% for farm households who purchased agricultural insurance, participated in organizations, and jointly purchased agricultural insurance and participated in organizations, respectively, as shown in column (4).
The results in column (3) of the third part of Table 3 show that insurance purchase, organization participation, and the joint adoption of insurance and organization made crop revenue skewness increase, but only organization participation obtained a positive skewness. Further, column (4) shows that revenue skewness increased by 28.76%, 114.96%, and 72.76% for farm households who purchased agricultural insurance, participated in organizations, and jointly purchased agricultural insurance and participated in organizations, respectively.
4. Discussion
4.1. Factors Affecting Farm Households’ Adoption of Risk Management Tools
The adoption of risk management tools contributes to stabilizing farm revenue during times of uncertainty, but it can also come at a net cost to farm households [31]. Therefore, farm households will choose what they believe to be the best risk management strategy given their circumstances and risk potential. All the household head characteristics, farm household characteristics, and cropland attributes had a significant impact on the choice of risk management tool.
The head of the household is usually the decision maker in a household’s production operations, and their characteristics such as gender, age, and education often have a significant impact on risk management decisions. Farm households engaged in off-farm employment may not have enough time for self-protection from risks [10] and may have fewer financial constraints; therefore, they are more likely to simultaneously adopt multiple tools to cope with risks.
Household size could be used to measure labor availability [16], and sufficient labor availability may reduce the likelihood of adopting multiple risk management tools. Various institutes, such as government agricultural extension departments, universities, research institutes, new agricultural business entities, and specialized agricultural technology service institutions, often provide technical services to farm households, improving farm households’ access to new production technologies and facilitating their adoption of new production technologies. Farm households that are active in adopting new technology tend to join the organizations [19].
Farm size is an important factor in agricultural production and is a significant driver of the adoption of risk management tools [29,31]. Large farm sizes contribute to lower average fixed costs of membership [16], and large-scale farms are more likely to be offered a contract for the transaction cost-saving benefit of the processor [48]. Hence, land acreage, which is always used to measure farm size [48], has a positive and significant effect on the probability of organization participation. Land fragmentation is mainly considered to be detrimental to crop specialization and cooperative development [49], but some evidence shows that land fragmentation, as an insurance alternative or an effective risk management strategy, could reduce exposure to risks [50,51]. This prevents farm households from utilizing risk management tools in both an objective and subjective way.
The findings in the present study are useful in understanding the details of the factors influencing the individual or joint adoption of different risk management tools by farm households.
4.2. Impacts of Adoption of Risk Management Tools on Crop Revenue
The impacts on the mean, variance, and skewness of crop revenue varied among different risk management tools. Our results showed that insurance purchase, organization participation, and the joint adoption of insurance and organization all contributed to an increase in crop revenue and decrease in crop revenue variance. This is consistent with expectations because crop production benefits from agricultural insurance, which helps to mitigate risks, reduce losses, stabilize production, and improve decision-making [6,7,11,12,13,14], thus contributing to both higher revenues and lower volatility. Similarly, participating in organization forms such as cooperatives and leading enterprises helps farm households to cope with risks through risk-sharing mechanisms, as well as gain benefits from lower costs, higher yields, or better quality [9,21,22,23,24,27,28]. Additionally, as far as risk management is concerned, the benefits were larger in the case of the joint adoption of insurance and organization, which were consistent with the results of existing studies [29,30,32], and the highest revenue gain and variance reduction for joint adoption suggested that there was complementarity or synergy between insurance purchase and organization participation.
Because the variance does not distinguish between unexpected bad events and unexpected good ones, it is crucial to take skewness into account in risk management analysis [45]. The effects of the adoption of risk management tools on the skewness capture the exposure to downside risk. The skewness of crop revenue increasing and becoming positive indicates a decrease in downside risk exposure, and further, a decrease in crop failure risk [29,39,45]. Our results showed that farm households that adopt risk management tools could obtain the benefits of a reduction in the probability of crop failure [29,39], and especially, farm households who participate in organizations could see a larger reduction in the probability of crop failure compared to those who adopt other risk management tools. Organization forms such as ‘farm households + cooperatives’, ‘farm households + leading enterprises’, and ‘farm households + cooperatives + leading enterprises’ help farm households to access advanced technical services, adequate information services, and unified purchase or sales services [18,19,20,25,26], thus improving farm households’ connection with modern agricultural production and lowering the probability of crop failure.
The findings in the present study have important implications for governments’ policy planning and policy promotion, as well as farm households’ budget allocation towards risk management tools.
4.3. Future Strategies for Risk Management
Despite being less effective in increasing crop revenue and reducing downside risk exposure, agricultural insurance is nonetheless a crucial risk management tool for farm households in developing countries due to its high coverage and wide range of products. Traditional agricultural insurance should be further acted upon in terms of expanding the coverage of insurance liability and improving the level of insurance protection. Meanwhile, the pilot programs for income insurance and full-cost insurance should be gradually expanded, with the scope of policy implementation being orderly expanded (e.g., by including small-scale farms in the scope of coverage), and the capacity of policy implementation being continuously improved (e.g., by reducing the burden of premium subsidies on local governments).
Organizations play an important role in risk management, especially in reducing downside risk exposure. However, our statistical description results showed that the number of farm households joining organizations remained low, and the previous study revealed that small-scale farms might be excluded from contract farming in China [19]. Small-scale farms always have less efficient production and management technologies, and under-developed infrastructure such as transportation, storage, and information channels; thus, encouraging small-scale farms to be involved in organizations and contracts may be important from a developmental perspective, as farm households could gain more [48,52]. At the same time, it is necessary to further standardize the operation of organizations so that their service functions can be brought into full play. It is also essential to strengthen the mechanism of close benefit linkage between leading enterprises and farm households and to improve the service capacity of leading enterprises.
Relaxing technology and information constraints by improving the ability of various technical extension institutions or systems will facilitate the joint adoption of risk management tools. The promotion of risk management tools for wider adoption could offer benefits to farm households in terms of stabilizing income, and risk management tools in this study are generally more effective when adopted in combination. However, one thing to keep in mind when choosing risk management tools is that adopting risk management tools in combination is always more complex than adopting them individually [31], especially when there are many different types of risk management tools.
5. Conclusions
The adoption of insurance purchase and organization participation by farm households, as well as their impacts on the mean, variance, and skewness of crop revenue, were examined in this study using the MESR model. Three main conclusions can be drawn from the results of this study. First, the relative probabilities significantly differ across risk management tools. Older and better-educated household heads were more likely to purchase agricultural insurance, while male, older, and off-farm-worker-headed households were likely to jointly adopt insurance and organization. Household size decreased the probability of jointly adopting insurance and organization, while planting technical services increased the probability of participating in organization and jointly adopting insurance and organization. Cropland size increased the probability of participating in organizations, while cropland plots decreased the probability of jointly adopting insurance and organization. Second, the increase in crop revenue and decrease in crop revenue variance were influenced by insurance purchase, organization participation, and their joint adoption. Participating in organizations was more effective in enhancing crop revenue and reducing revenue fluctuations than insurance purchase. The benefits, however, were significantly greater when agricultural insurance and participation in organizations were jointly adopted. Third, taking skewness into account in risk management analysis is important, as an increase in skewness indicates a reduction in downside risk exposure. Insurance purchase, organization participation, and their joint adoption could decrease the probability of crop failure, and organization participation was more effective in reducing the probability of crop failure than insurance purchase and their joint adoption.
In light of the aforementioned findings, actors aimed at raising crop revenue, reducing revenue fluctuations, and lowering downside risk exposure should focus on promoting the adoption of risk management tools by relaxing technology and information constraints, and by improving the function and operation of agricultural insurance and organizations. Specifically, institutions or systems that provide technical extension should be guided on how to enhance their ability to offer technology and information services. The level of insurance protection provided by traditional agriculture insurance should be strengthened, and the pilot programs for income insurance and full-cost insurance should be expanded. The operations of organizations should be standardized to perform their service responsibilities, and small-scale farms should be encouraged to participate in organizations and contracts.
Author Contributions
Y.Z. designed the paper. Y.Z. and X.W. wrote and revised the paper. All authors have read and agreed to the published version of the manuscript.
Funding
This research was funded by the National Natural Science Foundation of China (NSFC) (Grant No. 72003090).
Institutional Review Board Statement
Not applicable.
Data Availability Statement
Data come from the China Land Economic Survey (CLES), Nanjing Agricultural University, and are available on request from Nanjing Agricultural University.
Conflicts of Interest
The authors declare no conflict of interest.
Appendix A
Table A1.
Estimation of the main equation for revenue (second stage of MESR).
Table A1.
Estimation of the main equation for revenue (second stage of MESR).
| Variable | None | Insurance | Organization | Joint | ||||
|---|---|---|---|---|---|---|---|---|
| Coef. | SE | Coef. | SE | Coef. | SE | Coef. | SE | |
| Gender | 0.116 | 0.073 | 0.055 | 0.078 | 2.751 *** | 0.455 | -- | -- |
| Age | −0.003 | 0.007 | 0.004 | 0.006 | 0.085 | 0.087 | 0.068 | 0.126 |
| Education | 0.004 | 0.005 | 0.005 | 0.005 | −0.207 ** | 0.077 | 0.027 | 0.105 |
| Off-farm | 0.076 | 0.088 | −0.038 | 0.077 | 4.693 *** | 0.466 | −0.289 | 1.296 |
| Risk neutral | −0.129 | 0.147 | 0.006 | 0.204 | 2.340 *** | 0.362 | 0.394 | 1.491 |
| Risk aversion | −0.074 | 0.140 | 0.061 | 0.198 | −0.940 * | 0.535 | 0.325 | 1.468 |
| Party | −0.046 | 0.058 | 0.100 ** | 0.047 | 1.894 *** | 0.415 | −0.056 | 0.960 |
| Hsize | −0.051 * | 0.028 | 0.002 | 0.020 | 0.098 | 0.226 | −0.258 | 0.549 |
| Techonolgy1 | 0.126 | 0.136 | −0.026 | 0.088 | 5.194 *** | 0.356 | −0.364 | 1.437 |
| Techonolgy2 | −0.189 | 0.123 | 0.028 | 0.087 | −1.071 * | 0.552 | 0.089 | 1.483 |
| Size (log) | −0.102 | 0.136 | −0.020 | 0.093 | 3.979 *** | 0.195 | −0.504 | 1.478 |
| Plot (log) | 0.190 | 0.124 | 0.129 | 0.121 | −1.225 *** | 0.324 | −0.513 | 1.430 |
| irrigation | 0.149 * | 0.099 | 0.211 ** | 0.101 | 3.411 *** | 0.399 | 0.597 | 1.365 |
| Fertility: medium | 0.001 | 0.126 | 0.133 | 0.180 | −2.400 *** | 0.361 | 0.457 | 2.047 |
| Fertility: good | −0.058 | 0.135 | 0.192 | 0.147 | 1.045 *** | 0.362 | 0.044 | 1.856 |
| Disaster | −0.001 | 0.029 | 0.000 | 0.047 | 1.413 *** | 0.410 | 0.561 | 0.930 |
| Seed (log) | 0.088 *** | 0.033 | 0.109 *** | 0.036 | −1.998 *** | 0.416 | 0.234 | 0.368 |
| Fertilizer (log) | 0.148 *** | 0.053 | 0.173 ** | 0.074 | −1.193 *** | 0.323 | 0.395 | 0.804 |
| Machinery (log) | 0.014 | 0.013 | 0.020 | 0.013 | −1.114 *** | 0.199 | 0.093 | 0.381 |
| Labor—self (log) | 0.031 | 0.031 | 0.065 * | 0.037 | 0.079 | 0.332 | 0.431 | 0.473 |
| Labor—hire (log) | −0.014 | 0.018 | −0.012 | 0.021 | 0.195 | 0.246 | −0.375 | 0.315 |
| Constant | 5.634 *** | 0.293 | 5.035 *** | 0.371 | −19.484 *** | 2.717 | 4.420 | 4.222 |
| Time-varying covariates | Yes | Yes | Yes | Yes | ||||
| Ancillary | ||||||||
| σ2 | 0.507 *** | 0.158 | 0.441 *** | 0.170 | 29.702 *** | 0.479 | 3.104 | 5.754 |
| λ1 | 0.402 | 0.353 | 0.048 | 0.694 | −1.546 | 0.000 | −0.370 | 0.492 |
| λ2 | −0.085 | 0.591 | −0.060 | 0.280 | −0.817 *** | 0.301 | −0.892 | 0.904 |
| λ3 | −0.928 | 1.157 | 2.104 | 1.400 | 0.750 | 0.862 | −2.780 *** | 0.399 |
| λ4 | 1.764 | 1.242 | −0.276 | 0.859 | 0.044 | 0.000 | −0.281 | 1.060 |
| Joint significance of instruments | F(2,1370) = 0.27 | F(2,1406) = 0.77 | F(2,18) = 0.20 | F(2,32) = 0.75 | ||||
| Number of observations | 1394 | 1430 | 42 | 55 | ||||
Notes: MESR model was estimated in Stata using the command selmlog, developed by Bourguignon et al. (2007) [34]. The option dmf (2) was used to perform the variant of the Dubin and McFadden (1984) [53] correction method suggested in Bourguignon et al. (2007) [34] , and the option bootstrap with 100 replications was used to estimate the standard errors. ***, **, and * denote significance at 1%, 5%, and 10%, respectively. The coefficient of gender was omitted because farm households who jointly purchased agricultural insurance and participated in organizations were all male-headed.
Table A2.
Estimation of the main equation for revenue variance (second stage of MESR).
Table A2.
Estimation of the main equation for revenue variance (second stage of MESR).
| Variable | None | Insurance | Organization | Joint | ||||
|---|---|---|---|---|---|---|---|---|
| Coef. | SE | Coef. | SE | Coef. | SE | Coef. | SE | |
| Gender | −0.005 | 0.148 | −0.141 | 0.283 | 7.748 *** | 0.689 | -- | -- |
| Age | 0.001 | 0.014 | −0.020 | 0.027 | 0.131 | 0.180 | −0.240 | 0.332 |
| Education | −0.033 ** | 0.016 | −0.020 | 0.019 | −0.577 *** | 0.107 | 0.182 | 0.331 |
| Off-farm | 0.089 | 0.162 | 0.149 | 0.291 | 10.764 *** | 0.731 | −2.068 | 4.191 |
| Risk neutral | 0.106 | 0.331 | −0.584 | 0.962 | 10.565 *** | 0.711 | −0.286 | 4.909 |
| Risk aversion | 0.204 | 0.243 | −0.658 | 0.959 | 1.390 * | 0.731 | −0.706 | 3.576 |
| Party | 0.183 | 0.206 | −0.097 | 0.166 | 5.933 *** | 0.780 | −1.475 | 3.581 |
| Hsize | 0.104 * | 0.058 | 0.001 | 0.052 | 0.069 | 0.396 | 1.383 | 1.298 |
| Techonolgy1 | 0.016 | 0.296 | 0.333 | 0.292 | 17.491 *** | 0.819 | −0.426 | 4.344 |
| Techonolgy2 | 0.375 | 0.276 | −0.393 | 0.255 | −3.667 *** | 0.845 | −0.746 | 4.269 |
| Size (log) | 0.465 | 0.396 | 0.484 | 0.563 | 16.524 *** | 0.430 | −0.997 | 3.683 |
| Plot (log) | −0.754 | 0.477 | −0.822 | 0.702 | −4.032 *** | 0.739 | 2.951 | 3.656 |
| irrigation | −0.303 | 0.235 | −0.769 | 0.484 | 10.068 *** | 0.472 | 1.390 | 3.846 |
| Fertility: medium | 0.534 * | 0.293 | −1.230 | 0.851 | −7.495 *** | 0.581 | −9.157 | 5.775 |
| Fertility: good | 0.820 ** | 0.367 | −1.126 | 0.699 | 4.440 *** | 0.692 | −9.529 | 6.364 |
| Disaster | −0.005 | 0.064 | −0.019 | 0.179 | 5.155 *** | 0.509 | −2.591 | 2.607 |
| Seed (log) | −0.119 * | 0.062 | −0.177 | 0.135 | −5.928 *** | 0.783 | −0.690 | 1.338 |
| Fertilizer (log) | −0.154 * | 0.088 | −0.135 | 0.184 | −4.018 *** | 0.648 | −1.097 | 2.275 |
| Machinery (log) | 0.007 | 0.026 | 0.006 | 0.034 | −3.733 *** | 0.452 | −0.658 | 1.256 |
| Labor–self (log) | −0.034 | 0.064 | −0.123 | 0.160 | −0.433 | 0.475 | −0.535 | 1.363 |
| Labor–hire (log) | 0.086 ** | 0.042 | 0.116 | 0.096 | 0.387 | 0.464 | 1.094 | 1.067 |
| Constant | 0.196 | 1.216 | 1.738 | 1.211 | −82.735 *** | 5.216 | 5.110 | 11.087 |
| Time-varying covariates | Yes | Yes | Yes | Yes | ||||
| Ancillary | ||||||||
| σ2 | 6.026 | 3.787 | 5.901 | 3.995 | 426.264 *** | 1.089 | 14.361 | 61.140 |
| λ1 | 0.194 | 0.436 | 0.567 | 0.663 | −1.801 *** | 0.239 | 1.111 * | 0.584 |
| λ2 | 0.244 | 0.663 | 0.341 | 0.280 | −1.044 *** | 0.253 | 1.172 | 0.719 |
| λ3 | 2.101 ** | 1.029 | −0.937 | 1.719 | 0.492 | 1.080 | 2.149 *** | 0.445 |
| λ4 | −0.137 | 1.153 | 1.278 | 0.836 | −0.114 | 0.000 | −0.104 | 1.137 |
| Joint significance of instruments | F(2,1370) = 1.72 | F(2,1406) = 1.15 | F(2,18) = 0.76 | F(2,32) = 0.62 | ||||
| Number of observations | 1394 | 1430 | 42 | 55 | ||||
Notes: ***, **, and * denote significance at 1%, 5%, and 10%, respectively.
Table A3.
Estimation of the main equation for revenue skewness (second stage of MESR).
Table A3.
Estimation of the main equation for revenue skewness (second stage of MESR).
| Variable | None | Insurance | Organization | Joint | ||||
|---|---|---|---|---|---|---|---|---|
| Coef. | SE | Coef. | SE | Coef. | SE | Coef. | SE | |
| Gender | −0.541 | 0.803 | 0.489 | 1.110 | 95.429 *** | 2.453 | -- | -- |
| Age | −0.002 | 0.059 | 0.106 | 0.121 | −1.022 ** | 0.493 | 0.869 | 1.258 |
| Education | 0.155 * | 0.081 | 0.099 | 0.106 | −8.459 *** | 0.261 | −0.476 | 1.065 |
| Off-farm | −0.550 | 0.584 | −0.121 | 1.664 | 132.097 *** | 2.518 | 5.899 | 11.561 |
| Risk neutral | 0.032 | 1.229 | 5.179 | 5.888 | 180.774 *** | 2.297 | 3.528 | 11.660 |
| Risk aversion | −0.468 | 0.960 | 5.408 | 6.091 | 53.913 *** | 1.855 | 3.754 | 10.303 |
| Party | −0.724 | 0.916 | 0.376 | 0.623 | 100.566 *** | 1.610 | 4.259 | 7.654 |
| Hsize | −0.374 | 0.250 | 0.170 | 0.282 | 7.474 *** | 0.854 | −4.173 | 4.805 |
| Techonolgy1 | −0.241 | 1.205 | −1.746 | 1.548 | 265.930 *** | 3.292 | 0.536 | 10.241 |
| Techonolgy2 | −1.491 | 1.197 | 1.503 | 1.282 | −73.191 *** | 2.701 | 2.480 | 14.244 |
| Size (log) | −2.430 * | 1.446 | −2.919 | 3.218 | 250.011 *** | 0.842 | 2.326 | 14.850 |
| Plot (log) | 2.959 | 2.062 | 4.586 | 3.554 | −70.046 *** | 1.633 | −10.847 | 10.829 |
| irrigation | 1.382 | 1.109 | 3.354 | 2.583 | 120.945 *** | 1.422 | −3.249 | 8.195 |
| Fertility: medium | −1.535 | 1.862 | 5.996 | 4.240 | −153.023 *** | 3.613 | 29.684 ** | 13.886 |
| Fertility: good | −3.123 | 2.226 | 4.656 | 3.267 | 47.315 *** | 1.605 | 30.565 ** | 13.602 |
| Disaster | 0.079 | 0.240 | 0.486 | 1.339 | 58.992 *** | 2.652 | 8.597 | 8.279 |
| Seed (log) | 0.192 | 0.230 | 0.665 | 0.634 | −91.153 *** | 2.294 | 2.595 | 4.148 |
| Fertilizer (log) | 0.035 | 0.423 | 0.112 | 1.050 | −58.905 *** | 2.613 | 3.605 | 9.743 |
| Machinery (log) | −0.090 | 0.108 | −0.135 | 0.158 | −54.593 *** | 1.130 | 2.058 | 3.973 |
| Labor–self (log) | 0.318 | 0.318 | 0.590 | 0.912 | −9.580 *** | 1.526 | 1.857 | 5.089 |
| Labor–hire (log) | −0.213 | 0.166 | −0.668 | 0.677 | −4.927 *** | 1.200 | −3.920 | 3.074 |
| Constant | 7.022 | 7.293 | −5.125 | 6.160 | −1356.169 *** | 11.368 | −18.413 | 45.152 |
| Time-varying covariates | Yes | Yes | Yes | Yes | ||||
| Ancillary | ||||||||
| σ2 | 164.436 | 109.878 | 192.426 * | 116.852 | 97,647.734 *** | 13.847 | 165.272 | 401.782 |
| λ1 | 0.039 | 0.447 | −0.637 | 0.611 | −1.665 | 0.000 | −0.968 ** | 0.413 |
| λ2 | 0.156 | 0.736 | −0.359 | 0.258 | −1.015 *** | 0.215 | −1.025 | 0.818 |
| λ3 | −1.525 * | 0.895 | 0.332 | 1.392 | 0.609 | 0.939 | −2.409 *** | 0.283 |
| λ4 | 0.164 | 1.116 | −1.274 * | 0.827 | −0.090 | 0.000 | 0.017 | 1.137 |
| Joint significance of instruments | F(2,1370) = 1.99 | F(2,1406) = 0.83 | F(2,18) = 0.09 | F(2,32) = 0.66 | ||||
| Number of observations | 1394 | 1430 | 42 | 55 | ||||
Notes: ***, **, and * denote significance at 1%, 5%, and 10%, respectively.
Table A4.
Results of the endogeneity test.
Table A4.
Results of the endogeneity test.
| Dependent Variables: Revenue | 2SLS | GMM |
|---|---|---|
| Durbin χ2 | 0.362 (p-value = 0.547) | -- |
| Wu-Hausman F | 0.360 (p-value = 0.549) | -- |
| C Sargan χ2 | -- | 0.096 (p-value = 0.757) |
Notes: 2SLS and GMM were estimated with the full set of control variables.
References
- Mapp, H.P.; Hardin, M.L.; Walker, O.L.; Persaud, T. Analysis of Risk Management Strategies for Agricultural Producers. Am. J. Agric. Econ. 1979, 61, 1071–1077. [Google Scholar] [CrossRef]
- Ali, W.; Abdulai, A.; Mishra, A.K. Recent Advances in the Analyses of Demand for Agricultural Insurance in Developing and Emerging Countries. Annu. Rev. Resour. Econ. 2020, 12, 411–430. [Google Scholar] [CrossRef]
- Cole, S.A.; Xiong, W. Agricultural insurance and economic development. Annu. Rev. Econ. 2017, 9, 235–262. [Google Scholar] [CrossRef]
- Bhattamishra, R.; Barrett, C.B. Community-Based Risk Management Arrangements: A Review. World Dev. 2010, 38, 923–932. [Google Scholar] [CrossRef]
- Dillon, A.; Mueller, V.; Salau, S. Migratory responses to agricultural risk in northern Nigeria. Am. J. Agric. Econ. 2011, 93, 1048–1061. [Google Scholar] [CrossRef]
- Hazell, P.; Sberro-Kessler, R.; Varangis, P. When and How Should Agricultural Insurance Be Subsidized? Issues and Good Practices; World Bank: Washington, DC, USA, 2017. [Google Scholar]
- Liao, P.; Zhou, X.; Fan, Q. Does agricultural insurance help farmers escape the poverty trap? Research based on multiple equilibrium models. Geneva Pap. Risk Insur. Issues Pract. 2020, 45, 203–223. [Google Scholar] [CrossRef]
- Hill, R.V.; Kumar, N.; Magnan, N.; Makhija, S.; de Nicola, F.; Spielman, D.J.; Ward, P.S. Ex ante and ex post effects of hybrid index insurance in Bangladesh. J. Dev. Econ. 2019, 136, 1–17. [Google Scholar] [CrossRef]
- Holloway, G.; Nicholson, C.; Delgado, C.; Staal, S.; Ehui, S. Agroindustrialization through institutional innovation Transaction costs, cooperatives and milk-market development in the east-African highlands. Agric. Econ. 2000, 23, 279–288. [Google Scholar] [CrossRef]
- Mishra, A.K.; El-Osta, H.S. Managing risk in agriculture through hedging and crop insurance: What does a national survey reveal? Agric. Financ. Rev. 2002, 62, 135–148. [Google Scholar] [CrossRef]
- Gebrekidan, T.; Guo, Y.; Bi, S.; Wang, J.; Zhang, C.; Wang, J.; Lyu, K. Effect of index-based livestock insurance on herd offtake: Evidence from the Borena zone of southern Ethiopia. Clim. Risk Manag. 2019, 23, 67–77. [Google Scholar] [CrossRef]
- Janzen, S.A.; Carter, M.R. After the drought: The impact of microinsurance on consumption smoothing and asset protection. Am. J. Agric. Econ. 2019, 101, 651–671. [Google Scholar] [CrossRef]
- Cai, H.; Chen, Y.; Fang, H.; Zhou, L.-A. The effect of microinsurance on economic activities: Evidence from a randomized field experiment. Rev. Econ. Stat. 2015, 97, 287–300. [Google Scholar] [CrossRef]
- Freudenreich, H.; Mußhoff, O. Insurance for technology adoption: An experimental evaluation of schemes and subsidies with maize farmers in Mexico. J. Agric. Econ. 2018, 69, 96–120. [Google Scholar] [CrossRef]
- Jensen, N.D.; Barrett, C.B.; Mude, A.G. Cash transfers and index insurance: A comparative impact analysis from northern Kenya. J. Dev. Econ. 2017, 129, 14–28. [Google Scholar] [CrossRef]
- Fischer, E.; Qaim, M. Linking Smallholders to Markets: Determinants and Impacts of Farmer Collective Action in Kenya. World Dev. 2012, 40, 1255–1268. [Google Scholar] [CrossRef]
- Kumar, A.; Saroj, S.; Joshi, P.; Takeshima, H. Does cooperative membership improve household welfare? Evidence from a panel data analysis of smallholder dairy farmers in Bihar, India. Food Policy 2018, 75, 24–36. [Google Scholar] [CrossRef]
- Abebaw, D.; Haile, M.G. The impact of cooperatives on agricultural technology adoption: Empirical evidence from Ethiopia. Food Policy 2013, 38, 82–91. [Google Scholar] [CrossRef]
- Ito, J.; Bao, Z.; Su, Q. Distributional effects of agricultural cooperatives in China: Exclusion of smallholders and potential gains on participation. Food Policy 2012, 37, 700–709. [Google Scholar] [CrossRef]
- Roy, D.; Thorat, A. Success in High Value Horticultural Export Markets for the Small Farmers: The Case of Mahagrapes in India. World Dev. 2008, 36, 1874–1890. [Google Scholar] [CrossRef]
- Hellin, J.; Lundy, M.; Meijer, M. Farmer organization, collective action and market access in Meso-America. Food Policy 2009, 34, 16–22. [Google Scholar] [CrossRef]
- Markelova, H.; Meinzen-Dick, R.; Hellin, J.; Dohrn, S. Collective action for smallholder market access. Food Policy 2009, 34, 1–7. [Google Scholar] [CrossRef]
- Chagwiza, C.; Muradian, R.; Ruben, R. Cooperative membership and dairy performance among smallholders in Ethiopia. Food Policy 2016, 59, 165–173. [Google Scholar] [CrossRef]
- Trebbin, A. Linking small farmers to modern retail through producer organizations—Experiences with producer companies in India. Food Policy 2014, 45, 35–44. [Google Scholar] [CrossRef]
- Birthal, P.S.; Chand, R.; Joshi, P.K.; Saxena, R.; Rajkhowa, P.; Khan, M.T.; Khan, M.A.; Chaudhary, K.R. Formal versus informal: Efficiency, inclusiveness and financing of dairy value chains in Indian Punjab. J. Rural. Stud. 2017, 54, 288–303. [Google Scholar] [CrossRef]
- Miyata, S.; Minot, N.; Hu, D. Impact of contract farming on income: Linking small farmers, packers, and supermarkets in China. World Dev. 2009, 37, 1781–1790. [Google Scholar] [CrossRef]
- Moustier, P.; Tam, P.T.G.; Anh, D.T.; Binh, V.T.; Loc, N.T.T. The role of farmer organizations in supplying supermarkets with quality food in Vietnam. Food Policy 2010, 35, 69–78. [Google Scholar] [CrossRef]
- Zhou, J.; Yang, Z.; Li, K.; Yu, X. Direct intervention or indirect support? The effects of cooperative control measures on farmers’ implementation of quality and safety standards. Food Policy 2019, 86, 101728. [Google Scholar] [CrossRef]
- Birthal, P.S.; Hazrana, J.; Negi, D.S.; Mishra, A.K. Assessing benefits of crop insurance vis-a-vis irrigation in Indian agriculture. Food Policy 2022, 112, 102348. [Google Scholar] [CrossRef]
- Khonje, M.G.; Manda, J.; Mkandawire, P.; Tufa, A.H.; Alene, A.D. Adoption and welfare impacts of multiple agricultural technologies: Evidence from eastern Zambia. Agric. Econ. 2018, 49, 599–609. [Google Scholar] [CrossRef]
- Vigani, M.; Kathage, J. To risk or not to risk? Risk management and farm productivity. Am. J. Agric. Econ. 2019, 101, 1432–1454. [Google Scholar] [CrossRef]
- Di Falco, S.; Veronesi, M. How can African agriculture adapt to climate change? A counterfactual analysis from Ethiopia. Land Econ. 2013, 89, 743–766. [Google Scholar] [CrossRef]
- Wu, J.; Babcock, B.A. The choice of tillage, rotation, and soil testing practices: Economic and environmental implications. Am. J. Agric. Econ. 1998, 80, 494–511. [Google Scholar] [CrossRef]
- Bourguignon, F.; Fournier, M.; Gurgand, M. Selection bias corrections based on the multinomial logit model: Monte Carlo comparisons. J. Econ. Surv. 2007, 21, 174–205. [Google Scholar] [CrossRef]
- Mundlak, Y. On the pooling of time series and cross section data. Econom. J. Econom. Soc. 1978, 46, 69–85. [Google Scholar] [CrossRef]
- Wooldridge, J.M. Econometric analysis of cross section and panel data. MIT Press Books 2010, 1, 206–209. [Google Scholar]
- McFadden, D. Conditional Logit Analysis of Qualitative Choice Behavior; Academic Press: Cambridge, MA, USA, 1973. [Google Scholar]
- Teklewold, H.; Kassie, M.; Shiferaw, B.; Köhlin, G. Cropping system diversification, conservation tillage and modern seed adoption in Ethiopia: Impacts on household income, agrochemical use and demand for labor. Ecol. Econ. 2013, 93, 85–93. [Google Scholar] [CrossRef]
- Di Falco, S.; Veronesi, M. Managing environmental risk in presence of climate change: The role of adaptation in the Nile Basin of Ethiopia. Environ. Resour. Econ. 2014, 57, 553–577. [Google Scholar] [CrossRef]
- Kassie, M.; Teklewold, H.; Marenya, P.; Jaleta, M.; Erenstein, O. Production risks and food security under alternative technology choices in Malawi: Application of a multinomial endogenous switching regression. J. Agric. Econ. 2015, 66, 640–659. [Google Scholar] [CrossRef]
- Di Falco, S.; Veronesi, M.; Yesuf, M. Does adaptation to climate change provide food security? A micro-perspective from Ethiopia. Am. J. Agric. Econ. 2011, 93, 829–846. [Google Scholar] [CrossRef]
- Hausman, J.A. Specification tests in econometrics. Econom. J. Econom. Soc. 1978, 46, 1251–1271. [Google Scholar] [CrossRef]
- Sargan, J.D. The estimation of economic relationships using instrumental variables. Econom. J. Econom. Soc. 1958, 26, 393–415. [Google Scholar] [CrossRef]
- Antle, J.M. Testing the stochastic structure of production: A flexible moment-based approach. J. Bus. Econ. Stat. 1983, 1, 192–201. [Google Scholar]
- Di Falco, S.; Chavas, J.P. On crop biodiversity, risk exposure, and food security in the highlands of Ethiopia. Am. J. Agric. Econ. 2009, 91, 599–611. [Google Scholar] [CrossRef]
- Koundouri, P.; Nauges, C.; Tzouvelekas, V. Technology adoption under production uncertainty: Theory and application to irrigation technology. Am. J. Agric. Econ. 2006, 88, 657–670. [Google Scholar] [CrossRef]
- Salazar, C.; Rand, J. Pesticide use, production risk and shocks. The case of rice producers in Vietnam. J. Environ. Manag. 2020, 253, 109705. [Google Scholar] [CrossRef]
- Wang, H.H.; Wang, Y.; Delgado, M.S. The transition to modern agriculture: Contract farming in developing economies. Am. J. Agric. Econ. 2014, 96, 1257–1271. [Google Scholar] [CrossRef]
- Bentley, J. Economic and Ecological Approaches to Land Fragmentation: In Defense of a Much Maligned Phenomenon. Annu. Rev. Anthropol. 1987, 16, 31–67. [Google Scholar] [CrossRef]
- Ntihinyurwa, P.D.; de Vries, W.T.; Chigbu, U.E.; Dukwiyimpuhwe, P.A. The positive impacts of farm land fragmentation in Rwanda. Land Use Policy 2019, 81, 565–581. [Google Scholar] [CrossRef]
- Veljanoska, S. Can Land Fragmentation Reduce the Exposure of Rural Households to Weather Variability? Ecol. Econ. 2018, 154, 42–51. [Google Scholar] [CrossRef]
- Barrett, C.B.; Bachke, M.E.; Bellemare, M.F.; Michelson, H.C.; Narayanan, S.; Walker, T.F. Smallholder Participation in Contract Farming: Comparative Evidence from Five Countries. World Dev. 2012, 40, 715–730. [Google Scholar] [CrossRef]
- Dubin, J.A.; McFadden, D.L. An econometric analysis of residential electric appliance holdings and consumption. Econom. J. Econom. Soc. 1984, 345–362. [Google Scholar] [CrossRef]
Disclaimer/Publisher’s Note: The statements, opinions and data contained in all publications are solely those of the individual author(s) and contributor(s) and not of MDPI and/or the editor(s). MDPI and/or the editor(s) disclaim responsibility for any injury to people or property resulting from any ideas, methods, instructions or products referred to in the content. |
© 2023 by the authors. Licensee MDPI, Basel, Switzerland. This article is an open access article distributed under the terms and conditions of the Creative Commons Attribution (CC BY) license (https://creativecommons.org/licenses/by/4.0/).