Abstract
The use of unmanned aerial spray systems (UASS) has increased owing to their many advantages. However, studies related to a standardized method to evaluate the spray performance of UASS are lacking. Therefore, in the present study, a quantitative analytical method using a food dye tracer was compared with the image analysis method, and the effects of experimental conditions on spray deposition were assessed. Concordance between the results of quantitative and image analyses was examined. The coverage of water-sensitive paper (WSP) and Medley Velvet (MV) was compared using image analysis. Moreover, the effects of flight altitude and collector height on spray deposition amount and effective spray width were evaluated. The results showed a significant correlation between the deposition and the coverage of MV (R2 = 0.6782, p-level < 0.001). The coverage of MV is different from that of WSP. In addition, the correlation coefficient between the coverage of WSP and that of MV was smaller than the correlation coefficient between depositions and the coverage of MV. Therefore, MV should be used instead of WSP for more accurate analysis. The lower the collector height, the smaller the deposition amount. The effective spray width increased as the distance between the collector and UASS increased, whereas the total deposition amount decreased when the collector was close to the ground. Overall, using a food dye tracer, both quantitative and qualitative analyses can be applied simultaneously, and this method may replace analysis using WSP.
1. Introduction
Pest and disease control using plant protection products (PPPs) is crucial in crop production. Depending on the crop, potential losses due to pests in global crop production can reach up to 80% [1]. To control pests and diseases, an appropriate amount of PPPs should be uniformly distributed across the cultivated land using a sprayer. This is because excessive use of PPPs may cause damage, whereas insufficient use may not produce the expected control effect. In addition, considering the health of workers and the surrounding environment, drift must be reduced [2].
Over the past several decades, various sprayers have been developed to improve the effectiveness and efficiency of pest control operations as well as to ensure the safety of workers and the environment [3]. Among various pest control devices, the recently developed unmanned aerial spraying systems (UASS) show high working efficiency and are convenient to use; therefore, the use of UASS in agriculture is gradually increasing. UASS is a machine that atomizes the spraying of PPP mixed with water in the air using an unmanned agricultural aircraft system (UAAS), such as a multicopter with pumps, tanks and nozzles [4]. Using GPS and sensors installed in UASS, operators can remotely or automatically perform control operations. Accordingly, control is possible irrespective of the size of crops, and it can be used in places that are difficult to access with sprayers, such as slopes. Furthermore, this can prevent the workers’ exposure to PPPs [5,6]. In addition, PPPs sprayed from UASS have the advantage of being delivered to the underside of leaves or roots of crops due to the downwind generated from the rotor, thereby achieving a strong control effect [7].
Owing to these advantages, control operations using UASS have been extensively studied worldwide [8,9,10,11]. In particular, various studies using UASS for practical control work have been conducted in Korea, Japan, and China [12,13]. For instance, the effects of nozzle type and droplet size on spray and drift amount have been studied [14,15]. Dafsari et al. [16] developed an air induction nozzle to reduce drift during air spraying and assessed its performance. The relationship between spraying parameter and performance also have been studied recently [17,18,19]. Wang et al. [20] measured the amount of drift and deposition according to flight altitude and wind speed under various weather conditions using a single-rotor UASS and demonstrated that deposition decreased as flight altitude increased. Ling et al. [21] analyzed the behavior of sprayed droplets from the nozzle according to change in wind speed or nozzle height using computational fluid dynamics, and confirmed that as the nozzle height increased, the spray pattern moved in the downwind direction. Furthermore, Faiçal et al. [22] studied a system to improve the effectiveness of control by collecting weather data from the field using a wireless sensor network and automatically correcting the flight path using it. Wang et al. [23] measured the droplet diameter during air spraying PPPs with additives and analyzed its correlation with drift. In addition, through field experiments, the authors confirmed that the control effect increased when an additive was used. Many researchers studied the performance measurement of aerial spraying. However, the methodologies of each paper are different. To compare research results, standardized methodologies, including the height of collector and the altitude of UAV, are required.
In most studies, water-sensitive paper (WSP) is used to analyze the motion of atomized droplets in UASS. WSP was developed in the 1970s as a coated paper whose surface turns blue when in contact with moisture. Subsequently, the behavior of the atomized droplets can be analyzed; therefore, WSP is commonly used [24,25]. Through image analysis, the area ratio of the changed color is calculated to determine the relative degree of deposition. Tang et al. [26] analyzed the spray droplet deposition properties according to flight altitude and tree shape using WSP. Similarly, Wang et al. [27] used image analysis of WSP for on-site evaluation of UASS, extracted tracers deposited to Mylar plates and wheat heads, and compared and evaluated the amount of deposition. However, as WSP is sensitive to moisture, it is difficult to handle, use in a highly humid environment, and quantitatively measure the amount of deposition [28,29]. Therefore, owing to drift, a method for quantitatively evaluating the amount of deposition is required, because the whole droplets sprayed by the UASS are not deposited at the target point.
To overcome the shortcomings of WSP, a method for quantitatively evaluating the amount of spray droplet deposition using a tracer has been explored [30]. Fluorescent and food dyes are used as tracers, and the amount of tracer in the sample is measured using analytical equipment [31]. Food dyes are more suitable for measuring the amount of deposition in the field because of their low price, low photodegradation rate, and high extraction rate [32,33]. Gao et al. [34] sprayed a red food dye (Allura Red) on crops and analyzed it using ultra-performance liquid chromatography to examine its potential as a tracer. Cerqueira et al. [35] quantitatively evaluated the amount of deposition using five materials and four types of collectors in the laboratory and noted that the extraction rate of brilliant blue FCF was higher on average, rendering it a suitable tracer.
In the present study, to quantitatively evaluate the amount of deposition using UASS, an analytical method using brilliant blue FCF as a tracer was compared with the existing analytical method using WSP, and the effects of experimental conditions on the quantitative analysis were analyzed. Concordance between the results of quantitative analysis of the tracer through extraction and qualitative analysis through image analysis was examined. Furthermore, by comparing the image analysis results for the tracer and WSP, the potential of the novel method to replace the existing one was explored. In addition, to establish standardized methodology, the amount of spray depositions according to the height of the collector and flight altitude of the UASS were analyzed using a tracer.
2. Materials and Methods
2.1. UASS
To compare the spray performance evaluation methods, a battery-powered multicopter (SG-10P, Hankook Samgong, Seoul, Republic of Korea) with eight rotors was used (Figure 1). SG-10P is 2075, 2075, 700 mm in width, length, and height, respectively, and the total weight is 14.5 kg. The maximum thrust is 5.1 kg per rotor, and the maximum takeoff weight is 24.9 kg. The rated pressure of the pump is 0.8 MPa, and the rated flow is 5.5 L/min. The capacity of the nutrient solution tank is 10 L, and four nozzles are installed; however, the standard spray rate of UAV in Korea is 8 L/ha. If four nozzles are used, the flying speed of UAV need to be set too high to follow the standard [36]. Then, only the front two nozzles were used in the experiment. A spray nozzle (XR110015VS, Teejet technologies, Glendale Heights, IL, USA) was used, and the horizontal distance between the nozzles was 158 cm. Volumetric diameters Dv0.1, Dv0.5, Dv0.9 were, respectively, 70.12 μm, 136.1 μm, and 246.6 μm. The unmanned aerial vehicle flight was operated by an experienced pilot using a remote controller.
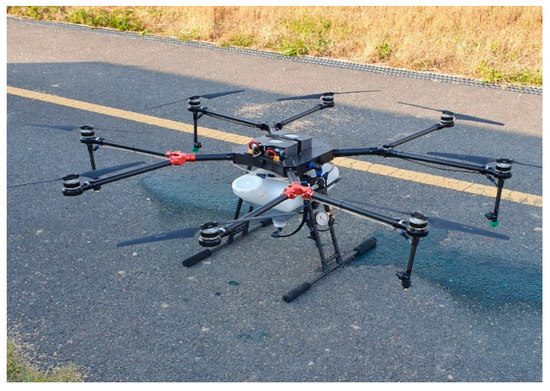
Figure 1.
UASS (SG-10P).
2.2. Tracer and Collector
Brilliant blue FCF was selected as the tracer for quantitative analysis based on Japanese measurement methods and literature [35]. The spray solution was prepared by adding 10 g of brilliant blue FCF (85% w/w) powder to 10 L of tap water to obtain a solution of 1 g/L concentration.
Medley Velvet (MV) and WSP, which can absorb and extract excellent brilliant blue FCF, were used as collectors on which the spray droplets are deposited [37]. MV was cut in the shape of a cross with a side length of 50 mm and folded to produce a hexahedron. A commercial WSP (76 mm × 52 mm, Teejet) was used (Figure 2). The collectors were attached to a plate prepared using a 3D printer (3D Wox, Sindoh, Seoul, Republic of Korea) and installed on the profile support. The plate height was 5 cm, and in the case of the support, the installation height could be adjusted to 50 and 80 cm.
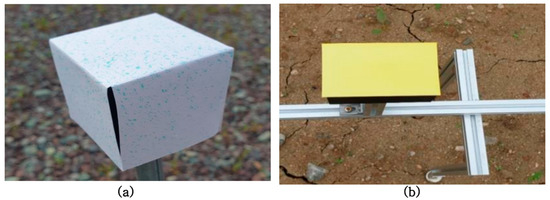
Figure 2.
Spray deposition collector (a) Medley velvet; (b) WSP.
After the experiment, the collectors were transferred to the laboratory to measure the amount of tracer deposited. The collectors were placed in a zipper bag to avoid contact with moisture and stored in a box wrapped in aluminum foil to block sunlight.
Both quantitative evaluation through extraction and qualitative evaluation through image analysis were performed. To quantitatively measure the amount of tracer, the collector was inserted into a 50 mL conical tube, and then 45 mL of distilled water was added. Subsequently, the sample was allowed to stand for 12 h for extracting the dye in distilled water. Thereafter, the conical tube was vortexed for 30 s (Vortex Genie 2, Scientific Industries, Inc., Bohemia, NY, USA). Then, 1 mL of the solution was collected using a micropipette, and optical density (OD) was measured at 630 nm with a spectrophotometer (UV-1800, Shimadzu Corporation, Kyoto, Japan) [33,38]. OD represents the amount of change in the intensity of light due to absorbance as it passes through the solution and is obtained by the following formula (Equation (1)).
where,
I0 = the intensity of the incident light
I = the intensity of the transmitted light
The amount of tracer deposited to the collector was calculated from the measured OD values. For conversion, a previously reported regression equation was used (Equation (2)) [37]. Deposition (ng/cm2) is calculated from multiplying Brilliant blue FCF concentration with volume of solution and forty.
For qualitative analysis, images of each collector were acquired using a camera (A6000, Sony Corporation, Tokyo, Japan) mounted on an image acquisition system (Figure 3). The distance between the camera lens and collector was 20 cm; the shutter speed was set to 1/100 s; and the ISO was set to 200. The illuminance was set to 950 lx during image acquisition. The resolution of the images is 6000 × 4000, and the size of the images is about 6 Mb. Images were saved in JPG format. MV was divided into five faces and analyzed using only the upper face. The acquired images were transferred to a computer and the droplet deposition area ratio (coverage) was calculated using an image analysis program. To overcome the shortcomings of commercial image analysis programs and increase their economic feasibility, an image analysis program was created using Python [39]. In this program, each image is loaded, and the outline of the collector is automatically recognized through the contour function. Five pixel layers from the boundaries of the collectors were removed to reduce the noise generated between the boundaries and background of images and the region of interest (ROI) is formed. In the case of spray deposition area recognition, the HSV color system was used to overcome the limitations of the binarization and RGB methods. The number of pixels with spray deposition inside the ROI was calculated, and coverage was estimated by dividing it by the number of pixels in the entire ROI (Equation (3)).
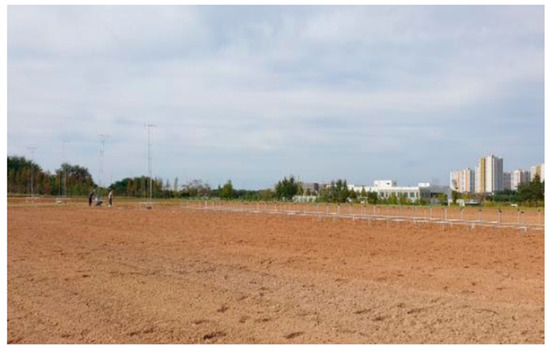
Figure 3.
View of test site.
2.3. Experiment Design
All experiments were conducted in Jeonju, Jeollabuk-do, the Republic of Korea, on 21 and 22 October 2021 (Figure 4). The experimental site had an area of 90 m × 200 m, and tillage was performed using a rotavator a month before the experiment to eliminate vegetation. In addition, no elements obstructed the flow of air within 10 m around the test site. The UASS flight direction was set perpendicular to the wind direction at the test site. The collectors were installed in two rows at intervals of 2 m, perpendicular to the flight direction. WSPs were installed in the front row and MVs in the back row. The installation length of the collector was set to 12 m in each upwind and downwind direction based on the centerline, and the total length was 24 m. The distance between the collectors was set to 0.75 m, and 33 collectors were installed in a row. To stabilize the spray system, spraying was initiated from 20 m in front of the collector and terminated 20 m behind the collector. The overall configuration of the test site is shown in Figure 5. The flight speed of the UASS at the time of the experiment was 2.5 m/s, the injection pressure was 280 kPa, and the spray flow rate was set to 0.6 LPM (liters per minute) per nozzle with reference to the KS standard [36].
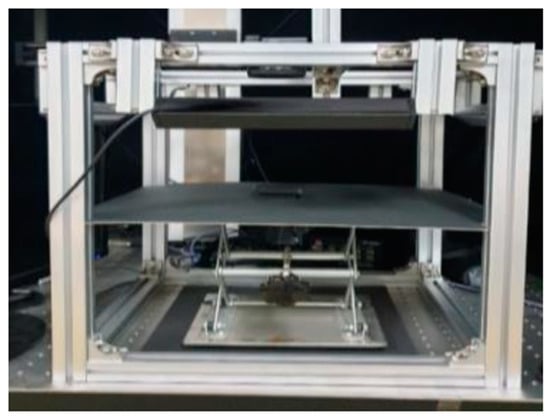
Figure 4.
Image capture system.
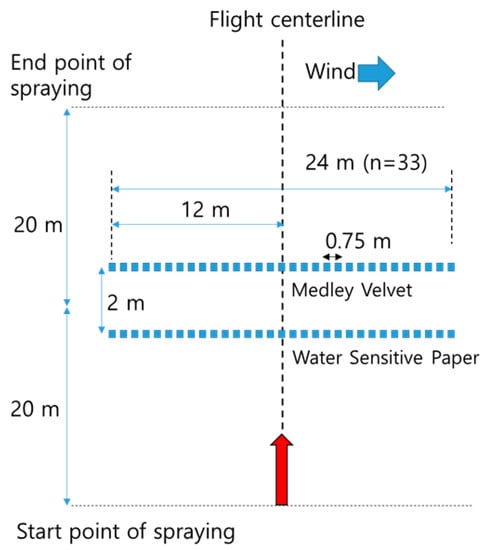
Figure 5.
Layout of spray deposition test.
The flight of UASS was evaluated at three altitudes (2, 2.5, and 3 m), and the height of the collector was adjusted in three steps (5, 50, and 80 cm). The experiment was repeated two times for each condition, and the average value was considered for analyses.
To analyze the difference between quantitative evaluation using tracers and conventional evaluation, image and spectroscopic analyses were performed simultaneously on MV collectors, and the results were compared. The correlation between the coverage value obtained through image analysis and the amount of tracer obtained through spectroscopic analysis was explored. To analyze the differences according to the type of collector, a correlation between coverage values was analyzed through image analysis of the two types of collectors in the same position.
In addition, the effects of the height of the collector and the spray altitude of the UASS on the movement of spray droplets were quantitatively analyzed using a tracer. When the flight altitude was 2.5 m, the height of the collector was divided into three stages of 5, 50, and 80 cm. When the height of the collector was 80 cm, the flight height was divided into three stages of 2, 2.5, and 3 m. The total amount of tracer deposited on each collector and the spray width were analyzed.
In the case of spray width, to supplement the current method of calculating the effective spray width using the coefficient of variation (CV), the number of droplets per unit area of the tracer deposited on the collectors was measured, the collectors satisfying the standard value were identified, and the swath was measured. The standard value of 0.7 mg/m2 or higher was selected, which is 12.5% smaller than the Korean spraying standard of 0.8 mg/m2, considering the effect of overlap with neighboring spray.
To measure weather conditions (temperature, humidity, wind direction, and wind speed) during the experiment, an automatic weather station (AWS) (Campbell Scientific, Inc., Logan, UT, USA) was installed at 5 m upwind. The AWS was equipped with a temperature and humidity sensor (EE181-L, Campbell Scientific, Inc., Logan, UT, USA) as well as a wind direction and speed sensor (03002, Campbell Scientific, Inc., Logan, UT, USA).
The temperature and humidity sensor was installed at 1.2 m from the ground, and the wind direction and speed sensor was installed at approximately 2.2 m from the ground. Environmental data were stored in a data logger (CR1000X; Campbell Scientific, Inc., Logan, UT, USA) at the frequency of 0.2 Hz. The stored data were transmitted to a notebook computer via Bluetooth communication. Table 1 lists the flight and environmental conditions during the experiment.

Table 1.
Spray application and meteorological parameters.
3. Results and Discussion
3.1. Comparison of Measurement Results Using Spectroscopic and Image Analyses
To analyze the differences between evaluation methods, image and spectroscopic analyses were performed based on deposition on 330 sheets of MV. The mean of the coverage values was 1.2%, standard deviation was 2.32%, and CV was 193%. The mean of deposition amount was 39.63 ng/cm2, standard deviation was 41.59 ng/cm2, and CV was 105%.
The correlation coefficient between results using the two methods was 0.824 and highly significant (p-level < 0.001) (Figure 6). In other words, when using the tracer, consistent results can be obtained with either of the two methods. However, in the case of image analysis, determining the exact amount of deposition is difficult; therefore, additional studies are warranted to support these findings [40].
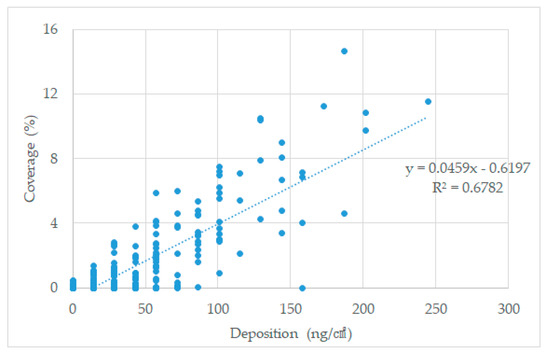
Figure 6.
Correlation analysis between amounts of tracer from extration and coverage from image analysis.
In addition, more accurate results may be obtained by improving the precision of measurement and solving the problems related to the detection of brilliant blue FCF when there is no coverage.
3.2. Differences in Coverage According to the Collector Type
Since the spectroscopic analysis of WSP is challenging, the coverage values of spray droplets deposited on the MV and WSP were calculated using image analysis and the concordance between the two values was examined. The average coverage value for 330 WSP sheets was 0.54%, the standard deviation was 1.1%, and the CV was 205%. The average coverage value of MV was 1.2% and approximately 2.2 times greater than that of WSP because of material characteristics. Nonetheless, the coefficient of variation (1.93%) was similar; therefore, the degree of variance between the two results was low. The correlation coefficient between coverage values for MV and WSP was 0.775 and highly significant (p-level < 0.001) (Figure 7).
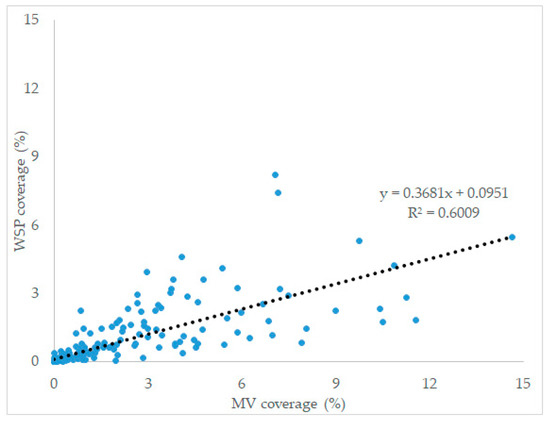
Figure 7.
Correlation analysis between MV and WSP coverage.
When comparing the images with actual spray deposition, more spray droplets were deposited on MV sheets in most cases. Only 33 of the 330 WSP collectors showed higher coverage. The difference of approximately 2.2 times between results measured at the same height may be explained by the complex airflow in the experimental area and the varying degree of deposition across 2 m moving distance between the MV and WSP sheets. In the case of UASS, some shaking occurs while flying because of the influence of external air, which induces irregular downwind changes, ultimately altering the spray pattern. Another reason for the coverage difference may be attributed to the difference of the spread factor of MV and WSP. As the spread factor for MV was larger than that for WSP, the coverage value for MV is much larger, even though the same number of spray droplets are deposited. Therefore, additional analysis of the spread factor for MV is recommended.
3.3. Deposition According to Flight and Collector Height
If the total amount of deposition on all collectors should be the same regardless of the height of the collector, the height of collectors would not be significant. However, measurement results in the present study confirmed that the total amount of deposition decreased as the height of the collector decreased. When the height of the collector was 5 cm, the average deposition of all collectors was 659.9 ng/cm2, while at 50 and 80 cm height, the values were 828.3 and 1064.9 ng/cm2, respectively (Figure 8). The relationship between collector height and total deposition was linear and highly significant (R2 = 0.9557, p-level < 0.001). As the spray droplets approach the ground, drift increases and the deposition amount decreases owing to the resistance of the ground. Therefore, to compare the spray performance of UASS, a unified standard must be established for the measurement height of the collector. The average deposition according to flight altitude was 791.9 ng/cm2 at 2 m, 1064.9 ng/cm2 at 2.5 m, and 791.9 ng/cm2 at 3 m. The analysis of variance shows that the height of the collector and the altitude of UAV do not significantly affect the deposition (p > 0.05). However, this result differs from previous studies [19,29]. To solve the problem, additional experiments are required.
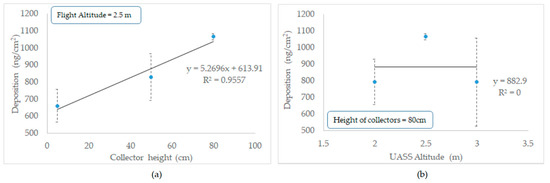
Figure 8.
Spray deposition of UASS by (a) collector height, (b) UASS altitude.
The measurement of the spray swath according to flight conditions revealed that the effective spray swath increased as the height of the collector and UASS increased (Table 2). As the spray droplets released from the nozzle are diffused, the higher the flight altitude, the wider the effective spray swath. However, as the height of the collector decreases, the distance from the nozzle increases, which reduces the effective spray swath because the total amount of deposition itself decreases owing to air resistance.
Table 2.
Spray width of UASS.
4. Conclusions
The use of UASS is gradually increasing worldwide. However, there is a paucity of research for establishing criteria to evaluate its performance. When evaluating the performance of UASS, the amount of deposition is an important factor that determines the degree of actual PPP efficacy; therefore, accurate measurement is essential. To improve the accuracy of spray deposition measurements using WSP, a study was conducted to introduce a quantitative evaluation method using brilliant blue FCF as a tracer. Additionally, to establish a standardized methodology, the amount of spray depositions according to the height of the collector and flight altitude of the UASS were studied.
First, correlation analysis between the deposition and coverage on MV confirmed close concordance between the two values, with a correlation coefficient of 0.824 (p-level < 0.001). If the accuracy of measurement is improved, the precise analysis would be possible through quantitative evaluation and rapid assessment through image analysis in the field. The correlation coefficient between coverage values for MV and WSP was 0.775 and highly significant (p-level < 0.001) Furthermore, analysis of differences in coverage according to the material of the spray droplet collector revealed that the coverage value for WSP was approximately 44% of that for MV. The observed difference may be attributed to the spread factor for MV and WSP. However, further analysis is warranted in this regard.
In addition, quantitative evaluation was performed on the average deposition according to the flight altitude and collector height. By controlling the flight height at 2, 2.5, and 3 m and the collector height at 5, 50, and 80 cm, spraying was performed using UASS and the amount of tracer deposited on the collector was extracted and analyzed using a spectrometer. When the height of the collector was 5 cm, the average deposition was 659.9 ng/cm2, and when the height increased to 50 and 80 cm, the amount increased to 828.3 and 1064.9 ng/cm2, respectively. In other words, the total amount of deposition tended to decrease linearly as the distance from the ground decreased. Thus, air resistance generated near the ground affected the deposition amount. Since the height of the collector affects the measurement of deposition amount, a standard should be assigned for the height of the collector when establishing the universal method for measuring the amount of deposition in the future. However, because the amount of tracer deposited to the collector is very small, these results must be supplemented through additional experiments using a solution of higher concentration.
To measure the effective spread swath, the swath of the collectors satisfying the standard deposition amount per area was calculated. Analysis of collectors achieving the swath of over 0.7 mg/m2 considering the spray target of 8 L/ha and the overlap rate revealed that the higher the height of the collector and the higher the flight altitude of UASS, the wider the effective spray swath. This trend can be explained by the increase in the diffusion of spray droplets with the increase in the distance between the nozzle and the collector. However, in the case of collectors close to the ground, the effective spray width may decrease because of a reduction in the total amount of spray droplets.
Finally, to improve the spray deposition amount, the effects of the collector height and flight altitude on the deposition amount were analyzed using a tracer, and the method was compared with the existing qualitative evaluation method. In the future, through additional research, we intend to develop a more accurate control performance evaluation method to aid the development of superior UASS.
Author Contributions
Conceptualization, C.-G.L. and J.-Y.R.; methodology, C.-G.L. and S.-H.Y.; software, C.-G.L.; validation, C.-G.L., J.-Y.R. and S.-H.Y.; formal analysis, C.-G.L.; investigation, C.-G.L.; resources, S.-H.Y.; data curation, C.-G.L.; writing—original draft preparation, C.-G.L.; writing—review and editing, J.-Y.R. and S.-H.Y.; visualization, C.-G.L.; supervision, J.-Y.R.; project administration, J.-Y.R.; funding acquisition, J.-Y.R. All authors have read and agreed to the published version of the manuscript.
Funding
This work was supported by the National Standard Technology Improvement Technology Development Program (20006932, Standardization of agricultural UASS environmental requirement and procedure of aerial shot for plant disease and insect forecasting) funded By the Ministry of Trade, Industry & Energy (MOTIE, Republic of Korea).
Institutional Review Board Statement
Not applicable.
Data Availability Statement
Not applicable.
Conflicts of Interest
The authors declare no conflict of interest.
References
- Oerke, E.C. Crop losses to pests. J. Agric. Sci. 2006, 144, 31–43. [Google Scholar] [CrossRef]
- Zande, J.C.; Ellis, M.C.B.; Wenneker, M.; Walklate, P.; Kennedy, M. Spray drift and bystander risk from fruit crop spraying. Asp. Appl. Biol. 2014, 122, 177–185. [Google Scholar]
- Giles, D.K.; Akesson, N.B.; Yates, W.E. Pesticide Application Technology: Research and Development and the Growth of the Industry. Trans. ASABE 2008, 51, 397–403. [Google Scholar] [CrossRef]
- ISO/CD 23117-1; Agricultural and Forestry Machinery—Unmanned Aerial Spraying Systems—Part 1: Environmental Requirements. ISO: Geneva, Switzerland, 2021; pp. 1–12.
- Xue, X.; Lan, Y.; Sun, Z.; Chang, C.; Hoffmann, W.C. Develop an unmanned aerial vehicle based automatic aerial spraying system. Comput. Electron. Agric. 2016, 128, 58–66. [Google Scholar] [CrossRef]
- Zhang, Y.; Li, Y.; He, Y.; Liu, F.; Cen, H.; Fang, H. Near ground platform development to simulate UAV aerial spraying and its spraying test under different conditions. Comput. Electron. Agric. 2018, 148, 8–18. [Google Scholar] [CrossRef]
- Cavalaris, C.; Karamoutis, C.; Markinos, A. Efficacy of cotton harvest aids applications with unmanned aerial vehicles (UAV) and ground-based field sprayers—A case study comparison. Smart Agric. Technol. 2022, 2, 100047. [Google Scholar] [CrossRef]
- Huang, Y.; Hoffmann, W.C.; Lan, Y.; Wu, W.; Fritz, B.K. Development of a Spray System for an Unmanned Aerial Vehicle Platform. Appl. Eng. Agric. 2009, 25, 803–809. [Google Scholar] [CrossRef]
- Kharim, M.N.; Wayayok, A.; Mohamed Shariff, A.R.; Abdullah, A.F.; Husin, E.M. Droplet deposition density of organic liquid fertilizer at low altitude UAV aerial spraying in rice cultivation. Comput. Electron. Agric. 2019, 167, 105045. [Google Scholar] [CrossRef]
- Chen, H.; Lan, Y.; Fritz, B.K.; Hoffmann, W.C.; Liu, S. Review of agricultural spraying technologies for plant protection using unmanned aerial vehicle (UAV). Int. J. Agric. Biol. Eng. 2021, 14, 38–49. [Google Scholar] [CrossRef]
- Zhan, Y.; Chen, P.; Xu, W.; Chen, S.; Han, Y.; Lan, Y.; Wang, G. Influence of the downwash airflow distribution characteristics of a plant protection UAV on spray deposit distribution. Biosyst. Eng. 2022, 216, 32–45. [Google Scholar] [CrossRef]
- Xiongkui, H.; Bonds, J.; Herbst, A.; Langenakens, J. Recent development of unmanned aerial vehicle for plant protection in East Asia. Int. J. Agric. Biol. Eng. 2017, 10, 18–30. [Google Scholar] [CrossRef]
- Hanif, A.S.; Han, X.; Yu, S.-H. Independent Control Spraying System for UAV-Based Precise Variable Sprayer: A Review. Drones 2022, 6, 383. [Google Scholar] [CrossRef]
- Chen, S.; Lan, Y.; Zhou, Z.; Ouyang, F.; Wang, G.; Huang, X.; Deng, X.; Cheng, S. Effect of Droplet Size Parameters on Droplet Deposition and Drift of Aerial Spraying by Using Plant Protection UAV. Agronomy 2020, 10, 195. [Google Scholar] [CrossRef]
- Yu, S.-H.; Kim, Y.-K.; Jun, H.-J.; Choi, I.S.; Woo, J.-K.; Kim, Y.-H.; Yun, Y.-T.; Choi, Y.; Alidoost, R.; Lee, J. Evaluation of Spray Characteristics of Pesticide Injection System in Agricultural Drones. J. Biosyst. Eng. 2020, 45, 272–280. [Google Scholar] [CrossRef]
- Dafsari, R.A.; Khaleghi, M.; Yu, S.-H.; Choi, Y.; Lee, J. Design and Performance Evaluation of Air Induction (AI) Nozzles to Reduce Drift Potential for Agricultural Unmanned Aerial Vehicles (UAVs). J. Biosyst. Eng. 2021, 46, 462–473. [Google Scholar] [CrossRef]
- Lan, Y.; Qian, S.; Chen, S.; Zhao, Y.; Deng, X.; Wang, G.; Zang, Y.; Wang, J.; Qiu, X. Influence of the Downwash Wind Field of Plant Protection UAV on Droplet Deposition Distribution Characteristics at Different Flight Heights. Agronomy 2021, 11, 2399. [Google Scholar] [CrossRef]
- Zhang, S.; Qiu, B.; Xue, X.; Sun, T.; Gu, W.; Zhou, F.; Sun, X. Effects of Crop Protection Unmanned Aerial System Flight Speed, Height on Effective Spraying Width, Droplet Deposition and Penetration Rate, and Control Effect Analysis on Wheat Aphids, Powdery Mildew, and Head Blight. Appl. Sci. 2021, 11, 712. [Google Scholar] [CrossRef]
- Lou, Z.; Xin, F.; Han, X.; Lan, Y.; Duan, T.; Fu, W. Effect of Unmanned Aerial Vehicle Flight Height on Droplet Distribution, Drift and Control of Cotton Aphids and Spider Mites. Agronomy 2018, 8, 187. [Google Scholar] [CrossRef]
- Wang, J.; Lan, Y.; Zhang, H.; Zhang, Y.; Wen, S.; Yao, W.; Deng, J. Drift and deposition of pesticide applied by UAV on pineapple plants under different meteorological conditions. Int. J. Agric. Biol. Eng. 2018, 11, 5–12. [Google Scholar] [CrossRef]
- Ling, W.; Du, C.; Mengchao, Z.; Yu, W.; Ze, Y.; Shumao, W. CFD Simulation of Low-attitude Droplets Deposition Characteristics for UAV based on Multi-feature Fusion. IFAC-PapersOnLine 2018, 51, 648–653. [Google Scholar] [CrossRef]
- Faiçal, B.S.; Freitas, H.; Gomes, P.H.; Mano, L.Y.; Pessin, G.; de Carvalho, A.C.P.L.F.; Krishnamachari, B.; Ueyama, J. An adaptive approach for UAV-based pesticide spraying in dynamic environments. Comput. Electron. Agric. 2017, 138, 210–223. [Google Scholar] [CrossRef]
- Wang, S.; Li, X.; Zeng, A.; Song, J.; Xu, T.; Lv, X.; He, X. Effects of Adjuvants on Spraying Characteristics and Control Efficacy in Unmanned Aerial Application. Agriculture 2022, 12, 138. [Google Scholar] [CrossRef]
- Turner, C.R.; Huntington, K.A. The use of a water sensitive dye for the detection and assessment of small spray droplets. J. Agric. Eng. Res. 1970, 15, 385–387. [Google Scholar] [CrossRef]
- Wallace, K.; Yoshida, K. Determination of dynamic spread factor of water droplets impacting on water-sensitive paper surfaces. J. Colloid Interface Sci. 1978, 63, 164–165. [Google Scholar] [CrossRef]
- Tang, Y.; Hou, C.J.; Luo, S.M.; Lin, J.T.; Yang, Z.; Huang, W.F. Effects of operation height and tree shape on droplet deposition in citrus trees using an unmanned aerial vehicle. Comput. Electron. Agric. 2018, 148, 1–7. [Google Scholar] [CrossRef]
- Wang, G.; Lan, Y.; Qi, H.; Chen, P.; Hewitt, A.; Han, Y. Field evaluation of an unmanned aerial vehicle (UAV) sprayer: Effect of spray volume on deposition and the control of pests and disease in wheat. Pest Manag. Sci. 2019, 75, 1546–1555. [Google Scholar] [CrossRef]
- Salyani, M.; Zhu, H.; Sweeb, R.D.; Pai, N. Assessment of spray distribution with water-sensitive paper. Agric. Eng. Int. CIGR J. 2013, 15, 101–111. [Google Scholar]
- Ahmad, F.; Zhang, S.; Qiu, B.; Ma, J.; Xin, H.; Qiu, W.; Ahmed, S.; Chandio, F.A.; Khaliq, A. Comparison of Water Sensitive Paper and Glass Strip Sampling Approaches to Access Spray Deposit by UAV Sprayers. Agronomy 2022, 12, 1302. [Google Scholar] [CrossRef]
- Sánchez-Hermosilla, J.; Medina, R.; Rodríguez, F.; Callejón, A. Use of Food Dyes as Tracers to Measure Multiple Spray Deposits by Ultraviolet-Visible Absorption Spectrophotometry. Trans. ASABE 2008, 51, 10. [Google Scholar] [CrossRef]
- Cai, S.S.; Stark, J.D. Evaluation of five fluorescent dyes and triethyl phosphate as atmospheric tracers of agricultural sprays. J. Environ. Sci. Health Part B 1997, 32, 969–983. [Google Scholar] [CrossRef]
- Pergher, G. Recovery Rate of Tracer Dyes Used for Spray Deposit Assessment. Trans. ASAE 2001, 44, 787–794. [Google Scholar] [CrossRef]
- Hayden, J.; Ayers, G.; Grafius, E.; Hayden, N. Two Water-Soluble Optically Resolvable Dyes for Comparing Pesticide Spray Distribution. J. Econ. Entomol. 1990, 83, 2411–2413. [Google Scholar] [CrossRef]
- Gao, S.; Wang, G.; Zhou, Y.; Wang, M.; Yang, D.; Yuan, H.; Yan, X. Water-soluble food dye of Allura Red as a tracer to determine the spray deposition of pesticide on target crops. Pest. Manag. Sci. 2019, 75, 2592–2597. [Google Scholar] [CrossRef] [PubMed]
- De Cerqueira, D.T.R.; Raetano, C.G.; do Amaral Dal, M.H.F.; Prado, E.P.; Christovam, R.S.; Serra, M.E.; Costa, S.A. Agricultural Spray Deposit Quantification Methods. Appl. Eng. Agric. 2012, 28, 825–831. [Google Scholar] [CrossRef]
- KS B 7949; Agricultural and Forestry Machinery—Unmanned Aerial Spraying Systems—Performance Test Methods for Spraying System. Korean Standards Association: Seoul, Republic of Korea, 2021; pp. 1–18. (In Korean)
- Lee, C.G.; Kim, D.; Hwang, I.; Yoo, J.-s.; Kim, J.; Kim, T.C.; Rhee, J.Y. Assessment of collector materials for spray deposition measurement for Unmanned Aerial Spraying System. Precis. Agric. Sci. Technol. 2021, 3, 73–81. [Google Scholar] [CrossRef]
- Antonio, P.; Raetano, C.; Velini, E. Choice of tracers for the evaluation of spray deposits. Sci. Agric. 2005, 62, 440–445. [Google Scholar] [CrossRef]
- Cunha, M.; Carvalho, C.; Marcal, A.R.S. Assessing the ability of image processing software to analyse spray quality on water-sensitive papers used as artificial targets. Biosyst. Eng. 2012, 111, 11–23. [Google Scholar] [CrossRef]
- Panneton, B.; Drummond, A.M. Digital Image Analysis of Spray Samples. Appl. Eng. Agric. 1991, 7, 273–278. [Google Scholar] [CrossRef]
Disclaimer/Publisher’s Note: The statements, opinions and data contained in all publications are solely those of the individual author(s) and contributor(s) and not of MDPI and/or the editor(s). MDPI and/or the editor(s) disclaim responsibility for any injury to people or property resulting from any ideas, methods, instructions or products referred to in the content. |
© 2022 by the authors. Licensee MDPI, Basel, Switzerland. This article is an open access article distributed under the terms and conditions of the Creative Commons Attribution (CC BY) license (https://creativecommons.org/licenses/by/4.0/).