Article

A High-Precision Crop Classification Method Based on Time-Series UAV Images

1
Urumqi Natural Resources Comprehensive Survey Center, China Geological Survey, Urumqi 830057, China
2
Department of Tourism and Geography, College of Science, Shihezi University, Shihezi 832003, China
*
Author to whom correspondence should be addressed.
These authors contributed equally to this work.
Agriculture 2023, 13(1), 97; https://doi.org/10.3390/agriculture13010097
Submission received: 8 November 2022 / Revised: 3 December 2022 / Accepted: 27 December 2022 / Published: 29 December 2022
(This article belongs to the Section Digital Agriculture)

Abstract

:
Timely and accurate information on crop planting structures is crucial for ensuring national food security and formulating economic policies. This study presents a method for high-precision crop classification using time-series UAV (unmanned aerial vehicle) images. Before constructing the time-series UAV images, Euclidian distance (ED) was utilized to calculate the separability of samples under various vegetation indices. Second, co-occurrence measures and the gray-level co-occurrence matrix (GLCM) were employed to derive texture characteristics, and the spectral and texture features of the crops were successfully fused. Finally, random forest (RF) and other algorithms were utilized to classify crops, and the confusion matrix was applied to assess the accuracy. The experimental results indicate the following: (1) Time-series UAV remote sensing images considerably increased the accuracy of crop classification. Compared to a single-period image, the overall accuracy and kappa coefficient increased by 26.65% and 0.3496, respectively. (2) The object-oriented classification method was better suited for the precise classification of crops. The overall accuracy and kappa coefficient increased by 3.13% and 0.0419, respectively, as compared to the pixel-based classification results. (3) RF obtained the highest overall accuracy and kappa coefficient in both pixel-based and object-oriented crop classification. RF’s producer accuracy and user accuracy for cotton, spring wheat, cocozelle, and corn in the study area were both more than 92%. These results provide a reference for crop area statistics and agricultural precision management.

1. Introduction

Timely and accurately acquiring crop planting structure information is the core problem of crop area statistics and mapping, crop growth monitoring, and yield estimation. It contributes to the adjustment of agricultural and industrial structures and the creation of food policies, and it has significant implications for the management of agricultural production [1,2]. It is also an effective tool to ensure national food security and sustainable socio-economic development [3,4,5].
With the advancement of geographical science and technology, crop classification research has shifted from traditional ground and field measurements to multidimensional, spatio-temporal remote sensing monitoring [6]. Due to its rapid data capture, broad monitoring range, and robust macroscopic properties, remote sensing technology has been extensively applied to crop data extraction and area estimation [7,8,9,10]. Utilization strategies for remote sensing photos can be classified into two categories: single-period images and time-series images. Using single-period remote sensing images is an approach used for extracting information about crop sowing. Using this method, crops can be sorted into groups with just one picture. It works best in places with simple planting schemes and a few different kinds of ground objects. This strategy focuses on figuring out what makes different plant species different and improving classification methods. For example, Kang et al. [11] took Hengshui City, Hebei Province, as the research area and conducted a red-edge feature analysis and crop classification based on a domestic GF-6 WFV high-resolution remote sensing image and analyzed the impact of different red-edge features on crop classification. It promotes applying and popularizing GF-6 WFV data and its red sideband in agricultural remote sensing. Liu et al. [12] took a Sentinel-2 satellite remote sensing image as the data source, proposed a crop classification method combining convolutional neural network and feature selection, and carried out classification, recognition, and mapping of rice, corn, peanut, and other major crops in Yuanyang County, Henan Province, with an overall classification accuracy of 96.39%. When only one stage of a remote sensing image is utilized for crop classification and recognition, it is difficult to determine the appropriate remote sensing image classification period. There are no consistent and unified ways to determine the difference between different remote sensing images. This means that the uncertainty factors that affect the accuracy of the final crop categorization could increase significantly [13,14]. Therefore, many scholars have conducted fruitful studies on crop classification methods based on time-series remote sensing images [15,16,17]. For example, Xie et al. [18] took southwest Ontario, Canada, as the research area and used a time series Radarsat-1 remote sensing image of the whole growing season of crops to classify, and the final overall accuracy reached 94.04%. Wang et al. [19] opened Rubicon agriculture as a test area in Xinjiang, using Landsat remote sensing image data. The dynamic time neat time-weighted method to identify types of crops was studied, and the results show that the dynamic time neat time-weighted method could improve the ability of different crop type identification, with a final classification accuracy of 82.68%. Guo et al. [20] selected MODIS time-series remote sensing image data and reconstructed the NDVI time-series curve with harmonic analysis of NDVI time-series filtering. The planting information of crops in the Yellow River Delta was extracted by comparing and analyzing the similarity between the NDVI time series curve and the reference time series curve. The area extraction accuracy of corn, cotton, and winter wheat was 85.1%, 95.5%, and 96.8%, respectively. Wang et al. [21] proposed a paddy rice mapping approach with time series sentinel optical and SAR images, which effectively improved the mapping accuracy. Lu et al. [22] used time series remote sensing images to quantitatively evaluate the farmland production capacity at the county scale and obtained good experimental results.
It is evident that the classification of crops by remote sensing based on a single-period image possesses ease of operation and great efficiency, but it also has significant flaws. When the planting structure of crops in a region is particularly complicated, the phenomenon of “foreign bodies with the same spectrum” may occur, meaning that the spectral features of different crops are quite similar. Using only one-stage remote sensing images, it is currently difficult to accurately identify the feature differences between various crops; consequently, the classification accuracy of crops retrieved using this method is frequently subpar. While the remote sensing classification method based on time-series images can effectively combine the crop phenology change rule. Compared to single-period remote sensing images, it works better in areas with complex agricultural planting structures and can classify crops with a high level of accuracy. However, when the time-series remote sensing image improves the classification accuracy, it also brings some problems such as feature redundancy. Most of the previous studies used a certain band or a certain vegetation index to construct time-series data [23]. This indirectly causes data redundancy, reduces the processing efficiency, and may even reduce the classification accuracy. Therefore, how to effectively screen image spectral features and construct the best time series image is one of the focuses of this paper.
Moreover, there are few studies on crop classification utilizing time-series UAV remote sensing images, whereas the majority of previous research is based on satellite remote sensing data or a single period remote sensing image. Nevertheless, the emergence and continued development of UAV remote sensing technology provides fresh research ideas for applying remote sensing images and crop classification methods. Some scholars have also made attempts to classify land use by UAV images. Sefercik et al. [24] evaluated the positioning accuracy and land cover classification potential of RTK equipped MS UAV using point-based geolocation accuracy analysis and pixel-based ensemble learning algorithms. UAV image acquisition for remote sensing has numerous advantages, including high spatial resolution, high speed, simple operation, and low cost. It can quickly collect images for a certain area and obtain more accurate crop spatial feature data. It also does a great job of processing image data. It is very important for the development, spread, and use of crop monitoring techniques, which have become an essential addition to satellite remote sensing and make up for the limitations in how satellite remote sensing images can be used [25,26,27,28]. In light of this, this work provides a high-precision crop classification approach based on time-series UAV images to further increase the classification accuracy of crops, and it provides a novel research concept for UAV remote sensing agricultural applications.

2. Study Area and Data

2.1. Study Area

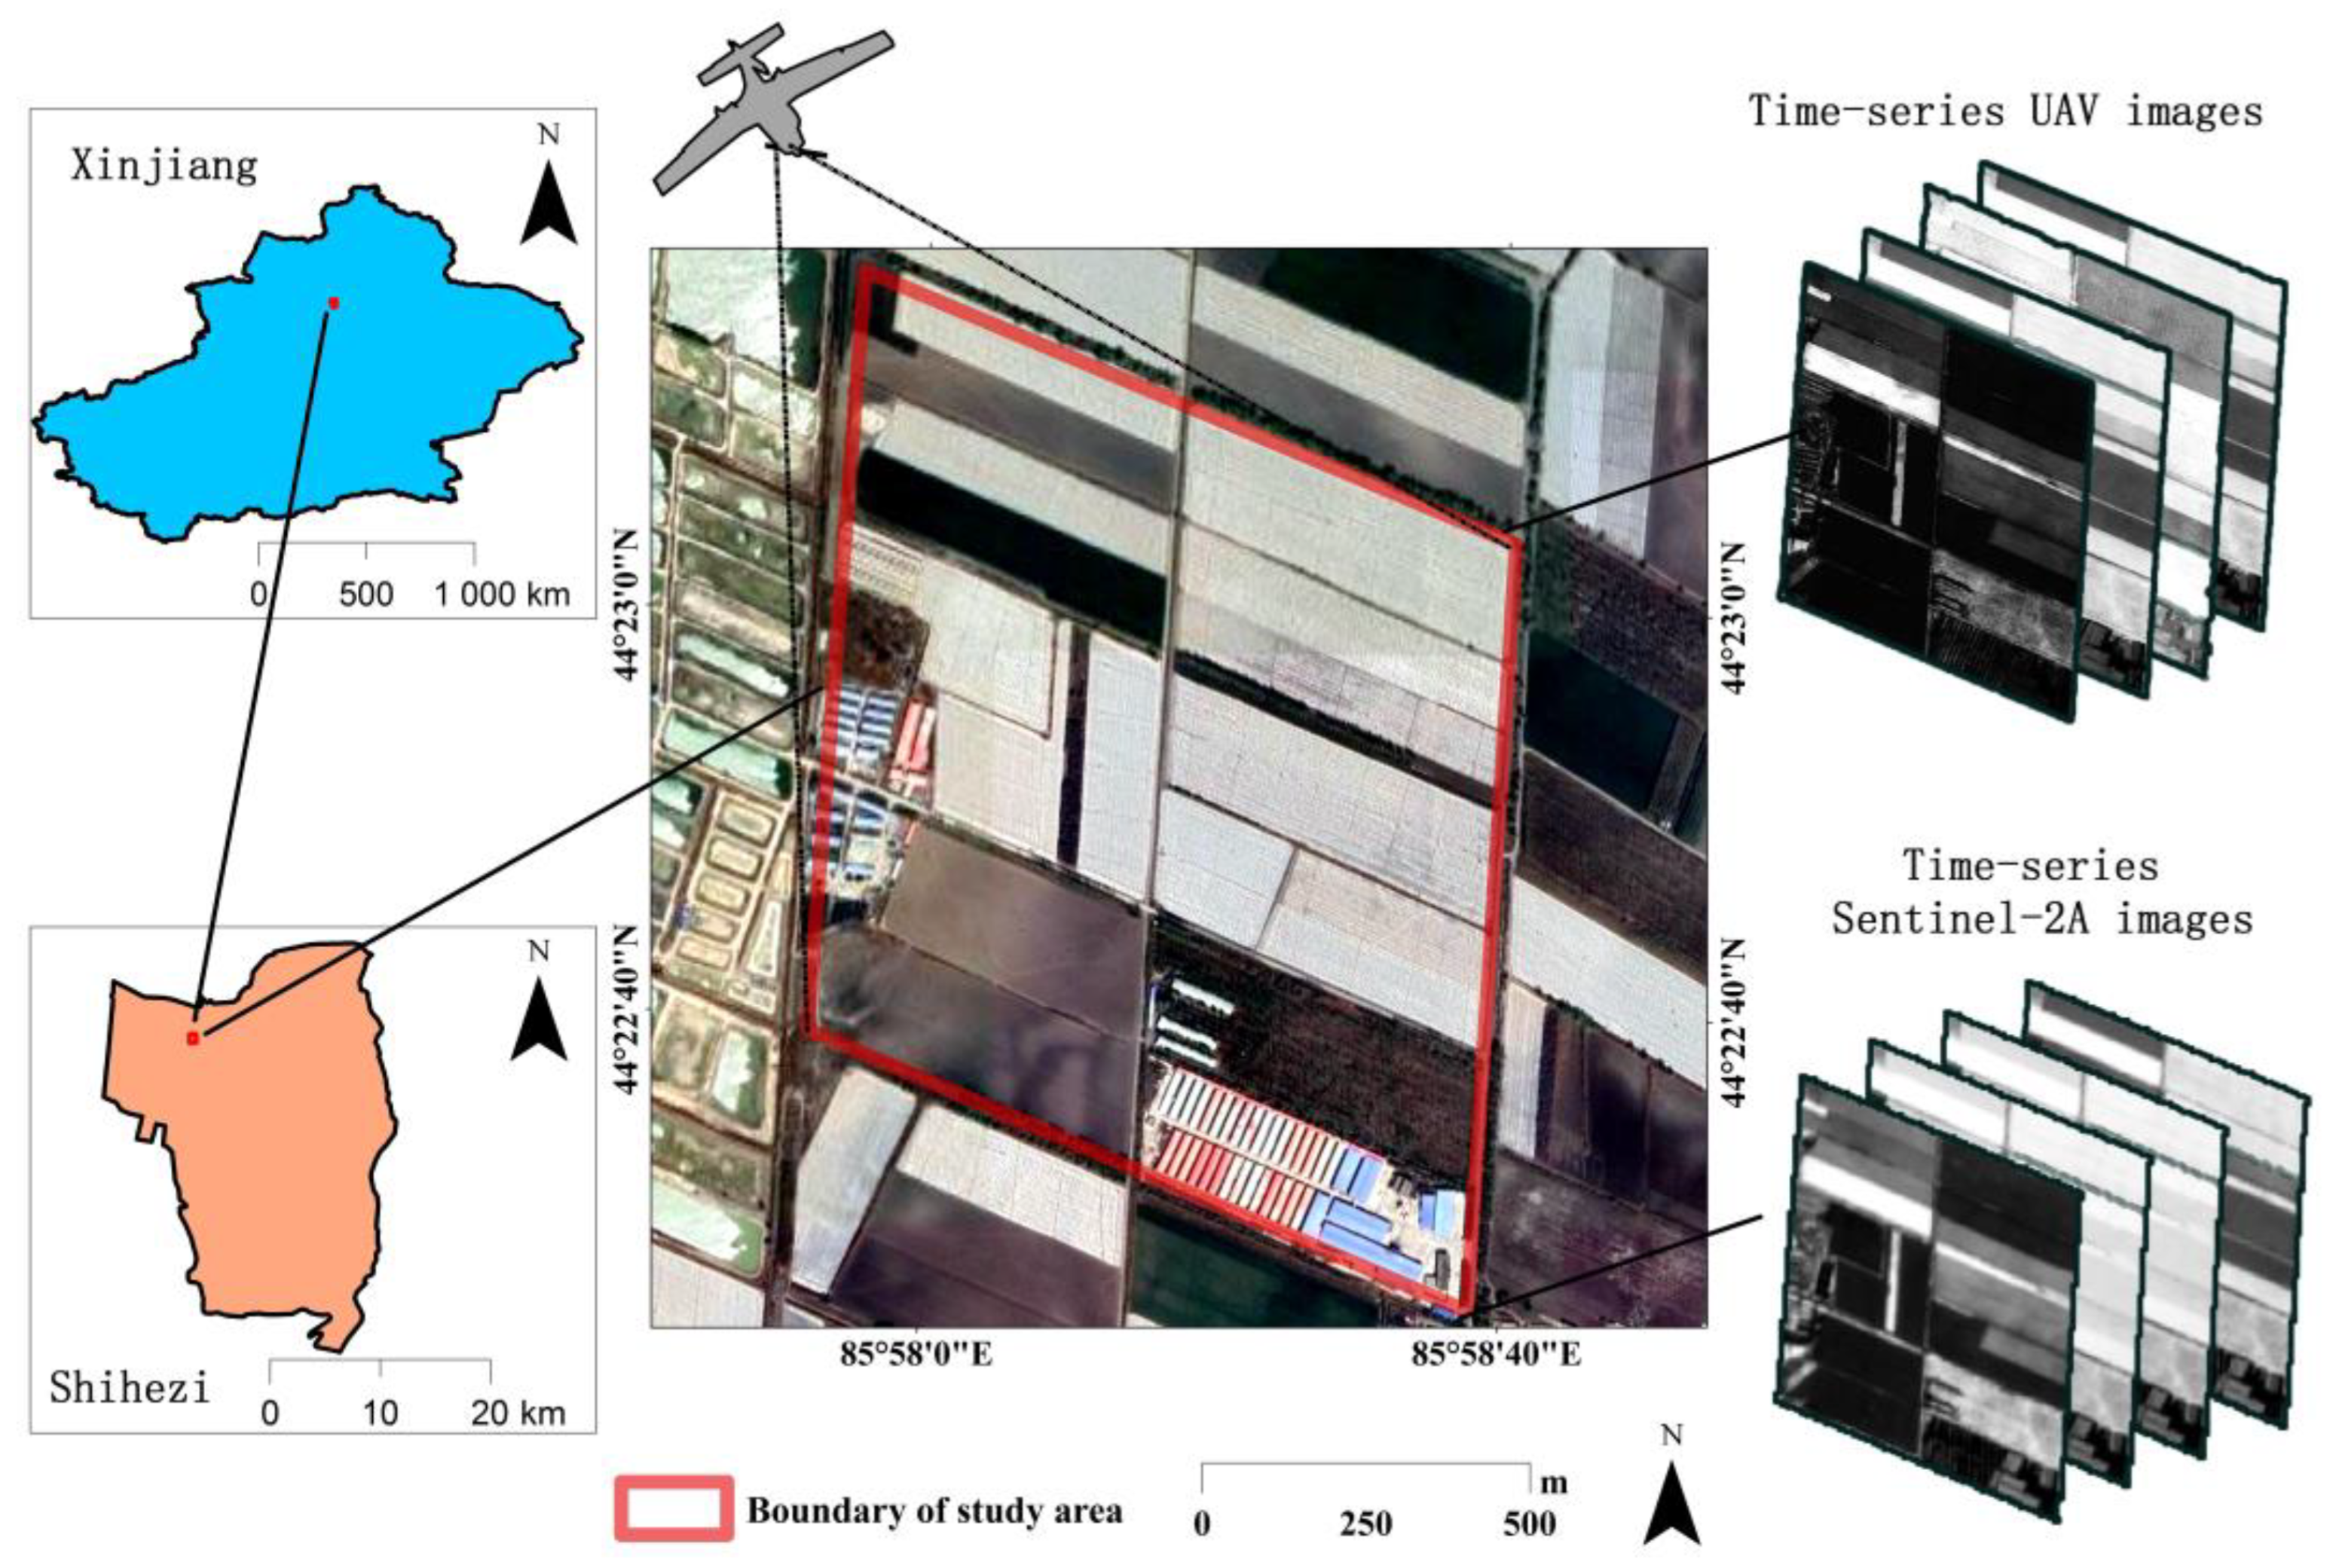
2.1.1. Location of Study Area

The study area is mainly located in the reclamation area of Shihezi City, Xinjiang, between 85°57′~85°59′ east longitude and 44°22′~44°24′ north latitude. The area of the test area is about 1798.64 mu, and Figure 1 shows the geographical location of the study area and time-series UAV and satellite remote sensing images. The research area is mainly located in the middle of the northern foot of the Tianshan Mountains and the southern edge of the Gurbantunggut Desert, with an average altitude of 450.8 m and a flat terrain. It belongs to a typical temperate continental climate, with an average temperature of 6.5~7.2 °C, annual precipitation of 125.0~207.7 mm, and abundant sunshine. The annual sunshine duration is 2721–2818 h, and the frost-free period is 168–171 d [29]. The research location features unique climatic and topographical circumstances, with smooth, continuous farmland and a uniform field layout. In the area of research, the crop kinds are numerous, the planting structure is quite intricate, and the size and mechanization level of crop planting are high. It is useful for remote sensing monitoring and precision agriculture.

2.1.2. Crop Types in the Study Area

Cotton, corn, cocozelle, and spring wheat are the primary crop types in the research region, and adjacent plots are separated by a modest number of trees and roadways. Figure 2 depicts the phenological calendar information of important crops in the study area. Cotton is planted in early April, has a rather lengthy growth cycle, and is harvested between mid- and late October. Corn is typically sown between late May and early June, has a very short three-month growth cycle, and is harvested between late September and early October. Cocozelle was sown relatively early, in late March, and when it reached maturity in July and August, it was harvested. Spring wheat is likewise sown in late March, and its development cycle is quite short, with maturity and harvest occurring in July. The seasonal rhythm of crops is the main idea behind using remote sensing to find crop time series.

2.2. Data

2.2.1. UAV Data Acquisition and Preprocessing

This article chose the eBee SQ UAV fitted with a Parrot Sequoia sensor as the flight platform. The eBee SQ UAV has a wingspan of 110 cm, a weight of 1.1 kg, a maximum flying period of 55 min, and a cruising speed between 40 and 110 km per hour. It can operate without difficulty in hilly, mountainous, forested, and other locations with complex terrain or dense obstructions, which significantly expands the UAV’s application range and makes it one of the best options for agricultural remote sensing monitoring. The imaging payload sensor is a five-channel sensor with visible RGB images and single-channel bands of green, red, and near-infrared; the RGB resolution is 16 million and the single-band resolution is 1.2 million. The eBee SQ drone is equipped with Parrot Sequoia sensors to improve crop monitoring efficiency. Figure 3 shows the UAV’s platform, sensor, and partial detail images.
This study collected data on 24 May 2021, 21 June 2021, 25 July 2021, and 5 September 2021, to acquire time-series UAV remote sensing images of typical crops in the study area by combining crop phenology traits and weather factors. The weather was favorable, and there was no breeze at the time the data were collected. The UAV’s flying height was 138 m, the degree of heading overlap was 80%, the degree of side overlap was 60%, and the exposure method was fixed distance exposure. There was an acquisition of 825 original aerial photographs. The Pix4DMapper program quickly fragmented and ortho-corrected the aerial photos of the study area. The processed images were saved in TIFF format, with 8 bits of information per channel. The spatial resolution was 10 cm, and WGS_1984_UTM_zone_45N was the projection mode.

2.2.2. Satellite Data Acquisition and Preprocessing

To further investigate the benefits of UAV in crop classification, satellite remote sensing images were compared with UAV images. Sentinel-2 remote sensing images were utilized in this investigation, with the acquisition dates falling on 18 May 2021, 12 July 2021, 11 August 2021, and 5 September 2021. The data center of the European Space Agency is available for free download. Two satellites, 2A and 2B, comprise the high-resolution multispectral imaging spacecraft Sentinel-2. One satellite’s revisit cycle is 10 days, and the two are complementary. When both satellites function simultaneously, a complete image of the equatorial region of the Earth can be captured every five days. The multispectral imager (MSI) on Sentinel-2 can cover 13 spectral bands and has an image width of 290 km. Sentinel-2 is the only optical remote sensing satellite with three bands in the red edge range, making it highly effective for crop monitoring. The atmospheric apparent reflectance product is derived from the Sentinel-2 L1C data obtained in this paper after orthorectification and fine geometric correction. However, no atmospheric correction has been performed. Therefore, the Sentinel-2 data require additional atmospheric correction and tailoring.

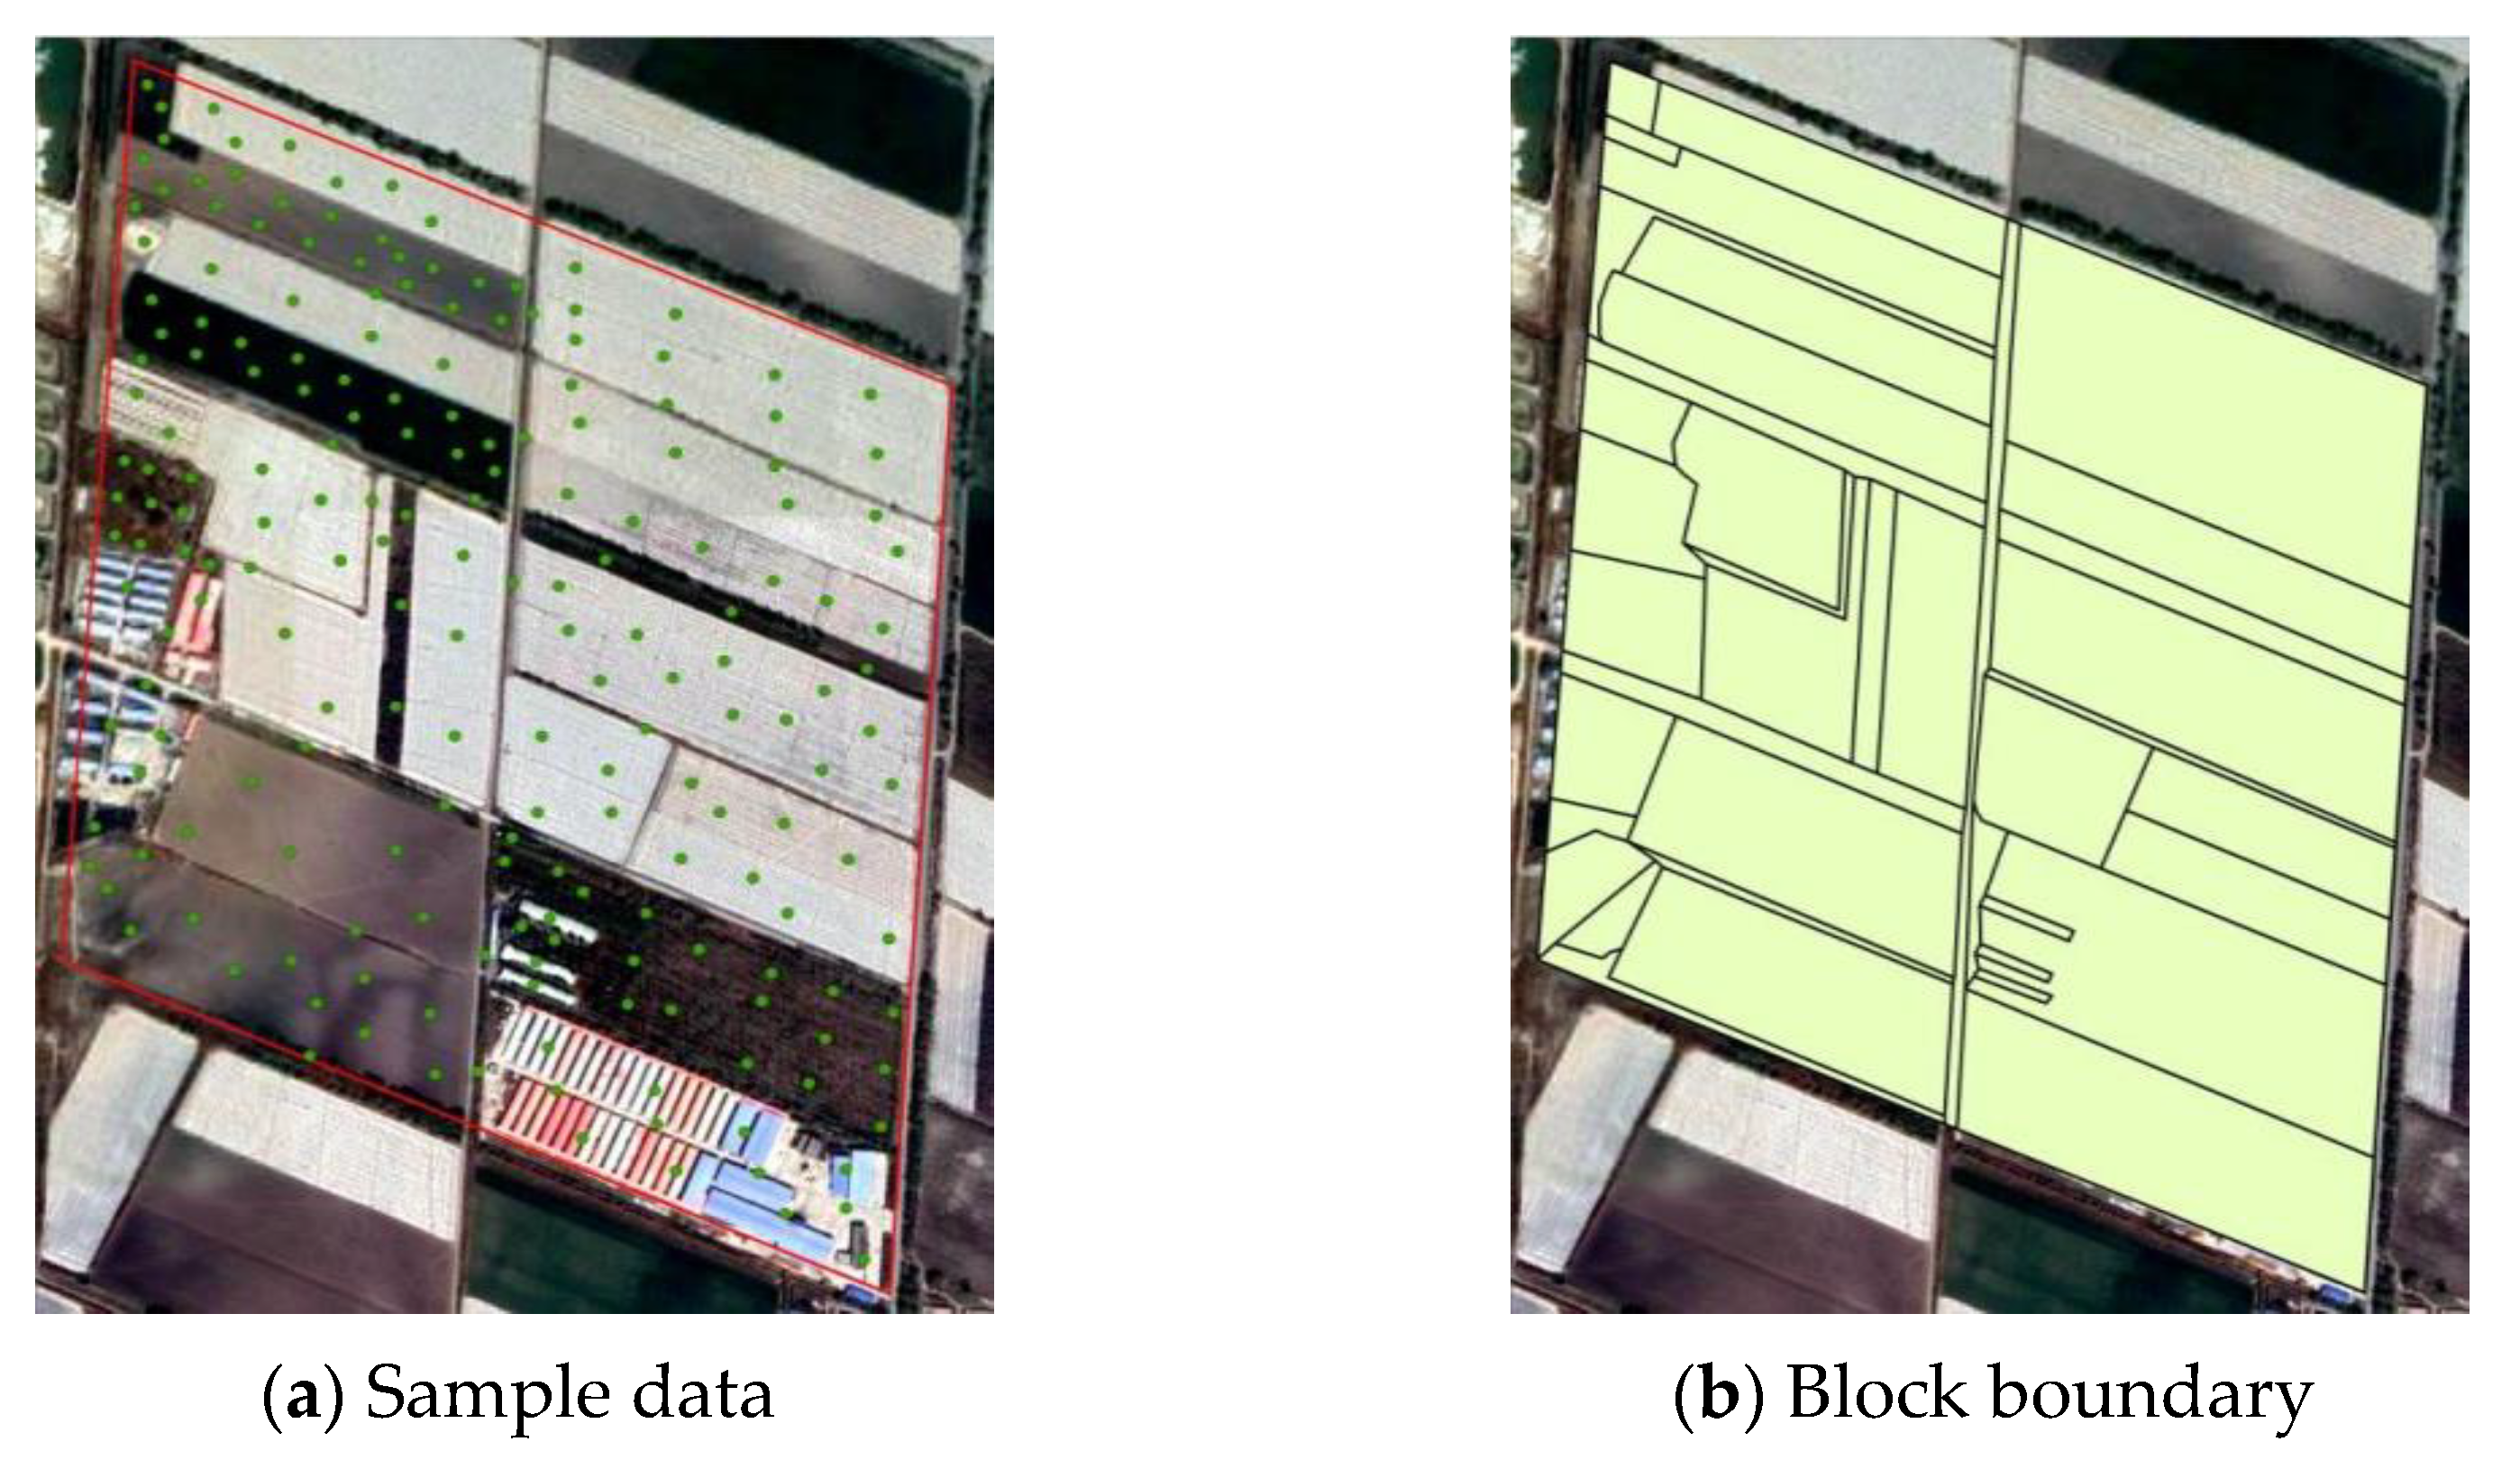
2.2.3. Ground Survey Data
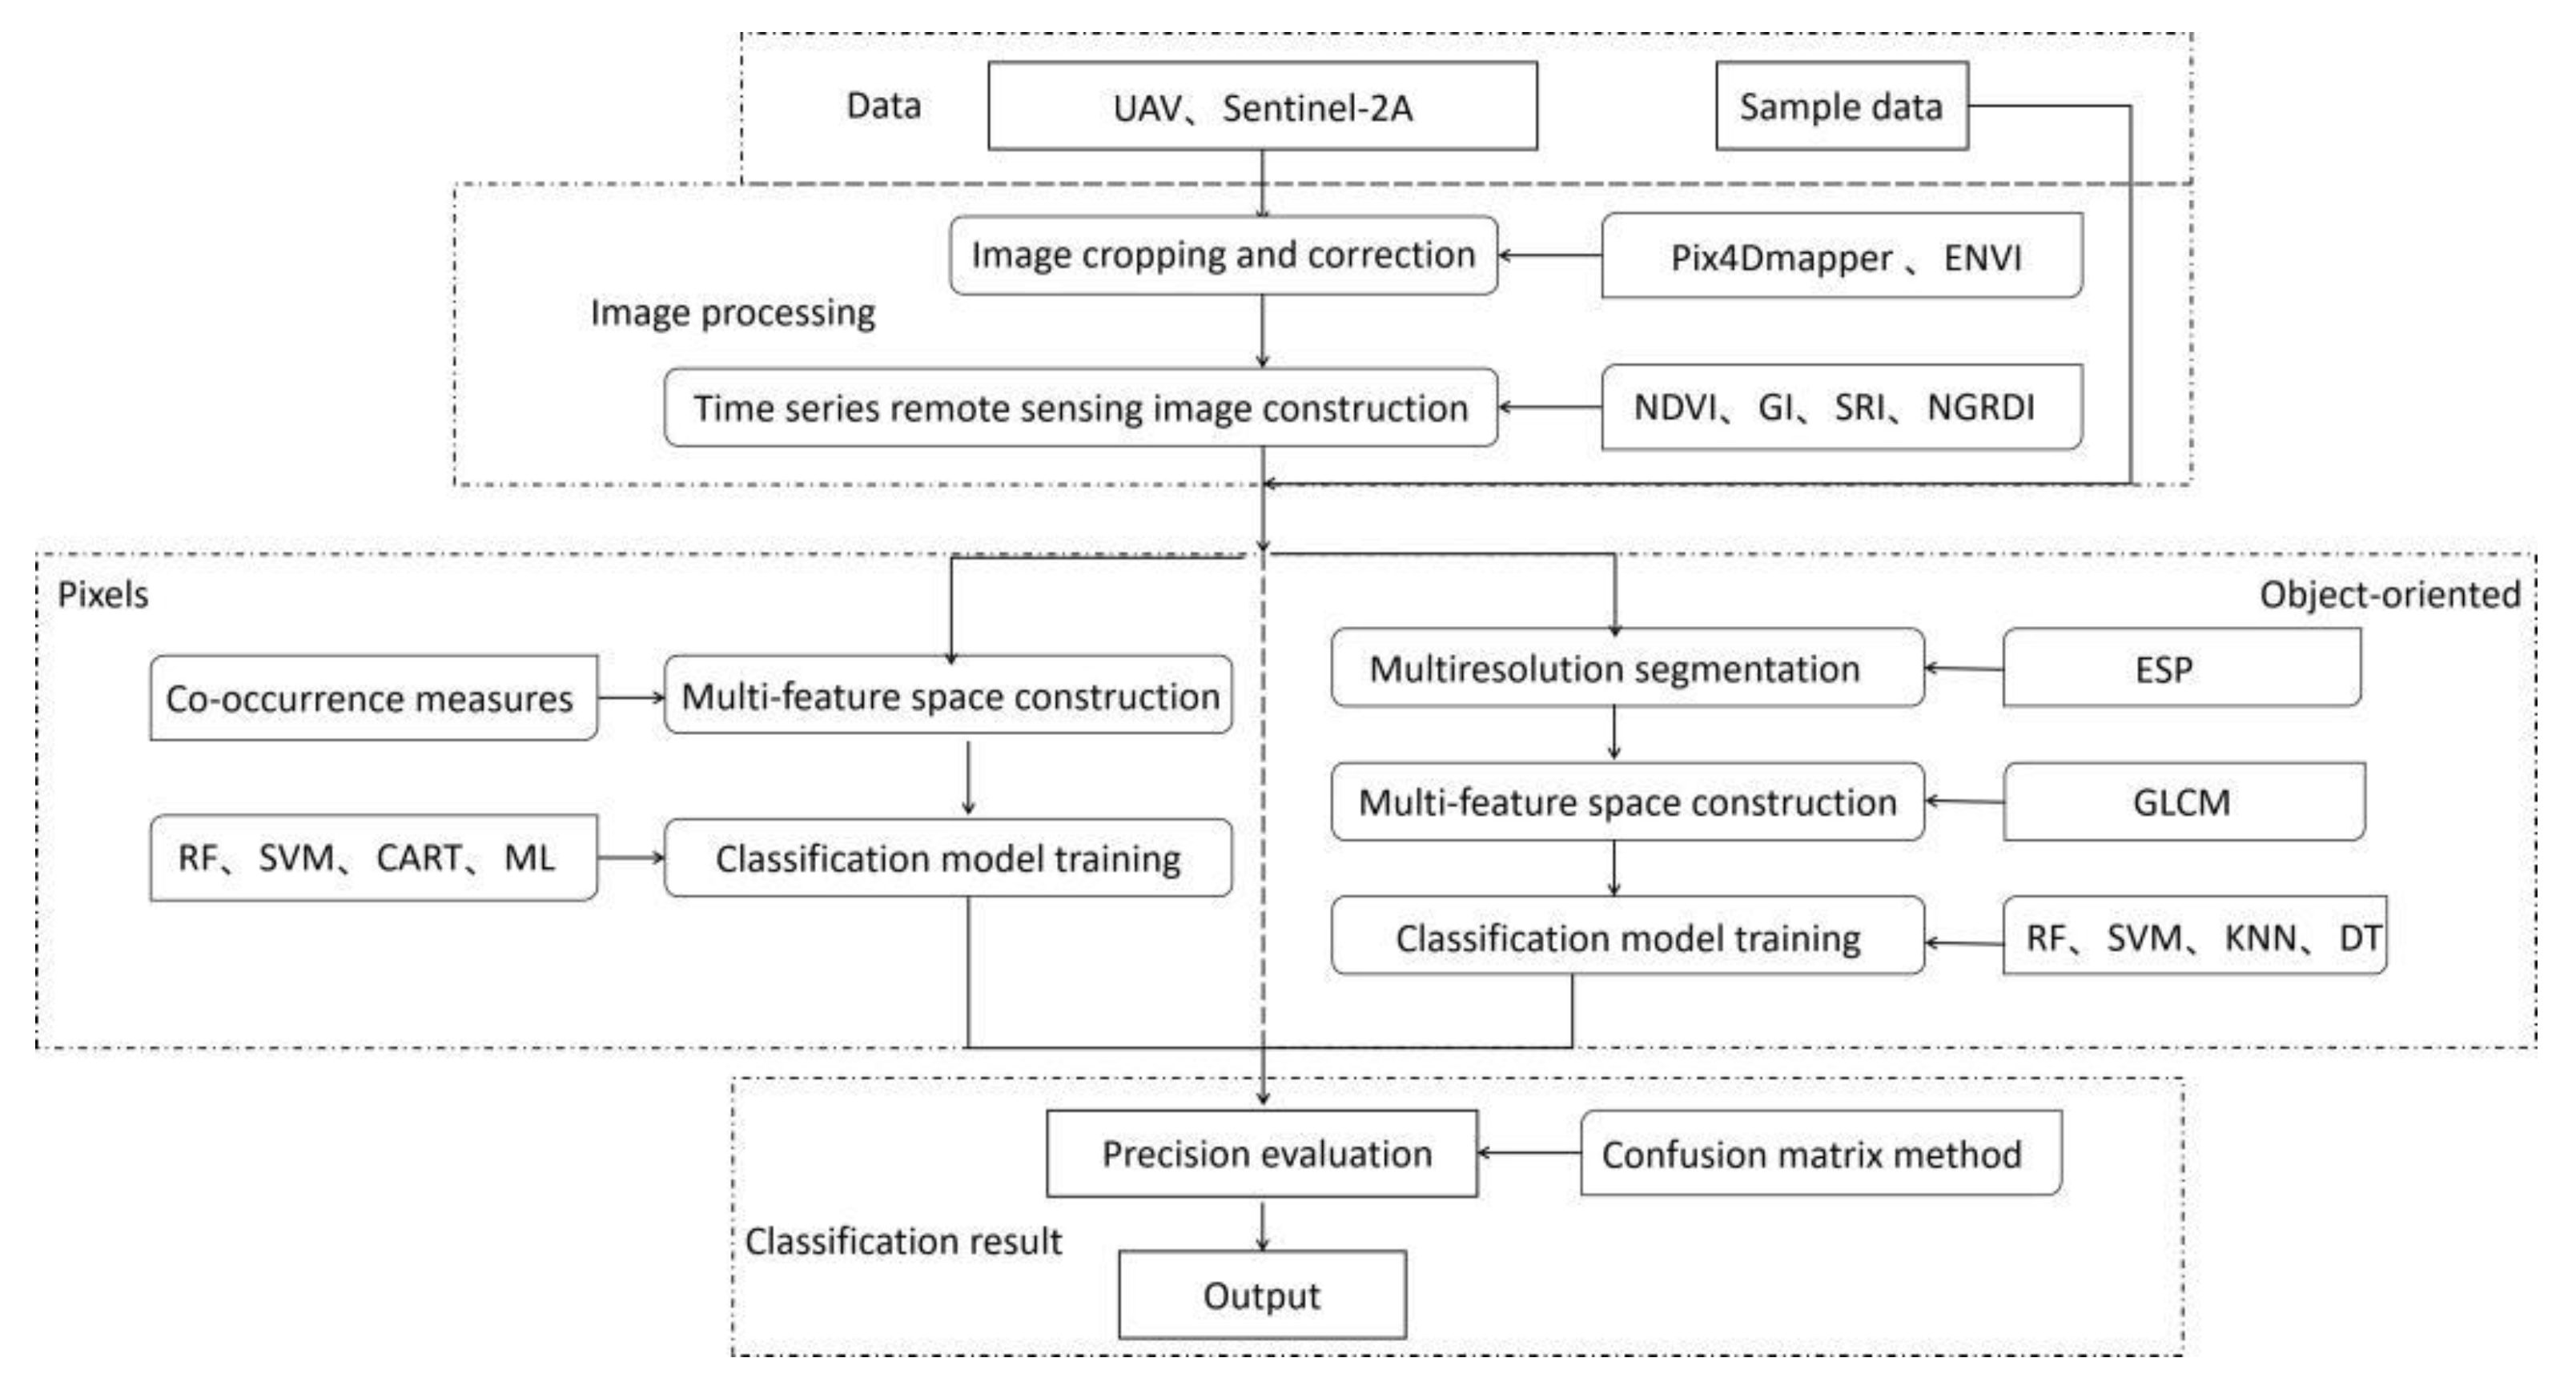
After aerial photography, LocaSpace Viewer software was used to label and record the various blocks and crop kinds in the field in order to generate crop classification samples and validate data sets. In each plot, random and uniform points were collected. A total of 200 control points were collected in the experiment. The sample of cotton included 1525 pixels, while the sample of cocozelle contained 739 pixels. The sample of spring wheat had 824 pixels, the sample of maize had 2865 pixels, the sample of reeds had 664 pixels, the sample of forest had 2618 pixels, and the sample of building land had 3443 pixels. Subsequently, to generate the validation dataset, ArcGIS software was utilized to vectorize the boundary of all plots in the UAV image with the same projection coordinate system as the UAV image. Figure 4 shows the spatial distribution of the sample data and the boundary data.

3. Method

The article’s technical roadmap is depicted in Figure 5. The first step was the acquisition of remote sensing image data and image preprocessing, mostly in Pix4Dmapper and ENVI software for image cutting and ortho correction, while simultaneously analyzing a variety of vegetation indices to construct time-series remote sensing images. Secondly, two classification methods based on object-oriented and pixel-based approaches were utilized to conduct a crop classification study on preprocessed remote sensing images and to investigate the influence of different classification algorithms on the final classification accuracy. The confusion matrix was then used to assess the accuracy of the crop classification results and generate the optimal crop classification map.

3.1. Construction of Time Series UAV Remote Sensing Images

The vegetation index can calculate the band according to the absorption and reflection characteristics of crops in different bands to enhance crop information. Its main idea is to use math to change multiple bands based on a thorough analysis of different spectral properties in order to obtain a number that can be used to describe the parameters of the crops [30]. Diverse vegetation indices have been extensively utilized in crop identification, crop growth monitoring, and area statistics, amongst other fields [31,32,33]. This paper selected four commonly used vegetation indices as spectral and spatial features for research in order to construct UAV time-series remote sensing images and further improve the accuracy and efficiency of crop classification. The formula for calculating each vegetation index is presented in Table 1.
In this paper, the sample data were used to calculate the mean value of each crop under different vegetation indices, and time-series change curves were drawn, as shown in Figure 6. As shown in the figure, the mean value of the vegetation index of crops during any given period was very close. On 24 May 2021, for instance, the SRI mean value of cotton, corn, cocozelle, and reed was very similar. On 21 June 2021, the mean NDVI values for cocozelle and corn were also very similar. On 25 July 2021, the mean NGRDI of maize and woodland was not significantly different, indicating that it is difficult to accurately identify each crop type using only a single image from a single time period. Nevertheless, the constructed time-series remote sensing images incorporated time features in addition to the image’s spectral characteristics. This can eliminate the problems associated with single-period images and make crop classification more accurate.
In order to further investigate the separability of each crop under the time-series curve and determine the best classification vegetation index for crops, this paper calculates the separability of each sample under different vegetation indices using Euclidean distance (ED), which can reduce the computational burden and improve the classification efficiency while discarding redundant features. Euclidean distance is a commonly used definition of distance, referring to the true distance between two points in an m-dimensional space, or the natural length of a vector. In classification research, it is frequently necessary to calculate the similarity measure between different samples, and Euclidean distance is one of the most prevalent methods to accomplish this. The formula for the calculation is as follows:
ρ = ( x 2 x 1 ) 2 + ( y 2 y 1 ) 2
where ρ is the euclidean distance between points (x1, y1) and (x2, y2).
The results of calculating the average Euclidean distance between crop types under various vegetation indices are presented in Table 2. According to the table, the Euclidean distance between cotton and cocozelle, spring wheat, and corn in the SRI vegetation index was 36.275, 34.428, and 38.891, and the Euclidean distance between cocozelle and spring wheat, and corn was 58.453 and 32.778, and the Euclidean distance between spring wheat and corn was 42.471. Therefore, the Euclidean distance between each crop type was more significant than that of other land use types, which was also significantly different from other vegetation indices. So, the SRI index can be chosen as the best feature to build UAV time-series remote sensing images to improve the effect of classification.

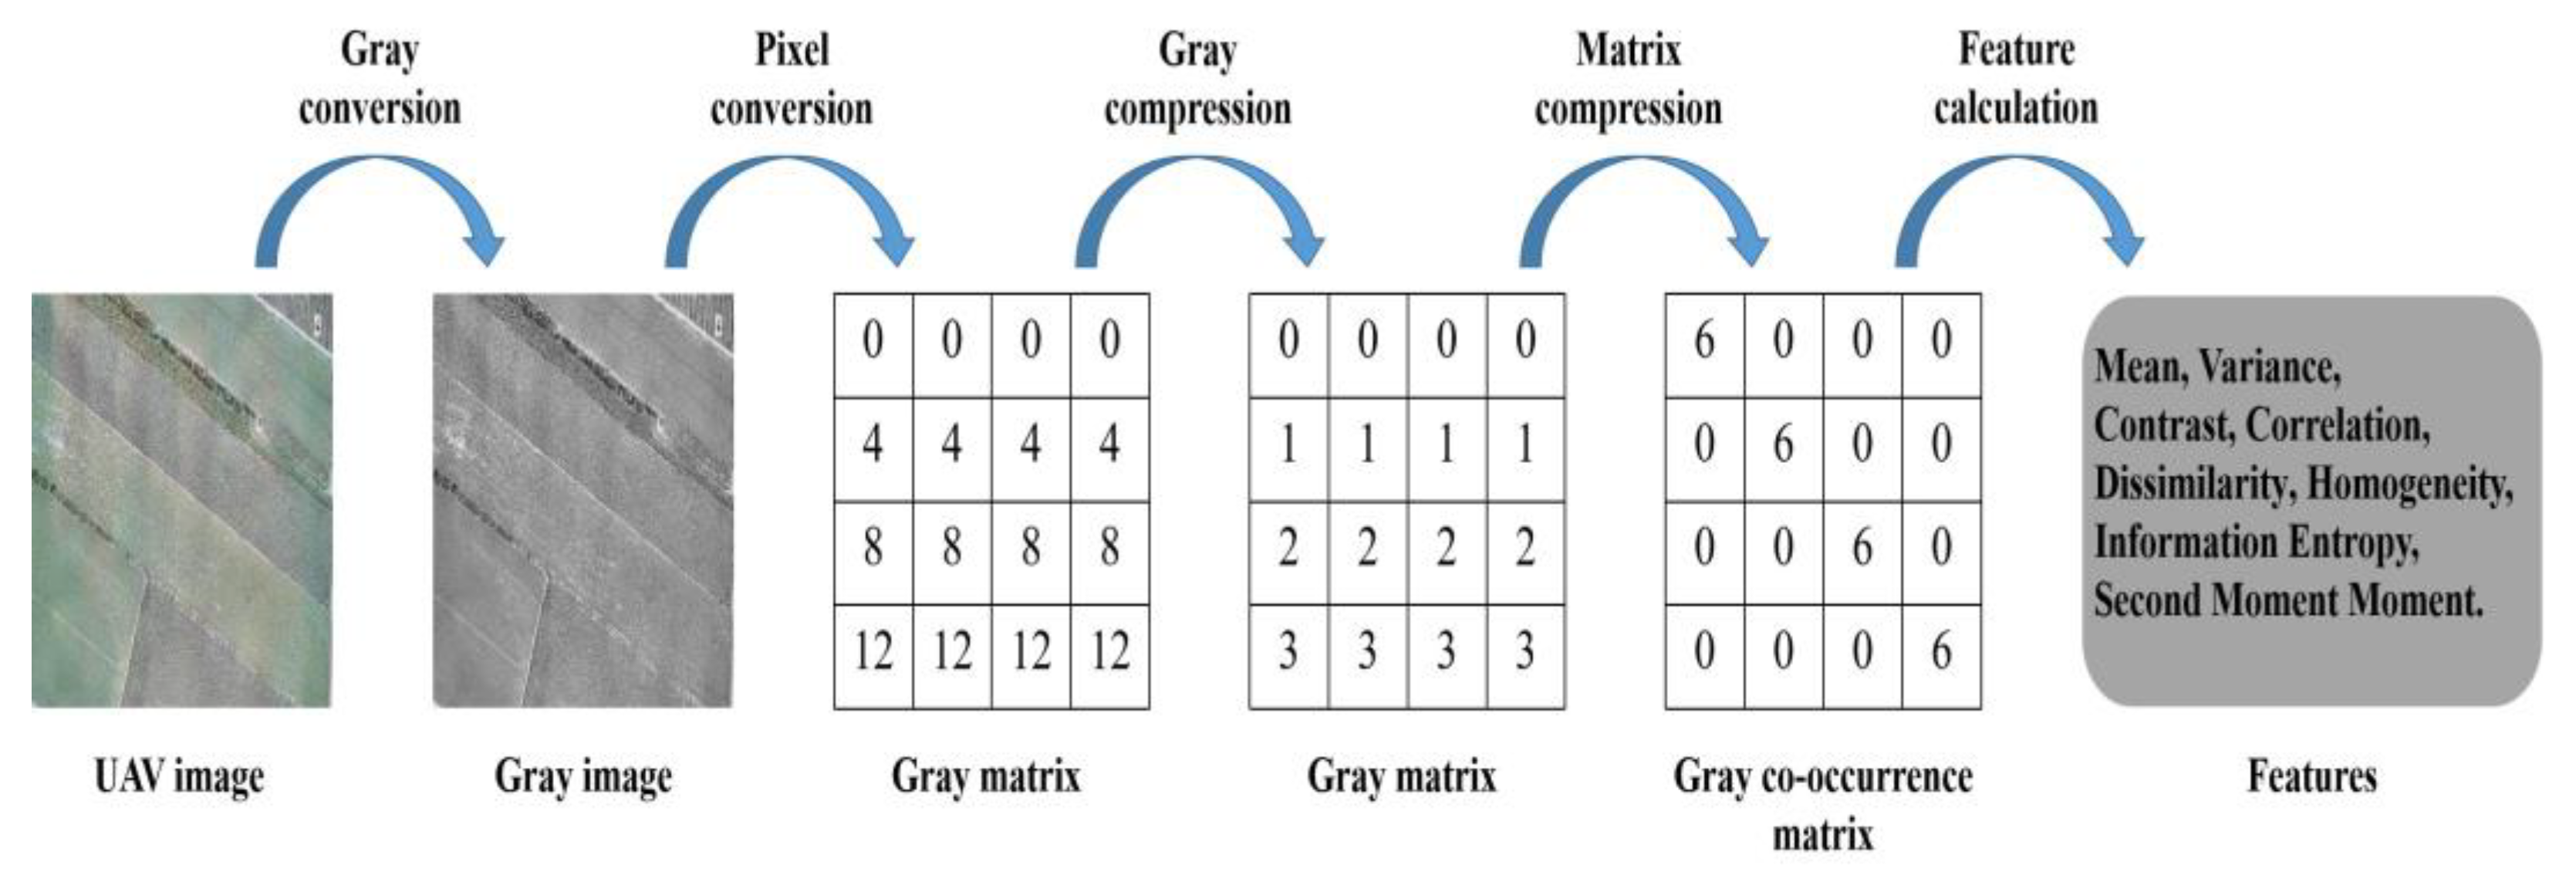
3.2. Multi-Feature Space Fusion

Experts have explored classification methods that comprehensively apply various features of remote sensing images, including spectral features, texture features, shape features, context information, and other features, thereby significantly enhancing the classification accuracy as the number of types of remote sensing images increases and the spatial resolution continues to improve [34,35]. To maximize the benefits of the high resolution of UAV remote sensing images, this paper obtained crop spectral and texture features to construct a multi-feature space and improve classification accuracy. The pixel-level classification was performed using the ENVI software, and the texture features were obtained using co-occurrence measures. Co-occurrence measures uses a gray spatial correlation matrix to calculate the texture value, which is a relative frequency matrix. The matrix shows the number of occurrences of relations between an image element and its specific neighborhood. The object-oriented classification was performed using eCognition software, and the gray-level co-occurrence matrix (GLCM) was used to extract the texture features. Gray co-occurrence matrix refers to a common method to describe texture by studying the spatial correlation characteristics of gray. Mean, variance, homogeneity, contrast, dissimilarity, information entropy, second moment, and correlation are all included. The feature extraction process is shown in Figure 7.

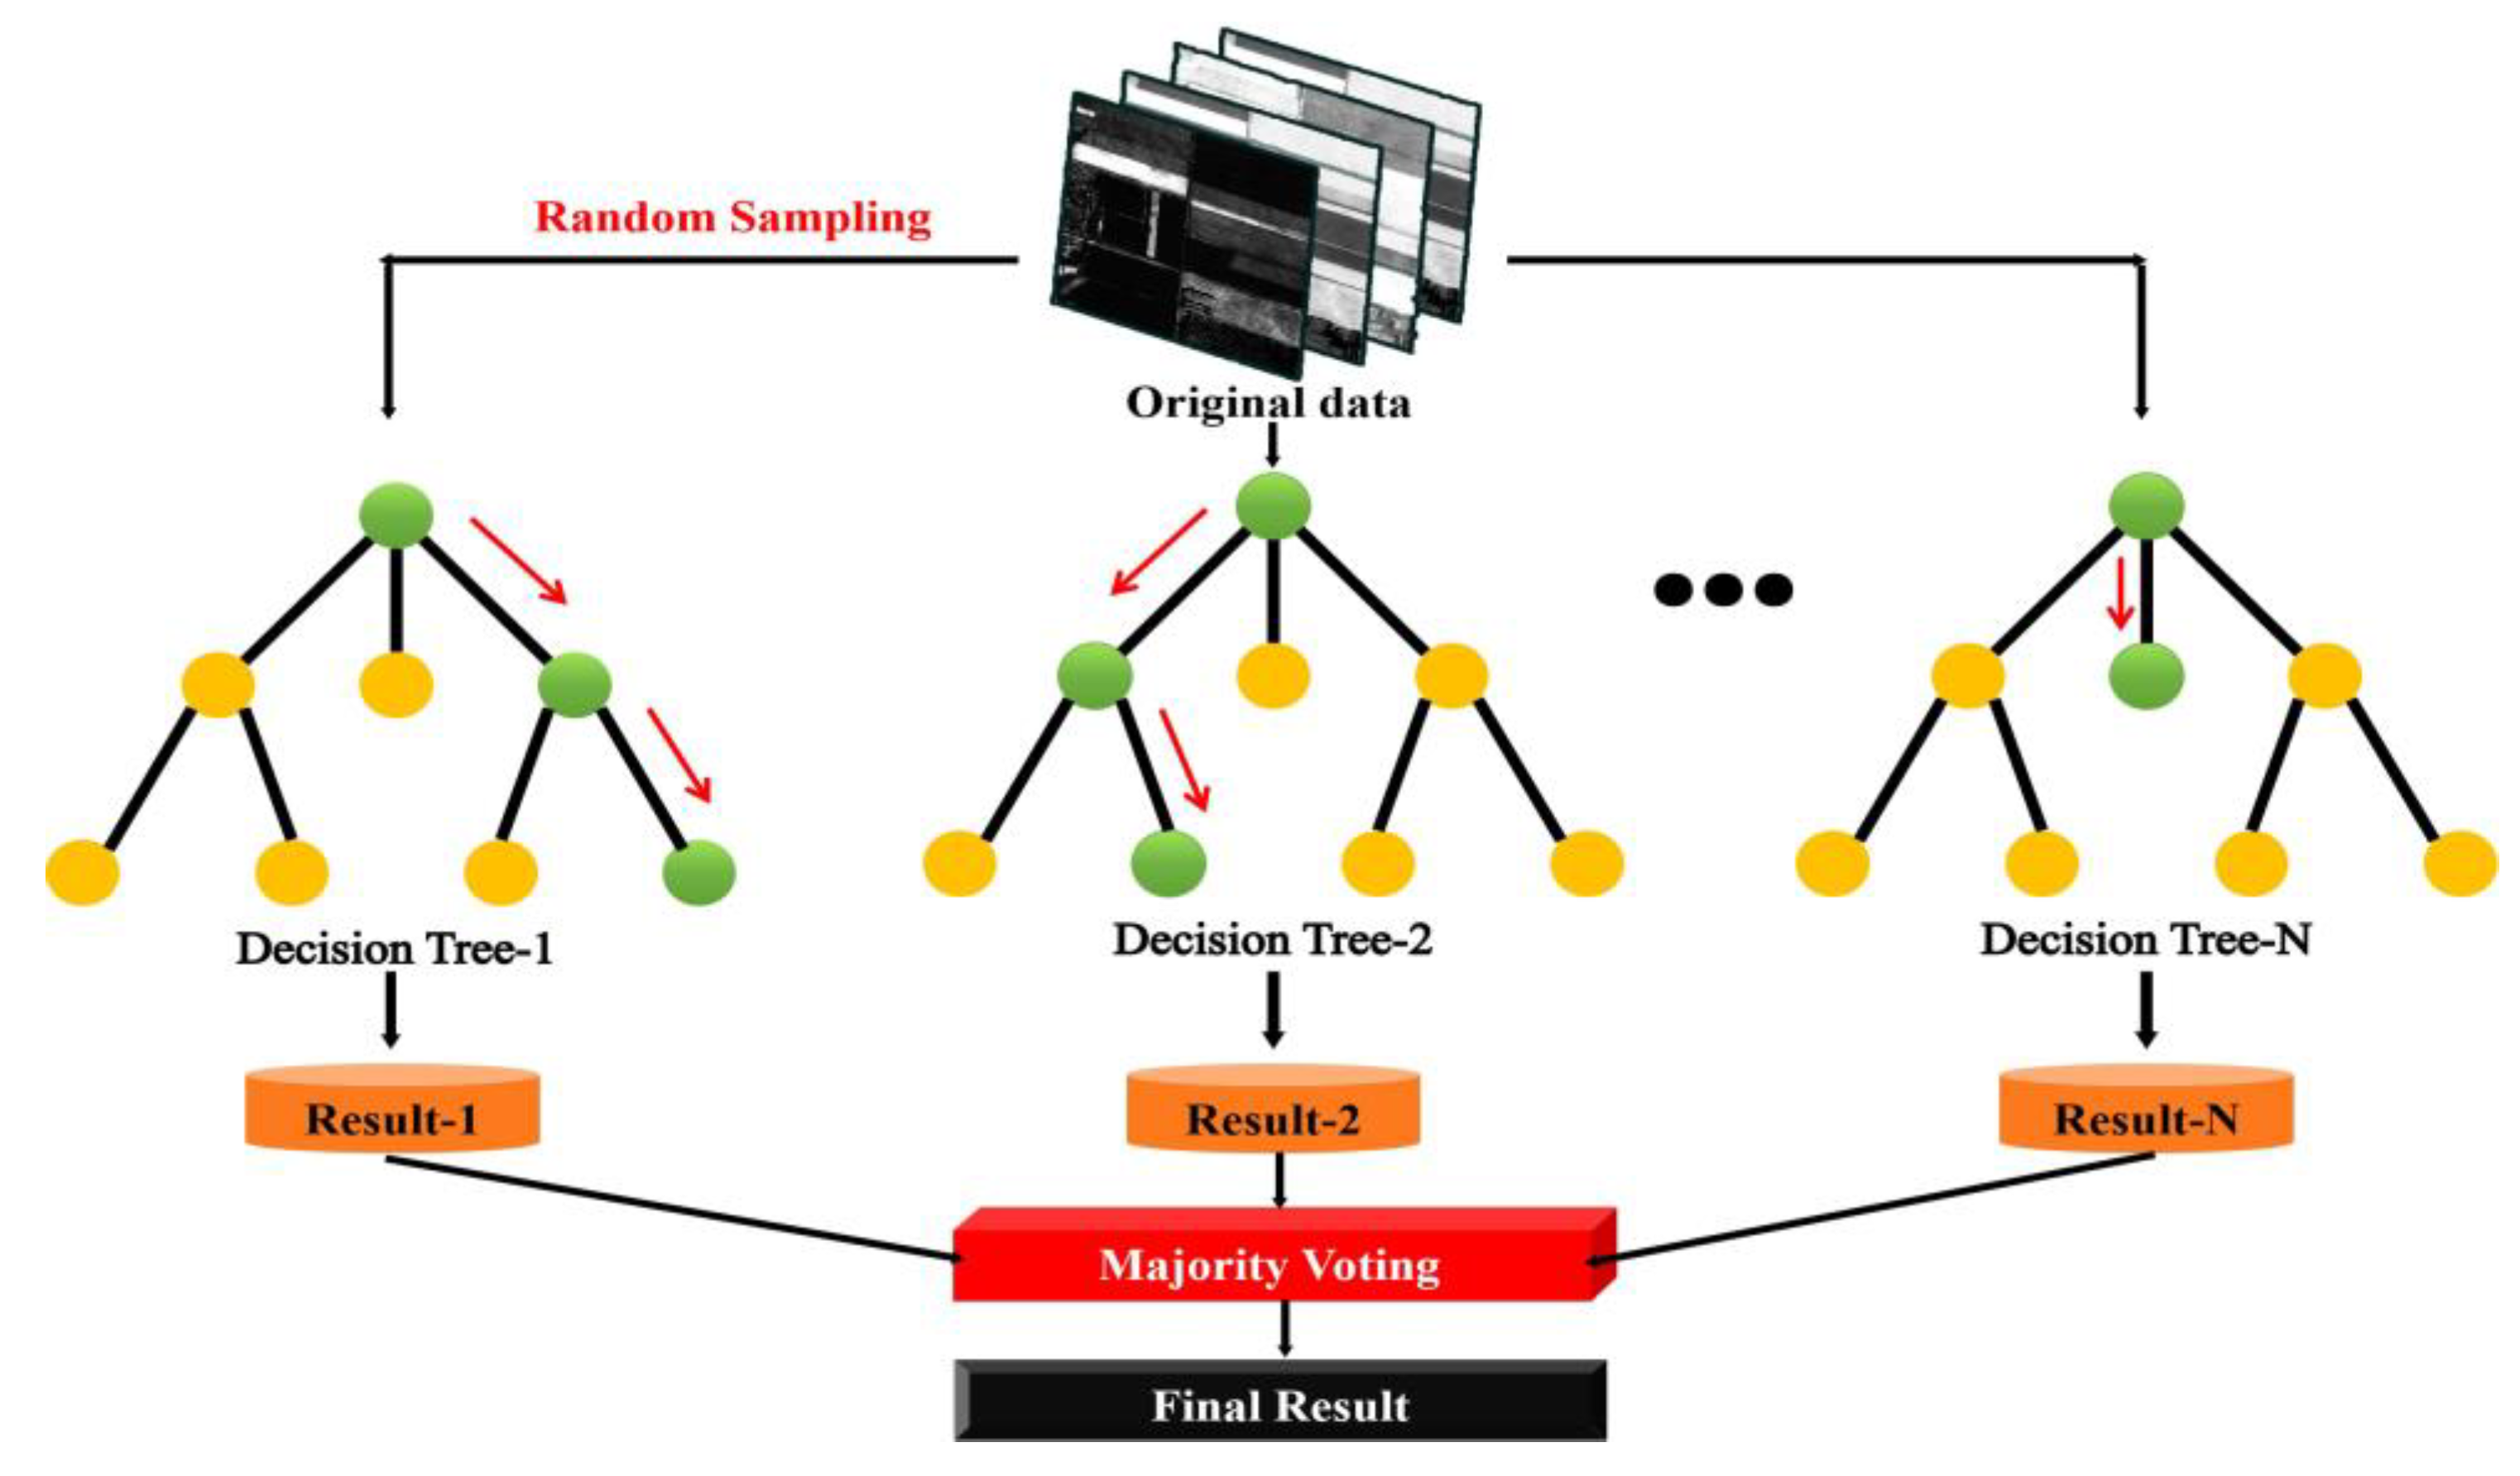
3.3. Remote Sensing Classification Method

Random forest (RF), support vector machine (SVM), classification and regression tree (CART), maximum likelihood (ML), K-nearest neighbor (KNN), and decision tree (DT) are the primary classification algorithms discussed in this paper. The RF classifier is a machine learning algorithm that combines many tree classifiers. The classification process of random forest algorithm is shown in Figure 8. To classify an input vector, each tree classifier generates a unit vote for the most common class in the tree. RF, which is one of the most applied machine learning algorithms in classification studies with different types of data, increases the accuracy of the classification by creating more than one decision tree [36,37]. In object-oriented image analysis, multi-scale segmentation is a particularly crucial step, and the final quality and precision of a remote sensing image are directly influenced by the selection of scale parameters [38]. In this research, image segmentation was performed using eCognition software. Before segmentation, it was necessary to set parameters including segmentation scale, layer weight, shape heterogeneity weight, and compactness heterogeneity weight. In this study, all layer weights were set to 1. The step size for shape and compactness were set to 0.1, and for multiple segmentation tests, all values between 0.1 and 0.9 were used. Finally, the ideal shape and compactness values were 0.2 and 0.6, respectively. The ESP algorithm was utilized to identify the optimal segmentation scale. Unlike multiscale and checkerboard segmentation methods, the ESP algorithm can calculate the local variance of image object homogeneity under different segmentation scale parameters. ROC-LV (rates of change of LV) automatically identifies the optimal segmentation parameter, which significantly enhances classification efficiency and precision. In conclusion, the best segmentation scale in this study was determined to be 50.

3.4. Evaluation Index of Classification Results

The confusion matrix was used to evaluate the accuracy of the final crop classification, which utilized the overall accuracy (OA), kappa coefficient, user’s accuracy (UA), producer’s accuracy (PA), commission error (CE), and omission error (OE) to reflect the image classification results from different perspectives. It is currently one of the most utilized evaluation methods. Overall accuracy is the proportion of correctly classified class pixels in relation to the total number of pixels. The following is the formula:
OA = 1 N   i = 1 r x ii
where OA is the overall classification accuracy, N is the total number of samples, r is the total number of classification categories, i is the number of correctly classified samples of class i ground objects, and xii is the value on the main diagonal.
The kappa coefficient is used to evaluate the consistency of user and producer accuracy to characterize classification accuracy’s dependability. The specific formula is as follows:
Kappa = N   i = 1 r x ii   i = 1 r ( x i + ×   x + i ) N 2   i = 1 r ( x i + ×   x + i )
where xi+ and x+i are, respectively, the ith column and the ith row.
The producer’s accuracy represents the probability that the ground truth reference data of a certain category will be correctly divided. The specific formula is as follows:
PA = x ii   i = 1 r x ik
where xik represents the composition of the ith row.
The user’s accuracy refers to the conditional probability that a random sample is taken from the classification result and its type is the same as the actual type on the ground. The specific formula is as follows:
UA = x ii   i = 1 r x ki
where xki represents the composition of the ith column.

4. Results

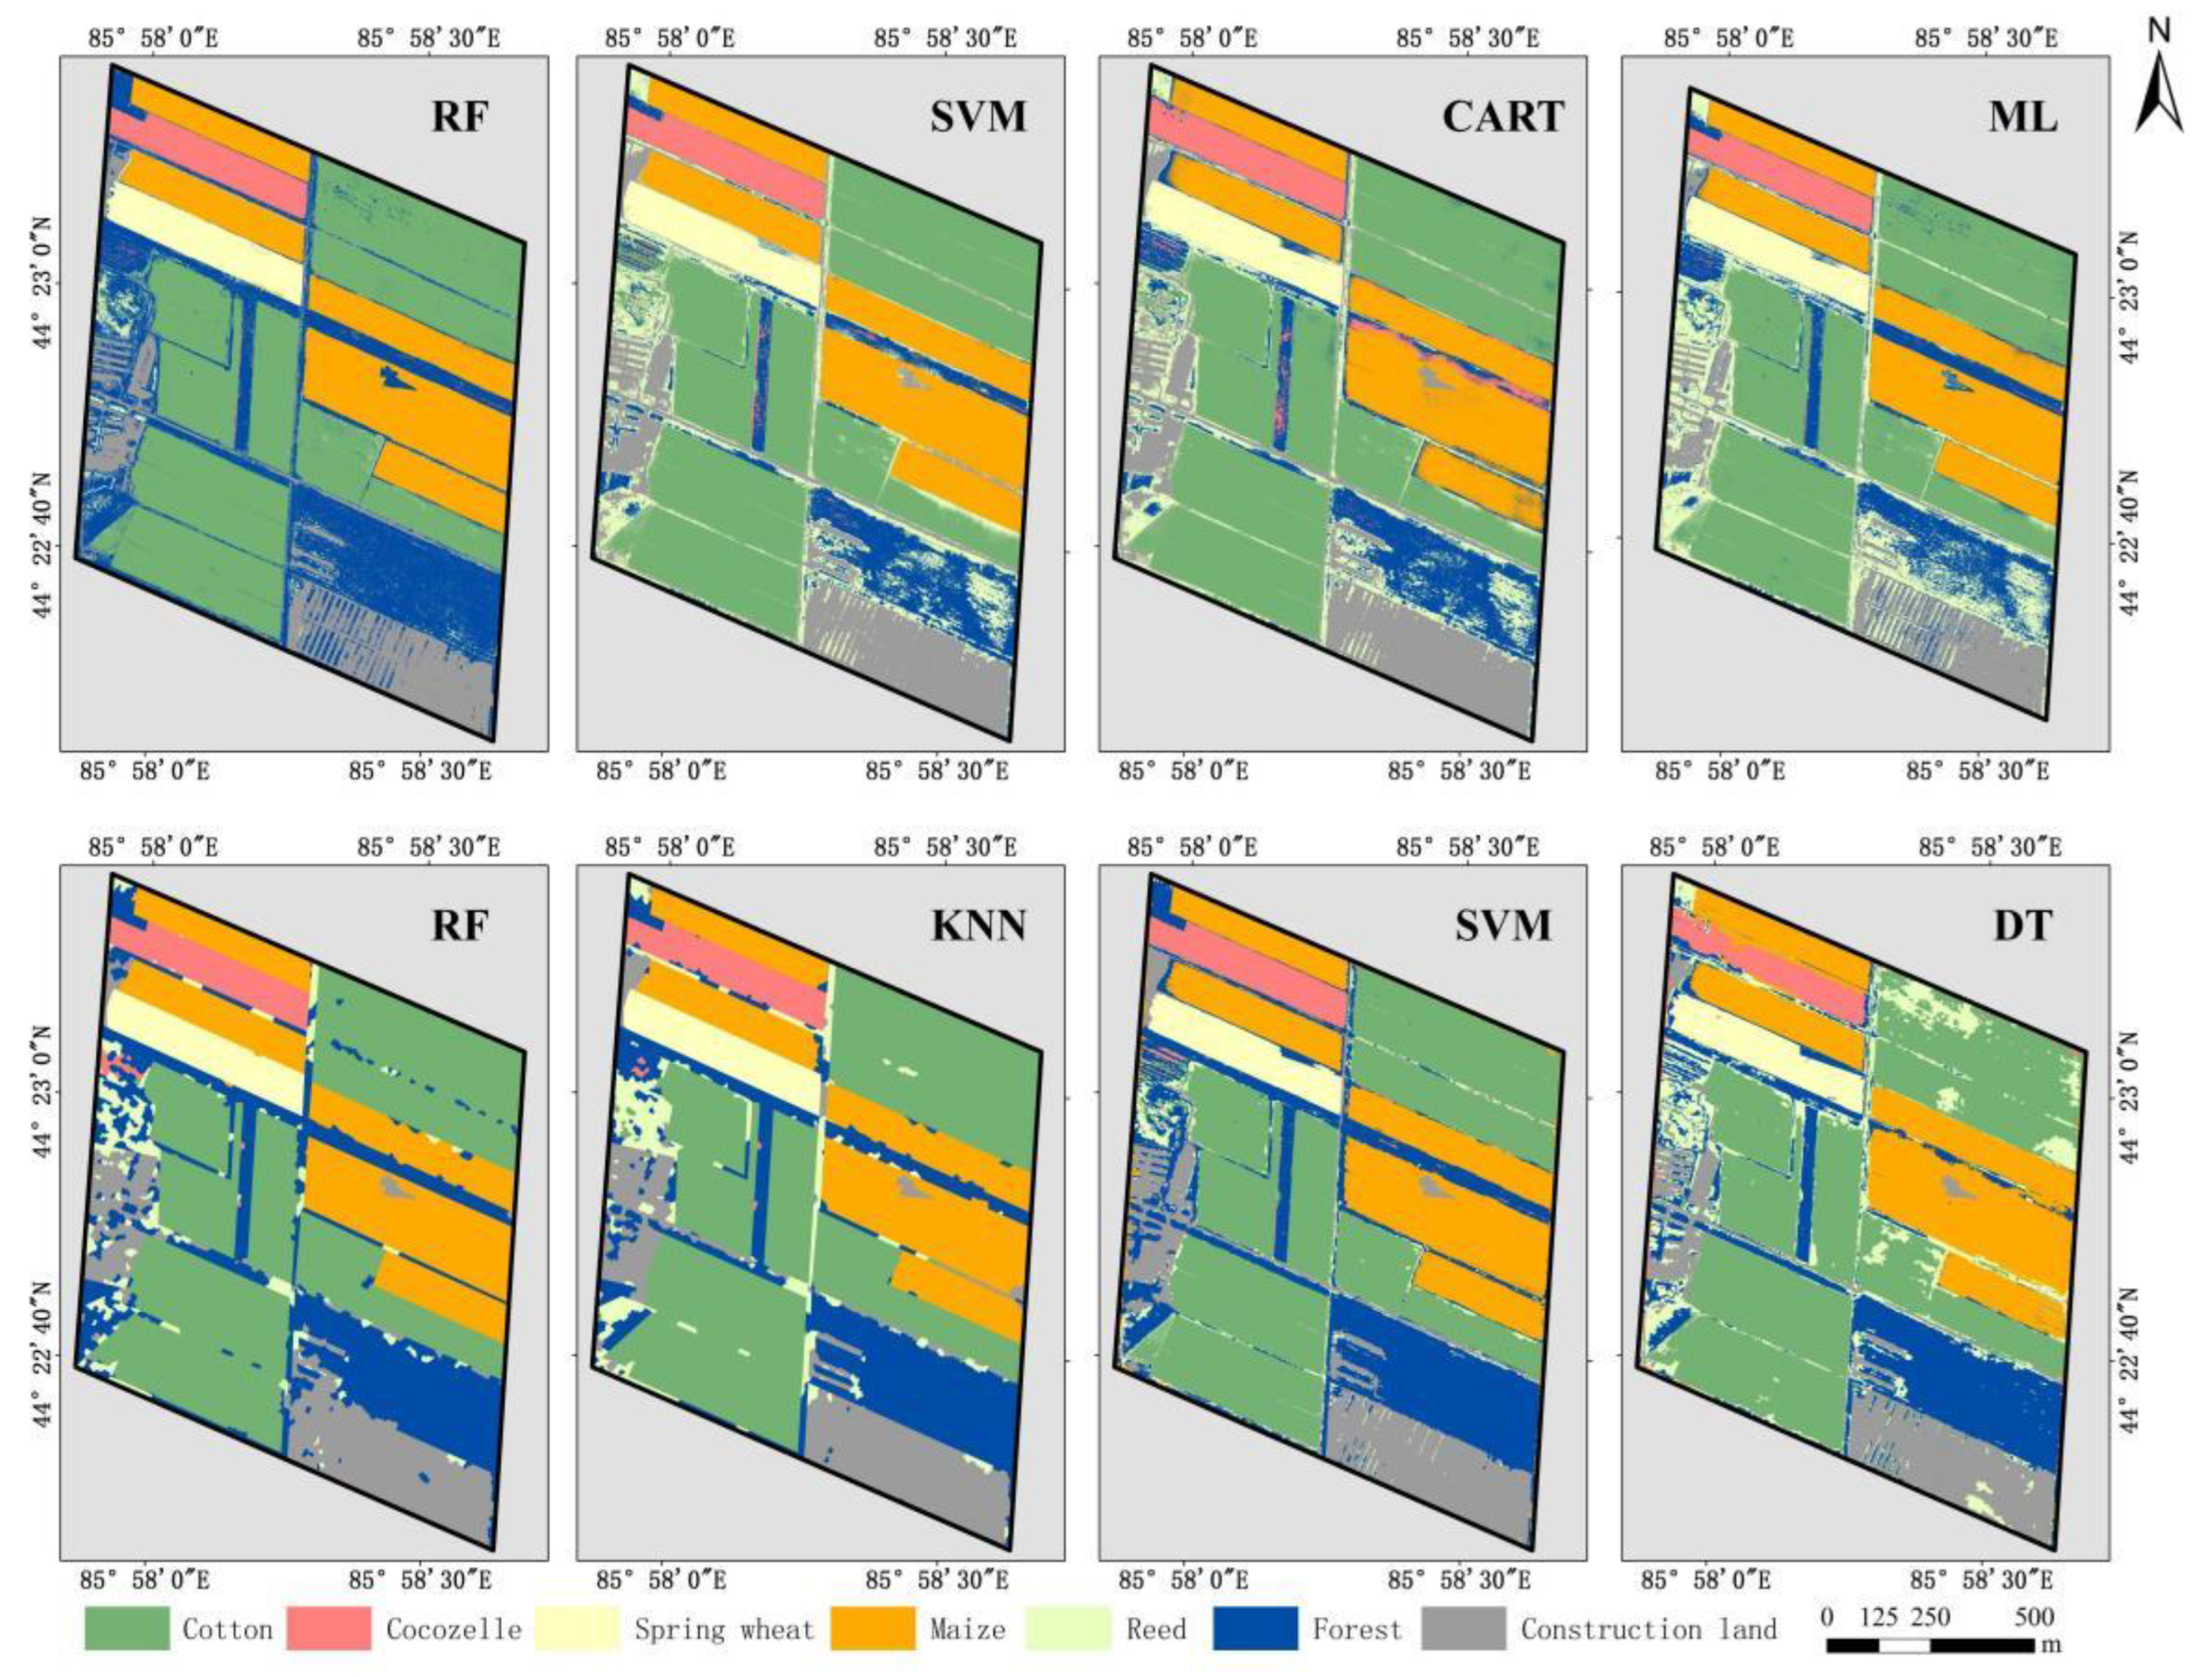
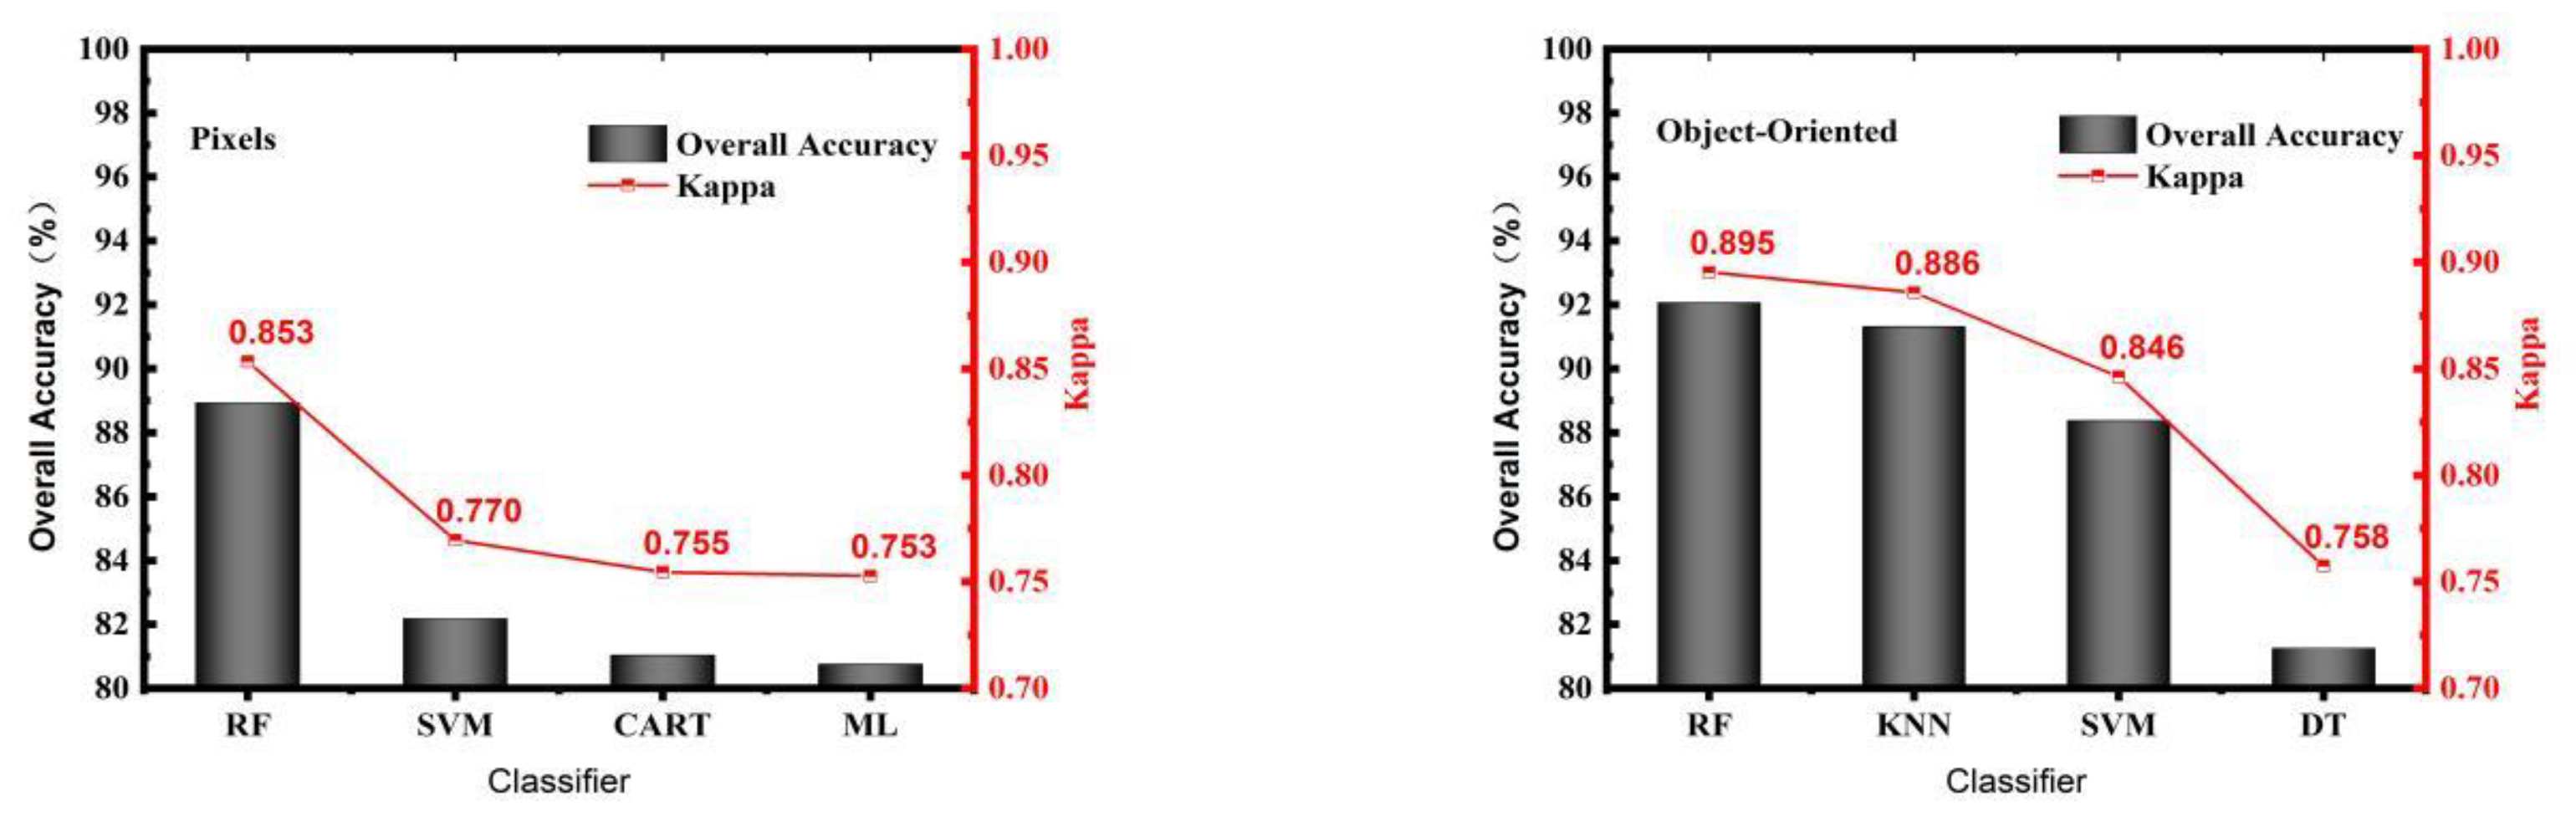
4.1. Comparison and Accuracy Evaluation of Different Classification Methods

Figure 9 depicts the crop classification results of different classification methods based on time-series remote sensing images and Figure 10 depicts the accuracy evaluation of various classification methods. From the perspective of overall accuracy and kappa coefficient analysis, the overall classification accuracy of RF, SVM, CART, and ML in pixel-based remote sensing crop classification was 88.94%, 82.19%, 81.04%, and 80.76%, respectively, which are all greater than 80%. The kappa coefficients were greater than 0.75 (0.8534, 0.7696, 0.7546, and 0.7528, respectively). Consequently, RF achieved the best classification results for pixel-based crop classification, with higher classification accuracy and greater stability. In comparison to the SVM, CART, and ML algorithms, the overall classification accuracy increased by 6.75%, 7.9%, and 8.18%, respectively. The kappa coefficient increased by 0.0838, 0.0988, and 0.1006, respectively. From the perspective of overall accuracy and Kappa coefficient analysis, the overall classification accuracy of RF, KNN, SVM, and DT in the object-oriented remote sensing classification of crops was 92.07%, 91.32%, 88.38%, and 81.26%, respectively, which are all greater than 80%. The coefficients of kappa were 0.8953, 0.8858, 0.8463, and 0.7575, which were all greater than 0.75.
In conclusion, RF also achieved the best classification effect in the results for object-oriented crop classification. Compared with the KNN, SVM, and DT algorithms, the overall accuracy was improved by 0.75%, 3.69%, and 10.81%, and the kappa coefficient was improved by 0.0095, 0.049, and 0.1378, respectively. In comparison to the results of pixel-based crop classification, the overall classification accuracy and kappa coefficient of RF were improved by 3.13% and 0.0419, respectively, indicating that the object-oriented classification method is more suitable for crop remote sensing image classification. Figure 8 also reveals that the results of pixel-based crop classification are frequently affected by a phenomenon involving mixed pixels, which reduces the accuracy of crop classification. Based on the results of object-oriented classification, the edges of plots are clearer and match the actual planting space for crops, making it easier to meet actual application needs. Meanwhile, compared with object-oriented single feature classification, constructing multi-feature space is also one of the effective methods to improve the accuracy of crop classification. The overall accuracy and kappa coefficient were increased by 4.15% and 0.055, respectively.
To further investigate the effects of different algorithms on crop classification, the final accuracy was evaluated from the standpoints of producer’s accuracy, user’s accuracy, commission error, and omission error for various crop types. Table 3 shows the accuracy evaluation of crop results based on different object-oriented classification methods. It can be seen from the classification results based on RF that cocozelle achieved the highest producer’s accuracy (99.58%) and the lowest omission error (0.42%), and spring wheat achieved the highest user’s accuracy (99.96%) and the lowest commission error (0.04%). In the classification results based on KNN, cotton achieved the highest producer’s accuracy (99.42%) and the lowest omission error (0.58%), and corn achieved the highest user’s accuracy (99.59%) and the lowest commission error (0.41%). In the classification results based on SVM, cotton achieved the highest producer’s accuracy (95.13%) and the lowest omission error (4.87%), and spring wheat achieved the highest user’s accuracy (98.69%) and the lowest commission error (1.31%). In the classification results based on DT, maize achieved the highest producer’s accuracy (91.47%) and the lowest omission error (8.53%), and cotton achieved the highest user’s accuracy (95.87%) and the lowest commission error (4.13%). From the perspective of the single crop type, RF had the highest producer and user accuracy for maize. KNN had the highest producer accuracy for spring wheat and cotton, while RF had the highest user accuracy. For cocozelle, the producer’s accuracy of RF was the highest, and the user’s accuracy of KNN was the highest. Therefore, whether based on pixel or object-oriented classification, RF achieved an excellent classification effect in crop remote sensing image classification and had high classification accuracy and stability for different crop types.

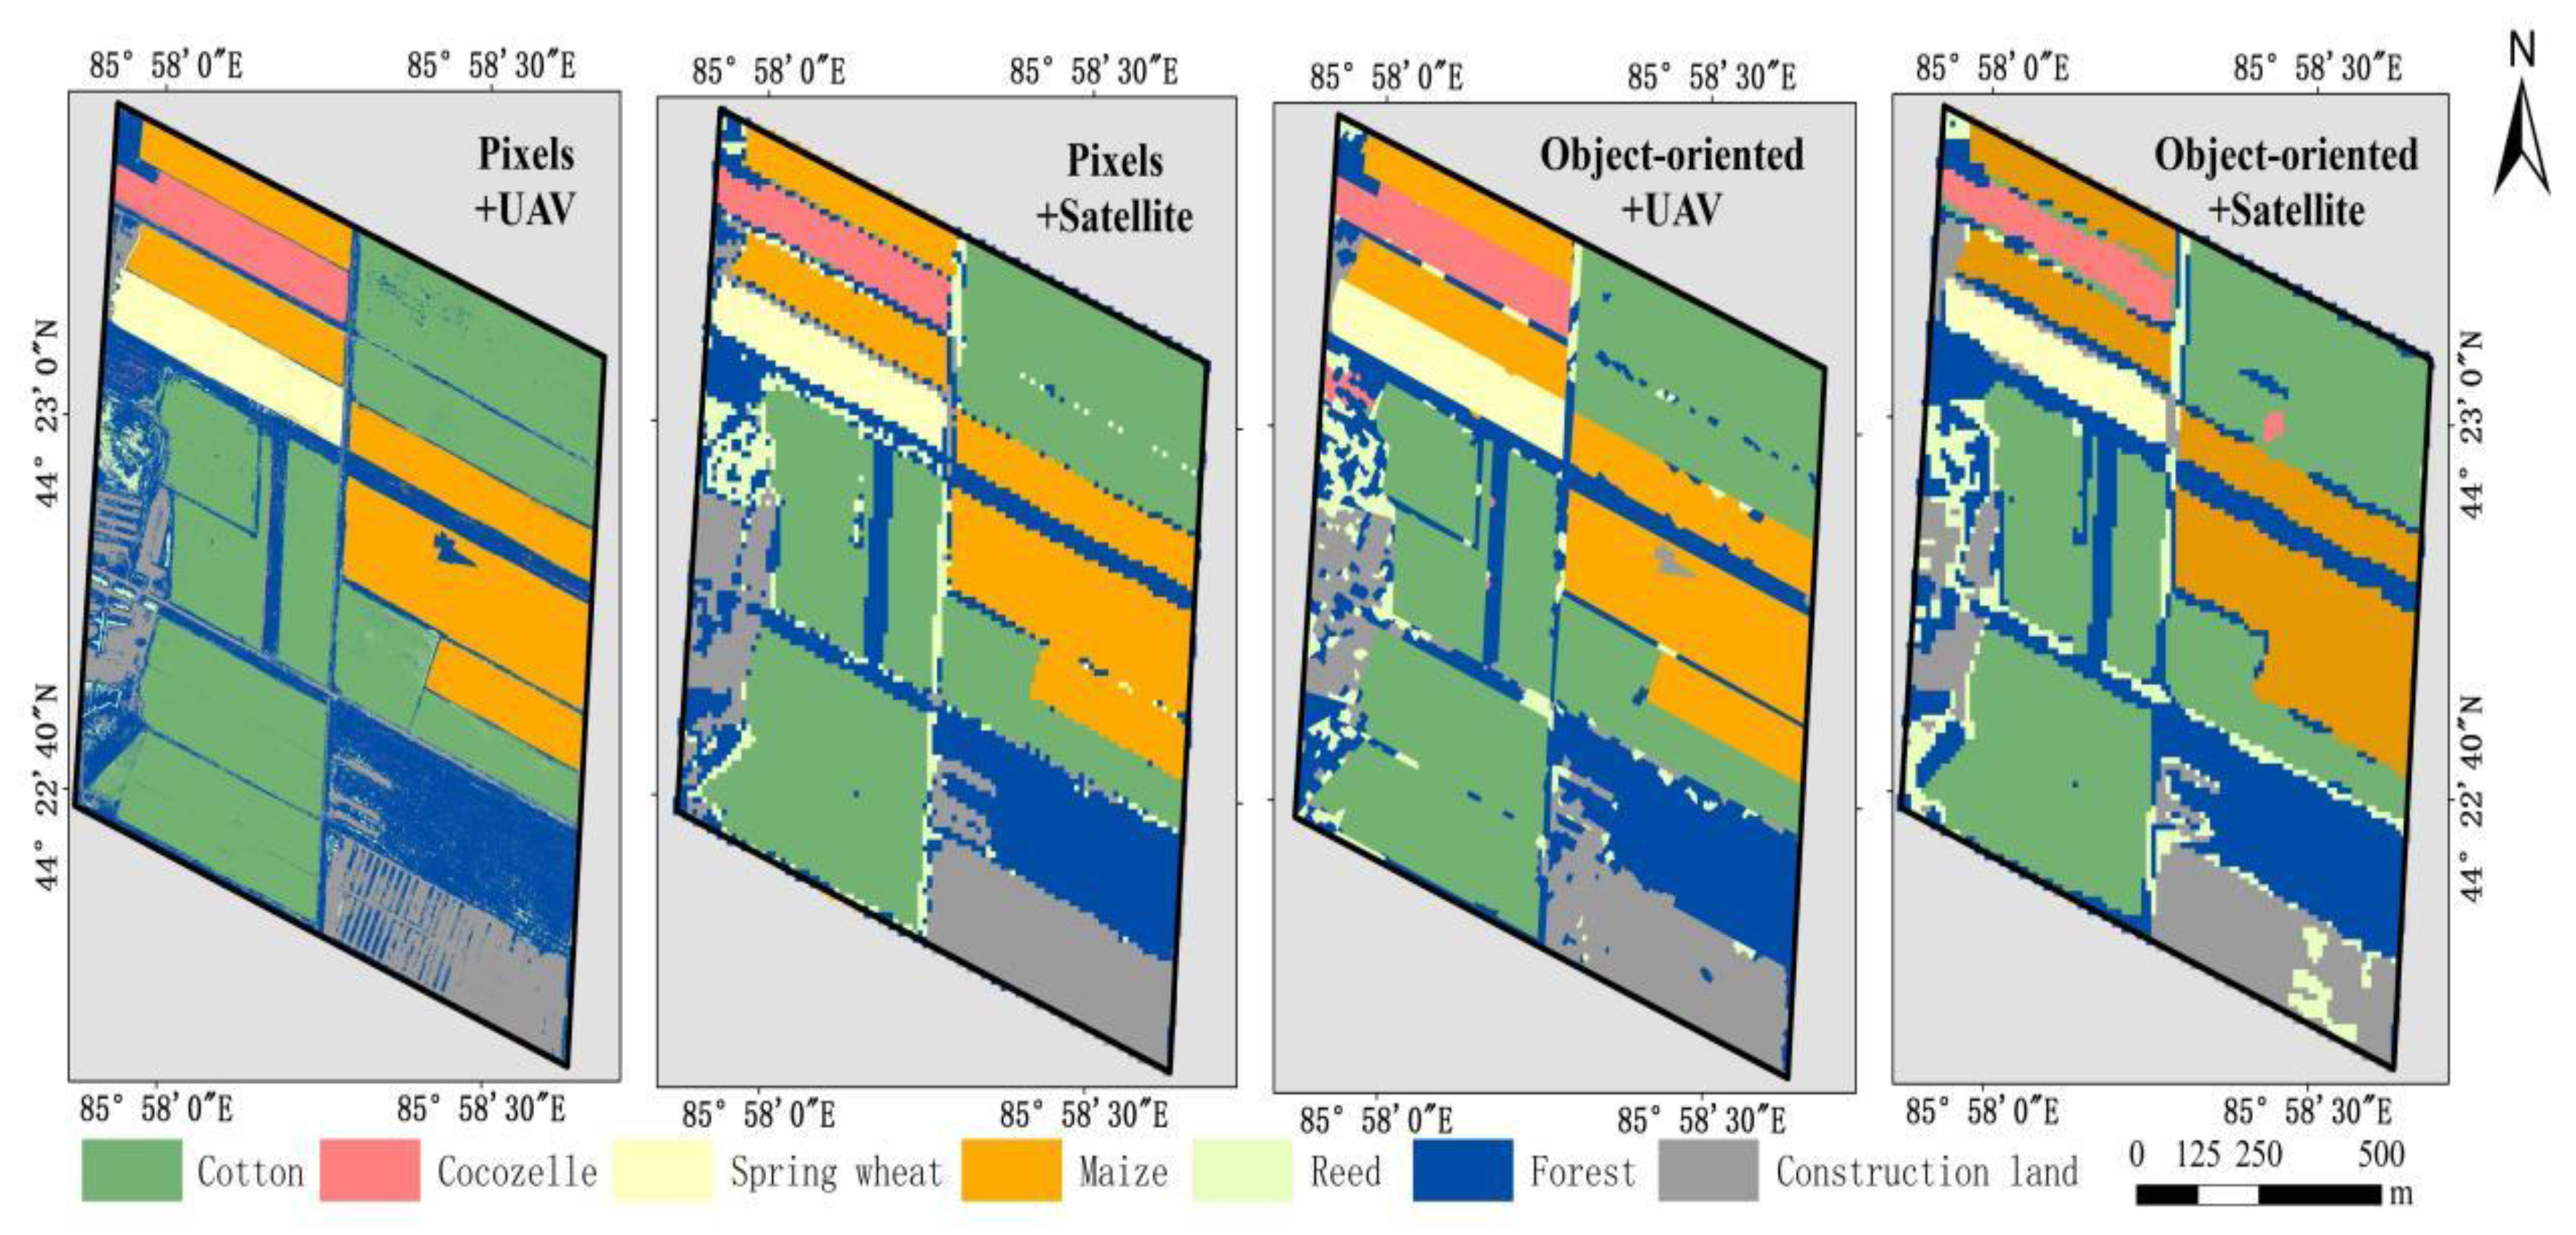
4.2. Comparison and Accuracy Evaluation of Different Image Types

This paper aims to further explore the advantages of UAV image and object-oriented methods in crop remote sensing classification. The UAV and satellite remote sensing images were compared and analyzed, and the random forest algorithm was used to classify crops for the same sample in the same research area. Crop classification results of different remote sensing images and different classification methods are shown in Figure 11, and local classification details are shown in Figure 12. Compared to the UAV remote sensing image, the crop classification results based on the satellite remote sensing image may have significant errors in the calculation of crop planting area, which is not good for investigational and statistical work.
Figure 13 depicts the precision evaluation of crop classification results with different image types and different classification methods. The overall accuracy and kappa coefficiency of crop classification using UAV remote sensing images was 88.94% and 0.8534, respectively, according to the results of pixel-based classification. Compared to the classification results of satellite remote sensing images, the results were improved by 4.67% and 0.0602, respectively. According to the results of object-oriented classification, the overall accuracy and kappa coefficiency for crop classification using UAV remote sensing images were 92.07% and 0.8953, respectively. These results were better by 3.51% and 0.0458 compared to the classification results of satellite remote sensing images. Due to the high resolution of UAV images, the effect of using UAV remote sensing images for crop classification is better than that of using either pixel-based or object-based sentinel satellite remote sensing images. In addition, the classification results from sentinel satellite remote sensing images show that object-oriented images are more accurate overall and have a higher kappa coefficient than pixels by 4.29% and 0.0563, respectively. In both UAV remote sensing images and sentinel satellite remote sensing images, the effect of crop classification based on object orientation is better than that based on pixel, which further proves the above experimental results.

4.3. Comparison and Accuracy Evaluation with Different Time Resolution

In order to investigate the effect of time-series remote sensing images on classification accuracy, this paper classified crops in the study area using a random forest algorithm. It contrasts the classification outcomes of single-period and time-series remote sensing images. Table 4 shows the crop classification accuracy results of remote sensing images with different time resolutions. For the pixel-based method, the overall accuracy and kappa coefficient of the UAV remote sensing image using time series were improved by 32.21% and 0.4098, respectively, compared to that of a single period, while those of the satellite remote sensing image were improved by 29.55% and 0.3577, respectively. From an object-oriented perspective, the overall accuracy and kappa coefficient of UAV remote sensing images using time series were 26.65% and 0.3496 higher than those of a single period, respectively, whereas those of satellite remote sensing images were 25.75% and 0.3299 higher, respectively. Consequently, based on the pixel or object-oriented classification method, whether using satellite remote sensing images or UAV remote sensing images, remote sensing images of time series can effectively and significantly improve the classification accuracy of crops compared to a single period, producing a practical and precise classification method.

5. Discussion

Using time-series UAV remote sensing images, several advancements have been made in the research of high-precision crop classification in this paper. To lay the groundwork for future research, we need to dig deeper into a number of important parts of this study:
(1)
Based on the time-series UAV image, an object-oriented random forest algorithm was used to study crop classification, and good classification accuracy and stability were achieved. With the development of information technology, the method based on deep learning has achieved good results in image processing. Liu et al. [39] proposed a method of UAV land cover image segmentation based on deep learning. The accuracy and average intersection rate of the method were 95.06% and 81.22%, respectively. This experiment was based on the Pytorch open-source framework for model training, which requires constant debugging and parameter iteration, and requires a certain amount of time. In this study, an object-oriented random forest method was used for classification, which took 309 s. Under the condition of ensuring high precision, the classification efficiency was improved, which is conducive to practical application. Therefore, in future studies, we can explore the comparison and analysis between the deep learning algorithm and the algorithm in this study, so as to explore more accurate and efficient crop classification methods.
(2)
In this study, cotton, corn, cocozelle and spring wheat were classified for one year. In future studies, experimental work will be carried out for more crop types, regions and years to verify and improve the model algorithm. In order to improve the applicability of the model, we will further expand the classification area and explore the spatio-temporal variation factors affecting the classification accuracy.

6. Conclusions

Based on the time-series UAV remote sensing images and object-oriented random forest algorithm, an efficient and feasible crop classification algorithm was proposed in this study. Under the condition of ensuring high precision, the classification efficiency was improved, which is conducive to practical application. The main conclusions of the study are as follows:
(1)
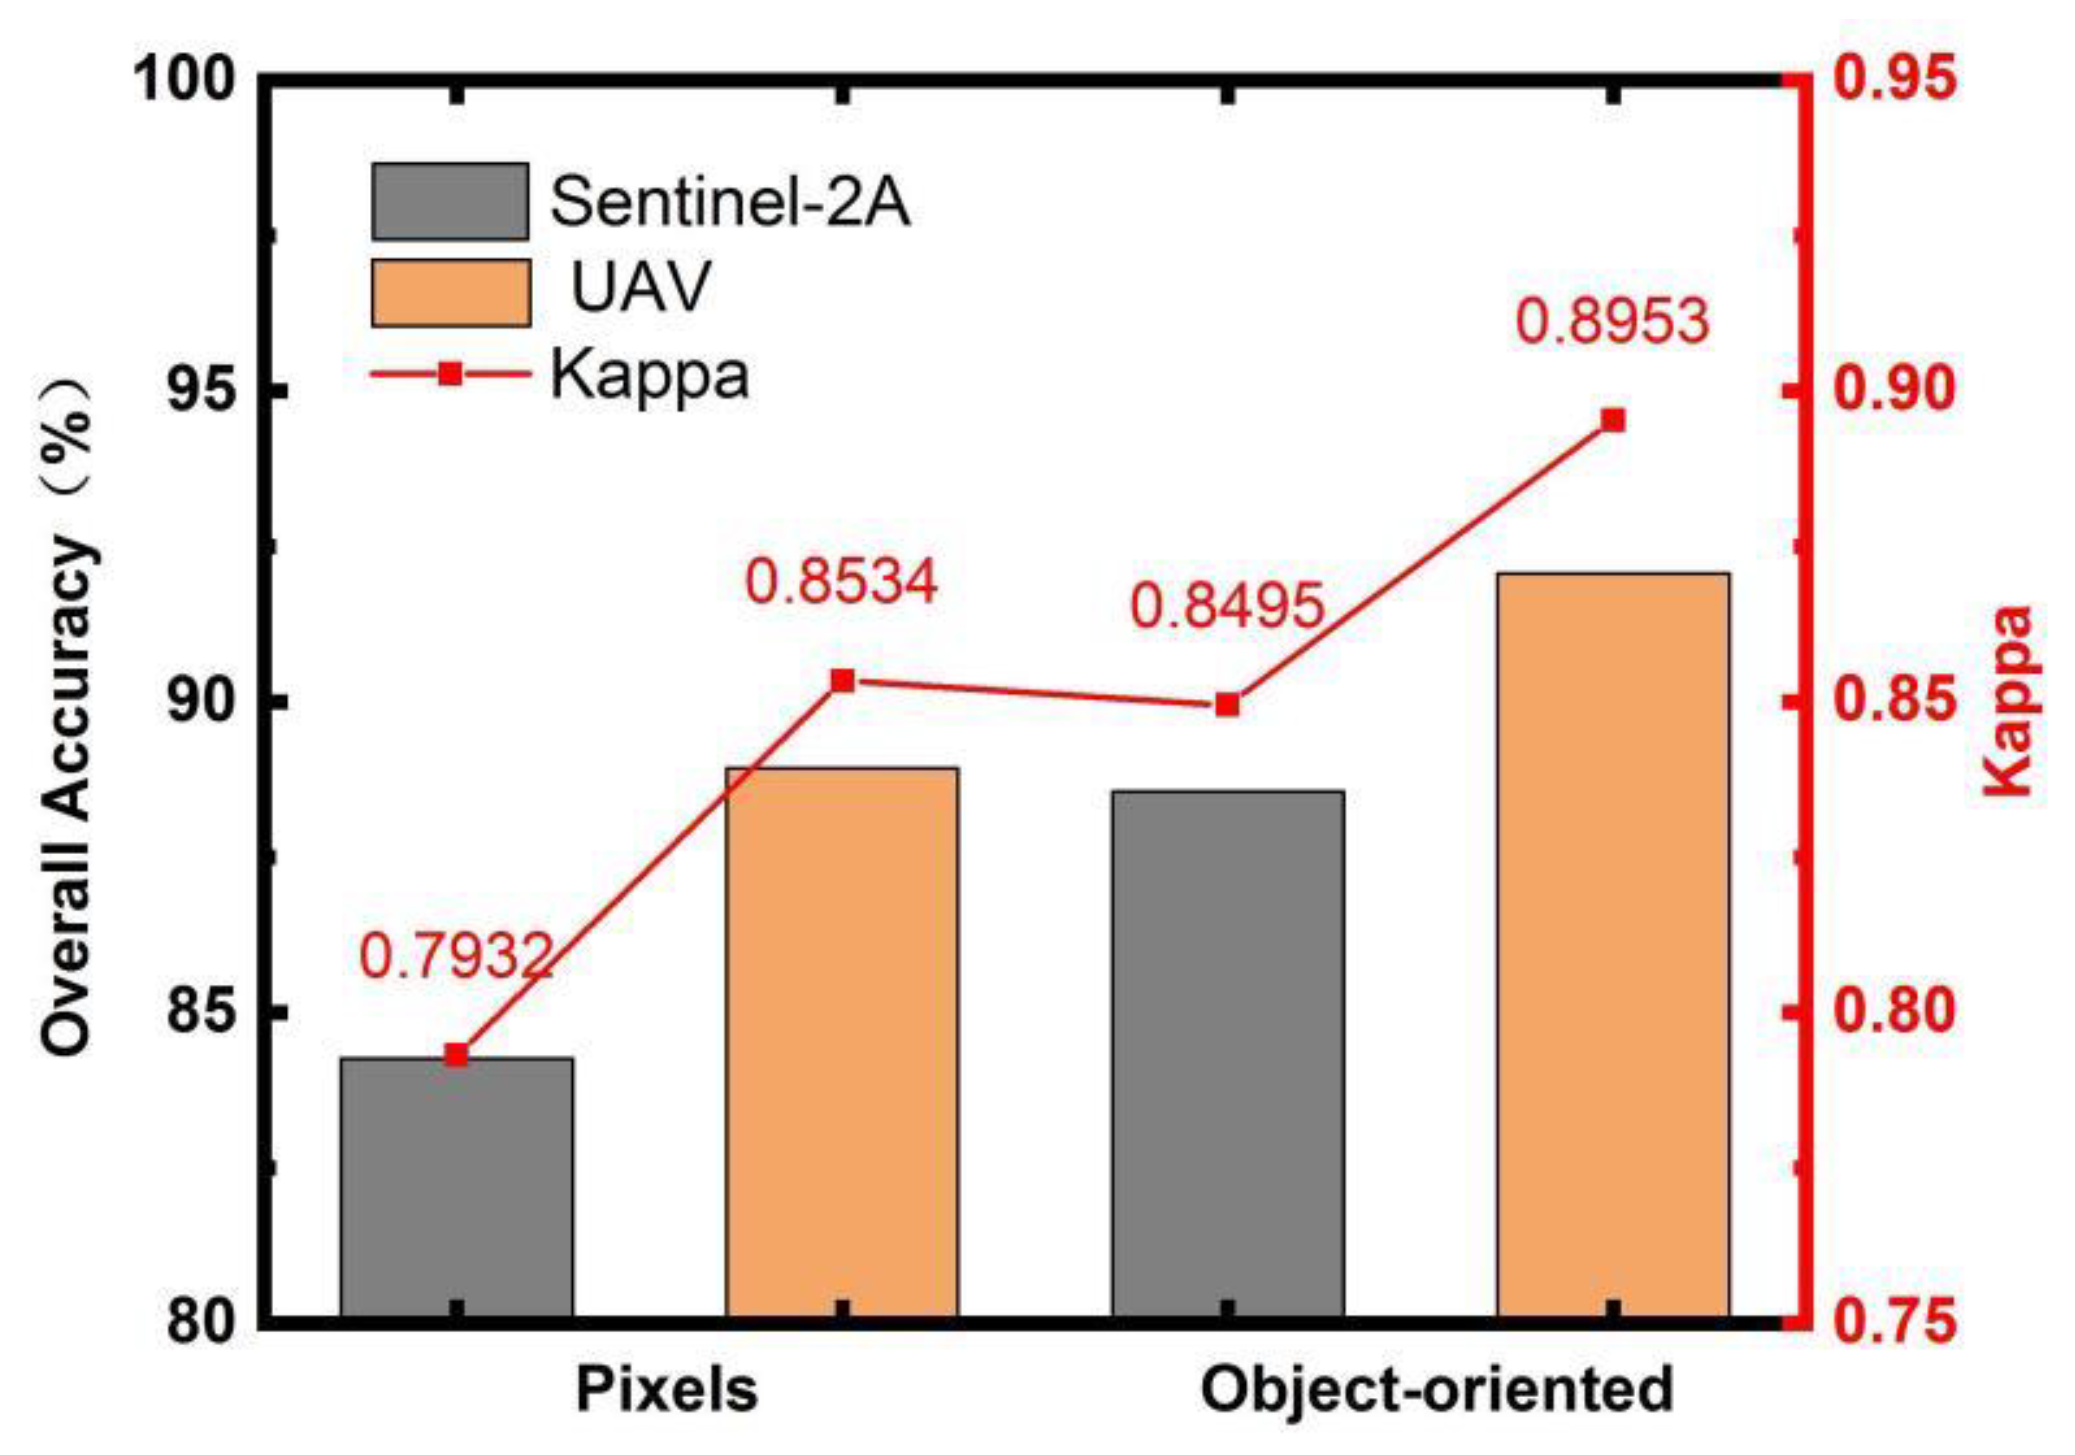
Time-series UAV images can considerably increase the accuracy of crop classification. The overall accuracy and kappa coefficient of crop classification using time-series UAV images increased by 26.65% and 0.3496, respectively, when compared to a single period. This effectively addressed the drawbacks of single period images and further improved the classification accuracy and efficiency of crops. The result of crop classification using a UAV image was superior to that of a sentinel satellite remote sensing image, and the overall accuracy was improved by 4.67% and 3.51%, respectively, for both pixel-based and object-oriented crop classification. This demonstrates the tremendous benefits of using UAV remote sensing images for crop classification.
(2)
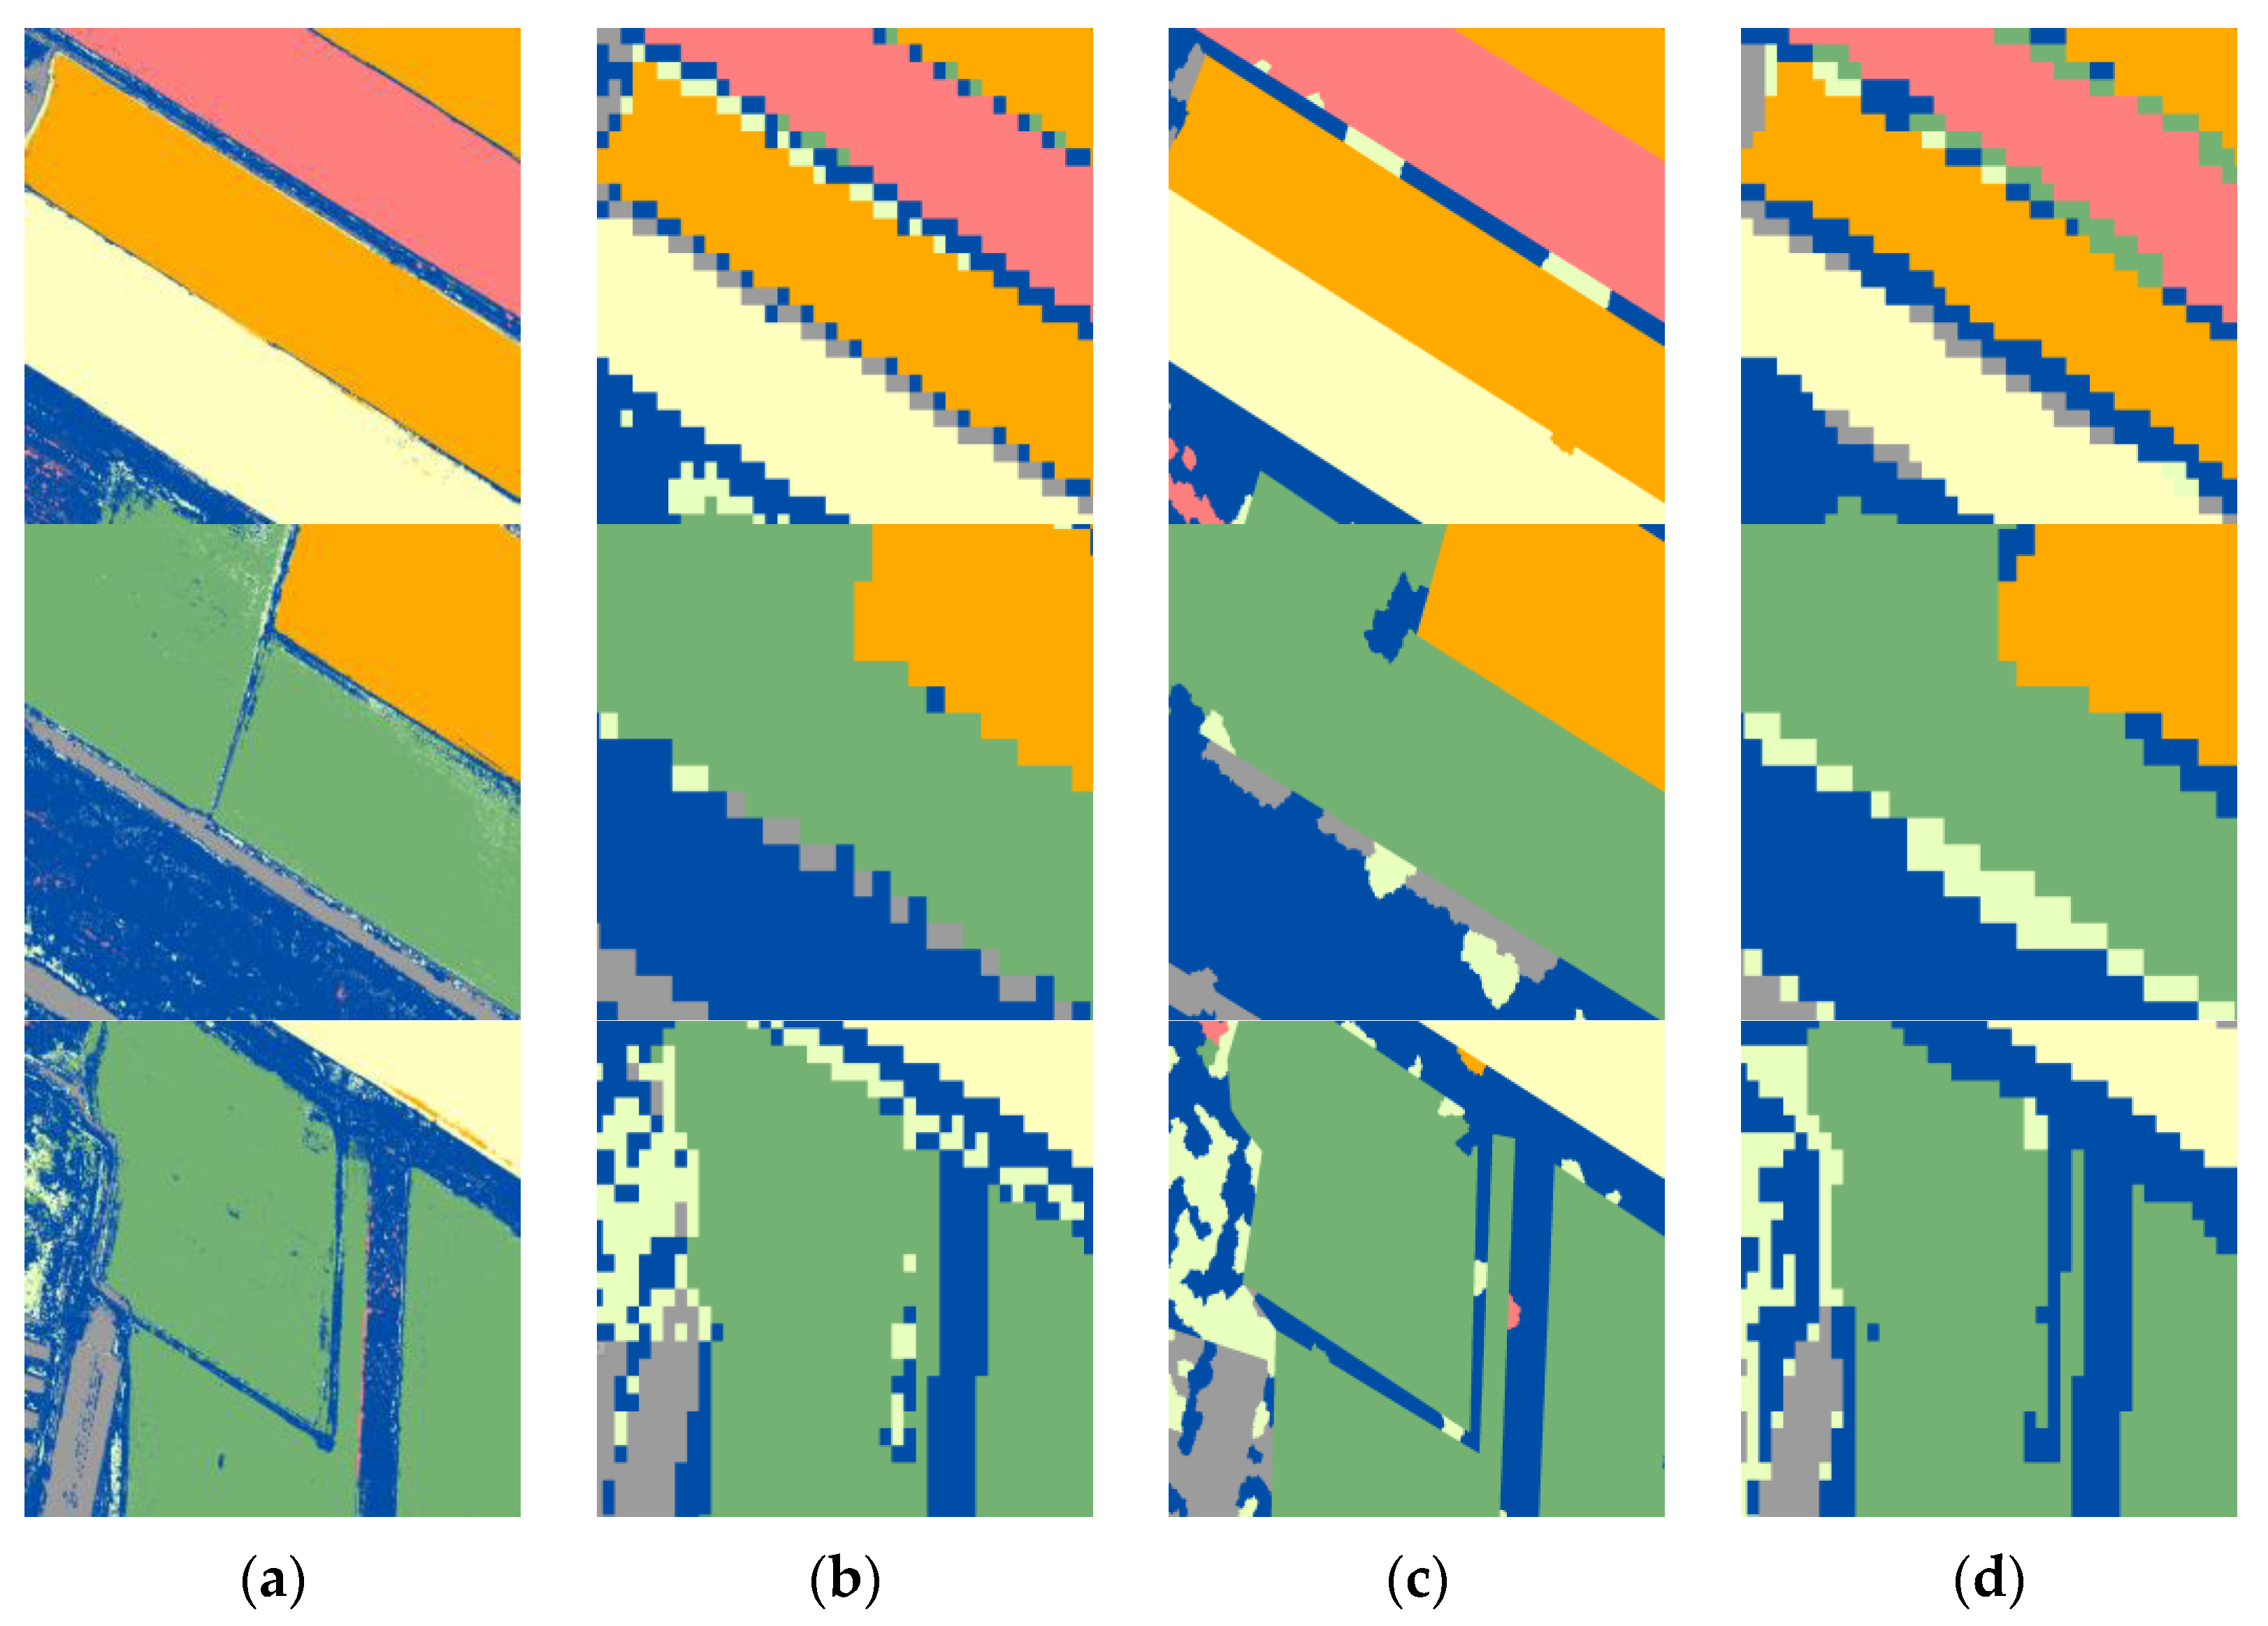
Crop classification based on object-oriented remote sensing images is a viable and feasible approach to classification. The crop classification results based on pixels frequently exhibited the phenomenon of “mixed pixels”, whereas the plot boundary based on object-oriented classification results was more pronounced, which is more consistent with the actual planting structure space of crops. Compared to pixel-based classification results, the overall accuracy and kappa coefficient of object-oriented classification for time-series UAV remote sensing images were increased by 3.13% and 0.0419, respectively. Consequently, the object-oriented classification method is better suited for the fine classification of crops.
(3)
The random forest algorithm provided the most accurate and stable classifications. In pixel-based and object-oriented crop classification, RF earned the highest overall accuracy and kappa coefficient, which were 88.94% and 0.8534, and 92.07% and 0.8953, respectively. For a variety of crops, including cotton, spring wheat, cocozelle, and maize, both the producer’s and user’s RF accuracy exceeded 92%. This demonstrates that RF has achieved an outstanding classification impact in crop remote sensing picture classification, whether pixel-based or object-oriented. It has a high degree of classification precision and consistency for various crop types.

Author Contributions

Conceptualization, Q.X. and M.J.; methodology, Q.X. and M.J.; software, Q.X. and M.J.; validation, Q.X., M.J. and P.G.; formal analysis, Q.X. and M.J.; investigation, Q.X. and M.J.; resources, P.G.; data curation, Q.X. and M.J.; writing—original draft preparation, Q.X.; writing—review and editing, M.J.; visualization, Q.X. and M.J.; supervision, P.G.; project administration, P.G.; funding acquisition, P.G. All authors have read and agreed to the published version of the manuscript.

Funding

This research was supported by the National Natural Science Foundation of China (U2003109), the Special Fund for High-Level Talents Research of Shihezi University (RCZK2018C15) and the Xinjiang Uygur Autonomous Region Foundation Project (2022D01A149).

Institutional Review Board Statement

Not applicable.

Data Availability Statement

Not applicable.

Conflicts of Interest

The authors declare no conflict of interest.

Nomenclature

CARTClassification And Regression Tree
CECommission Error
DTDecision Tree
EDEuclidian Distance
GIGreenness Index
GLCMGray-Level Co-occurrence Matrix
KNNK-Nearest Neighbor
MLMaximum Likelihood
MSIMultispectral Imager
NDVINormalized Difference Vegetation Index
NGRDINormalized Green-Red Difference Index
NIRNear Infrared
OEOmission Error
OAOverall Accuracy
PAProducer’s Accuracy
RFRandom Forest
ROC-LVRates of Change of LV
SRISimple Ratio Index
SVMSupport Vector Machine
UAUser’s Accuracy
UAVUnmanned Aerial Vehicle

References

  1. Feng, Q.; Yang, L.; Wang, W.; Chen, T.; Huang, S. CNN remote sensing crop classification based on time series spectral reconstruction. J. Univ. Chin. Acad. Sci. 2020, 37, 619–628. [Google Scholar]
  2. Sarı, F.; Koyuncu, F. Multi criteria decision analysis to determine the suitability of agricultural crops for land consolidation areas. Int. J. Eng. Geosci. 2021, 6, 64–73. [Google Scholar] [CrossRef]
  3. Yi, Z.; Jia, L.; Chen, Q. Crop classification using multi-temporal Sentinel-2 data in the Shiyang River Basin of China. Remote Sens. 2020, 12, 4052. [Google Scholar] [CrossRef]
  4. Liang, J.; Zheng, Z.; Xia, S.; Zhang, X.; Tang, Y. Crop recognition and evaluationusing red edge features of GF-6 satellite. J. Remote Sens. 2020, 24, 1168–1179. [Google Scholar]
  5. Zhao, H.; Chen, Z.; Liu, J. Deep learning for crop classification of remote sesing data: Application and challenges. Chin. J. Agric. Resour. Reg. Plan. 2020, 41, 35–49. [Google Scholar]
  6. Zheng, J.; Song, X.; Yang, G.; Du, X.; Mei, X.; Yang, X. Remote sensing monitoring of rice and wheat canopy nitrogen: A review. Remote Sens. 2022, 14, 5712. [Google Scholar] [CrossRef]
  7. Zhou, Z.; Li, S.; Zhang, K.; Shao, Y. Crop mapping using remotely sensed spectral and context features based on CNN. Remote Sens. Technol. Appl. 2019, 34, 694–703. [Google Scholar]
  8. Han, B.; Chen, S.; Zeng, Q.; Sun, S. Time-series classification of Sentinel-1 data based on J-M distance. Sci. Technol. Eng. 2020, 20, 6977–6982. [Google Scholar]
  9. Jia, B.; Bai, Y.; Wei, Z.; Yan, D.; Zhang, Z. Using MODIS-EVI to identify cropping structure in plains along the Yellow River in inner Mongolia. J. Irrig. Drain. 2021, 40, 114–120. [Google Scholar]
  10. Yi, Y.; Jia, L. Sentinel-2 study on crop mapping of Shandian River Basin based on images. Remote Sens. Technol. Appl. 2021, 36, 400–410. [Google Scholar]
  11. Kang, Y.; Meng, Q.; Liu, M.; Zou, Y.; Wang, X. Crop classification based on red ddge features analysis of GF-6 WFV data. Sensors 2021, 21, 4328. [Google Scholar] [CrossRef] [PubMed]
  12. Liu, G.; Jiang, X.; Tang, B. Application of feature optimization and convolutional neural network in crop classification. J. Geo-Inf. Sci. 2021, 23, 1071–1081. [Google Scholar]
  13. Xu, J.; Yang, J.; Xiong, X.; Li, H.; Huang, J.; Ting, K.; Ying, Y.; Lin, T. Towards interpreting multi-temporal deep learning models in crop mapping. Remote Sens. Environ. 2021, 264, 112599. [Google Scholar] [CrossRef]
  14. He, T.; Fu, Y.; Ding, H.; Zheng, W.; Huang, X.; Li, R.; Wu, S. Evaluation of mangrove wetlands protection patterns in the Guangdong–Hong Kong–Macao Greater Bay area using time-series Landsat imageries. Remote Sens. 2022, 14, 6026. [Google Scholar] [CrossRef]
  15. Li, X.; Wang, H.; Li, X.; Chi, D.; Tang, Z.; Han, C. Study on crops remote sensing classification based on multi-temporal Landsat 8 OLl images. Remote Sens. Technol. Appl. 2019, 34, 389–397. [Google Scholar]
  16. Zhang, H.; Cao, X.; Li, Q.; Zhang, M.; Zheng, X. Research on crop identification using multi-temporal NDVI HJ images. Remote Sens. Technol. Appl. 2015, 30, 304–311. [Google Scholar]
  17. Gu, X.; Zhang, Y.; Sang, H.; Zhai, L.; Li, S. Research on crop classification method based on Sentinel-2 time series combined vegetation index. Remote Sens. Technol. Appl. 2020, 35, 702–711. [Google Scholar]
  18. Xie, Q.; Lai, K.; Wang, J.; Lopez-Sanchez, J.; Shang, J.; Liao, C.; Zhu, J.; Fu, H.; Peng, X. Crop monitoring and classification using polarimetric RADARSAT-2 time-series data across growing season: A case study in southwestern Ontario, Canada. Remote Sens. 2021, 13, 1394. [Google Scholar] [CrossRef]
  19. Wang, X.; Qiu, P.; Li, Y.; Cha, M.X. Crops identification in Kaikong River Basin of Xinjiang based on time series Landsat remote sensing images. Trans. Chin. Soc. Agric. Eng. (Trans. CSAE) 2019, 35, 180–188. [Google Scholar]
  20. Guo, Y.; Liu, Q.; Liu, G.; Huang, C. Extraction of main crops in Yellow River Delta based on MODIS NDVI time series. J. Nat. Resour. 2017, 32, 1808–1818. [Google Scholar]
  21. Wang, M.; Wang, J.; Chen, L. Mapping paddy rice using weakly supervised long short-term memory network with time series Sentinel optical and SAR images. Agriculture 2020, 10, 483. [Google Scholar] [CrossRef]
  22. Lu, M.; Gu, X.; Sun, Q.; Li, X.; Chen, T.; Pan, Y. Production capacity evaluation of farmland using long time series of remote sensing images. Agriculture 2022, 12, 1619. [Google Scholar] [CrossRef]
  23. Zhang, L.; Wang, S.; Liu, H.; Lin, Y.; Wang, J.; Zhu, M.; Gao, L.; Tong, Q. From spectrum to spectrotemporal: Research on time series change detection of remote sensing. Geomat. Inf. Sci. Wuhan Univ. 2021, 46, 451–468. [Google Scholar]
  24. Sefercik, U.G.; Kavzoğlu, T.; Çölkesen, İ.; Nazar, M.; ÖZTÜRK, M.Y.; Adali, S.; Salih, D.İ.N.Ç. 3D positioning accuracy and land cover classification performance of multispectral RTK UAVs. Int. J. Eng. Geosci. 2023, 8, 119–128. [Google Scholar] [CrossRef]
  25. Van, L.; Straatsma, M.; Addink, E.; Middelkoop, H. Monitoring height and greenness of non-woody floodplain vegetation with UAV time series. ISPRS J. Photogramm. Remote Sens. 2018, 141, 112–123. [Google Scholar]
  26. Tian, Z.; Fu, Y.; Liu, S. Rapid crops classification based on UAV low-altitude remote sensing. Trans. Chin. Soc. Agric. Eng. (Trans. CSAE) 2013, 29, 109–116. [Google Scholar]
  27. Zheng, X. Fine classification of typical crops based on UAV hyperspectral images. Sci. Technol. Innov. 2021, 23, 1–3. [Google Scholar]
  28. Tian, T.; Wang, D.; Zeng, Y.; Zhang, Y.; Huang, Q. Progress on fine classification of crops based on unmanned aerial vehicle remote sensing. China Agric. Inform. 2020, 32, 1–12. [Google Scholar]
  29. Xu, Q.; Guo, P.; Qi, J.; Wang, C.; Zhang, G. Construction of SEGT cotton yield estimation model based on UAV image. Transactions of the Chin. Soc. Agric. Eng. (Trans. CSAE) 2020, 36, 44–51. [Google Scholar]
  30. Kaya, Y.; Polat, N. A linear approach for wheat yield prediction by using different spectral vegetation indices. Int. J. Eng. Geosci. 2023, 8, 52–62. [Google Scholar] [CrossRef]
  31. Ma, L.; Hu, N.; Li, W.; Qin, W.; Huang, S.; Wang, Z.; Li, W.; Yu, K. Using multispectral drone data to monitor maize’s response to various irrigation modes. J. Plant Nutr. Fertil. 2022, 28, 743–753. [Google Scholar]
  32. Wang, S.; Zhang, L.; Lin, W.; Huang, Q.; Song, Y.; Ye, M. Study on vegetation coverage and land-use change of Guangdong Province based on MODIS-NDVI. Acta Ecol. Sin. 2022, 42, 2149–2163. [Google Scholar]
  33. Liang, C.; Huang, Q.; Wang, S.; Wang, C.; Yu, Q.; Wu, W. Identification of citrus orchard under vegetation indexes using multi-temporal remote sensing. Trans. Chin. Soc. Agric. Eng. (Trans. CSAE) 2021, 37, 168–176. [Google Scholar]
  34. Bo, S.; Han, X.; Ding, L. Automatic selection of segmentation parameters for object oriented image classification. Geomat. Inf. Sci. Wuhan Univ. 2009, 34, 514–517. [Google Scholar]
  35. Liu, S.; Zhu, H. Object-oriented land use classification based on ultra-high resolution images taken by unmanned aerial vehicle. Trans. Chin. Soc. Agric. Eng. (Trans. CSAE) 2020, 36, 87–94. [Google Scholar]
  36. Avcı, C.; Budak, M.; Yağmur, N.; Balçik, F. Comparison between random forest and support vector machine algorithms for LULC classification. Int. J. Eng. Geosci. 2023, 8, 1–10. [Google Scholar]
  37. Ofrizal, A.Y.; Sonobe, R.; Hıroto, Y.; Morita, A.; Ikka, T. Estimating chlorophyll content of Zizania latifolia with hyperspectral data and random forest. Int. J. Eng. Geosci. 2022, 7, 221–228. [Google Scholar]
  38. Ma, Y.; Ming, D.; Yang, H. Scale estimation of object-oriented image analysis based on spectral-spatial statistics. J. Remote Sens. 2017, 21, 566–578. [Google Scholar]
  39. Liu, W.; Zhao, L.; Zhou, Y.; Zong, S.; Luo, Y. Deep learning based unmanned aerial vehicle landcover image segmentation method. Trans. Chin. Soc. Agric. Mach. 2020, 51, 221–229. [Google Scholar]
Figure 1. Geographic location and time-series UAV and Sentinel remote sensing images of the study area.
Agriculture 13 00097 g001
Figure 2. Phenological calendar information of cotton, maize, cocozelle and spring wheat in the study area.
Agriculture 13 00097 g002
Figure 3. UAV’s platform, sensor, and partial detail images.
Agriculture 13 00097 g003
Figure 4. Spatial visualization of ground survey data.
Agriculture 13 00097 g004
Figure 5. Technology roadmap.
Agriculture 13 00097 g005
Figure 6. Average vegetation index of different crops based on time-series images.
Agriculture 13 00097 g006
Figure 7. Sketch of feature extraction process of gray scale co-occurrence matrix.
Agriculture 13 00097 g007
Figure 8. Classification process of random forest algorithm.
Agriculture 13 00097 g008
Figure 9. Crop classification results of different classification methods based on time-series remote sensing images. Note: The first line is the result based on pixel classification, and the second line is the result based on object-oriented classification.
Agriculture 13 00097 g009
Figure 10. The overall accuracy and kappa coefficient of crops based on different classification methods.
Agriculture 13 00097 g010
Figure 11. Crop classification results of different image types and different classification methods.
Agriculture 13 00097 g011
Figure 12. Local results of crop classification with different image types and different classification methods. Note: (a) pixels+UAV, (b) pixels+Satellite, (c) object-oriented+UAV, (d) object-oriented+Satellite.
Agriculture 13 00097 g012
Figure 13. Precision evaluation of crop classification results with different image types and different classification methods.
Agriculture 13 00097 g013
Table 1. The calculation formula of common vegetation indices.
Vegetation IndicesEquations
Greenness Index (GI)G/R
Simple Ratio Index (SRI)NIR/R
Normalized Difference Vegetation Index (NDVI)(NIR − R)/(NIR + R)
Normalized Green-Red Difference Index (NGRDI)(G − R)/(G + R)
Note: R, G, and NIR represent the pixel luminance values of red, green, and near-infrared bands, respectively.
Table 2. Euclidean distance between different crop types under different vegetation indices.
Vegetation indicescotton
cocozellespring wheatmaizereedforestconstruction land
NDVI0.5812.1111.5170.7380.7131.682
GI2.2042.3072.7440.9391.3344.993
SRI36.27534.42838.8919.66124.51219.695
NGRDI0.6840.7580.9230.2770.5010.411
Vegetation indicescocozelle
cottonspring wheatmaizereedforestconstruction land
NDVI0.5811.8561.0620.8110.4662.263
GI2.2043.7611.7522.5991.7647.197
SRI36.27558.45332.77842.36625.33155.968
NGRDI0.6841.1020.6230.7450.4991.091
Vegetation indicesspring wheat
cottoncocozellemaizereedforestconstruction land
NDVI2.1111.8560.8261.5751.3981.303
GI2.3073.7612.8151.6581.9975.434
SRI34.42858.45342.47126.06533.12227.635
NGRDI0.7581.1020.7430.6370.6030.681
Vegetation indicesmaize
cottoncocozellespring wheatreedforestconstruction land
NDVI1.5171.0620.8260.9810.9321.465
GI2.7441.7522.8152.4431.8676.241
SRI38.89132.77842.47132.6336.75342.644
NGRDI0.9230.6230.7430.8040.5280.944
Table 3. Precision evaluation of crop classification results based on object-oriented methods.
MethodsNameProducer’s Accuracy%User’s
Accuracy%
Commission Error%Omission Error%
RFmaize97.8999.660.342.11
spring wheat98.6499.960.041.36
cotton97.9999.320.682.01
cocozelle99.5892.537.470.42
OA92.07%
kappa0.8953
KNNmaize96.5699.590.413.44
spring wheat98.8997.142.861.11
cotton99.4298.341.660.58
cocozelle97.4797.372.632.53
OA91.32%
kappa0.8858
SVMmaize94.2191.278.735.79
spring wheat91.5698.691.318.44
cotton95.1396.963.044.87
cocozelle94.9893.116.895.02
OA88.38%
kappa0.8463
DTmaize91.4790.159.858.53
spring wheat90.1093.696.319.90
cotton90.2895.874.139.72
cocozelle73.0062.6037.4027.00
OA81.26%
kappa0.7575
Table 4. Results of crop classification accuracy of remote sensing images with different time resolutions.
Schemes NameClassification AlgorithmsWay of ClassificationOverall Accuracy% Kappa Coefficient
Crop classification based on single-period UAV remote sensing imagesRandom ForestPixels56.730.4436
Object-oriented65.420.5457
Crop classification based on time-series UAV remote sensing imagesPixels88.940.8534
Object-oriented92.070.8953
Crop classification based on single-period satellite remote sensing imagesPixels54.700.4339
Object-oriented62.810.5196
Crop classification based on time-series satellite remote sensing imagesPixels84.270.7932
Object-oriented88.560.8495
Disclaimer/Publisher’s Note: The statements, opinions and data contained in all publications are solely those of the individual author(s) and contributor(s) and not of MDPI and/or the editor(s). MDPI and/or the editor(s) disclaim responsibility for any injury to people or property resulting from any ideas, methods, instructions or products referred to in the content.

