Article

Assessing Crop and Corn Silage Profile in Beef Cattle Farms in Southern Brazil: Ten Years’ Results

by
Egon Henrique Horst
* and
Mikael Neumann
Department of Veterinarian Medicine, Midwestern Parana State University-UNICENTRO, Guarapuava 85040-167, Brazil
*
Author to whom correspondence should be addressed.
Agriculture 2022, 12(8), 1200; https://doi.org/10.3390/agriculture12081200
Submission received: 17 June 2022 / Revised: 4 August 2022 / Accepted: 5 August 2022 / Published: 11 August 2022

Abstract

:
This work aimed to investigate corn crop management practices and the quality of corn silage in beef cattle farms in southern Brazil during ten years of sampling. A total of 63 farms, located in 16 municipalities in Paraná state, Brazil, participated in the study of corn crop characterization, while the corn silages were obtained from 65 farms located in 18 municipalities in the same state. A total of 49 corn hybrids were identified, with a preference for early cycle hybrids (E) and semi-hard grain type (SH). The dataset was obtained between 2011 and 2020, and the average cycle of the identified hybrids ranged from 150 ± 14 days in 2012 to 134 ± 12 days in 2019, with a maximum amplitude of 182 days in 2012 and a minimum of 99 days in 2019 and 2020. The DM content of the plant at harvest ranged from 40.1% to 45.9% between the average of the years evaluated, with an average dry biomass yield of 25 t ha−1. The analyzed silages had average levels of aNDF and ADF within the expectation (45.6% and 26.2%, respectively) but with CP content below that commonly observed in corn silages (6.9%) due to the stage of advanced maturity at harvest. Based on this monitoring, we emphasize that the production of corn silage on beef cattle farms in southern Brazil faces specific challenges, which include outsourcing the provision of harvesting services. Above all, it was clear that there were no significant advances in the results obtained over ten years, raising concerns about interventions in the process.

1. Introduction

According to the most recent data from the IBGE [1], Brazil has the largest commercial cattle herd in the world, with more than 187 million heads, but it is only the second-largest beef producer. This inversion occurs because Brazilian livestock takes place in grazing systems, delaying the time of slaughter. However, driven by the growing demand from the foreign beef market, the number of feedlots in Brazil has grown substantially in recent years [2], increasing the requirement for forages preserved by this feedlot system. Previous monitoring conducted by Bernardes and do Rêgo [3] showed that corn silage is the preferred roughage to be used in feedlots in Brazil. These data are supported by Oliveira and Millen [2]. The corn planted area in Brazil corresponds to a share of approximately 20% of the corn worldwide, which is estimated at 19.8 million hectares, and 20% of this area has been used for corn silage production [4].
The fact that Brazil does not have official statistics on the practice of silage production has already been pointed out by Bernardes et al. [5], and the little information available about this is limited to specific regions. The southern region of Brazil is characterized by a CFA climate (Köppen classification), and, as in most regions with a hot and humid climate, silage appears to be the main method for forage conservation [6,7], and, therefore, understanding this reality is critical to know where we should focus our research efforts in the future. Recently, some studies have tried to elucidate the profile of corn silage on Brazilian farms [7,8,9], but there is still no publication on aspects of the crop in combination with the quality of corn silage in beef cattle farms. Most of these studies describe the reality of dairy farms, while ours aims to understand the beef cattle farms focused on region specificities, commonly provided with greater investments in technology and technical support.
To visualize the main challenges and define corn silage production strategies, we aimed to monitor the crop management practices and quality of corn silage on beef cattle farms in southern Brazil during ten years of sampling.

2. Materials and Methods

2.1. Farms

A total of 63 farms, located in 16 municipalities in the state of Paraná, Brazil, participated in the study of characterization of corn crops for silage production. During the years 2011–2020, 312 assessments were carried out. More details about the sampling are presented in Table 1.
The corn silage profile was carried out on 65 farms located in 18 municipalities of Paraná state, Brazil. This stage of the study had 449 samples of corn silages from 2011 to 2019. More details about the sampling are presented in Table 2.

2.2. Research Data Collection

All beef cattle farmers selected for the research were members of the Cooperaliança® slaughterhouse (Guarapuava, PR, Brazil), with which it was possible to select those who agreed to participate in the study. All farms used feedlots for finishing the animals, and corn silages were present as the only source of roughage in their diet.
The evaluated crops, as well as the corn silages derived from them, were cultivated during the first harvest, with planting in the spring (Sep.–Dec.) and harvesting in the summer (Jan.–Mar.). The corn hybrids used and the levels of fertilization and fertilizer formula (N-P2O5-K2) were obtained through the Cooperaliança® system and sales register, where farmers acquired all inputs for farming. The confidentiality of all participants was maintained.
The sowing date was requested from each farmer. Thus, on the day of harvest, it was possible to identify the crop cycle (days from sowing to harvest). At that moment, the spacing between rows and the population density of the crop were also verified, with which it was possible to estimate the biomass yield. The height of harvest, the height of the plant, and insertion of the ear in the plant, and the number of yellow leaves per plant were also obtained.
Twenty whole plants were randomly selected and harvested manually at the same time that the harvest was carried out with the self-propelled harvester (the harvest was carried out with a self-propelled harvester on all farms). After harvesting, the plants were immediately taken to the laboratory and divided into: leaves, stem, bracts and cob, and grains, according to Horst et al. [10].
The collection of silage samples took place approximately one week after the opening of the silos of each farm. To characterize the specific density of the silage, two position factors were chosen: the height at four levels (two lower and two higher) and the lateral position (near the center or close to the silo wall), all with a depth of 30 cm. The four heights were taken as follows: 0.5 m from the ground, 0.5 m from the top of the silage, and at two intermediate heights. The wet mass of each sample taken with the sampler [11] was weighed on site and the volume was determined by the diameter of the auger and the actual depth of each hole obtained with a tape measure after the sample had been removed. These same samples were immediately taken to the laboratory for further analysis.
The canvas thickness was evaluated at the same time with a digital micrometer (IP40, Digimess®).

2.3. Particle Size Analysis

The silage particle size analysis was performed using the Penn State Particle Separator method, as described by Lammers et al. [12]. Briefly, two sieves were used to separate the particles according to their size, categorized in the upper (19 mm), middle (8 mm), and lower tray (bottom).
The average particle size was determined according to the American Society of Agricultural Engineers standard S424 [13]. The separator has five screens with square holes, with diagonal openings of 26 mm, 18 mm, 9 mm, 5.6 mm, and 1.7 mm, and a tray.

2.4. Nutritional Value

The silage samples were pre-dried in a forced-air oven at 55 °C for 72 h. The samples were then ground in a Wiley mill with a 1 mm mesh sieve. The pre-dried and ground samples were then analyzed for their total dry matter in an oven at 105 °C for 4 h. Crude protein (CP) content was determined by the micro-Kjeldahl method according to the methodology described by AOAC [14]. The neutral detergent fiber (aNDF) content was obtained using heat-stable amylase without sodium sulfite. Acid detergent fiber (ADF) and lignin (sa) contents were determined sequentially according to the methods of Goering and Van Soest [15]. Both fiber fractions were expressed including residual ash.

2.5. Statistical Analysis

Descriptive statistics were used for all data. Polynomial regression analysis considering the variables aNDF with ADF and plant MS with grain MS was used through the regression procedure (PROC REG) by the SAS program (9.2; SAS Institute Inc., Cary, NC, USA).

3. Results

3.1. Location of Properties

The 63 farms where 312 samples of corn plants were collected at the time of harvest for silage between the years 2011 and 2020 (Table 1), as well as the 65 farms where 449 silage samples were collected between the years 2011 and 2019 (Table 2), are located in Paraná state, Brazil. All the farms visited are in municipalities belonging to the CFA region: humid subtropical climate according to the Köppen classification (1928). The minimum altitude recorded was in Cruzeiro do Sul (454 m) and the maximum in Guarapuava (1110 m). The extreme latitudes, north and south, were recorded on properties in the municipalities of Cruzeiro do Sul and Reserva do Iguaçu, respectively. The extreme longitudes, west and east, were recorded on farms in the municipalities of Cascavel and Castro, respectively.
Guarapuava was the municipality where the largest number of farms were visited and the largest number of corn plant samples collected (32%), as well as the largest number of silage samples collected (31%).

3.2. Cultivated Corn Hybrids

Our study found corn hybrids from 11 different companies. We also observed forty-nine corn hybrids cultivated for silage production, of which eighteen were from Pioneer®, six from Agroceres®, six from Syngenta®, and the other companies had less than five hybrids described (Table 3). The Pioneer® hybrids totaled 69.1% of the hybrids used in the farms visited, among which the hybrid 30B39 was the most used, followed by the hybrids 30R50 and 30F53, registered in 23.9%, 19.7, and 8.1% of the properties, respectively. These hybrids are characterized by early cycle (E) and semi-hard (SH) grain types. The hybrids P4285 from Pioneer® and AG9025 from Agroceres® also had representative appearances, being used in 11 and 12 farms, respectively, the first being characterized as E and hard grain type (H), and the other as super early (SE) and SH grain type.
Figure 1 shows the average corn crop cycle, from sowing to harvesting for silage, observed between 2011 and 2020. The average cycle of the described hybrids ranged from 150 ± 14 days in 2012 to 134 ± 12 in 2019, with a maximum amplitude of 182 days in 2012 and a minimum of 99 days in 2019 and 2020.
In 2011, the crop showed the lowest standard deviation (SD) observed (7 days), the year in which the 30B39 hybrid was used in 71% of the farms visited. In this season, the average cycle was 144 days, ranging from 127 to 148 days, while the 30B39 hybrid cycle was 152 days, ranging from 131 days in Candói to 182 days in Guarapuava (1100 m altitude).

3.3. Typification of Corn Crops

At the time of tillage, the spacing between rows most frequently observed was 45 cm in the 10 years of evaluation (Table 4). The observed variation was from 40 cm, between 2012 and 2017, to 100 cm in the years 2013 and 2014.
The average density was 74,099 plants per ha, ranging from 72,766 to 78,348 in 2015. The variation observed within each year was greater than that observed in the average of the years. The lowest density observed was 45,444 plants per ha, while the highest was 98,000 plants per ha. For all years, the highest density described was above 85,000 plants per ha.
The average height of harvest was 36 cm above the ground, with an average amplitude between the years of 34 to 39 cm and a general minimum height of 20 cm and a maximum of 70 cm.
The average plant height observed over the years of the evaluation was 2.33 m in crops with an average of 2.14 m (2011) to 2.55 m (2020). The farms visited had hybrids with minimum heights ranging from 1.63 to 2.14 m and maximum heights ranging from 2.45 to 3.25 m. The average height of ear insertion in the plant ranged from 1.08 to 1.41 m between the years evaluated, with an average of 1.23 m. However, the lowest recorded height was 0.67 m and the highest was 1.85 m.
At the time of harvest, the number of yellow leaves present on the plant was also recorded, which varied from 3.0 to 5.7, with an average of 3.9 yellow leaves per plant between the years evaluated. In 2014, crops were being harvested without any yellow leaves on the plant. On the other hand, in 2017, plants with up to 12 yellow leaves were registered.
The base fertilization recorded between the years 2013 and 2017 had averages ranging from 208 to 240 kg ha−1 of fertilizer based on N, P2O5, and K2O, with the lowest dose recorded being 200 kg ha−1 and the highest 580 kg ha−1. Despite the different fertilizer formulas, the concentration of N varied from 34 to 48 kg ha−1, that of P2O5 varied from 111 to 127 kg ha−1, and that of K2O varied from 62 to 69 kg ha−1 (Figure 2A).
The topdressing fertilization with urea (corrected for 46% N) ranged from 169 to 193 kg of N per ha, with minimum and maximum concentrations of 83 and 310 kg of N per ha, equivalent to 180 and 675 kg of urea per ha (Figure 2B). The most repeated urea dose was 400 kg ha−1 (184 kg of N per ha), which occurred 21% of the time. The number of urea applications was always between one and two applications, and, in most cases, the topdressing fertilization was carried out in two applications. In 2015, 58% of farmers carried out two applications, and, in 2017, 88% of farmers repeated this management.
In a single application, we noticed that the doses of urea applied varied from 180 to 500 kg ha−1, while, in two applications, the variation was from 250 to 675 kg ha−1. Our data indicate that there is an interpretation that the dividing line between one or two applications occurs with ~400 kg of urea per ha or ~184 kg of N per ha (Figure 2C).

3.4. Plant Characteristics at Harvest

To evaluate the DM content of the plant and grains at the time of harvest for silage (Table 5), an average of 32 farms were evaluated per year, ranging from 22 (2011) to 38 (2014 and 2020). The DM content of the plant at harvest ranged from 40.1% to 45.9% for the average of the years evaluated, within which there were greater differences, with plants being harvested between 28.8% and 63.7% DM.
The grain DM ranged from 61.3% to 68.3% between the years, with an average of 65.2%. As for the DM content of the plant, the lowest average was observed for the year 2012. Within each year, we observed grain DM levels ranging from 23.0% to 84.5%.
From the data of plant DM and grain DM obtained during the harvesting of plants for silage, it was possible to define the equation, as shown in Figure 3: y = 0.4346x + 11.66, to estimate the DM content of the plant from the DM of the grains (R2 = 0.57; E·P·M. = 2.80).
Morphometric analyses consisted of 178 samples (n) of corn plants at harvest time, 22 in 2011; 26 in 2012; 29 in 2013; 38 in 2014; 28 in 2015; and 35 in 2016 (Figure 4). The average percentage of each component in the plant was: leaves: 20%, ranging from 17% to 27%; stem: 17%, ranging from 15% to 20%; husk leaves and cob: 19%, ranging from 16% to 23%; and grains: 44%, ranging from 35% to 51%.
The average fresh biomass yield was 56,913 kg ha−1, with variations in averages between the years from 55,965 to 66,813 kg ha−1 (Table 6). Among the minimums and maximums observed each year, yields ranging from 31,440 to 89,004 kg ha−1 are described. The dry biomass yield did not necessarily follow the annual behavior described above since the lowest annual average was identified in 2017 (23,662 kg ha−1) and the highest average yield in 2014 (28,021 kg ha−1). The average between the years evaluated was 25,007 kg ha−1, ranging from 11,038 to 42,802 kg ha−1 among all the properties sampled. The average grain yield at harvest, corrected by DM, was 11,109 kg ha−1, with a range from 8836 to 13,450 kg ha−1.

3.5. Characterization of Silages and Silos

For all the corn silage samples, particle size separation was performed using the Penn State Particle Separator, with 19 and 8 mm diameter sieves, in addition to estimating the average particle size (Table 7). We observed particle distribution with 5.9% >19 mm; 58% >8 mm; and 36% <8 mm. The average variation of particles >19 mm was between 3.7% and 8.1%, with differences between all the samples evaluated from 0 to 75.3%. The average variation in particles >8 mm was between 53% and 63.3%, with minimum and maximum distributions of 16.6% and 74%, respectively. The tray (<8 mm) maintained shares of 29% to 42.4% between the years of evaluation.
The average particle size was 11 mm, ranging from 9.9 to 12 mm in the annual average of the samples, with minimum and maximum observed sizes of 7.7 and 17.4 mm.
The nutritional value of the 260 sampled corn silages showed average levels of 39.3% DM; 2.6% ash; 6.9% CP; 45.6% aNDF; 26.2% ADF; and 4.1% lignin (sa) (Table 8). The DM content ranged from 36 to 42.1% between the years evaluated, except for 2019, in which the bromatological analyses of the silages were not performed. The ash content ranged from 1.8 to 3.4%, while the CP content ranged from 5.6 to 7.9%. For aNDF, we noticed levels varying from 43.2 to 51.7%, and amplitude from 23.7 to 29.1% for ADF. The lignin (sa) content was evaluated only in the years 2014 (n = 32) and 2020 (n = 33), with mean values of 3.6% and 5.4%, respectively.
From the analysis of aNDF and ADF of the sampled silages (n = 260), we defined an equation for predicting ADF from the aNDF content obtained, being: y = 0.4244x + 6.554, where the coefficient of determination (R2) was 0.64 (Figure 5).
In our silage samples, we observed a mean pH of 3.99 ± 0.26 and a CI of 3.96–4.03 (Table 9). Over the ten years of sampling, the average pH variation of silages ranged from 3.85 to 4.03. From the pH indices measured annually, we distributed the silages into three groups: pH <3.8: there were 43 samples (14.5%); pH 3.8–4.2: presented 197 samples (83%); and pH > 4.2: presented eight samples (2.5%).
The canvas used to seal the silo was evaluated in 2011, 2012, 2013, and 2015, and an average thickness of 130 µm was observed, ranging from 118 to 166 µm (Table 10). In these same years and also in 2016 and 2017, the silage-specific density was estimated, which showed an average of 587 kg of AF m−3 and 225 kg of DM m−3 in the lower stratum of the silo and 508 kg of AF m−3 and 162 kg of DM m−3 in the upper stratum of the silo.

4. Discussion

Some studies have been conducted to verify corn silage production practices in Brazilian dairy farms [3,9,16], but little focus has been given to beef cattle farms. According to the latest IBGE survey [1], Brazil had 6.48 million cattle finished in feedlot, corresponding to ~15.6% of the total slaughters in the year. The state of Paraná sustains approximately 379,000 cattle in continuous feedlot, and corn silage is the main source of roughage used in the diet [2,7], and, in many cases, the only one. Therefore, understanding the practices of these farms is essential to envision improvements.
The proper development of maize crop depends on factors related to the dynamics of the soil–plant–atmosphere system, such as the availability of water in the soil, evapotranspiration, and the use of water by plants. However, Daniel et al. [7] pointed out that the factors that affect the development of culture vary according to the region of the country. Nied et al. [17] presented results from different studies demonstrating that rainfall is the main climatic variable that determines corn production in southern Brazil. As we did not correlate these variables in our study, it is difficult to discuss this factor, but it is known that water stresses do not occur frequently in the evaluated areas, explaining why all hybrids can present satisfactory yields, with differences being observed between those arising from their genetics.
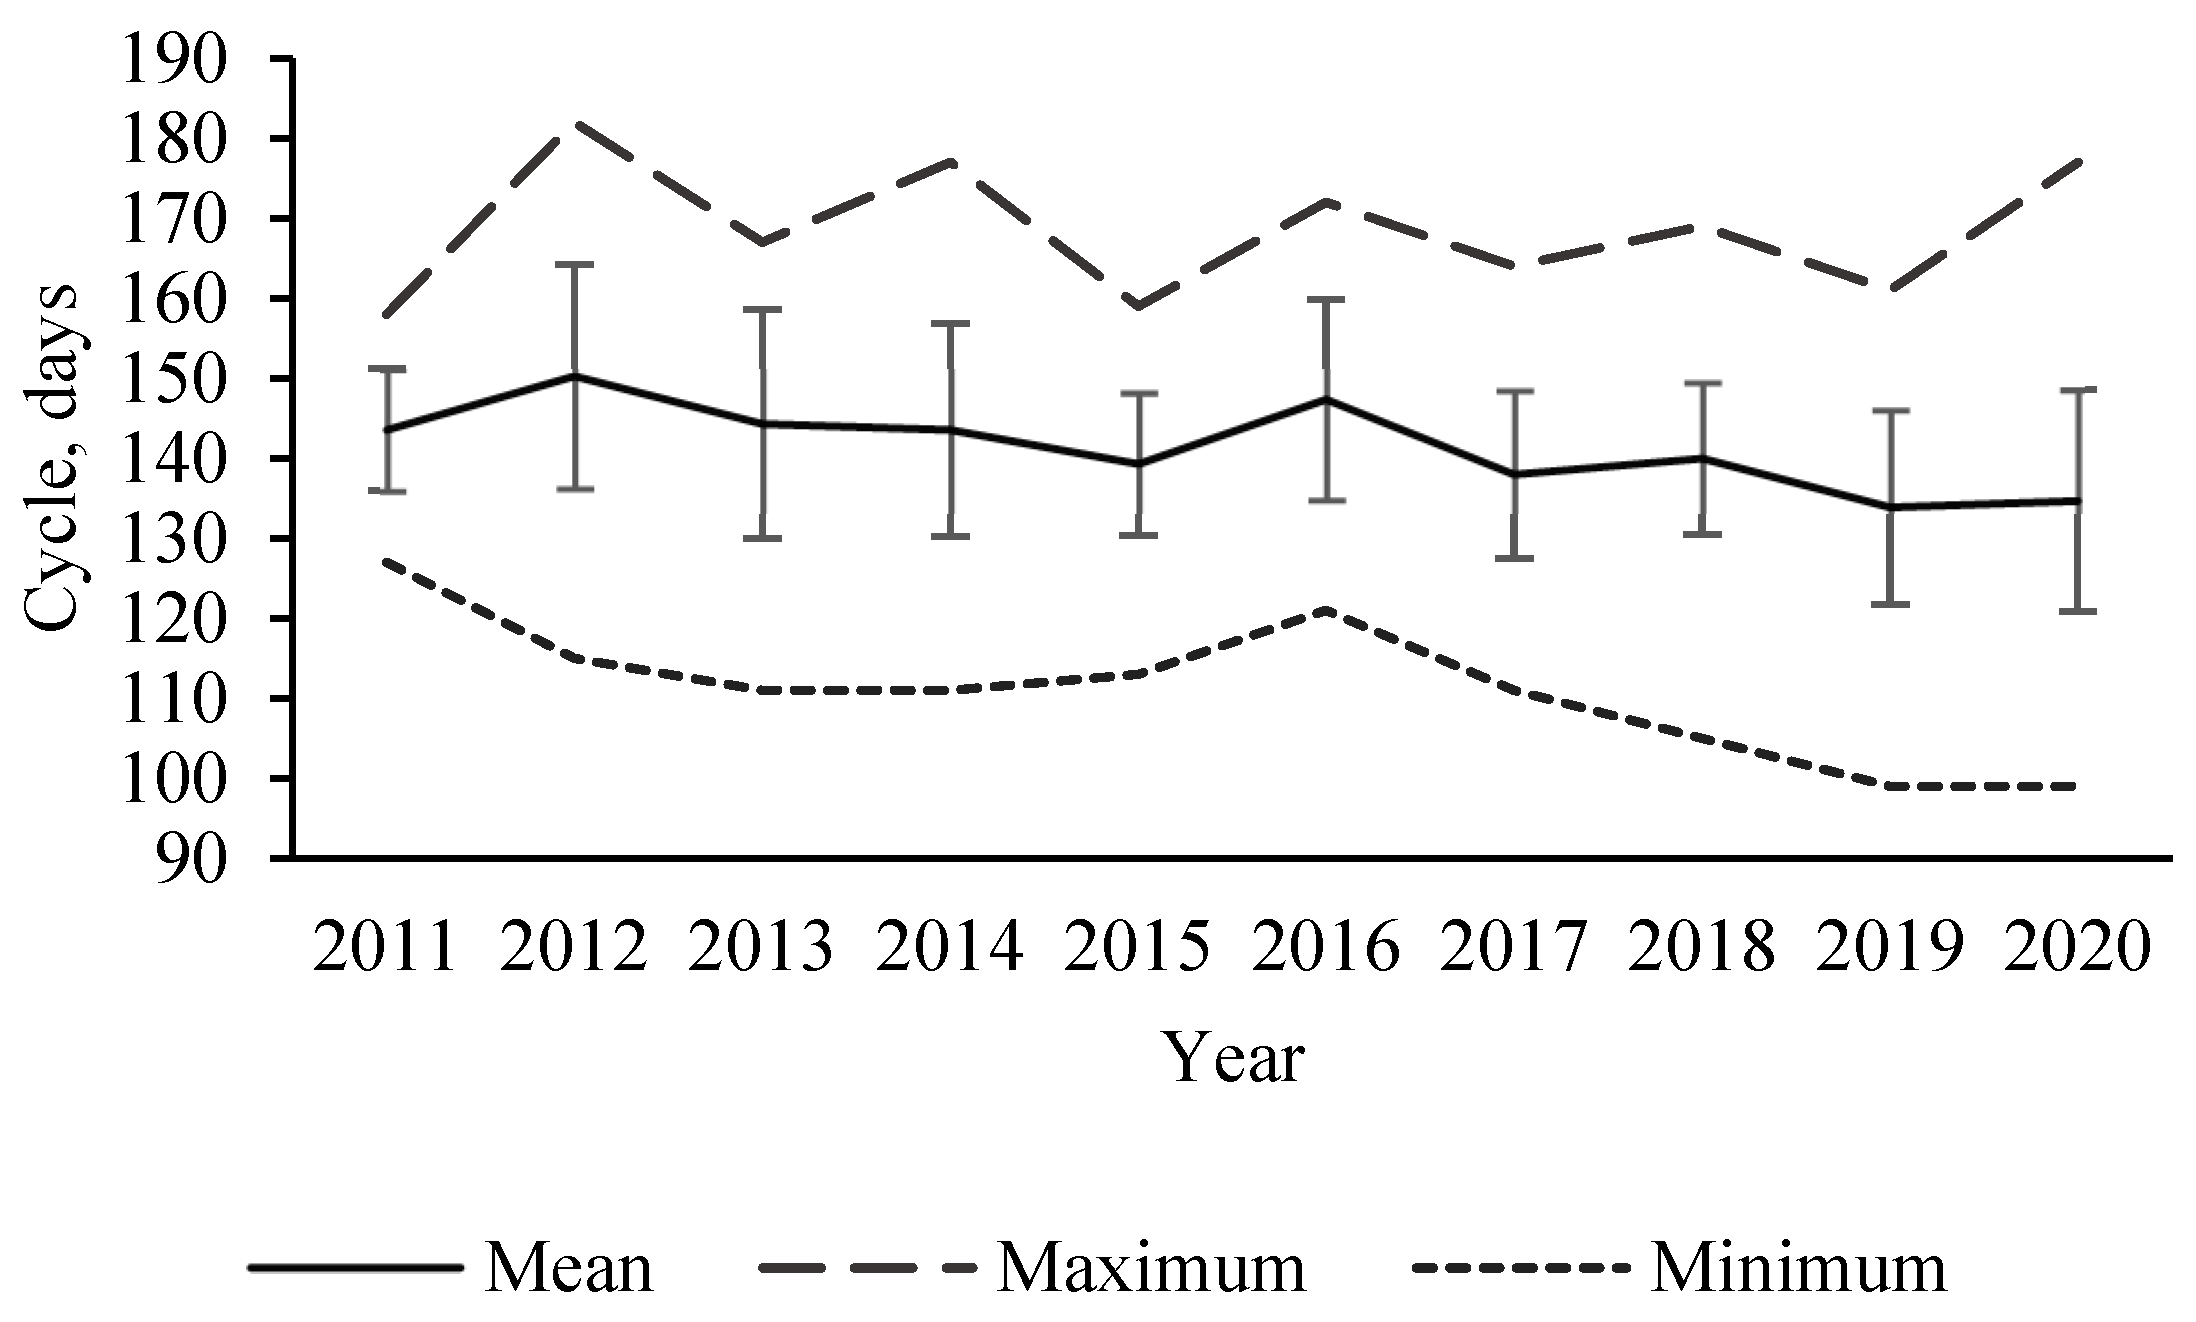
Another important aspect taken into account when choosing a corn hybrid is the relationship between its cycle and the successor crop. Many farmers opt for shorter cycle hybrids, even though they commonly have lower yields, in order to carry out another crop in a row with less risk of impacts caused by frost.
Bernardes and Rêgo [3] pointed out that one of the main barriers encountered by Brazilian silage farmers is the limited number of options for corn hybrids adapted for silage since, in Brazil, the type of grain with a hard texture (flint) predominates. Even so, we noticed that the few options of hybrids of dent grains (dent) had a little appearance, with greater emphasis on hybrids of hard and semi-hard grains, which can mean (i): the type of grain is a factor of lower importance in the point of view of farmers; (ii) hard grains have a higher weight and, therefore, if part of the crop is left for grain harvesting, they will guarantee higher yields; (iii) dent grain hybrids are seen as less resistant to pests and diseases. It should be noted that significant economic impacts caused by pests and diseases are often reported in more susceptible hybrids [18]. Furthermore, grain vitreousness does not appear to significantly affect starch digestibility after ensiling [8] and, therefore, it is a fact that the type of grain in silages has less relevance than grain supplied as dry corn grain [19,20].
The Brazilian market does not have a specific hybrid record for silage production [7], and, because of this, seed companies have used dual-purpose strategies, that is, hybrids that can be harvested for silage and grain [18], such as those described in our study. However, these hybrids tend to yield less. Liu et al. [21] observed higher milk yield per ton of DM for dual-purpose hybrids and higher milk yield per area for silage-specific hybrids. Recent surveys conducted by Daniel et al. [7] and Lima et al. [3] showed that the average silage yield during the first harvest in Brazilian farms was 28.2 and 25.6 tons of DM per hectare, respectively.
Longer cycle hybrids generally have higher yields over earlier hybrids [22] because maize responds to heat units accumulated throughout the growing season. Opsi et al. [23] observed results that prove this statement. However, in some regions of Paraná, the livestock system is extending the grazing time on winter crops and delaying the planting season of summer corn, leading each year to be chosen for hybrids with shorter cycles by the farmers (Figure 1). According to EMBRAPA [24], approximately ⅔ of the hybrids registered in Brazil are in an early cycle.
Adjusting row spacing is an important factor in increasing plant density [25], and modern hybrids with more upright leaf architecture allow a reduction in row spacing associated with better capture of solar radiation, which generally promotes significant increases in yield [26]. On the other hand, the nutritional value of silage can be affected by this increase in plant density [27], but it is dependent on numerous factors, including climatic conditions, plant height, and leaf area. Bastos et al. [18] evaluated cornfields for silage production in three Brazilian regions and associated higher silage yields with taller plants and higher plant densities. In general, it is observed that the density of plants in Brazilian fields varies from 55 to 95 thousand plants ha−1 [7], with row spacing of 40 to 90 cm, as we observed in our monitoring.
It is noted that the relationship between agronomic characteristics and/or yield and the nutritional value of corn silage is not affected by a single specific factor [3]. To compare, we must always take into account the most diverse factors involved in the corn field, such as environment, genetic, cultural traits, and management.
Regardless of row spacing, the N level must be maintained to optimize yields according to plant density [26], which commonly ranges from 120 to 190 kg of N per ha [7]. We observed fertilization with at least 210 kg of N per ha (base fertilization plus top dressing). Special care should be given to these fields since, in the view of many silage producers, there should be a considerable increase in N levels when the number of plants per ha is increased. This is what we found in our study. In addition to the fact that N excess causes qualitative damage to silage in the same order as it lacks [28], recent concerns about environmental pollution under the EU agricultural policy [29] guide to reduce N over-fertilization and achieve more sustainable agricultural practices.
All these factors must be taken into account, even if there may be a productive increase in DM yield [30] from the influence on leaf area development, leaf area maintenance, and leaf photosynthetic efficiency [31] with increasing N levels. Assessing the number of yellow leaves at harvest is a good indicator of the response to nitrogen fertilization, in addition to being a good harvest direction.
Delaying the harvest can be a good strategy in some cases since approximately 50% of the energy value of the silage is derived from starch [32], but it is important to attend the grain processing to avoid considerable losses in the digestibility of the starch [33,34]. We found that all silage fields evaluated in this study were harvested with the self-propelled harvester, which could explain the farmers’ choice to harvest plants with high DM contents. This practice has been adopted by most beef cattle farms, unlike what is observed in dairy farms [4,7], which mostly use traction harvesters.
Caution should be exercised when inferring that the increase in the DM content of the plant causes a reduction in starch digestibility since, in a meta-analysis conducted by Ferraretto and Shaver [32], ambiguity is noted in the results regarding the extent of starch digestion in silages of different maturities. In addition, even if differences are observed in the grain before ensiling, the acidic action during the fermentation process seems to reduce these differences [19].
The distribution of particles observed over the 10 years was similar to the data described by Daniel et al. [7]. For diets in which corn silage is the only roughage source, this particle size is below the recommendations of Heinrichs and Kononoff [35] for the upper and bottom sieves, with a higher proportion in the middle sieve (8 mm), which may indicate good ear processing. This cutting pattern does not make it difficult to adjust diets to meet the NDF recommendations for feedlot cattle, especially because silages produced in Brazil have higher NDF contents compared to North American silages (42.8 vs. 37.9%) [7], where these recommendations emerged. The average NDF content in our survey was 45.6%, reflecting the advanced maturity of the plants at the time of harvest. However, all the farmers declared that they carry out the silage shortage using a harvester with a chopper roller and milling machine, which further reduces the particle size and can cause problems if the extent of chopping is significant. According to Andrae et al. [34], the mechanical processing of corn silage can compromise fiber digestibility by significantly increasing the passage rate, and thus the benefits of the use of starch would be reduced. We believe this would not affect performance in feedlot cattle due to the low levels of roughage normally included in these diets.
Due to the high DM contents of the plant, it seems that farmers choose to reduce the average particle size so that compaction is not impaired or that the grains can be better processed. We observed an average particle size of 11 mm, with annual variations from 9.9 to 12 mm. Under Brazilian conditions, self-propelled harvesters adjusted to chop size up to 12 mm significantly increase starch digestibility [36] due to increased grain processing. Visual inspection of Penn State screens showed acceptable numbers of whole grains in silages (data not shown). In this case, it seems understandable to allow greater advancement in plant maturity and starch gains.
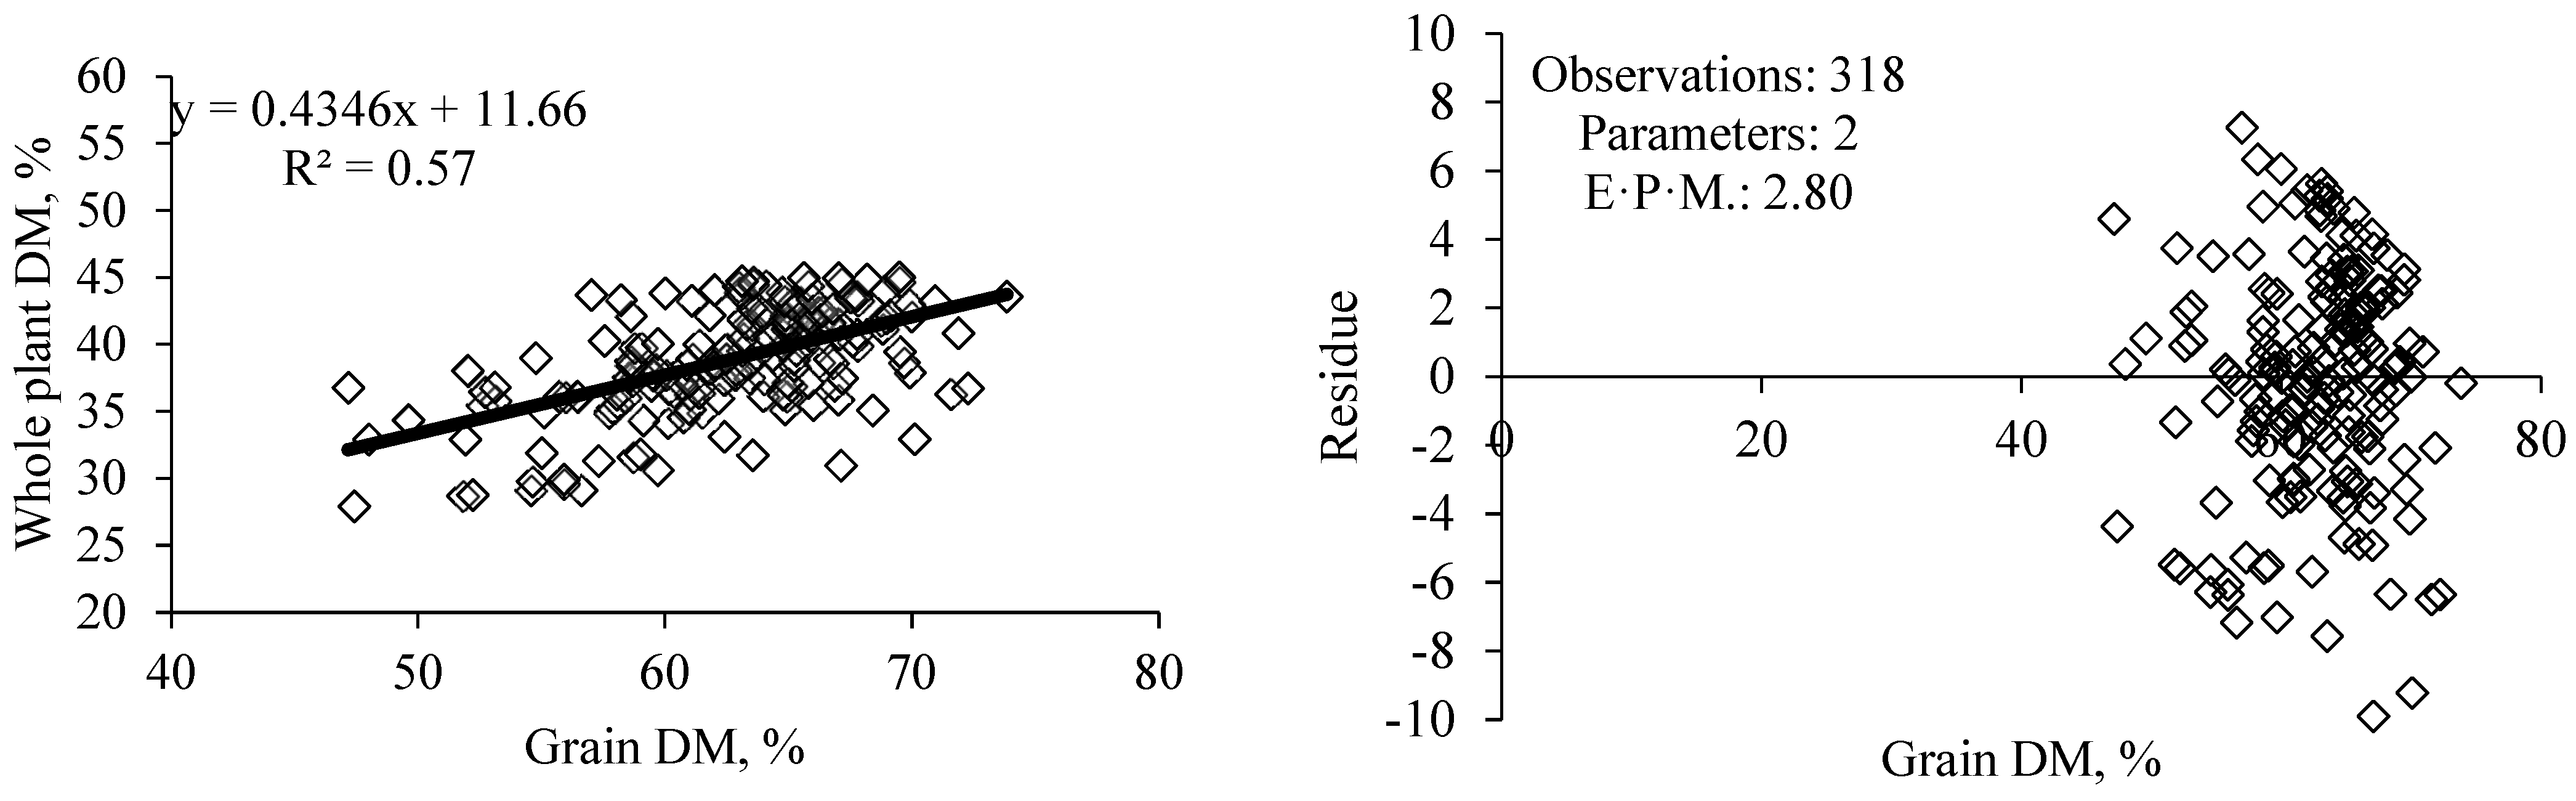
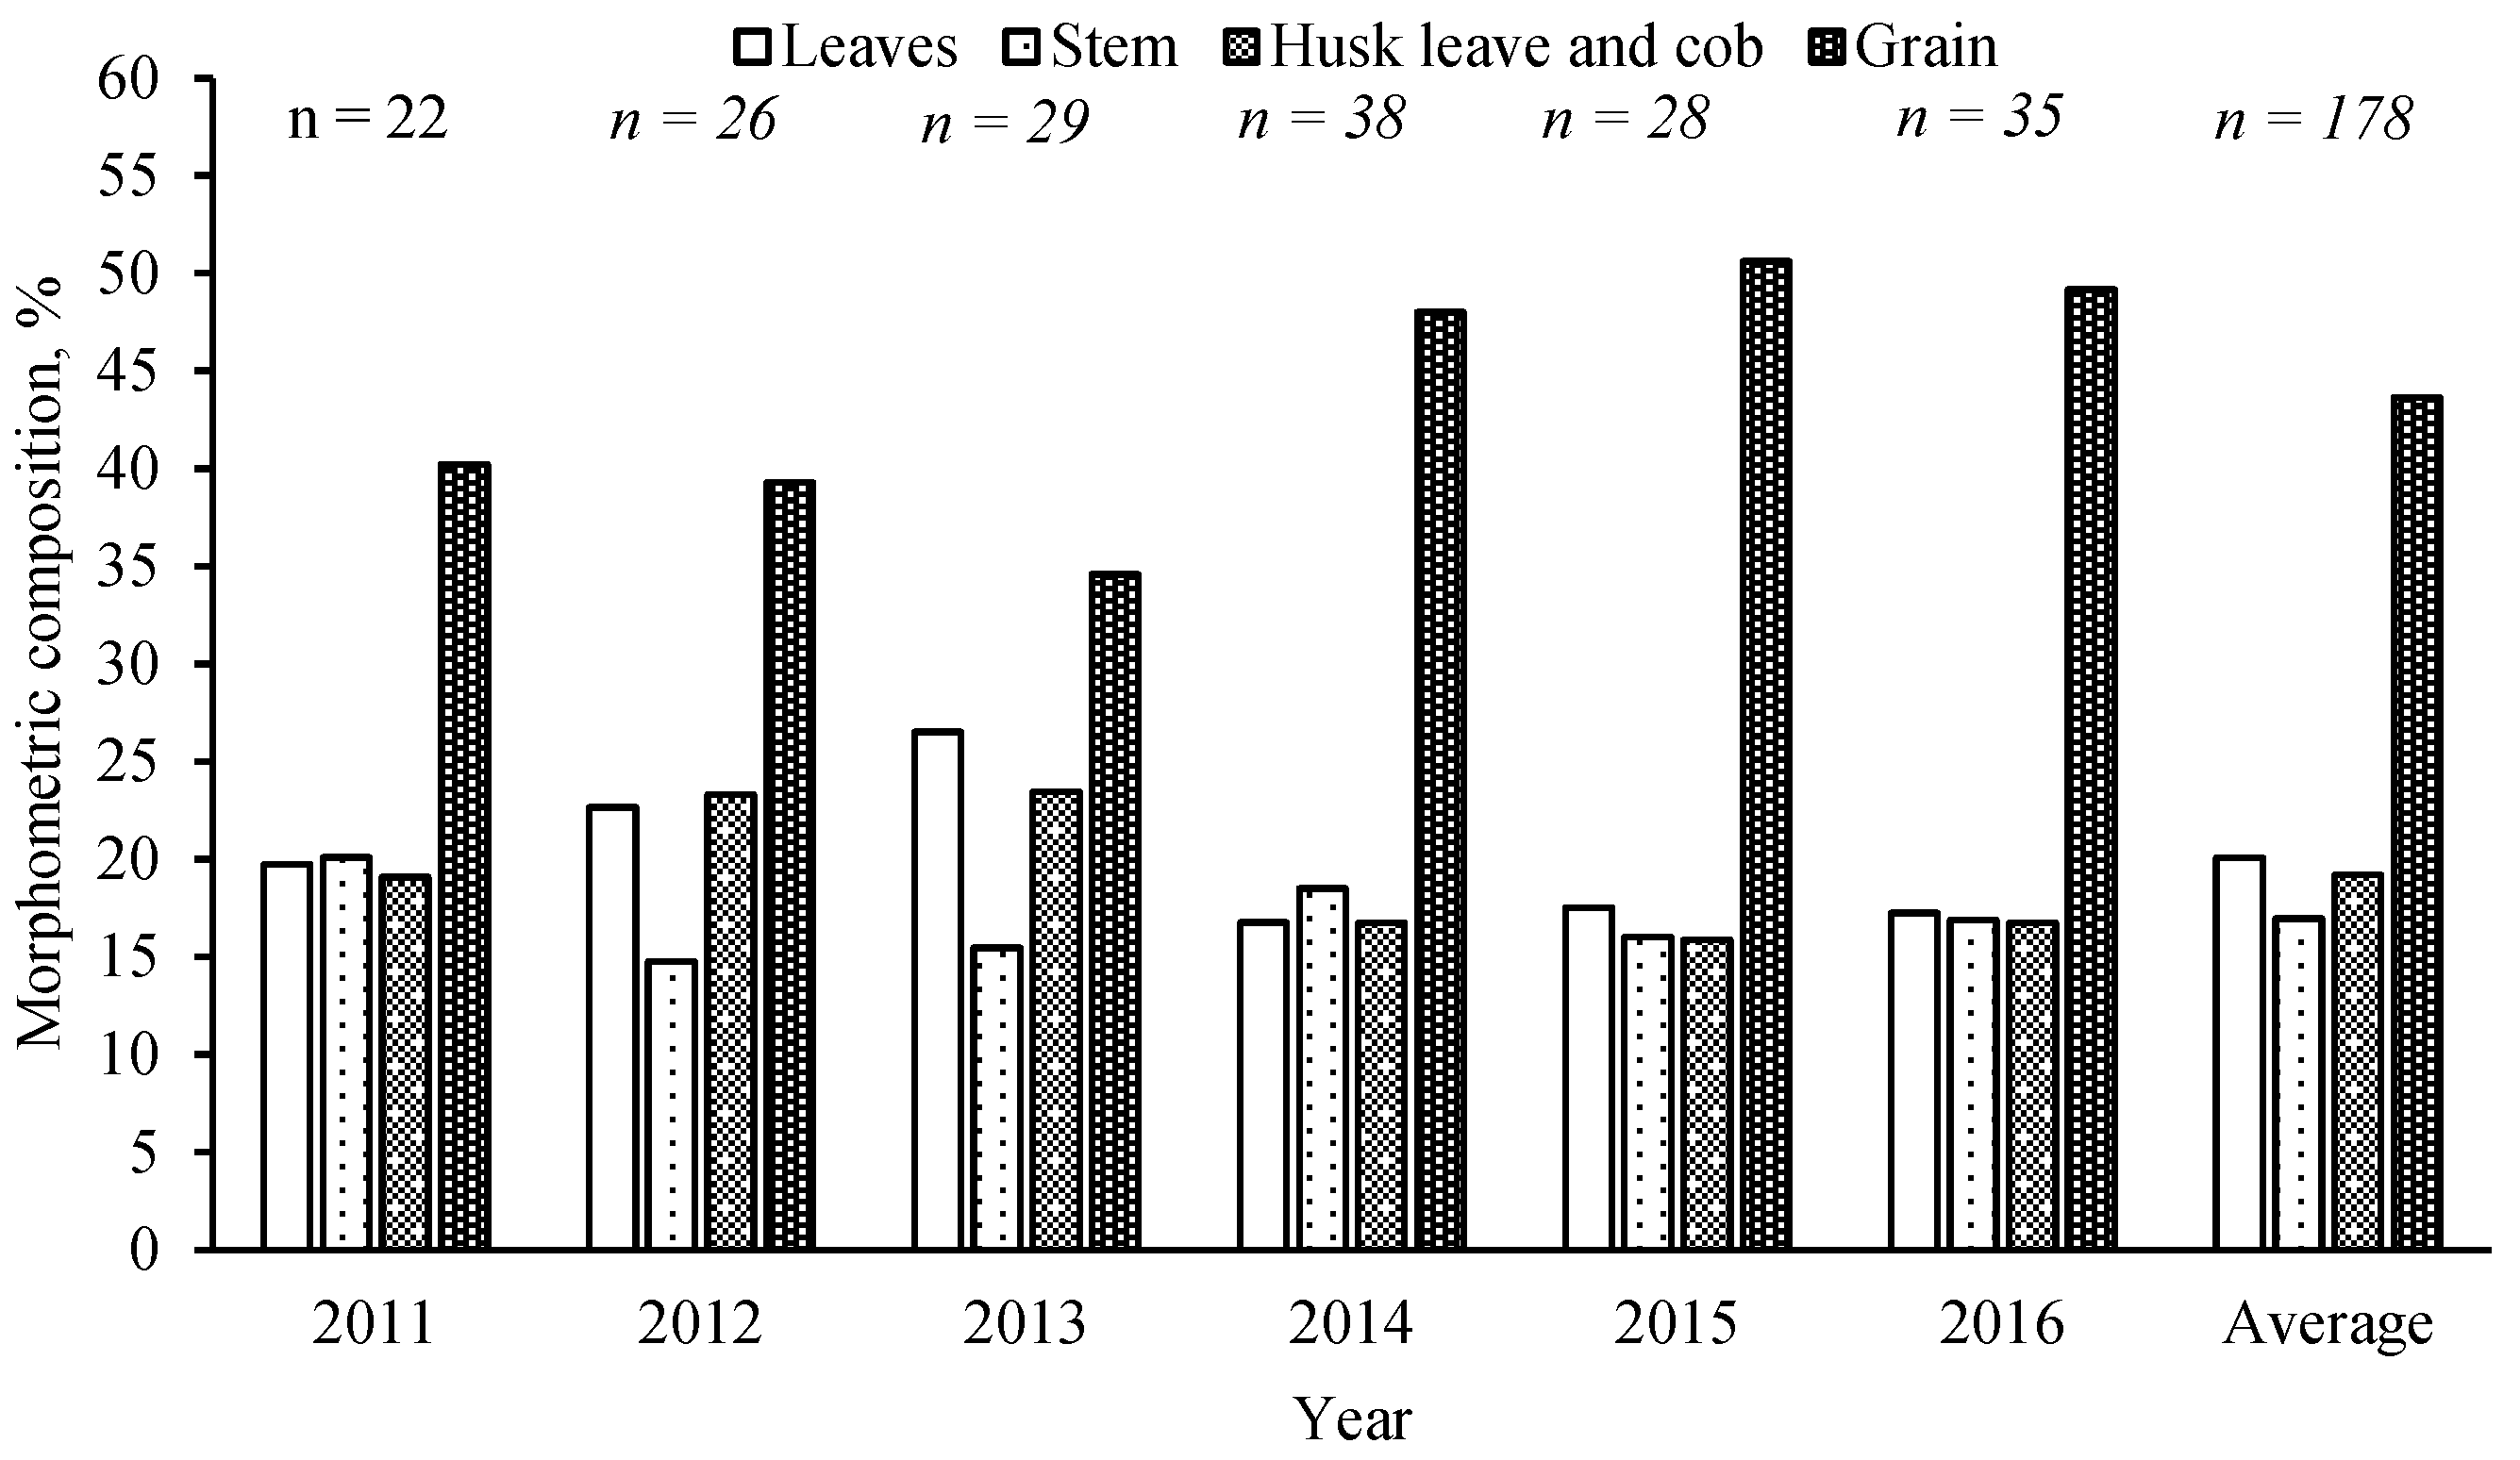
A relevant concentration of starch and good fiber digestibility are desirable for corn silage of good nutritional value. It is evident that advancing the maturity stage generates an increase in total starch; however, it reduces fiber digestibility [10], and, therefore, the vegetative fractions of the corn plant require careful analysis as they vary according to the hybrid, fertilizer levels, and harvest time [37]. The nutritional value of the stem and leaves is extensively studied, for example, in BMR hybrids, but husk leaves and cob are still little discussed, which, seemingly, is a mistake since, in our monitoring, they made up 19% of the participation in the whole plant. Studies on earlage and snaplage have emphasized this issue [7].
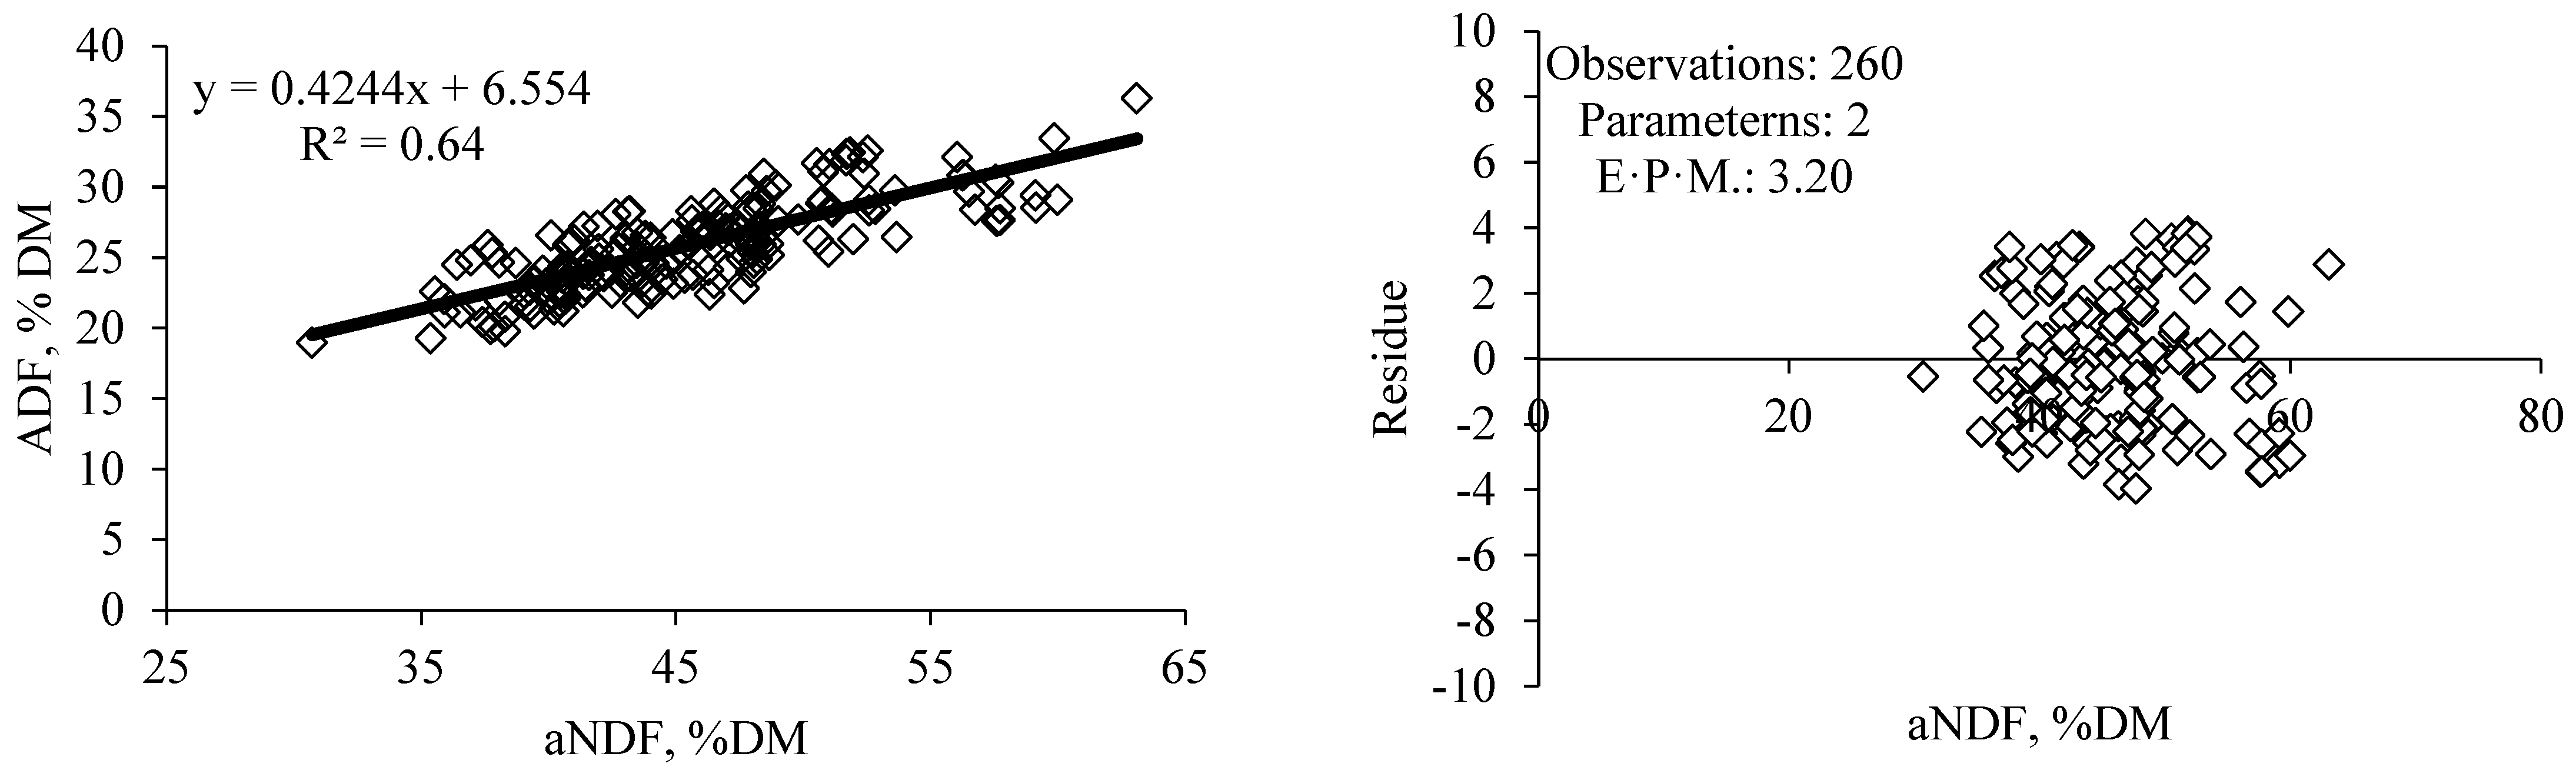
The fiber contents described in our study are close to those suggested in the food libraries of the main diet formulation programs but with lower values of crude protein (~1.0–1.5 less), which was expected due to the advanced stage of plants at harvest.
Starch is the main energy fraction in corn silage, and its participation on the chemical composition is inversely proportional to the participation of aNDF and ADF [37], mainly after ¼ of the milk line. Therefore, it is nutritionally desirable that corn silage has low levels of fiber and that it has satisfactory digestibility. Corn silage is typically composed of 40 to 50% aNDF, and this content and its digestibility affect energy intake and subsequent performance of animals fed silage-based diets [38]. However, corn silage fermentation parameters, such as pH, volatile fatty acid content, and ammonia levels, can also influence intake, compromising animal performance.
The pH is one of the main parameters for evaluating the fermentative quality of silages. Cherney et al. [39] reported that corn silage with low fiber content and pH <4.2 is considered adequately ensiled. Under tropical conditions or at high temperatures, silage pH tends to be higher because they exhibit a more heterolactic fermentation [8]. In our monitoring, only 2.5% of the silages sampled had a pH >4.2, which may be a reflection of the CFA climate (Köppen classification) in southern Brazil. If low pH silage indicates a higher concentration of lactic acid, on the other hand, lower aerobic stability can be commonly observed in this type of silage [40] due to the lower concentration of antifungal compounds [41]. According to the technical details, this seems to be a common problem for farmers in the region.
Higher DM losses are often observed in the peripheral regions of the silo, especially in the upper layer, where compaction and sealing are less efficient and O2 infiltration is greater. These losses have already been correlated with silage pH values [16]. As highlighted by Daniel et al. [7], the number of contractors with self-propelled harvesters has increased significantly in Brazil, which generates numerous benefits due to better processing capacity of the whole plant; however, when the harvest speed exceeds the silo compaction capacity due to the high yield of harvesters, compaction is less efficient and can lead to significant losses. Therefore, for less damage to be detected in these cases, investments in compaction and silo sealing should not be neglected.
Generally, the production of corn silage in Brazil should not be a reflection of the reality observed in just a few regions and/or in dairy farms, even if the greatest amount of information comes from them. We have shown, over ten years, that corn silage production on beef cattle farms in southern Brazil has already overcome those main problems highlighted by Carvalho et al. [16] and today faces specific challenges.

5. Conclusions

The time of harvest and the difference between the specific density of the lower and upper strata of the silo observed in some farms are problems related to the outsourcing of the silage-making process and, therefore, some of the factors that should demand greater attention from farmers. The use of heavier tractors and/or a greater number of tractors used for compaction can improve the process.
Above all, it is clear that there have been no significant advances in the results obtained over these ten years, raising concerns about interventions in the process. Advances in corn cultivation and silage production technology, including fertilizer formulas and application, precision chop forage harvesters, inoculants, and other chemical additives for silage, polyethylene sheeting, and shear cutting silo unloaders, can assist in the necessary improvements.
Historical results of bromatological evaluations of the corn plant, and not exclusively of the silage, must be considered by the farmers in the choice of the corn hybrid until the harvest moment, especially starch and fiber.

Author Contributions

Conceptualization, E.H.H. and M.N.; methodology, E.H.H. and M.N.; validation, E.H.H. and M.N.; formal analysis, E.H.H.; investigation, E.H.H. and M.N.; resources, E.H.H. and M.N.; data curation, E.H.H. and M.N.; writing—original draft preparation, E.H.H.; writing—review and editing, E.H.H. and M.N.; visualization, E.H.H. and M.N.; supervision, E.H.H. and M.N.; project administration, E.H.H. and M.N.; funding acquisition, E.H.H. and M.N. All authors have read and agreed to the published version of the manuscript.

Funding

This research received no external funding.

Institutional Review Board Statement

Not applicable.

Data Availability Statement

Not applicable.

Acknowledgments

The authors thank all the farmers for their kind collaboration. To Cooperaliança® for the support during these 10 years of study. To the staff of the Animal Production Center at UNICENTRO for helping with the analyses.

Conflicts of Interest

The authors declare no conflict of interest.

References

  1. Instituto Brasileiro de Geografia e Estatística. Censo Agropecuário 2006: Resultados Preliminares. Available online: https://censoagro2017.ibge.gov.br/templates/censo_agro/resultadosagro/pecuaria.html (accessed on 21 February 2021).
  2. Oliveira, C.A.; Millen, D.D. Survey of the nutritional recommendations and management practices adopted by feedlot cattle nutritionists in Brazil. Anim. Feed. Sci. Technol. 2014, 197, 64–75. [Google Scholar] [CrossRef]
  3. Bernardes, T.F.; Rêgo, A.C. Study on the practices of silage production and utilization on Brazilian dairy farms. J. Dairy Sci. 2014, 97, 1852–1861. [Google Scholar] [CrossRef] [PubMed]
  4. Lima, L.M.; Bastos, M.S.; Ávila, C.L.; Ferreira, D.D.; Casagrande, D.R.; Bernardes, T.F. Factors determining yield and nutritive value of maize for silage under tropical conditions. Grass Forage Sci. 2022, 1–15. [Google Scholar] [CrossRef]
  5. Bernardes, T.; Schmidt, P.; Daniel, J.L.P.; Figueira, J. An overview of silage production and utilization in Brazil. In Proceedings of the International Silage Conference, Piracicaba, Brazil, 1–3 July 2015; pp. 124–144. [Google Scholar]
  6. Adesogan, A.T. Challenges of tropical silage production. In Proceedings of the 15th International Silage Conference, Madison, WI, USA, 27–29 July 2009; University of Wisconsin: Madison, WI, USA; pp. 139–154. [Google Scholar]
  7. Daniel, J.L.P.; Bernardes, T.F.; Jobim, C.C.; Schmidt, P.; Nussio, L.G. Production and utilization of silages in tropical areas with focus on Brazil. Grass Forage Sci. 2019, 74, 188–200. [Google Scholar] [CrossRef]
  8. Bernardes, T.F.; Daniel, J.L.P.; Adesogan, A.T.; McAllister, T.A.; Drouin, P.; Nussio, L.G.; Cai, Y. Silage review: Unique challenges of silages made in hot and cold regions. J. Dairy Sci. 2018, 101, 4001–4019. [Google Scholar] [CrossRef]
  9. Oliveira, I.L.; Lima, L.M.; Casagrande, D.R.; Lara, M.A.S.; Bernardes, T.F. Nutritive value of corn silage from intensive dairy farms in Brazil. Braz. J. Anim. Sci. 2017, 46, 494–501. [Google Scholar] [CrossRef]
  10. Horst, E.H.; Bumbieris Junior, V.H.; Neumann, M.; López, S. Effects of the Harvest Stage of Maize Hybrids on the Chemical Composition of Plant Fractions: An Analysis of the Different Types of Silage. Agriculture 2021, 11, 786. [Google Scholar] [CrossRef]
  11. D’Amours, L.; Savoie, P. Density profile of corn silage in bunker silos. In 2004 ASAE Annual Meeting; American Society of Agricultural and Biological Engineers: St. Joseph, MI, USA, 2004. [Google Scholar]
  12. Lammers, B.P.; Buckmaster, D.R.; Heinrichs, A.J. A simple method for the analysis of particle sizes of forage and total mixed rations. J. Dairy Sci. 1996, 79, 922–928. [Google Scholar] [CrossRef]
  13. American Society of Agriculture Engineers—ASAE. Method of Determining and Expressing Particle Size of Chopped Forage Materials by Screening, Publ. No. S424; ASAE: St. Joseph, MI, USA, 1988. [Google Scholar]
  14. Association of Official Analytical Chemists—AOAC. Official Methods of Analysis, 16th ed.; AOAC International: Washington, DC, USA, 1995. [Google Scholar]
  15. Goering, H.K.; Van Soest, P.J. Forage Fiber Analysis: Apparatus Reagents, Procedures and Some Applications; Agricultural Handbook; Agricultural Research Service: Washington, DC, USA, 1970; pp. 1–20. [Google Scholar]
  16. Carvalho, I.Q.D.; Jobim, C.C.; Osmari, M.P.; Daniel, J.L.P. Occurrence of visible losses and relationship with corn silage management in dairy farms in the State of Paraná. Acta Sci. Anim. Sci. 2020, 43. [Google Scholar] [CrossRef]
  17. Nied, A.H.; Heldwein, A.B.; Estefanel, V.; Silva, J.C.D.; Alberto, C.M. Sowing dates of corn with lower risk of water defifcit in Santa Maria, RS, Brazil, Brasil. Cienc. Rural 2005, 35, 995–1002. [Google Scholar] [CrossRef]
  18. Bastos, M.; Lima, L.M.; Gusmão, J.; Cardoso, M.; Chiarini, T.; Avila, C.; Bernardes, T.F. A survey of maize hybrids for wholeplant silage in a hot climate. In Proceedings of the XVIII International Silage Conference, Bonn, Germany, 24–26 July 2018; Gerlach, K., Südekum, K.-H., Eds.; pp. 458–459. [Google Scholar]
  19. Carvalho, I.Q.; Carbonare, M.S.D. Selection of maize silage hybrids—Agronomic and nutritional traits. In Proceedings of the V International Symposium on Forage Quality and Conservation, Piracicaba, Brazil, 16–17 July 2017; Nussio, L.G., Sousa, D.O., Gritti, V.C., Salvati, G.G.S., Santos, W.P., Salvo, P.A.R., Eds.; pp. 91–106. [Google Scholar]
  20. Fernandes, J.; da Silva, É.B.; de Almeida Carvalho-Estrada, P.; Daniel, J.L.P.; Nussio, L.G. Influence of hybrid, moisture, and length of storage on the fermentation profile and starch digestibility of corn grain silages. Anim. Feed Sci. Technol. 2021, 271, 114707. [Google Scholar] [CrossRef]
  21. Liu, Y.; Wang, G.; Wu, H.; Meng, Q.; Khan, M.Z.; Zhou, Z. Effect of Hybrid Type on Fermentation and Nutritional Parameters of Whole Plant Corn Silage. Animals 2021, 11, 1587. [Google Scholar] [CrossRef] [PubMed]
  22. Ke, F.; Ma, X. Responses of maize hybrids with contrasting maturity to planting date in Northeast China. Sci. Rep. 2021, 11, 15776. [Google Scholar] [CrossRef] [PubMed]
  23. Opsi, F.; Fortina, R.; Borreani, G.; Tabacco, E.; López, S. Influence of cultivar, sowing date and maturity at harvest on yield, digestibility, rumen fermentation kinetics and estimated feeding value of maize silage. J. Agric. Sci. 2013, 151, 740–753. [Google Scholar] [CrossRef]
  24. EMBRAPA. Levantamento de Cultivares de Milho para o Mercado de Sementes: Safra 2020/2021; Embrapa Milho e Sorgo: Sete Lagoas, Brazil, 2021. [Google Scholar]
  25. Haddadi, M.H.; Mohseni, M. Plant density effect on silage yield of maize cultivars. J. Agric. Sci. 2016, 8, 186. [Google Scholar] [CrossRef]
  26. Cox, W.J.; Cherney, D.J. Row spacing, plant density, and nitrogen effects on corn silage. Agron. J. 2001, 93, 597–602. [Google Scholar] [CrossRef]
  27. Cox, W.J.; Hanchar, J.J.; Knoblauch, W.A.; Cherney, J.H. Growth, yield, quality, and economics of corn silage under different row spacings. Agron. J. 2006, 98, 163–167. [Google Scholar] [CrossRef]
  28. Barbieri, P.A.; Rozas, H.N.R.S.; Andrade, F.H.; Echeverria, H.N.E. Row spacing effects at different levels of nitrogen availability in maize. Agron. J. 2000, 92, 283–288. [Google Scholar] [CrossRef]
  29. EEC. Council Directive 91/676/EEC of 12 December 1991 concerning the protection of waters against pollution caused by nitrates from agricultural sources. Off. J. Eur. Commun. 1991, L375, 1–8. [Google Scholar]
  30. Almodares, A.; Jafarinia, M.; Hadi, M.R. The effects of nitrogen fertilizer on chemical compositions in corn and sweet sorghum. Am.-Eur. J. Agric. Environ. Sci. 2009, 6, 441–446. [Google Scholar]
  31. Masoero, F.; Gallo, A.; Zanfi, C.; Giuberti, G.; Spanghero, M. Effect of nitrogen fertilization on chemical composition and rumen fermentation of different parts of plants of three corn hybrids. Anim. Feed Sci. Technol. 2011, 164, 207–216. [Google Scholar] [CrossRef]
  32. Ferraretto, L.F.; Shaver, R.D. Meta-analysis: Effect of corn silage harvest practices on intake, digestion, and milk production by dairy cows. Prof. Anim. Sci. 2012, 28, 141–149. [Google Scholar] [CrossRef]
  33. Johnson, L.M.; Harrison, J.H.; Davidson, D.; Mahanna, W.C.; Shinners, K.; Linder, D. Corn silage management: Effects of maturity, inoculation, and mechanical processing on pack density and aerobic stability. J. Dairy Sci. 2002, 85, 434–444. [Google Scholar] [CrossRef]
  34. Andrae, J.G.; Hunt, C.W.; Pritchard, G.T.; Kennington, L.R.; Harrison, J.H.; Kezar, W.; Mahanna, W. Effect of hybrid, maturity, and mechanical processing of corn silage on intake and digestibility by beef cattle. J. Anim. Sci. 2001, 79, 2268–2275. [Google Scholar] [CrossRef] [PubMed]
  35. Heinrichs, J.; Kononoff, P. Evaluating Particle Size of Forages and TMRs Using the Penn State Particle Size Separator; Department of Dairy and Animal Sc, The Pennsylvania State University: State College, PA, USA, 1996. [Google Scholar]
  36. Salvati, G.G.S.; Santos, W.P.; Silveira, J.M.; Gritti, V.C.; Arthur, B.A.V.; Salvo, P.A.R.; Nussio, L.G. Impact of kernel processing and particle size in whole plant corn silage on the performance of dairy cows. In Proceedings of the V International Symposium on Forage Quality and Conservation, Piracicaba, Brazil, 5 May 2017; Nussio, L.G., Sousa, D.O., Gritti, V.C., Salvati, G.G.S., Santos, W.P., Salvo, P.A.R., Eds.; 2017. [Google Scholar]
  37. Horst, E.H.; López, S.; Neumann, M.; Giráldez, F.J.; Bumbieris Junior, V.H. Effects of hybrid and grain maturity stage on the ruminal degradation and the nutritive value of maize forage for silage. Agriculture 2020, 10, 251. [Google Scholar] [CrossRef]
  38. Tharangani, R.M.H.; Yakun, C.; Zhao, L.S.; Ma, L.; Liu, H.L.; Su, S.L.; Bu, D.P. Corn silage quality index: An index combining milk yield, silage nutritional and fermentation parameters. Anim. Feed Sci. Technol. 2021, 273, 114817. [Google Scholar] [CrossRef]
  39. Cherney, D.J.R.; Cherney, J.H.; Cox, W.J. Fermentation characteristics of corn forage ensiled in mini-silos. J. Dairy Sci. 2004, 87, 4238–4246. [Google Scholar] [CrossRef]
  40. McDonald, P.; Henderson, A.R.; Heron, S.J.E. The Biochemistry of Silage, 2nd ed; Chalcombe Publications: Bucks, UK, 1991. [Google Scholar]
  41. Borreani, G.; Tabacco, E. The relationship of silage temperature with the microbiological status of the face of corn silage bunkers. J. Dairy Sci. 2010, 93, 2620–2629. [Google Scholar] [CrossRef]
Figure 1. Cycle in days after sowing (DAS) of corn cultivated for silage production in ten summer crops (2011–2020) in the state of Paraná, Brazil. Maximum value, mean (±SD), and minimum value.
Agriculture 12 01200 g001
Figure 2. Average fertilization levels of summer crops sampled between 2013 and 2017. (A) Baseline fertilization in kilograms of N, P2O5, and K2O per ha. (B) Coverage fertilization in kilograms of N per ha (bar) and percentage of producers who made one or two applications (rows). (C) Level of N used in one or two applications.
Agriculture 12 01200 g002
Figure 3. Plotting the equation fit and residues for estimating the DM content of the corn plant through the DM of the grains at the time of harvest. Data from 318 samples, collected from 63 farms in 16 municipalities in the state of Paraná, Brazil between 2011 and 2020.
Agriculture 12 01200 g003
Figure 4. Centesimal morphometric composition of the corn plant from crops cultivated for silage production in the state of Paraná, Brazil between the years 2011 and 2016.
Agriculture 12 01200 g004
Figure 5. Plotting the equation fit and residues for estimating the ADF content of corn silage through aNDF. Data from 260 samples, collected from 65 farms in 18 municipalities in the state of Paraná, Brazil between 2011 and 2019.
Agriculture 12 01200 g005
Table 1. Collection sites for whole plant samples at the time of harvesting for silage. Number (n) of samples and farms per site in 10 years of sampling.
MunicipalityLatitudeLongitudeAltitudeSamplesFarmsYear
Campina do Simão−251,025−518,1471015n = 12n = 032011/2013/2014/2015/2016/2017/2018/2019/2020
Campo Mourão−240,412−523,811597n = 01n = 012013
Cândido de Abreu−245,646−513,325511n = 05n = 012012/2014/2018/2019/2020
Candói−255,679−520,554925n = 64n = 122011/2012/2013/2014/2015/2016/2017/2018/2019/2020
Cascavel−249,537−534,597769n = 03n = 022017/2018
Castro−247,954−500,028978n = 02n = 012011/2016
Cruzeiro do Sul−229,651−521,639454n = 01n = 012012
Espigão Alto do Iguaçu−254,266−528,382586n = 08n = 022011/2013/2014/2015/2016/2017/2018/2020
Goioxim−252,015−520,055889n = 01n = 012018
Guarapuava−253,935−514,6341110n = 100n = 202011/2012/2013/2014/2015/2016/2017/2018/2019/200
Nova Prata do Iguaçu−256,318−533,479490n = 06n = 012011/2016/2017/2018/2019/2020
Pinhão−256,962−516,4821051n = 78n = 122011/2012/2013/2014/2015/2016/2017/2018/2019/2020
Pitanga−247,527−517,631884n = 08n = 012011/2013/2014/2015/2016/2018/2019/2020
Quedas do Iguaçu−254,567−529,098561n = 01n = 012014
Reserva do Iguaçu−258,309−520,287951n = 02n = 022012
Turvo−250,401−515,3271046n = 20n = 022011/2012/2013/2014/2015/2016/2017/2018/2019/2020
Total n = 312n = 632011–2020
All municipalities belong to the CFA region: humid subtropical climate (Köppen).
Table 2. Locations for collecting corn silage samples. Number (n) of samples and farms per site in 10 years of sampling.
MunicipalityLatitudeLongitudeAltitudeSamplesFarmsYear
Ângulo−231,929−519,173438n = 02n = 012014/2018
Campina do Simão−251,025−518,1471015n = 14n = 02 2014/2015/2016/2017/2018/2019
Cândido de Abreu−245,646−513,325511n = 01n = 01 2019
Candói−255,679−520,554925n = 100n = 122011/2012/2013/2014/2015/2016/2017/2018/2019
Cascavel−249,537−534,597769n = 04n = 032011/2012/2019
Castro−247,954−500,028978n = 02n = 01 2014/2017
Cruzeiro do Sul−229,651−521,639454n = 01n = 012013
Espigão Alto do Iguaçu−254,266−528,382586n = 19n = 022011/2012/2013/2014/2015/2016/2017/2019
Guarapuava−253,935−514,6341110n = 141n = 19 2011/2012/2013/2014/2015/2016/2017/2018/2019
Laranjeiras do Sul−254,016−524,088839n = 02n = 01 2011/2012
Nova Prata do Iguaçu−256,318−533,479490n = 08n = 01 2012/2013/2014/2016/2017/2019
Palmeira−254,185−500,032867n = 02n = 01 2011/2013
Pinhão−256,962−516,4821051n = 75n = 102011/2012/2013/2014/2015/2016/2017/2018/2019
Pitanga−247,527−517,631884n = 03n = 01 2014/2019
Reserva do Iguaçu−258,309−520,287951n = 32n = 022011/2012/2013/2014/2015/2016/2017/2018/2019
Tamarana−237,151−510,985755n = 08n = 01 2014/2016/2017/2018
Turvo−250,401−515,3271046n = 29n = 032011/2012/2013/2014/2015/2016/2017/2018/2019
Ventania−242,441−502,4761006n = 02n = 012014/2017
Total n = 449n = 652011–2019
All municipalities belong to the CFA region: humid subtropical climate (Köppen).
Table 3. Corn hybrids used in the state of Paraná, Brazil in crops cultivated for silage production in ten summer crops (2011–2020).
CompanyNumber of HybridsApparition, %Hybrid *Apparition, nApparition, %CycleGrain Type
Pioneer1869.1%30B396223.9%ESH
30R505119.7%ESH
30F53218.1%ESH
P4285114.2%EH
P301693.5%EH
32R2251.9%SESH
P345631.2%ESH
P250131.2%SESH
Agroceres69.7%AG9025124.6%SESH
AG802541.5%EF
AG801131.2%EF
AG869031.2%ESH
Syngenta65.8%Feroz51.9%EH
Status41.5%EH
Agroeste53.9%AS165631.2%ESH
BioGene34.2%BG706072.7%ESH
Brevante11.5%2B68841.5%ESH
Dekalb31.5%-
Forseed21.5%-
Coodetec21.2%-
Limagrain20.8%-
Morgan10.8%-
Outros3218.9%
Total49100% 259100%
* Companies without hybrid exemplaries (-) means none of them had an appearance (n) greater than two. E = early; SE = super early; H = hard; SH = semihard; F = flint
Table 4. Planting, harvesting, and morphometric characteristics of corn plants cultivated in the state of Paraná, Brazil for silage production between the years 2011 and 2020.
YearRow Spacing, cmDensity, plants ha−1Harvest Height, cmPlant Height, mCob Height, mYellow Leafs
X (min.max) Moda X (min.max) X (min.max) X (min.max) X (min.max) X (min.max)
201150 (45–90)4573.279 (58.000–87.555)35 (21–53)2.14 (1.82–2.45)1.08 (0.74–1.38)3.0 (1.0–6.7)
201261 (40–80)4573.553 (55.000–88.888)-2.26 (1.64–2.68)1.17 (0.73–1.65)-
201358 (40–100)4573.454 (45.444–85.000)-2.23 (1.63–2.65)1.12 (0.70–1.85)3.7 (1.4–6.4)
201452 (40–100)4574.587 (61.500–89.555)34 (20–50)2.27 (1.83–3.00)1.22 (0.79–1.70)3.4 (0.0–10.6)
201549 (40–80)4578.348 (68.500–93.333)-2.19 (1.72–2.74)1.10 (0.73–1.45)-
201650 (40–90)4573.379 (58.000–87.555)35 (21–53)2.14 (1.82–2.45)1.08 (0.74–1.38)3.0 (1.0–6.7)
201745 (40–50)4574.401 (55.555–98.000)39 (26–50)2.54 (1.77–3.25)1.41 (0.67–1.72)5.7 (0.2–12.0)
2018-------
201948 (45–80)4573.477 (55.035–87.110)37 (29–70)2.54 (2.14–2.98)1.39 (1.15–1.63)4.1 (1.6–6.8)
202047 (45–80)4572.766 (59.167–87.110)37 (29–70)2.55 (1.79–2.98)1.38 (0.80–1.63)4.0 (1.6–6.8)
Mean51 4574.099 362.331.233.9
Table 5. Plant and grain DM content (mean ± SD) of corn plants at harvest time for silage production, cultivated in the state of Paraná, Brazil between the years 2011 and 2020.
YearnDM of the PlantDM of the Grain
X ¯ ± DP min.–max X ¯ ± DP min.–max
20112244.5 ± 5.7(31.7–54.6)68.3 ± 5.3(56.0–81.9)
20122640.1 ± 5.7(28.8–53.4)61.3 ± 6.0(47.2–70.9)
20133245.9 ± 5.7 (38.2–60.0)65.8 ± 9.4(23.0–82.5)
20143841.7 ± 6.9(29.1–63.7)65.3 ± 6.1(52.6–84.5)
20152842.7 ± 5.9(34.6–63.4)64.5 ± 6.2(55.7–84.4)
20163444.5 ± 5.7(31.7–54.6)68.3 ± 5.3(56.0–81.9)
20173640.4 ± 3.0(34.5–46.5)65.6 ± 2.5(59.4–69.8)
20183142.7 ± 5.3(35.1–54.8)66.5 ± 3.7(56.3–74.2)
20193340.9 ± 5.3(34.3–56.3)62.7 ± 5.3(49.6–74.8)
20203841.0 ± 4.3(34.3–53.3)62.8 ± 4.9(49.6–71.9)
Mean3242.4 ± 5.7 65.2 ± 6.0
Table 6. Yield of fresh, dry biomass, and grains (mean/min–max) of corn crops cultivated for silage in the state of Paraná, Brazil in ten summer crops (2011–2020).
YearFresh Biomass, kg ha−1Dry Biomass, kg ha−1Grains, kg ha−1
201156,506 (38,298–69,966)24,898 (16,996–31,668)10,008
201262,190 (44,121–83,050)24,752 (16,151–34,157)9727
201355,965 (32,866–79,839)25,538 (13,514–37,205)8836
201466,813 (41,933–89,004)28,021 (15,833–42,124)13,450
201557,475 (42,505–81,162)24,480 (17,320–42,802)12,386
201656,506 (38,298–69,966)24,898 (16,996–31,668)12,249
201758,974 (31,440–79,419)23,662 (11,038–31,676)-
2018---
201959,715 (45,635–73,964)24,143 (18,787–30,159)-
202059,921 (42,304–73,964)24,274 (15,961–30,159)-
Mean56,91325,00711,109
Table 7. Particle separation (%) by Penn State sieve and mean particle size (mean ± SD/min–max) of corn silages sampled in the state of Paraná, Brazil in ten summer crops (2011–2020).
YearSieve 19 mmSieve 8 mmBottom Mean Size
X ¯ ± DP min–max X ¯ ± DP min–max X ¯ ± DP min–máx X ¯ ± DP min–max
20118.1 ± 5.2(2.6–20.8)62.1 ± 7.4(45.0–73.6)29.0 ± 7.6 (15.6–43.4)12.0 ± 1.8 (8.1–15.5)
20124.2 ± 2.3(0.4–9.8)53.4 ± 9.1(33.6–74.0)42.3 ± 8.1 (22.9–60.0)10.1 ± 0.7 (8.6–11.6)
20134.9 ± 4.2(0.7–14.4)55.9 ± 9.4(31.5–72.0)39.7 ± 11.1(17.3–65.8)10.5 ± 1.8 (7.7–14.3)
20143.7 ± 2.0(0.4–8.0)53.0 ± 8.8(33.2–68.4)42.4 ± 9.6 (24.7–61.4)9.9 ± 1.0 (7.8–12.0)
20154.2 ± 4.7(0.8–28.8)58.7 ± 7.1(41.9–72.5)37.2 ± 8.0(20.0–57.0)10.5 ± 1.5(8.1–17.4)
20167.4 ± 15.2(0.0–75.3)57.9 ± 11.6 (16.6–71.7)34.7 ± 9.2(10.1–51.7)11.5 ± 3.9 (8.8–28.5)
20176.0 ± 5.5(1.2–23.6)57.0 ± 8.5 (34.0–70.4)37.1 ± 7.6(28.3–59.8)10.9 ± 1.5 (9.0–15.0)
2018- - - -
20196.9 ± 3.8(1.4–15.4)63.3 ± 4.5 (57.5–72.5)29.8 ± 5.0(22.7–38.4)11.8 ± 1.1 (10.0–14.2)
20207.1 ± 4.8(0.5–20.6)60.3 ± 5.7 (44.3–71.0)31.6 ± 7.4(6.3–52.0)11.6 ± 1.4 (9.1–15.4)
Mean5.9 58.0 36.0 11.0
Table 8. Nutritional value of corn silages (mean ± SD) sampled in the state of Paraná, Brazil in ten summer crops (2011–2020).
YearnDMAshCPaNDFADFLignin (sa)
20112639.5 ± 4.31.8 ± 0.57.0 ± 1.449.6 ± 5.928.6 ± 3.1-
20122440.1 ± 4.52.2 ± 0.35.6 ± 0.851.7 ± 5.927.6 ± 2.1-
20132440.2 ± 6.33.4 ± 1.35.9 ± 1.251.2 ± 6.429.1 ± 4.6-
20143242.1 ± 5.72.7 ± 1.25.7 ± 0.945.1 ± 7.024.0 ± 4.93.6 ± 1.3
20153937.9 ± 6.32.5 ± 0.66.2 ± 0.943.9 ± 6.625.3 ± 5.7-
20163336.0 ± 6.12.4 ± 0.57.4 ± 1.145.5 ± 5.627.4 ± 4.3-
20174040.3 ± 6.32.3 ± 0.67.9 ± 1.144.9 ± 4.426.8 ± 4.6-
20183541.4 ± 5.02.7 ± 0.76.8 ± 1.545.3 ± 4.425.6 ± 4.5-
2019-------
20203337.8 ± 4.53.4 ± 0.87.0 ± 1.143.2 ± 4.523.7 ± 2.44.5 ± 1.0
Mean3039.32.66.945.626.24.1
Table 9. Corn silages’ pH index (mean ± SD) sampled in the state of Paraná, Brazil in ten summer crops (2011–2020).
Year X ¯ ± DP CI (p > 95%)<3.83.8–2>4.2
%n%n%n
20114.03 ± 0.043.99–4.060.0096.2253.8 1
20123.86 ± 0.123.81–3.9141.71058.3140.00
20133.95 ± 0.15 3.89–4.0120.8575.0184.21
20143.94 ± 0.113.90–3.9812.5487.5280.00
20154.01 ± 0.273.92–4.0912.8584.6332.61
20163.95 ± 0.203.88–4.0212.1481.8276.12
20174.03 ± 0.383.91–4.150.0095.0355.02
2018--- - -
2019--- - -
20203.85 ± 0.303.75–3.9545.51551.5173.01
Mean3.99 ± 0.263.96–4.0314.5%4383.0%1972.5%8
CI: confidence index.
Table 10. Mean canvas thickness (CI–P >95%) and specific gravity of silage from silos sampled in the state of Paraná, Brazil.
YearCanvas Thickness, µmInferiorSuperior
MeanCIKg de MV m−3Kg de MS m−3Kg de MV m−3Kg de MS m−3
2011132127–137575225448174
2012118114–122686271606243
2013125114–136646256563227
2014------
2015166155–176561208488181
2016--610217535190
2017--584222435166
2018------
2019------
2020------
Mean130124–136597225508162
CI: confidence index.
Publisher’s Note: MDPI stays neutral with regard to jurisdictional claims in published maps and institutional affiliations.

