Article

The Endogenous Metabolic Response of Tribolium castaneum under a High Concentration of CO2

1
Guizhou Provincial Key Laboratory for Rare Animal and Economic Insect of the Mountainous Region, Department of Biology and Engineering of Environment, Guiyang University, Guiyang 550005, China
2
College of Life and Environmental Sciences, Hangzhou Normal University, Hangzhou 311121, China
*
Author to whom correspondence should be addressed.
These authors contributed equally to this work.
Agriculture 2022, 12(7), 979; https://doi.org/10.3390/agriculture12070979
Submission received: 25 May 2022 / Revised: 20 June 2022 / Accepted: 29 June 2022 / Published: 7 July 2022
(This article belongs to the Special Issue Insect Ecology and Pest Management in Agriculture)

Abstract

:
High carbon dioxide concentrations can effectively control most storage pests. To estimate the toxicity effect of high concentrations of CO2, four different concentrations of CO2 (25% CO2, 50% CO2, 75% CO2, and 95% CO2) were used to treat Tribolium castaneum, and the biochemical (carbohydrate content and gene expression level) and physiological (mortality, pupation, eclosion rate, and weight) features of insects submitted to different treatments with CO2 were evaluated. The T. castaneum mortality rate was 50% in approximately 2 days when exposed to a treatment with 95% CO2. When the CO2 concentration exceeded 75%, the pupation rate and eclosion rate of T. castaneum seriously declined. Higher than 25% CO2 concentrations resulted in a lower weight and shrunken body size of T. castaneum. It was further found that different CO2 concentration treatments all influenced the levels of the three carbohydrate contents in T. castaneum. In addition, according to the detection of trehalose metabolism pathway-related genes, T. castaneum mainly responds to stress factors via high expression of TPS, TRE1-2, and TRE1-3. Our results enrich the evaluation of the toxicity effect of CO2 treatment on grain storage pests, providing a basis for further improving the method of regulating grain storage to control insect pests.

1. Introduction

Red flour beetle, Tribolium castaneum (Herbst), belonging to the order Coleoptera, is a worldwide grain storage pest [1,2] with a high population growth potential [3]. It feeds on the germ and endosperm of grain kernels and causes damage by contaminating grains through body parts and feces. Once infestation levels are high, its glands secrete a fluid that produces a musty odor carcinogen, benzoquinone, making the grain unfit for consumption [4,5]. Pest control strategies for grain storage rely heavily on fumigation, insecticide spraying, or other chemical treatments, and insecticide-impregnated anoxic multilayer bags are a new and promising method for the low-cost and safe-sealed storage of grains [6,7,8,9]. In addition, nonchemical pest control methods, including low storage temperatures and entomopathogenic fungi, can also prevent the development of stored product pests [10,11]. However, this insect has already shown capacities for developing insecticide resistance, even to the entomopathogenic fungus Beauveria bassiana (Balsamo) [11,12,13,14,15]. Therefore, the development of more specific and less environmentally harmful control methods is particularly urgent to tackle this widespread insect pest.
Ambient atmosphere consists of approximately 79% N2, 20–21% O2, and 0.04% CO2 [16], normal O2 concentration can maintain a level sufficient for insect development, whereas an environment in which the oxygen or carbon dioxide concentration in an ecosystem is lower or higher than the atmospheric concentration is defined as a hypoxic (low O2) or hypercapnic (high CO2) environment. Low-oxygen technology with high concentrations of CO2 and N2 has been applied for many years in the management of grain storage pests [17,18]. This method stores grain in an airtight environment, changing the ratio of gas components in the grain pile by natural or artificial means to achieve conditions of low oxygen, high nitrogen, or high carbon dioxide, inhibiting the respiration of grain pests and microorganisms and the intensity of their metabolic activities, creating an unfavorable environment for the growth of insects and microorganisms, which is beneficial in promoting safe grain storage. Removing oxygen or adding, N2 or CO2 can produce an environment of lower oxygen concentration, in which insects tend to reduce energy consumption by regulating their metabolic rate to cope with the unfavorable environment, whereby the lack of oxygen inevitably leads to inhibition of aerobic respiration and insufficient energy supply, resulting in increased cellular function and even death [19]. With the increase in hypoxia stress, insects adopt different coping or response strategies: (1) under low hypoxia, insects respond by tracheal dilation, reduced feeding, pseudo-death, or even escape [20,21]; (2) under moderate hypoxia, the respiratory metabolism rate of insects is increased, the tracheal cells are increased, and the hypoxia-inducible factor (HIF) transcription regulation system is directly activated in response [19,22,23]; and (3) under high levels of hypoxia, insects regulate energy pathways, such as gluconeogenesis, to reduce energy expenditure [24]. Increased metabolites are mainly carbohydrates, amino acids, and organic acids because of hypoxia, while free fatty acids are decreased [25].
In addition, high CO2 concentrations may cause a decrease in pH in insects, causing damage to the membrane and cellular functions of insects. Meanwhile, a lower pH can also denature enzymes, including antioxidant enzymes required for low-temperature resistance, especially in the absence of additional heat shock proteins (HSPs) as chaperones [16]. Furthermore, high concentrations of CO2 contribute to a decrease in NADPH, which inhibits glutathione production [26]. NADPH and glutathione are involved in preventing the toxicity of reactive oxygen species, while NADPH also facilitates cholesterol synthesis, lipid synthesis, and fatty acid chain extension [27,28]. Moreover, high levels of CO2 are commonly used as anesthetics for insect treatments. In Drosophila melanogaster (Meigen) larvae with intact stomata, high CO2 caused cardiac arrest and blockage of the synaptic transmission at the neuromuscular junction by reducing the number of glutamate receptors [29].
These studies corroborate the fact that the efficiency of pest control can be improved by elevating the CO2 concentration. However, only a few studies have focused on the influence of hypoxia on the different developmental stages of T. castaneum [30,31,32]. In this research, we investigated the toxicity of four different CO2 concentrations on the eighth-instar larvae of T. castaneum, with the objective of providing a reference for further improvement of air-regulated grain storage methods for pest control.

2. Materials and Methods

2.1. Insect Rearing

Tribolium castaneum (Herbst), originating from the Xingyi National Grain Reserve Storage, was continuously bred in the laboratory on whole wheat flour containing 5% yeast in an incubator at 29 ± 1 °C and 65% relative humidity, with a 0:24 LD photoperiod.

2.2. CO2 Treatments

Referring to Pan et al. [33], the 50 eighth-instar larvae (late instar) were placed in a glass bottle before adding 0.05 g of whole wheat flour containing 5% yeast as feed. The bottle was covered and sealed with a rubber plug before introducing a set concentration of CO2 gas (Jingong Special Gas Co., Ltd., Hangzhou, China) through the gas mixer with a catheter, and then stopping the ventilation when the CO2 concentration ratio reached the required level. CO2 concentrations were measured using a SKY2000-CO2-Q Carbon Dioxide Detector (Yuante Technology, Shenzhen, China). The inlet and outlet of the glass bottle were docked and placed in an artificial climate chamber at 65% ± 5% relative humidity and 29 ± 1 °C temperature. Four different high CO2 concentrations were designed as the treatment, while normal air was used as a control in this study. Air treatment for 48 h was labeled as the CK group; 25% CO2 + 75% air treatment for 48 h was labeled as the TA group; 50% CO2 + 50% air treatment for 48 h was labeled as the TB group; 75% CO2 + 25% air treatment for 48 h was labeled as the TC group; and 95% CO2 + 5% air treatment for 48 h was labeled as the TD group. These treatments were repeated three times.
Mortality was recorded at 24 h intervals until all test insects became adults or died. When the test insects underwent pupation or eclosion, the pupation rate and the eclosion rate were recorded. According to the mortality statistics, the mortality rate was about 50% at 5% air + 95% CO2 treatment for 48 h, which ensured the collection of insects collected; hence, we chose these samples for follow-up experiments.
Larvae in the TD treatment were collected with the objective of assaying carbohydrate content, enzyme activity, and gene expression levels. A total of 20 larvae were used for carbohydrate content and enzyme activity determination, and 10 larvae were collected to detect gene expression levels with three biological replicates. Furthermore, 20 larvae were collected for weighing, and 5 larvae were randomly collected from each of three replicates for phenotype photographing. If the test larvae were removed from the treated environment for 5 h and did not move after stimulation with a bristle brush, they were considered dead.

2.3. RNA Extraction and cDNA Synthesis

Total RNA was extracted using the TRIzol (Invitrogen, Carlsbad, CA, USA) method with RNase-free imported Eppendorf tubes (EP tubes) and tips, following the manufacturer’s instructions. The integrity of the extracted total RNA was determined using 1% agarose gel electrophoresis, and the concentration and purity of the RNA were determined using a NanoDrop™ 2000 spectrophotometer (Thermo Fisher Scientific, Waltham, MA, USA). Purified RNA was kept in a −80 °C refrigerator for subsequent experiments.
First-strand complementary DNA (cDNA) synthesis was performed using the PrimeScript® RT reagent kit using a gDNA Eraser (Takara, Kyoto, Japan) following the manufacturer’s instructions, and the product was stored at −20 °C.

2.4. Quantitative Real-Time Polymerase Chain Reaction (RT-qPCR)

Primer 5 software was used to design qPCR primers according to the known coding sequences of genes related to the trehalose metabolism pathway and insulin metabolism pathway of T. castaneum. The RPL13a gene [34] of T. castaneum was selected as the internal reference gene (Table 1) and synthesized by Hangzhou Shangya Biotechnology Co., Ltd. After qRT-PCR amplification, the dissolution curve was plotted to ensure the specificity of each primer. The expression of relevant genes was detected using SYBR Green Master Mix (SYBR Green Premix Ex Taq, Takara, Japan) in a Bio-Rad CFX96™ Real-Time PCR Detection System (Bio-Rad Laboratories Inc., Hercules, CA, USA). Each PCR was performed in a volume of 10 μL with 1 μL of cDNA, 0.4 μL (10 μM) of each primer, 3.2 μL of ultrapure water, and 5 μL of SYBR buffer.
The reaction conditions were as follows: preincubation at 95 °C for 2 min, 39 cycles at 95 °C for 5 s and annealing at 59 °C for 30 s, and heat treatment at 65–95 °C. The data obtained were analyzed using the 2−ΔΔCT method [35].

2.5. Determination of Carbohydrate Content and Enzyme Activity

Referring to the method of Zhang et al. [36], 15 individual samples after treatment were placed in an Eppendorf tube (EP tube); 200 μL of PBS was added, and the samples were fully ground with a grinding rod and then homogenized using an ultrasonic crusher. Next 800 μL of PBS was added after crushing, and the samples were centrifuged at 4 °C for 20 min at 1000× g. Then 350 μL of supernatant was ultracentrifuged at 4 °C for 1 h at 20,800× g. The supernatant after ultracentrifugation was used for the determination of protein content, glucose concentration, and soluble trehalase enzyme activity, while the precipitate was suspended in PBS for the determination of protein, glucose concentration, and membrane-bound trehalase enzyme activity. The glycogen, glucose, soluble trehalose, and membrane-bound trehalose levels were determined using a glucose (GO) Assay Kit (Sigma-Aldrich, Sy. Louis, MO, USA) and measured at an absorbance of 540 nm. A BCA Protein Assay Kit (Beyotime, China) was used to determine the protein concentration and was measured at an absorbance of 562 nm. The anthrone method was used to detect trehalose content and was measured at an absorbance of 630 nm.

2.6. Statistical Analyses

The obtained data were analyzed for significant differences using IBM SPSS Statistics 20 data analysis software. Least significant difference (LSD) tests in one-way analysis of variance (ANOVA) were used to compare the differences among more than two samples (different letters indicate significant differences between values, i.e., p < 0.05), while Student’s t-test was used to compare the differences between two groups (* p < 0.05, ** p < 0.01). Finally, the analyzed data were presented in graphical form using Sigma Plot 10.0 software and Excel, where all bars represent the mean ± SE (standard error).

3. Results

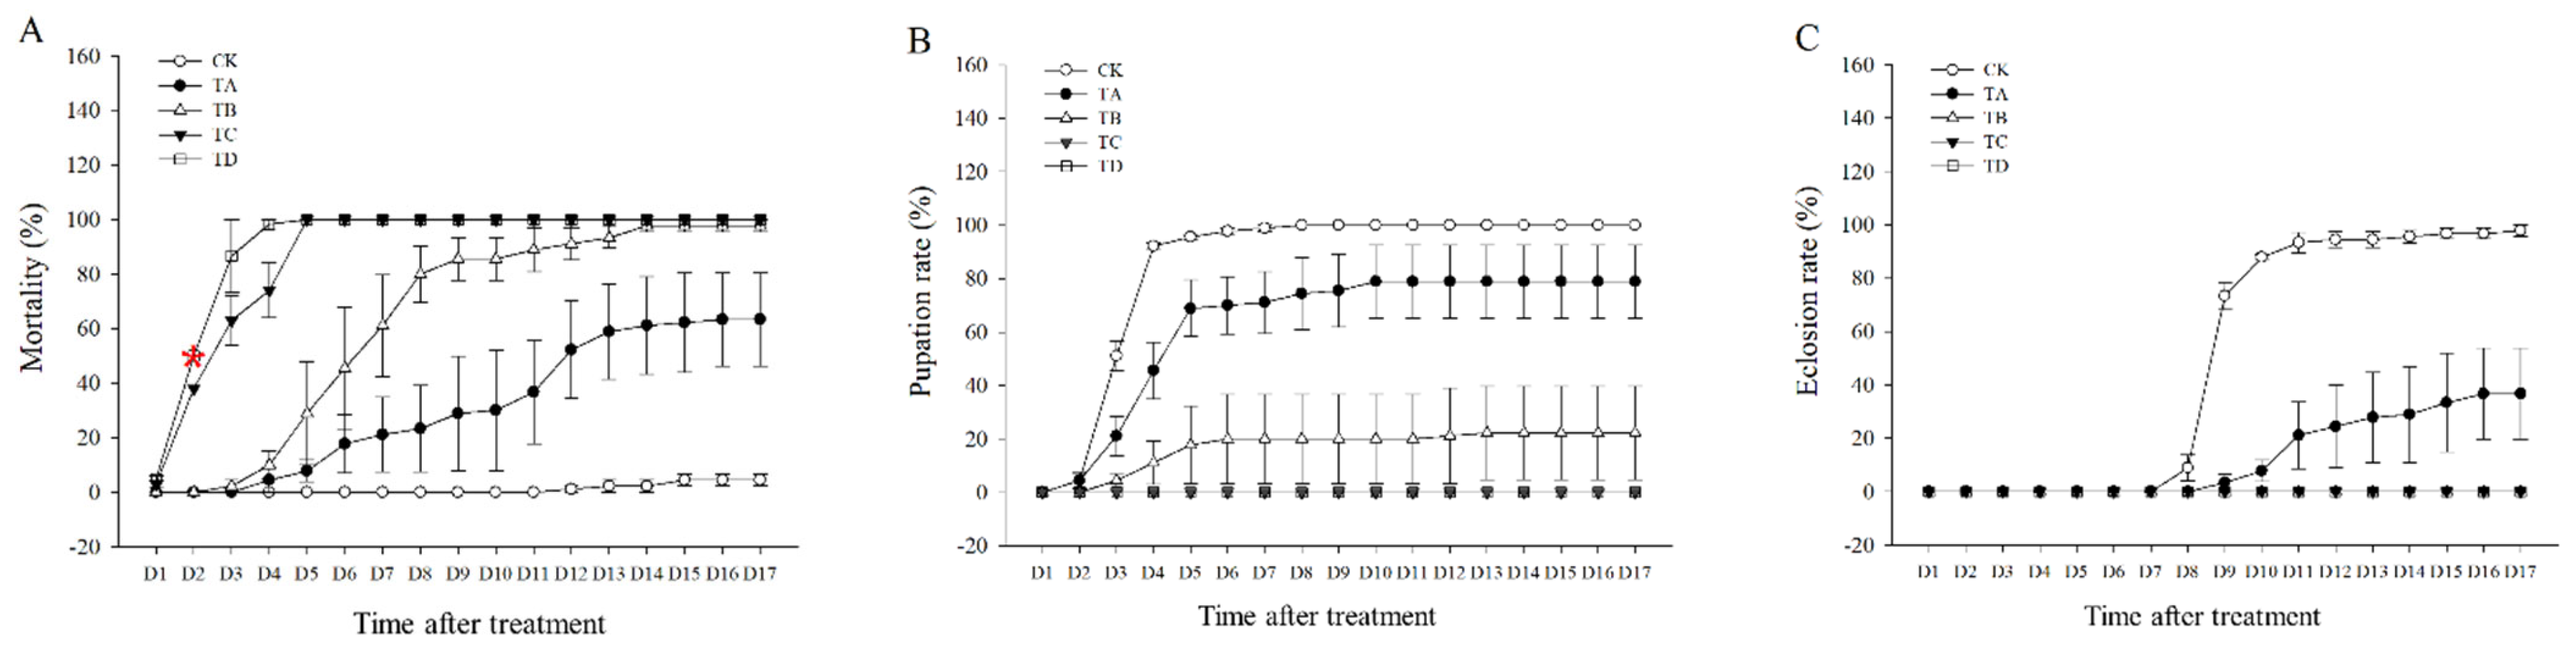
3.1. Mortality, Pupation Rate, and Eclosion Rate of T. castaneum under Different CO2 Concentrations

The mortality rate of T. castaneum tended to increase after different high concentrations of CO2 treatment compared to the CK group, with 75% CO2 reaching 50% lethality at about 2.5 days and 95% CO2 reaching 50% lethality at about 2 days (Figure 1A). Approximately 100% lethality was achieved after treatment with 50%, 75%, and 95% CO2 for 14 days, 5 days, and 4 days, respectively (Figure 1A). We found that neither 75% nor 95% CO2 resulted in successful pupation of T. castaneum larvae, whereas about 13.7% of T. castaneum larvae could pupate successfully after 50% CO2 treatment (Figure 1B), but almost all of these pupae failed to fledge successfully (Figure 1C). After treatment with 25% CO2, 78.9% of the larvae successfully pupated (Figure 1B), but only about 63.3% of the larvae successfully underwent eclosion (Figure 1C).

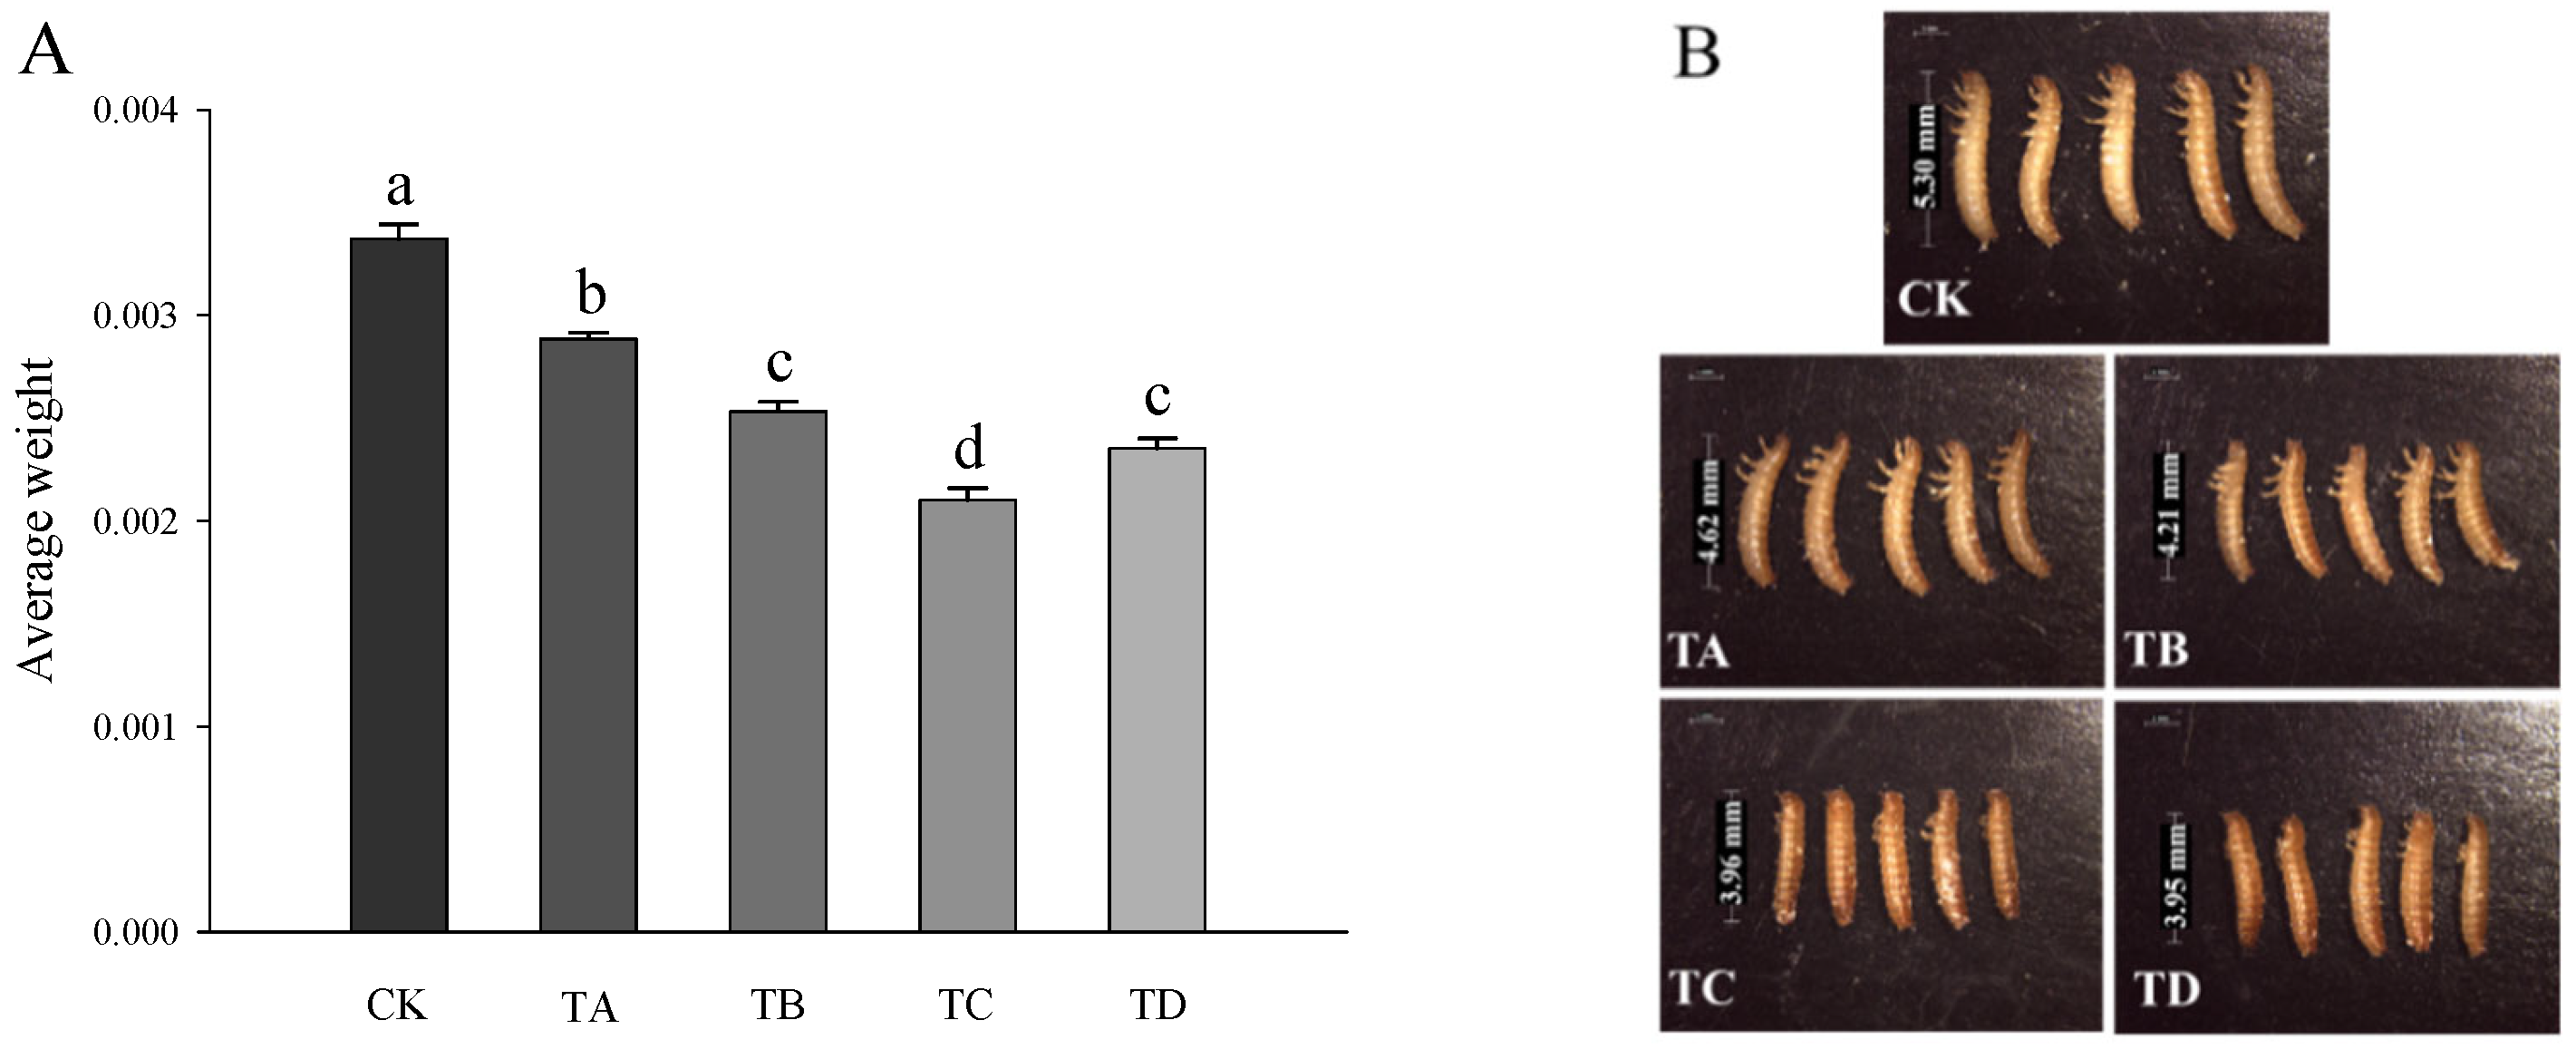
3.2. Changes in Body Weight and Morphological Features of T. castaneum under Different Concentrations of CO2

As shown in Figure 2, compared to the CK group, after 48 h of treatment with different high CO2 levels, the body weight of T. castaneum decreased significantly in all cases (Figure 2A) in a concentration-dependent manner (Figure 2B).

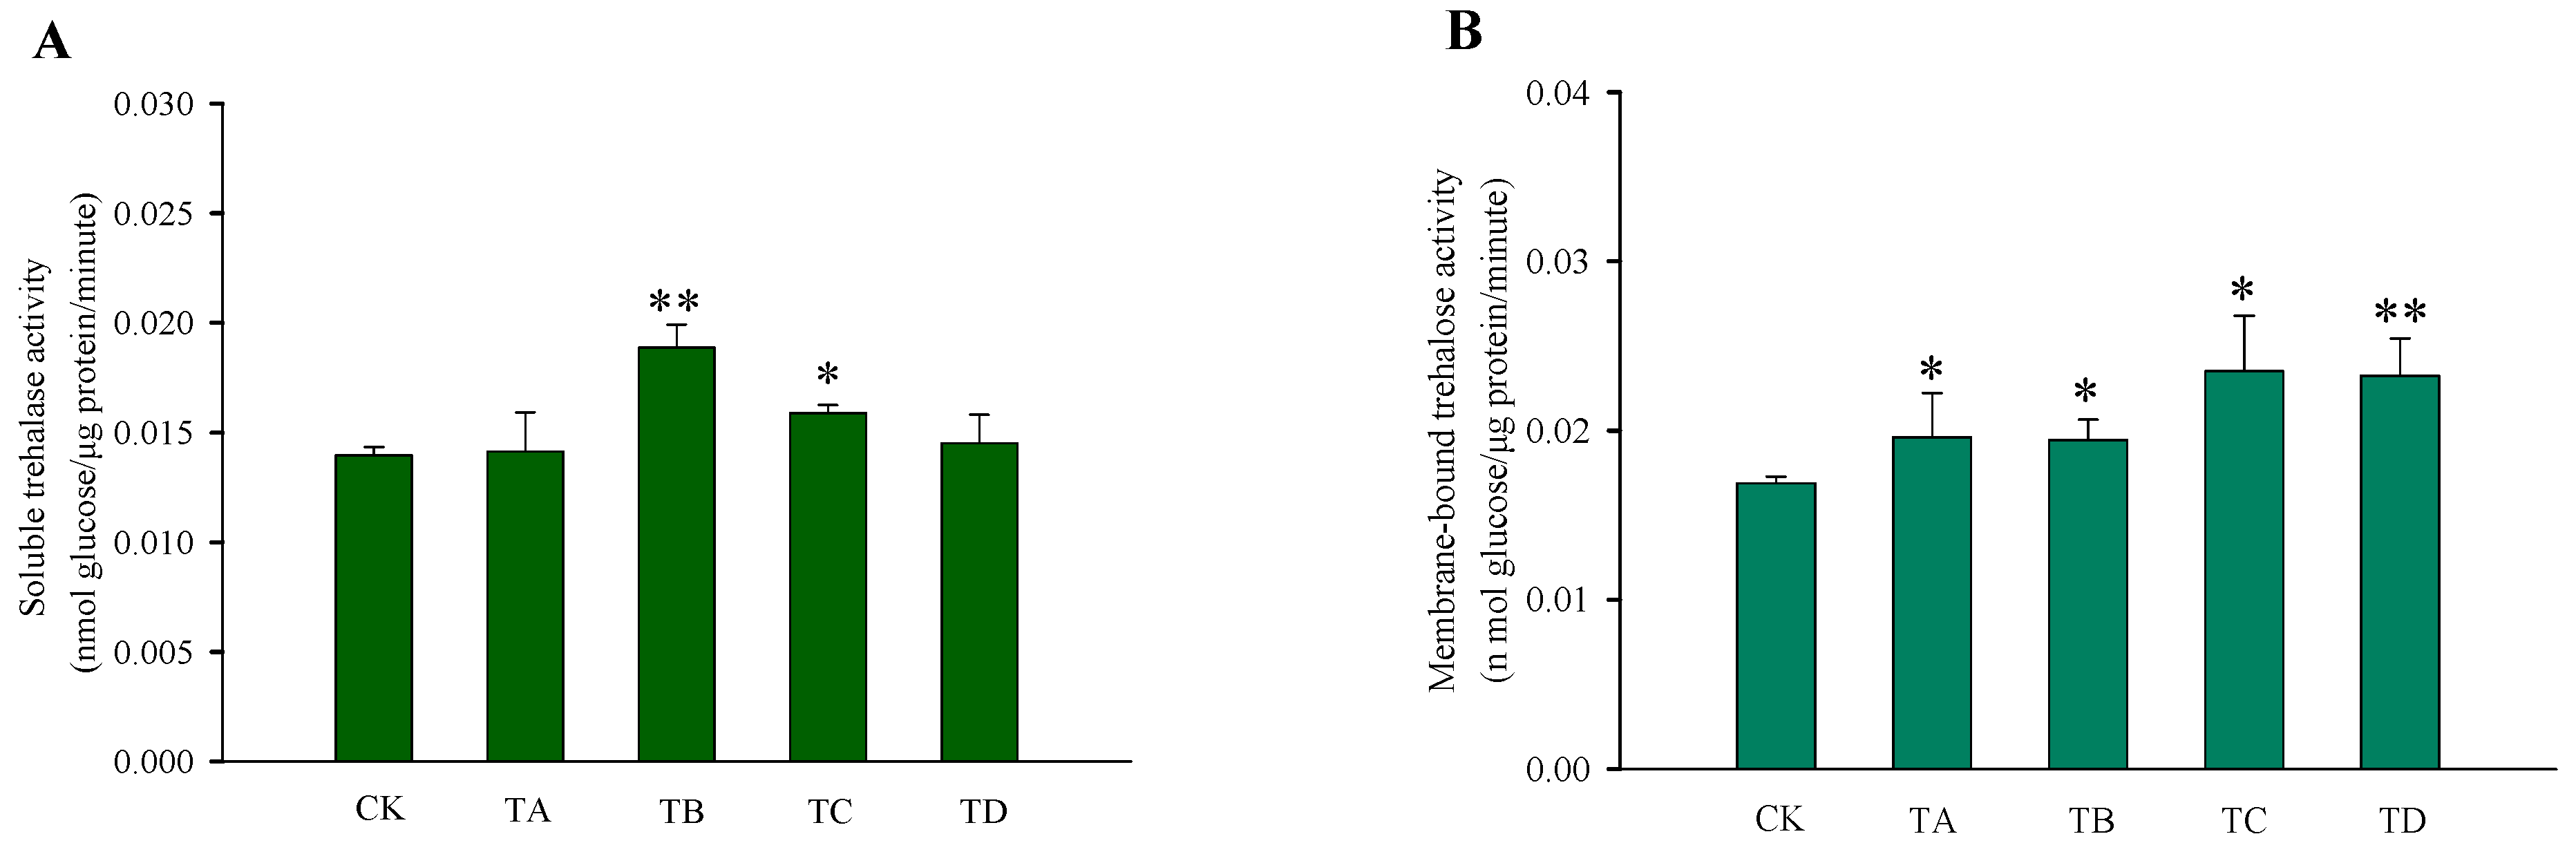
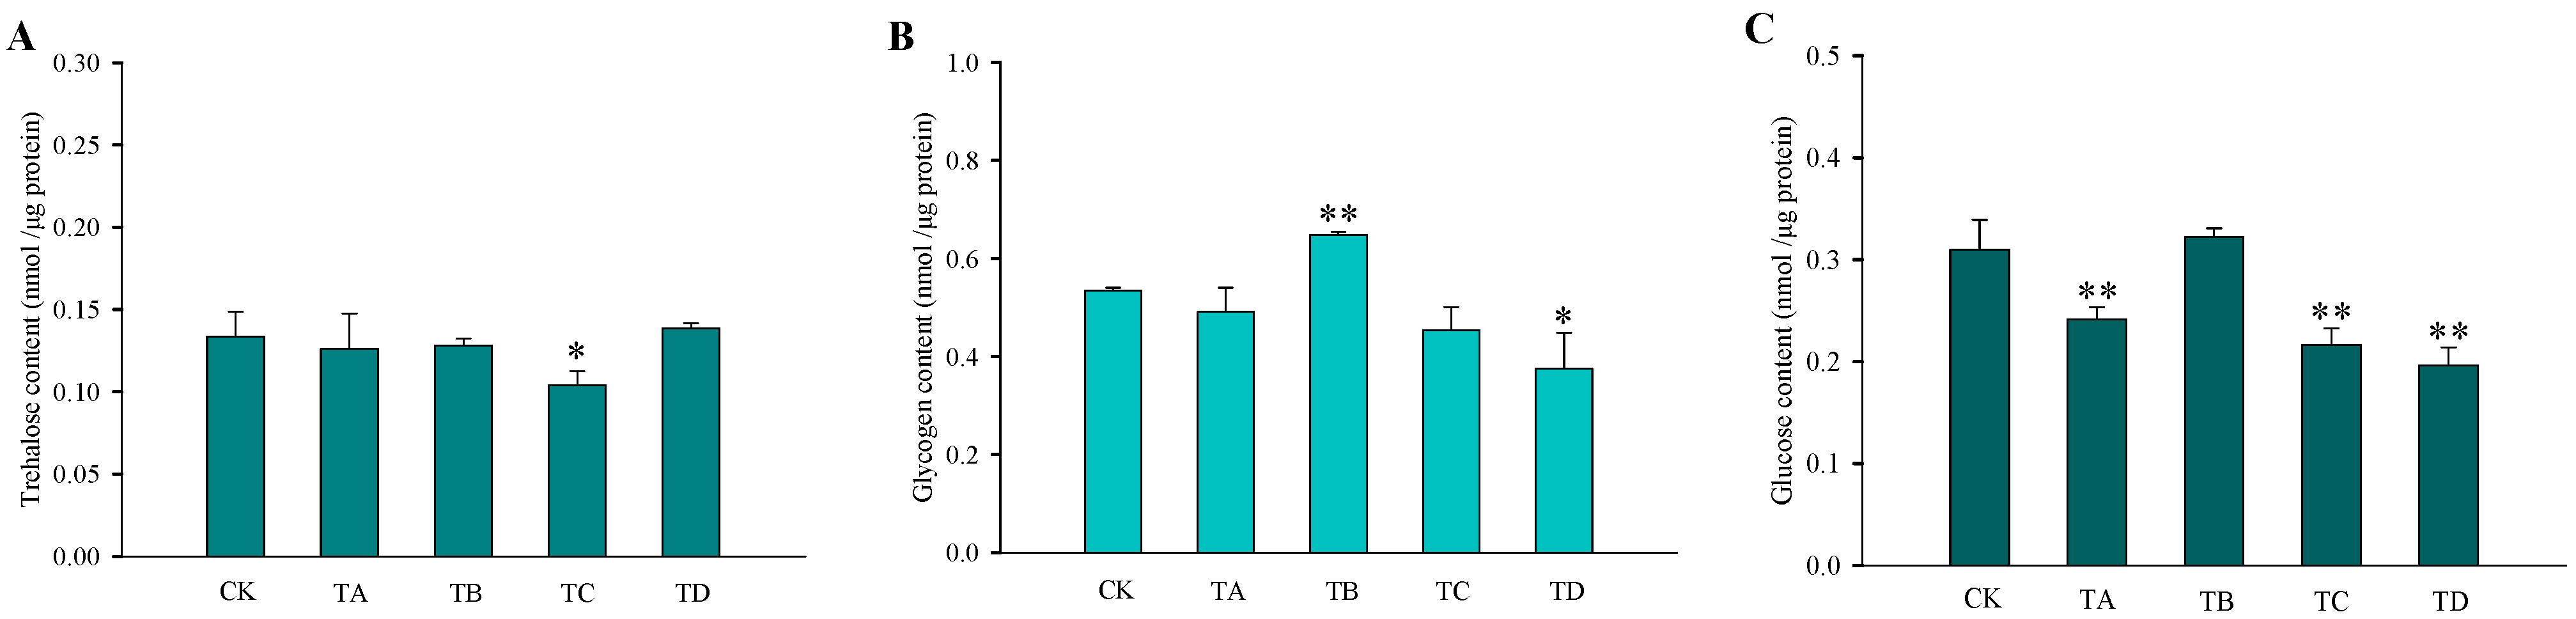
3.3. Changes in Carbohydrate Content and Enzymatic Activity in T. castaneum under Different Concentrations of CO2

After different high CO2 treatments, the trehalose content in T. castaneum did not show significant changes, except for a significant decrease after 75% CO2 treatment compared to the CK group (Figure 3A). While glycogen increased after 50% CO2 treatment and showed a significant decrease after 95% CO2 treatment, no significant changes occurred at the remaining high CO2 concentrations (Figure 3B). In addition, the glucose content did not change significantly after 50% CO2 treatment but showed extremely significant reductions at all other high CO2 treatments (Figure 3C). The membrane-bound trehalase activity increased significantly after all four different high CO2 treatments (Figure 4B), while the soluble trehalase activity increased significantly after exposure to 50% CO2 and 75% CO2 treatments, with no significant changes at the other concentrations (Figure 4A).

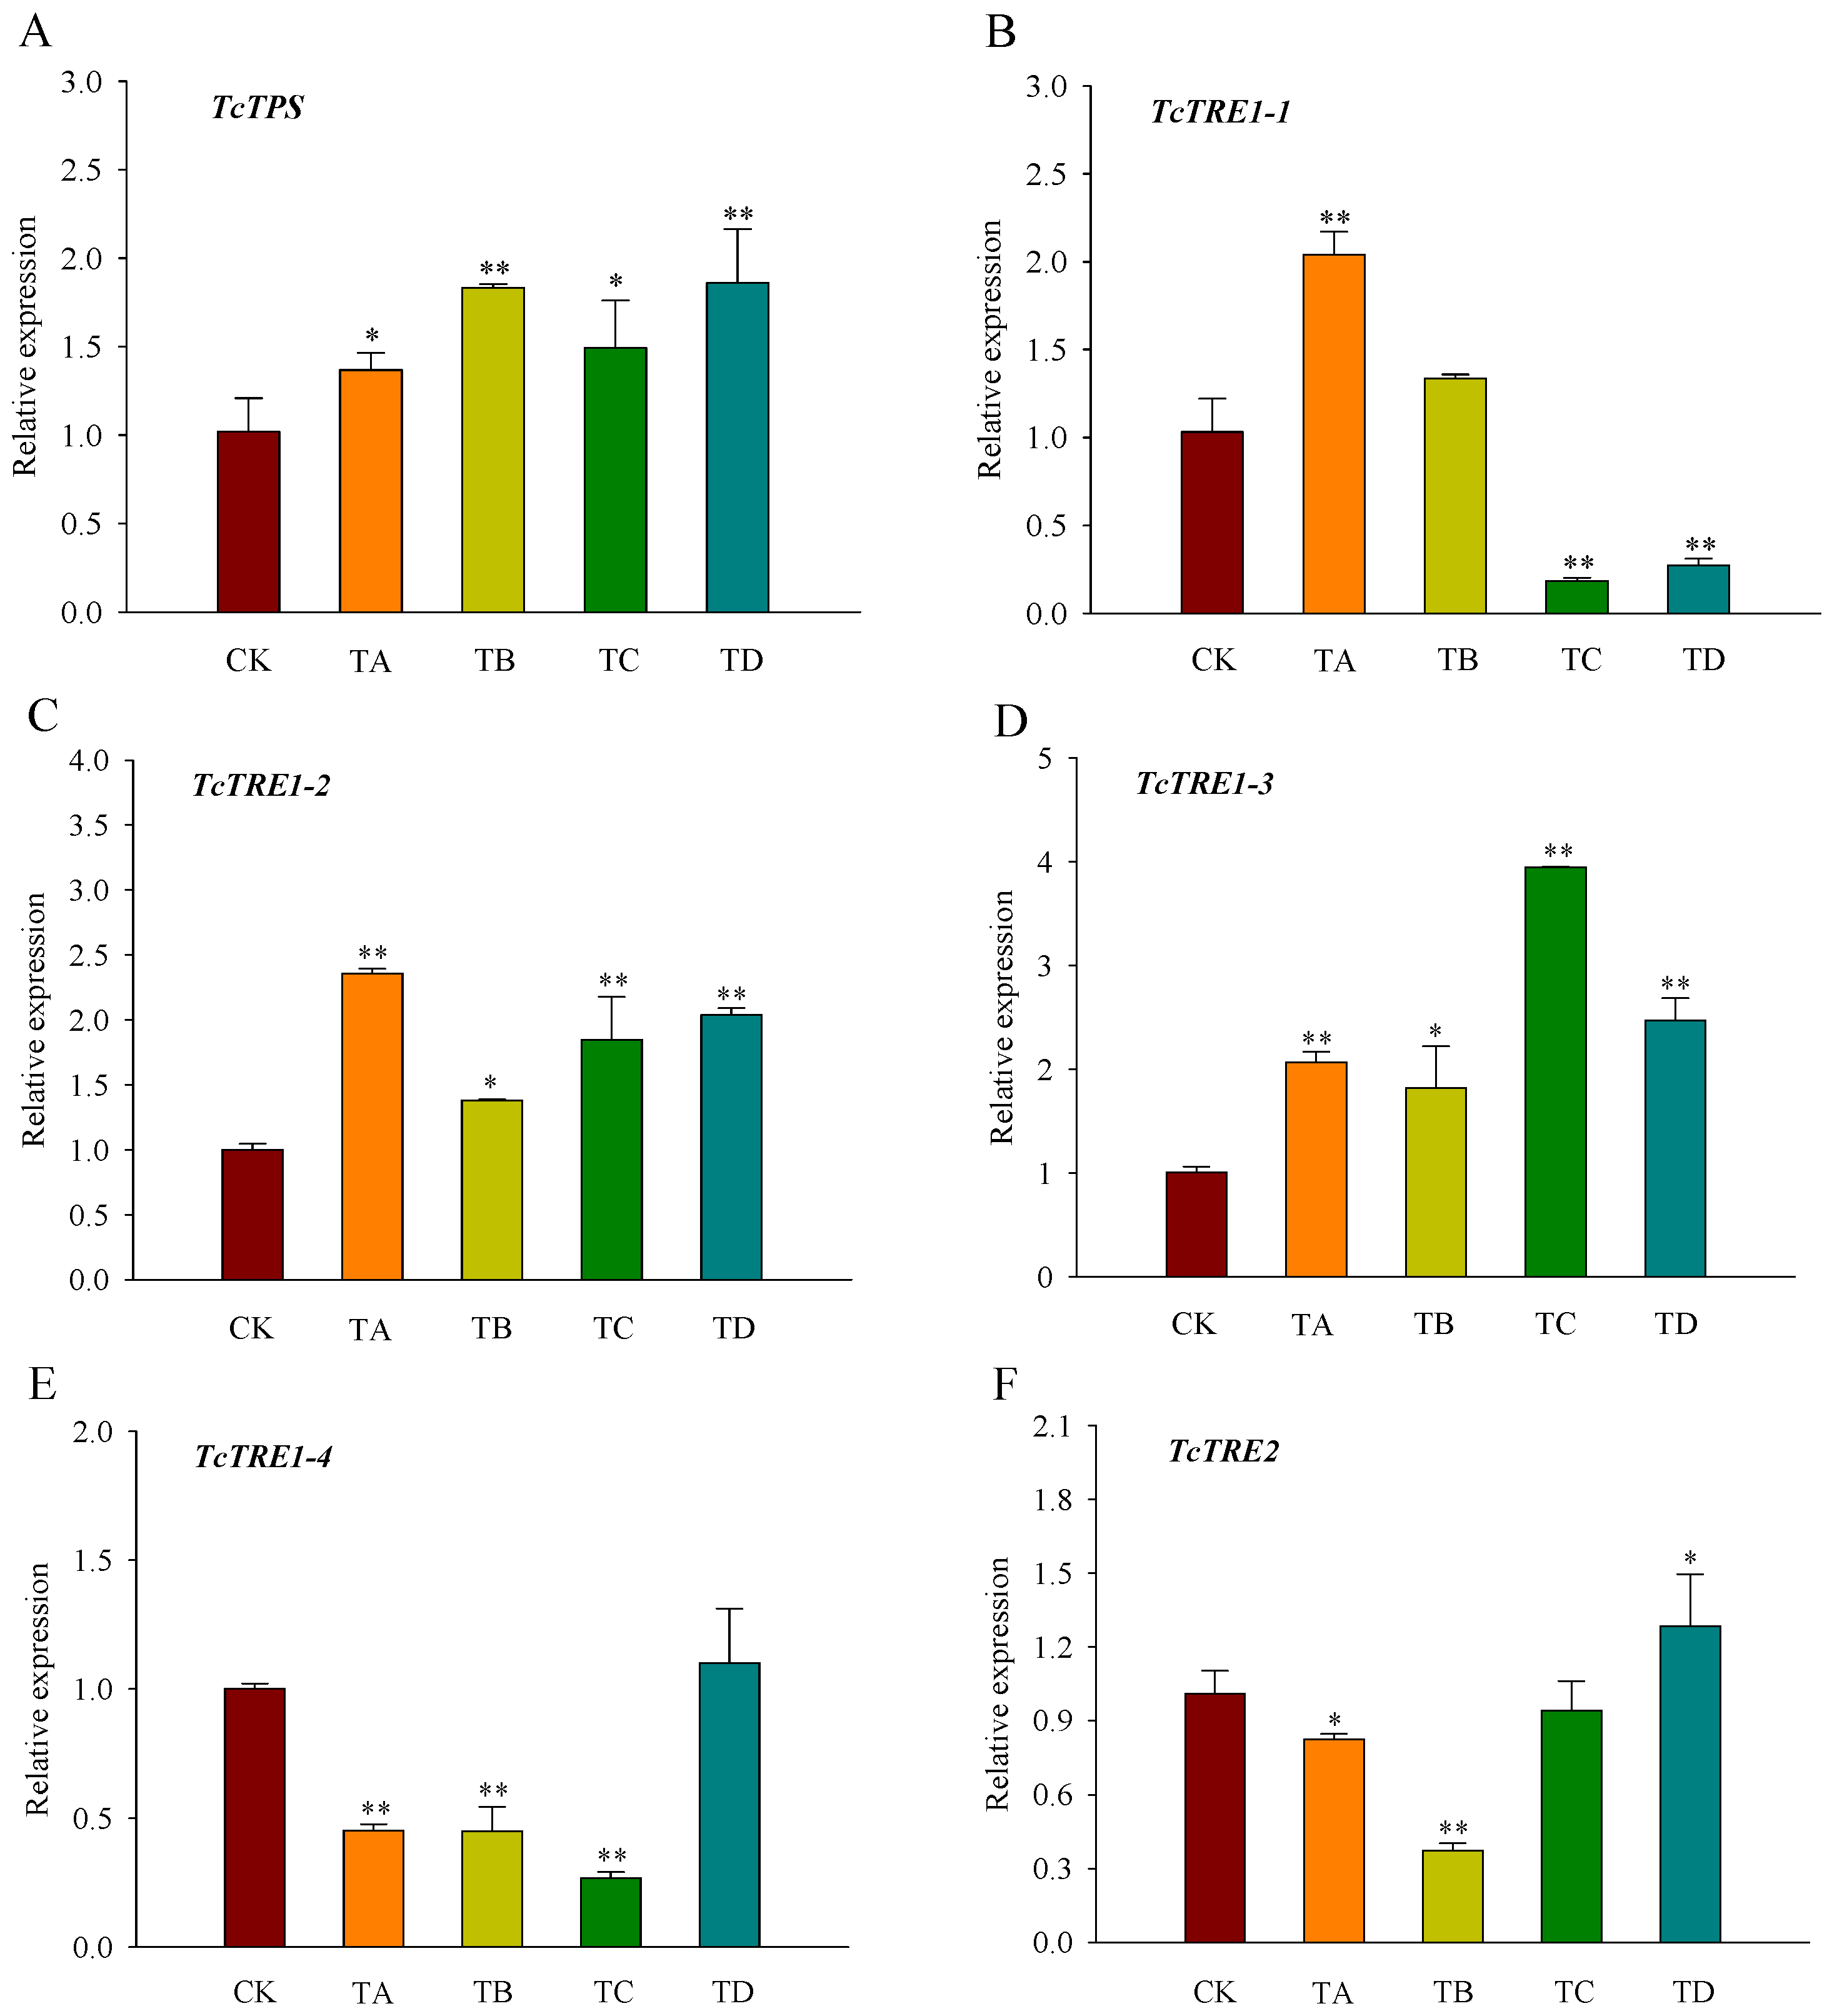
3.4. Expression of Trehalose Metabolism Pathway Genes in T. castaneum under Different CO2 Concentrations

Compared with the control group, TPS, TRE1-2, and TRE1-3 displayed significantly higher levels of expression after 48 h of CO2 treatment (Figure 5A,C,D). In contrast, the expression of TRE1-1 was significantly increased under 25% CO2 treatment but decreased under 75% CO2 and 95% CO2 treatment (Figure 5B). TRE1-4 expression was significantly decreased under all CO2 concentrations except for the 95% CO2 treatment (Figure 5E). In contrast to CK, TRE2 expression was significantly decreased under 25% CO2 and 50% CO2 treatment, while its expression was significantly increased under 95% CO2 treatment (Figure 5F).

3.5. Gene Expression of Insulin Signaling Pathway Genes in T. castaneum under Different Concentrations of CO2

The gene expression level of InR1 in T. castaneum was significantly increased under the 25% and 50% CO2 treatments at 48 h (Figure 6A). There was no significant response to InR2 under all treatments (Figure 6B). Ilp1 was significantly upregulated under 50% and 95% CO2 treatments, while Ilp2 was significantly upregulated under 25% CO2 treatment, and Ilp3 was significantly upregulated under 25% and 50% CO2 treatments, no significant changes were observed at the remaining concentrations (Figure 6C–E). Additionally, Ilp4 expression was significantly downregulated under the 25% and 50% CO2 treatments (Figure 6F).

4. Discussion

Typically, an environment in which the oxygen concentration in an ecosystem is lower than the atmospheric oxygen concentration (20.94%) is defined as a hypoxic environment. Insects developing underwater, in high-altitude hypoxic areas, and in microenvironments such as animals, grains, manure, carrion, and trees, as well as insect burrows that experience flooding and insects that escape predators into water, are exposed to hypoxic stress [37]. Hypoxic stress affects insects differently; for example, as oxygen levels decrease, the body size of insects decreases [38]. In Callosobruchus maculatus, older larvae could endure CO2 treatment (18%) for a long time (20 days) before resuming their growth upon rediscovering a normoxic environment [39]. In our study, we found a reduction in body weight and body size under different high CO2 conditions (Figure 2); we suspect that this is an adaptation to hypoxia/hypercarbia. Studies have reported that the adults, pupae, and larvae of T. castaneum died after 1.2, 6.4, and 3.3 days of treatment with up to 99% CO2 [40], despite the larvae and pupae of most storage pests being resistant to high CO2 [1,41]. In this experiment, four different concentrations of CO2 were used to treat eighth-instar T. castaneum, and the results showed that the 50% mortality time of 75% CO2 larvae of T. castaneum was approximately 6 days, while that of 95% CO2-treated larvae was only approximately 3 days, similar to the results of Husain et al. [35]. It was revealed that with the increase in concentration, the mortality rate of T. castaneum increased gradually. The larvae were unable to pupate successfully after treatment with more than 75% CO2, while the pupae were unable to fledge after treatment with more than 50% CO2 (Figure 1). High CO2 stress causes hypoxia, which directly limits the energy supply and causes free-radical damage, leading to insect death [19,42]; this may be the reason for the high mortality rate and dysgenopathy of T. castaneum (Figure 2).
The lethal effect of 95% CO2 concentration was significant, with a 50% mortality time of approximately 2 days; accordingly, 95% CO2 treatment for 48 h was chosen for further evaluation. Trehalose is the blood carbohydrate of insects and a stress metabolite whose levels can vary with environmental conditions [43]. Trehalose can be used not only as an energy source but also as a chemical chaperone or metabolic regulator to protect insects from stress [44,45]. Glycogen is an important metabolic and energy storage substance [40,41], mainly synthesized and stored in the fat body, and it can be rapidly converted in trehalose and glucose into other tissues when insects require energy [46]. In T. castaneum treated with four different concentrations of CO2, we found that glucose decreased significantly at 25% CO2, suggesting that glucose was fully utilized as a stressor to adapt to adversity at this concentration (Figure 3B). T. castaneum may accumulate glycogen to deal with adversity under 50% CO2, explaining its long tolerance time (17 days, Figure 1A). At 75% CO2 and 95% CO2, it is possible that glucose was fully called upon to cope with the hypoxic/hypercarbic environment (Figure 3C). The trehalase activity assay showed that soluble trehalase activity did not change significantly under hypoxia, whereas membrane-bound trehalase activity showed a significant increase (Figure 4). Cheng et al. [39] suggested that, in states of hypoxia/hypercarbia, CO2 may somehow encourage metabolic recovery and promote the development of insects. Membrane-bound trehalase is mainly present in muscle [47], suggesting the insect’s mechanism for coping with high CO2 stress. Further examination of the expression of genes related to the trehalose metabolic pathway revealed that TPS, TRE1-2, and TRE1-3 were significantly overexpressed. In Drosophila, overexpression of TPS was found to increase trehalose levels and tolerance to hypoxia [48]; hence, we speculate that T. castaneum primarily responds to adversity through high expression of TPS, TRE1-2, and TRE1-3.
The insulin signaling pathway is an evolutionarily conserved pathway in which multiple insulin-like peptides (ILPs) bind to corresponding insulin receptors (InRs) to regulate the physiological activities of different tissues and “cooperate” with other pathways to regulate individual behavior, and it has an essential role in various physiological processes, such as material metabolism, glucose metabolism, energy metabolism, growth, and development, reproduction, and resistance in insects [49,50,51]. More importantly, insects have the ability to regulate glucose and lipid metabolism through the PI3K/Akt pathway in response to adverse environments, such as hypoxia [49]. Recent genome-wide resequencing and transcriptional analysis of Tibetan and low-altitude locust populations revealed that the insulin receptor inhibitor tyrosine protein phosphatase non-receptor type 1 (PTP1B), encoded by PTPN1, contributes to the maintenance of homeostasis of carbohydrate and energy metabolism under hypoxic conditions by regulating the activity of the insulin/insulin-like growth peptide signaling pathway (IIS) in Tibetan locusts after mutation or loss of function. A novel mechanism for the metabolic adaptation of insects to high-altitude hypoxia was revealed [50]. Consequently, this study also examined the expression of genes related to the insulin metabolic pathway in T. castaneum, and we found that the insulin receptor and insulin-like peptide genes did not respond strongly under high CO2 conditions, but did respond under 25% and 50% CO2 (Figure 6). We speculate that the insulin signaling pathway primarily helps T. castaneum adapt to the adverse environment at lower CO2 concentrations, while other signaling pathways may play a pivotal role at higher CO2 concentrations, which remains to be further explored.
In the current study, mortality increased with CO2 concentrations, and T. castaneum was mainly adjusted to a high-CO2 environment via a reduction in body size or reducing energy consumption by regulating trehalose metabolism. There were different stress metabolic reactions under different CO2 concentrations. Under 25% and 50% CO2, T. castaneum mainly responds to stress via the insulin signaling pathway, whereas under 75% and 95% CO2, T. castaneum may respond mainly to stress via the trehalose metabolism pathway.

Author Contributions

Conceptualization, M.Z. and X.Z.; methodology, B.P.; software, J.Z.; validation, X.Q.; formal analysis, K.X.; investigation, B.P.; resources, B.T.; data curation, J.Z.; writing—original draft preparation, M.Z.; writing—review and editing, X.Z.; visualization, B.T.; supervision, C.L. and X.L.; project administration, K.X.; funding acquisition, C.L. All authors have read and agreed to the published version of the manuscript.

Funding

This research was funded by the National Natural Science Foundation of China (No. 31960542), the Academician Workstation of Guiyang University, Guizhou Province (QKHRCP No. (2019) 5605), the Special Funding of Guiyang Science and Technology Bureau and Guiyang University (GYU-KY-(2021)), the Graduate Research Project of Guiyang University (GYU-YJS(2019)-13), the Special Key Laboratory of Higher Education Institution in Guizhou Province (QJHKYZ(2011)001), and the Innovation Group Project of Education Department of Guizhou Province ((2021)013). The funder is Can Li in all of the funding.

Institutional Review Board Statement

Not applicable.

Data Availability Statement

The data presented in this study are available on request from the corresponding author.

Conflicts of Interest

The authors declare no conflict of interest.

References

  1. Mehmood, K.; Husain, M.; Aslam, M.; Ahmedani, M.S.; Aulahk, A.M.; Shaheen, F.A. Changes in the nutritional composition of maize flour due to Tribolium castaneum infestation and application of carbon dioxide to manage this pest. Environ. Sci. Pollut. Res. 2018, 25, 18540–18547. [Google Scholar] [CrossRef] [PubMed]
  2. Chen, J.X.; Lyu, Z.H.; Wang, C.Y.; Cheng, J.; Lin, T. RNA interference of a trehalose-6-phosphate synthase gene reveals its roles in the biosynthesis of chitin and lipids in Heortia vitessoides (Lepidoptera: Crambidae). Insect Sci. 2018, 27, 212–223. [Google Scholar] [CrossRef] [PubMed] [Green Version]
  3. White, G.G. Field estimates of population growth rates of Tribolium castaneum (Herbst) and Rhyzopertha dominica (F.) (Coleoptera: Tenebrionidae and Bostrychidae) in bulk wheat. J. Stored Prod. Res. 1988, 24, 13–22. [Google Scholar] [CrossRef]
  4. Lis, Ł.B.; Bakuła, T.; Baranowski, M.; Czarnewicz, A. The carcinogenic effects of benzoquinones produced by the flour beetle. Pol. J. Vet. Sci. 2011, 14, 159–164. [Google Scholar] [CrossRef] [PubMed] [Green Version]
  5. Hubert, J.; Stejskal, V.; Athanassiou, C.G.; Throne, J.E. Health Hazards Associated with Arthropod Infestation of Stored Products. Annu. Rev. Entomol. 2018, 63, 553–573. [Google Scholar] [CrossRef]
  6. Zettler, L.J.; Cuperus, G.W. Pesticide resistance in Tribolium castaneum (Coleoptera: Tenebrionidae) and Rhyzopertha dominica (Coleoptera: Bostrichidae) in wheat. J. Econ. Entomol. 1990, 83, 1677–1681. [Google Scholar] [CrossRef]
  7. Lee, B.H.; Lee, S.E.; Annis, P.C.; Pratt, S.J.; Park, B.S.; Tumaalii, F. Fumigant toxicity of essential oils and monoterpenes against the red flour beetle, Tribolium castaneum Herbst. J. Asia-Pac. Entomol. 2002, 5, 237–240. [Google Scholar] [CrossRef]
  8. Epidi, T.E.; Odili, E.O. Biocidal activity of selected plant powders against Tribolium castaneum Herbst in stored groundnut (Arachis hypogaea L.). Afr. J. Environ. Sci. Technol. 2009, 3, 1–5. [Google Scholar] [CrossRef]
  9. Stejskal, V.; Vendl, T.; Aulicky, R.; Athanassiou, C. Synthetic and Natural Insecticides: Gas, Liquid, Gel and Solid Formulations for Stored-Product and Food-Industry Pest Control. Insects 2021, 12, 590. [Google Scholar] [CrossRef] [PubMed]
  10. Stejskal, V.; Vendl, T.; Li, Z.; Aulicky, R. Minimal Thermal Requirements for Development and Activity of Stored Product and Food Industry Pests (Acari, Coleoptera, Lepidoptera, Psocoptera, Diptera and Blattodea): A Review. Insects 2019, 10, 149. [Google Scholar] [CrossRef] [Green Version]
  11. Pedrini, N. Molecular interactions between entomopathogenic fungi (Hypocreales) and their insect host: Perspectives from stressful cuticle and hemolymph battlefields and the potential of dual RNA sequencing for future studies. Fungal Biol. 2018, 122, 538–545. [Google Scholar] [CrossRef] [PubMed]
  12. Pimentel, M.A.; Faroni, L.R.; Silva, F.H.; Batista, M.D.; Guedes, R.N. Spread of phosphine resistance among Brazilian populations of three species of stored product insects. Neotrop. Èntomol. 2010, 39, 101–107. [Google Scholar] [CrossRef] [PubMed] [Green Version]
  13. Perkin, L.C.; Oppert, B. Gene expression in Tribolium castaneum life stages: Identifying a species-specific target for pest control applications. PeerJ 2019, 7, e6946. [Google Scholar] [CrossRef] [Green Version]
  14. Davyt-Colo, B.; Girotti, J.R.; González, A.; Pedrini, N. Secretion and Detection of Defensive Compounds by the Red Flour Beetle Tribolium castaneum Interacting with the Insect Pathogenic Fungus Beauveria bassiana. Pathogens 2022, 11, 487. [Google Scholar] [CrossRef]
  15. Joop, G.; Vilcinskas, A. Coevolution of parasitic fungi and insect hosts. Zoology 2016, 119, 350–358. [Google Scholar] [CrossRef]
  16. Cao, Y.; Xu, K.K.; Zhu, X.; Bai, Y.; Yang, W.; Li, C. Role of Modified Atmosphere in Pest Control and Mechanism of Its Effect on Insects. Front. Physiol. 2019, 10, 206. [Google Scholar] [CrossRef] [PubMed] [Green Version]
  17. Gunasekaran, N.; Rajendran, S. Toxicity of carbon dioxide to drugstore beetle Stegobium paniceum and cigarette beetle Lasioderma serricorne. J. Stored Prod. Res. 2005, 41, 283–294. [Google Scholar] [CrossRef]
  18. Wong, F.J.; Castane, C.; Riudavets, J. Lethal effects of CO2-modified atmospheres for the control of three Bruchidae species. J. Stored Prod. Res. 2013, 55, 62–67. [Google Scholar] [CrossRef]
  19. Helenius, I.T.; Krupinski, T.; Turnbull, D.W.; Gruenbaum, Y.; Silverman, N.; Johnson, E.A.; Sporn, P.H.S.; Sznajder, J.I.; Beitel, G.J. Elevated CO2 suppresses specific Drosophila innate immune responses and resistance to bacterial infection. Proc. Natl. Acad. Sci. USA 2009, 106, 18710–18715. [Google Scholar] [CrossRef] [Green Version]
  20. Bretscher, A.J.; Busch, K.E.; de Bono, M. A carbon dioxide avoidance behavior is integrated with responses to ambient oxygen and food in Caenorhabditis elegans. Proc. Natl. Acad. Sci. USA 2008, 105, 8044–8049. [Google Scholar] [CrossRef] [Green Version]
  21. Hallem, E.A.; Sternberg, P.W. Acute carbon dioxide avoidance in Caenorhabditis elegans. Proc. Natl. Acad. Sci. USA 2008, 105, 8038–8043. [Google Scholar] [CrossRef] [Green Version]
  22. Beall, C.M. Two routes to functional adaptation: Tibetan and Andean high-altitude natives. Proc. Natl. Acad. Sci. USA 2007, 104, 8655–8660. [Google Scholar] [CrossRef] [PubMed] [Green Version]
  23. McCue, M.D.; De Los Santos, R. Upper thermal limits of insects are not the result of insufficient oxygen delivery. Physiol. Biochem. Zool. 2013, 86, 257–265. [Google Scholar] [CrossRef]
  24. Harrison, J.F.; Haddad, G.G. Effects of oxygen on growth and size: Synthesis of molecular, organismal, and evolutionary studies with Drosophila melanogaster. Annu Rev. Physiol. 2011, 73, 95–113. [Google Scholar] [CrossRef] [PubMed]
  25. Cui, S.; Wang, L.; Qiu, J.; Liu, Z.; Geng, X. Comparative metabolomics analysis of Callosobruchus chinensis larvae under hypoxia, hypoxia/hypercapnia and normoxia. Pest Manag. Sci. 2017, 73, 1267–1276. [Google Scholar] [CrossRef] [PubMed]
  26. Friedlander, A.; Navarro, S. Effect of controlled atmospheres on the sorbitol pathway in Ephestia cautella (Walker) pupae. Experientia 1983, 39, 744–746. [Google Scholar] [CrossRef]
  27. Feron, O. Pyruvate into lactate and back: From the Warburg effect to symbiotic energy fuel exchange in cancer cells. Radiother Oncol. 2009, 92, 329–333. [Google Scholar] [CrossRef] [PubMed]
  28. Boardman, L.; Sørensen, J.G.; Johnson, S.A.; Terblanche, J.S. Interactions between Controlled Atmospheres and Low Temperature Tolerance: A Review of Biochemical Mechanisms. Front. Physiol. 2011, 2, 92. [Google Scholar] [CrossRef] [Green Version]
  29. Badre, N.H.; Martin, M.E.; Cooper, R.L. The physiological and behavioral effects of carbon dioxide on Drosophila melanogaster larvae. Comp. Biochem. Physiol. A-Mol. Integr. Physiol. 2005, 140, 363–376. [Google Scholar] [CrossRef] [PubMed]
  30. Navarro, S. Modified Atmospheres for the Control of Stored-Product Insects and Mites. In Insect Management for Food Storage and Processing; Department of Food Science, Agricultural Research Organization: Bet Dagan, Israel, 2006; pp. 105–146. [Google Scholar] [CrossRef]
  31. Tunc, I.; Navarro, S. Sensitivity of Tribolium castaneum eggs to modified atmospheres. Entomol. Exp. Appl. 1983, 34, 221–226. [Google Scholar] [CrossRef]
  32. Kharel, K.; Mason, L.J.; Murdock, L.L.; Baributsa, D. Efficacy of Hypoxia Against Tribolium castaneum (Coleoptera: Tenebrionidae) Throughout Ontogeny. J. Econ. Entomol. 2019, 112, 1463–1468. [Google Scholar] [CrossRef] [PubMed]
  33. Pan, B.Y.; Xu, K.K.; Luo, Y.J.; Wang, Y.Y.; Zhou, M.; Li, C.; Tang, B. The sequence characteristics and functions on regulating trehalose metabolism of two PTP genes in Tribolium castaneum (Herbst) (Coleoptera: Tenebrionidae). J. Stored Prod. Res. 2020, 89, 101692. [Google Scholar] [CrossRef]
  34. Lord, J.C.; Hartzer, K.; Toutges, M.; Oppert, B. Evaluation of quantitative PCR reference genes for gene expression studies in Tribolium castaneum after fungal challenge. J. Microbiol. Methods 2010, 80, 219–221. [Google Scholar] [CrossRef] [PubMed]
  35. Livak, K.J.; Schmittgen, T.D. Analysis of relative gene expression data using real-time quantitative PCR and the 2−ΔΔCT method. Methods 2001, 25, 402–408. [Google Scholar] [CrossRef] [PubMed]
  36. Zhang, L.; Qiu, L.Y.; Yang, H.L.; Wang, H.J.; Zhou, M.; Wang, S.G.; Tang, B. Study on the Effect of Wing Bud Chitin Metabolism and Its Developmental Network Genes in the Brown Planthopper, Nilaparvata lugens, by Knockdown of TRE Gene. Front. Physiol. 2017, 8, 750. [Google Scholar] [CrossRef] [PubMed] [Green Version]
  37. Hoback, W.W.; Stanley, D.W. Insects in hypoxia. J. Insect Physiol. 2001, 47, 533–542. [Google Scholar] [CrossRef]
  38. Kaiser, A.; Klok, C.J.; Socha, J.J.; Lee, W.K.; Quinlan, M.C.; Harrison, J.F. Increase in tracheal investment with beetle size supports hypothesis of oxygen limitation on insect gigantism. Proc. Natl. Acad. Sci. USA 2007, 104, 13198–13203. [Google Scholar] [CrossRef] [PubMed] [Green Version]
  39. Cheng, W.; Lei, J.; Ahn, J.E.; Wang, Y.; Lei, C.; Zhu-Salzman, K. CO2 enhances effects of hypoxia on mortality, development, and gene expression in cowpea bruchid, Callosobruchus maculatus. J. Insect Physiol. 2013, 59, 1160–1168. [Google Scholar] [CrossRef] [PubMed]
  40. Husain, M.; Sukirno, S.; Mehmood, K.; Tufail, M.; Rasool, K.G.; Alwaneen, W.S.; Aldawood, A.S. Effectiveness of carbon dioxide against different developmental stages of Cadra cautella and Tribolium castaneum. Environ. Sci. Pollut Res. Int. 2017, 24, 12787–12795. [Google Scholar] [CrossRef] [PubMed]
  41. Bourne-Murrieta, L.R.; Iturralde-García, R.D.; Wong-Corral, F.J.; Castañé, C.; Riudavets, J. Effect of packaging chickpeas with CO2 modified atmospheres on mortality of Callosobruchus chinensis (Coleoptera: Chrysomelidae). J. Stored Prod. Res. 2021, 94, 101894. [Google Scholar] [CrossRef]
  42. Nystul, T.G.; Roth, M.B. Carbon monoxide-induced suspended animation protects against hypoxic damage in Caenorhabditis elegans. Proc. Natl. Acad. Sci. USA 2004, 101, 9133–9136. [Google Scholar] [CrossRef] [Green Version]
  43. Laere, A.V. Trehalose, reserve and/or stress metabolite? FEMS Microbiol. Lett. 1989, 63, 201–209. [Google Scholar] [CrossRef]
  44. Crowe, J.H. Trehalose as a “chemical chaperone”: Fact and fantasy. In Molecular Aspects of the Stress Response: Chaperones, Membranes and Networks; Csermely, P., Vígh, L., Eds.; Springer: New York, NY, USA, 2007; Volume 594, pp. 143–158. [Google Scholar]
  45. Xu, J.; Sheng, Z.; Palli, S.R. Juvenile hormone and insulin regulate trehalose homeostasis in the red flour beetle, Tribolium castaneum. PLoS Genet. 2013, 9, e1003535. [Google Scholar] [CrossRef] [PubMed] [Green Version]
  46. Tang, B.; Xu, Q.; Zou, Q.; Fang, Q.; Wang, S.; Ye, G. Sequencing and characterization of glycogen synthase and glycogen phosphorylase genes from Spodoptera exigua and analysis of their function in starvation and excessive sugar intake. Arch. Insect Biochem. Physiol. 2012, 80, 42–62. [Google Scholar] [CrossRef]
  47. Becker, A.; Schlöder, P.; Steele, J.E.; Wegener, G. The regulation of trehalose metabolism in insects. Experientia 1996, 52, 433–439. [Google Scholar] [CrossRef] [PubMed]
  48. Chen, Q.; Ma, E.; Behar, K.L.; Xu, T.; Haddad, G.G. Role of trehalose phosphate synthase in anoxia tolerance and development in Drosophila melanogaster. J. Biol. Chem. 2002, 277, 3274–3279. [Google Scholar] [CrossRef] [PubMed] [Green Version]
  49. Lizcano, J.M.; Alessi, D.R. The insulin signalling pathway. Curr. Biol. 2002, 12, R236–R238. [Google Scholar] [CrossRef] [Green Version]
  50. Ding, D.; Liu, G.; Hou, L.; Gui, W.; Chen, B.; Kang, L. Genetic variation in PTPN1 contributes to metabolic adaptation to high-altitude hypoxia in Tibetan migratory locusts. Nat. Commun. 2018, 9, 4991. [Google Scholar] [CrossRef]
  51. Han, B.; Zhang, T.; Feng, Y.; Liu, X.; Zhang, L.; Chen, H.; Zeng, F.; Wang, M.; Liu, C.; Li, Y.; et al. Two insulin receptors coordinate oogenesis and oviposition via two pathways in the green lacewing, Chrysopa pallens. J. Insect Physiol. 2020, 123, 104049. [Google Scholar] [CrossRef] [PubMed]
Figure 1. (A) Mortality rate, (B) pupation rate, and (C) eclosion rate of T. castaneum treated with different concentrations of carbon dioxide, represented by CK, TA, TB, TC, and TD. CK, treated with air; TA, treated with 25% CO2 + 75% air; TB, treated with 50% CO2 + 50% air; TC, treated with 75% CO2 + 25% air; TD, treated with 95% CO2 + 5% air. The same is true below. Pupation rate = (pupae number/eighth-instar larval number) × 100%. Eclosion rate = (number of adults/pupal number) × 100%. Red * represented the time of 50% mortality rate in 95% CO2.
Agriculture 12 00979 g001
Figure 2. (A) Body weight and (B) morphological changes in T. castaneum treated with different concentrations of high carbon dioxide. A total of 20 larvae were collected for weighing, and 5 larvae were randomly collected for phenotype photographing. Weighting was repeated three times. A one-way analysis of variance (ANOVA) was performed to test for statistical significance. Dates are presented as the means ± SE; different letters indicate significant differences between values (p < 0.05).
Agriculture 12 00979 g002
Figure 3. Changes in the three carbohydrates in T. castaneum treated with different CO2 concentrations, represented by CK, TA, TB, TC, and TD. (A) trehalose content; (B) glycogen content; (C) glucose content. CK, treated with air for 48 h; TA, treated with 25% CO2 + 75% air for 48 h; TB, treated with 50% CO2 + 50% air for 48 h; TC, treated with 75% CO2 + 25% air for 48 h; TD, treated with 95% CO2 + 5% air for 48 h. * p < 0.05, ** p < 0.01, according to Student’s t-test.
Agriculture 12 00979 g003
Figure 4. Changes in the trehalase activity of T. castaneum treated with different concentrations of high carbon dioxide represented CK, TA, TB, TC, and TD. (A) soluble trehalase activity; (B) membrane-bound trehalase activity. CK, treated with air for 48 h; TA, treated with 25% CO2 + 75% air for 48 h; TB, treated with 50% CO2 + 50% air for 48 h; TC, treated with 75% CO2 + 25% air for 48 h; TD, treated with 95% CO2 + 5% air for 48 h. * p < 0.05, ** p < 0.01, according to Student’s t-test.
Agriculture 12 00979 g004
Figure 5. Relative expression levels of key genes in the trehalose metabolic pathway ((A) TcTPS; (B) TcTRE1-1; (C) TcTRE1-2; (D) TcTRE1-3; (E) TcTRE1-4; (F) TcTRE2) in T. castaneum treated with different concentrations of carbon dioxide for 48 h, represented by CK, TA, TB, TC, and TD. CK, treated with air for 48 h; TA, treated with 25% CO2 + 75% air for 48 h; TB, treated with 50% CO2 + 50% air for 48 h; TC, treated with 75% CO2 + 25% air for 48 h; TD, treated with 95% CO2 + 5% air for 48 h. TPS, trehalose-6-phosphate synthase; TRE1, soluble trehalase, including TRE1-1, TRE1-2, TRE1-3 and TRE1-4; TRE2, membrane-bound trehalases. * p < 0.05, ** p < 0.01, according to Student’s t-test.
Agriculture 12 00979 g005
Figure 6. Relative expression levels of genes related to the insulin signaling pathway ((A) TcInR1; (B) TcInR2; (C) TcIlp1; (D) TcIlp2; (E) TcIlp3; (F) TcIlp4) in T. castaneum after 48 h of treatment with different concentrations of carbon dioxide, represented by CK, TA, TB, TC, and TD. CK, treated with air for 48 h; TA, treated with 25% CO2 + 75% air for 48 h; TB, treated with 50% CO2 + 50% air for 48 h; TC, treated with 75% CO2 + 25% air for 48 h; TD, treated with 95% CO2 + 5% air for 48 h. InR, insulin-like reporter gene, included InR1 and InR2; Ilp, insulin-like gene, including Ilp1, Ilp2, Ilp3, and Ilp4. * p < 0.05, ** p < 0.01, according to Student’s t-test.
Agriculture 12 00979 g006
Table 1. Primers used for RT-qPCR.
Gene NameGenBank NumberForward Primer (5′-3′)Reverse Primer (5′-3′)Length (bp)
QTcRPL13a [34]XM_969211ACCATATGACCGCAGGAAACGGAAACCTTGTTACGACTT
QTcTre1-1XM_968798AACGACTCGCAATGGCTGGCGGAGGCGTAGTGGAATAGAG127
QTcTre1-2XM 968883GTGCCCAATGGGTTTATCGCAACCACAACACTTCCTTCG261
QTcTre1-3XM_968859CCTCTCATTCGTCACAAGCGAAGCGTTTGATTTCTTTGCG205
QTcTre1-4XM_968826ACGGTGCCCGCATCTACTAGTGTAGGTGGTCCCGTTCTTG187
QTcTre2EFA11183CTCAGCCTGGCCCTTAGTTGGGAGTCCTCGTAGATGCGTT120
QTcTPSXM_970683CGATTCGTACTACAACGGCTGCGTGGTGTAGCATTGCCAGTGC105
QtcInR1KF922648.1CGGCCGTCTAACACTTACGTGCAGGGTCATACACTTCGGC601
QtcInR2KF922649.1GGGCTGCAAACAGTTGTGTTAAGTGCCGTTCAGCATCGTC287
QTcIlp1EFA02918.1TTACGTCTGGTCTTCACCGCACATTGGTTGGGTTTGGATTCGGAGAGT97
QTcIlp2EFA02796.2TGGCCGGAATACACACTTGTAGGATCTTCTTCCGCAGTAGACCGCTTT152
QTcIlp3EEZ99258.2AAAGTCTGCTTCACCTTGCTCCTCAATAGCGCACAGTTCGGTGAGAGT143
QTcIlp4KYB29166.1TCGGAGAAGCGACCAAAGCTACAATCTGAAGTGATAGAAGCGCCAGCA131
Publisher’s Note: MDPI stays neutral with regard to jurisdictional claims in published maps and institutional affiliations.

