Abstract
Rural human settlement improvement (RHSI) is the basis for enhancing rural households’ life quality and promoting their well-being. Studying the impact of the livelihood capital level and structure on rural households’ payment willingness for RHSI will help to clarify the effective focus for implementing a payment system for rural environmental governance, which is of great significance for improving rural human settlements and promoting comprehensive rural revitalization. This study reveals the influence mechanism of the livelihood capital level and structure on rural households’ willingness to pay (WTP) for RHSI. According to the survey data of rural households in Hubei Province, China, the level and structure of rural households’ livelihood capital and their WTP for RHSI are analyzed using the entropy value method and the contingent valuation method. The effects of the livelihood capital level and structure on rural households’ WTP for RHSI are tested using the Probit and Tobit models. The results show significant differences in the level and structure of rural households’ livelihood capital. More than half of the rural households have a payment inclination for RHSI, but the distribution of the willingness payment amounts shows a clear polarization, with the average payment amount ranging from CNY 14.48 to 28.32 per month. Both the total livelihood capital level and classification levels (natural capital, human capital, financial capital and social capital) significantly positively affect the rural households’ WTP. In the livelihood capital structure, both the natural-capital-dominant type and financial-capital-dominant type significantly positively affect the rural households’ WTP, and the human-capital-dominant type significantly positively affects the rural households’ willingness payment amount. Accordingly, this study proposes policy recommendations for the multi-dimensional improvement of rural households’ livelihood capital and the optimization of the livelihood capital structure allocation.
1. Introduction
The term “human settlement” first appeared in Greek scholar Doxiadis’s “EKISTICS”, in which he proposed the theory of the “sciences of human settlements”, emphasizing that a human settlement is a territorial arrangement by humans with the main purpose of meeting human survival needs [1]. This theory has profoundly influenced the global human settlement research, and it marks the beginning of the formation of human settlement science, with urban planning as its core. Generally speaking, from the urban–rural perspective, human settlements can be divided into urban and rural human settlements. There are many studies on urban human settlements, but little research has been conducted on rural human settlements. Rural human settlement development has become the focus ever since the United Nations’ Agenda 21 was issued in 1992. The theme “Cities are Engines of Rural Development” was presented on World Habitat Day in 2004, emphasizing that while improving urban human settlements, the appropriate infrastructure and public services should be added to rural settlements [2]. It is obvious that rural human settlements are an important part of the human settlement system.
The rural human settlement is a systematic combination of various materials that rural households need for production and everyday life, which provides space for rural households to live, work, play, and socially interact [3]. Rural human settlement improvement (RHSI) is an important task to promote comprehensive rural revitalization, and also an important link to promote rural infrastructure construction and the equalization of basic public services in urban and rural areas, especially for a developing country such as China, with a large rural population. However, the rapid development of urbanization in China has also triggered a series of rural human settlement problems, such as the disordered development of rural settlement spaces, severe damage to the ecological landscape, and a lag behind public service construction. At present, the rural human settlement has become a shortcoming to realize the beautiful and happy lives of rural households in China. To strengthen RHSI and meet the growing demand of rural households for a better environment, the Chinese government has issued a series of support policies, such as the Guiding Opinions on Improving Rural Human Settlements and the Three-Year Action Plan for the Improvement of Rural Human Settlements. In recent years, the Chinese government has increased investment in human settlement facilities, and the rural human settlements has been continuously improved. However, it is difficult to fundamentally solve the long-accumulated rural human settlement problems in the short term, such as the direct discharge of rural domestic sewage, the random disposal of domestic garbage, and the serious challenge regarding the toilet revolution, which will persist in rural China [4].
At present, China’s RHSI is still at a relatively low level as a whole. The serious shortage of financial investment is one of the most important reasons that the implementation effect of RHSI in China is not obvious [5]. For a long time, the total investment in public services and infrastructure construction in China has been limited. The resources invested in rural areas are prioritized for infrastructure construction in the production and lives of rural households, such as irrigation facilities and road facilities, while investment in the governance services and infrastructure of rural human settlements is insufficient. An important strategy to break through the bottleneck of insufficient financial investment is to implement a rural household payment system for environmental governance. In the document of the Five-Year Action Plan for the Improvement of Rural Human Settlements (2021–2025), the following schemes were proposed: “The waste and sewage treatment rural household payment system could be established in conditional areas. The operation management system with reasonable payments by rural households, overall planning by village-level organizations, and appropriate subsidies by the government should be gradually established, and the proportion of rural households’ payment sharing should be reasonably determined.” Having the government as the only funding source for RHSI will not only pose a large financial burden, but will also decrease the investment efficiency and supply levels [6]. As the core subject of rural environmental governance, rural households are the producers and direct stakeholders of rural environmental problems, and their active participation is closely related to the effects of environmental governance [7]. Generally speaking, most rural domestic pollution is mainly caused by local rural households. According to the “polluter pays” principle, rural households should bear responsibility for pollution control and should pay reasonable treatment costs. The establishment of a rural household payment system for environmental governance will help to supplement RHSI funds and stabilize RHSI management and maintenance investments. Therefore, exploring rural households’ willingness to pay (WTP) for RHSI and its influencing factors has important practical significance for improving the current RHSI effect.
At present, there have been some exploratory studies on rural households’ WTP for RHSI. The existing studies mainly concentrate on remediation projects such as domestic waste recycling and utilization, the centralized treatment of domestic sewage, and toilet cleaning and renovation. These studies have explored the various factors affecting rural households’ WTP for RHSI, such as personal and household characteristics [8], environmental cognition [9], and virtual social networks [10]. The decision-making behavior of rural households participating in environmental governance is not only affected by factors such as personal and household characteristics, environmental cognition, and virtual social networks, but is also constrained by their own capital endowment. According to Bourdieu’s theory of practice, there is a link between objective capital endowments and subjective behavioral decisions, and individuals cannot form a reasonable practice of willingness until they have a minimum amount of capital [11]. Livelihood is a way for rural households to make a living, and rural households’ livelihood capital has been commonly used to characterize their capital endowment [12,13]. Some scholars have tried to explore the relationship between livelihood capital and rural households’ WTP for environmental governance from the perspective of livelihood capital. For example, based on survey data from North-Eastern Bangladesh, Al-Amin et al. selected some variables to represent the livelihood capital status of the respondents. They found that local residents’ livelihood capital significantly impacts their willingness to pay for wetland protection [14]. He et al. found that interpersonal trust and institutional trust in social capital play important roles in households’ willingness to pay for the energy utilization of crop straw [15]. Li et al. found that interpersonal trust, institutional trust, and class identity in social capital can significantly improve farmers’ willingness to pay for the reuse of household kitchen waste [16].
There are still two limitations in the existing studies of rural households’ WTP for RHSI. Firstly, the role of livelihood capital has not been fully discussed. The existing studies mainly consider the research perspective of social capital, and pay less attention to the effects of other types of livelihood capital, such as nature, physical, human, and finance, on rural households’ WTP for environmental governance. The influence mechanisms and effects of livelihood capital on rural households’ WTP for RHSI have not been fully explored. Secondly, the overall influence effect of livelihood capital has not been systematically explored. The existing studies mostly stay at the level of rural household livelihood capital measurement indicators, focusing on the effects of certain measurement indicators on rural households’ WTP for environmental governance. The overall influence effect of livelihood capital has not been systematically considered from the aspects of level and structure. Rural households’ livelihood capital can be regarded as a collection of various capital stocks owned by rural households. The level of livelihood capital reflects the abundance of rural households’ livelihood capital stocks, while the structure of livelihood capital reflects the internal composition of rural households’ livelihood capital stocks. Therefore, paying attention to the differences in the level and structure of rural households’ livelihood capital can more comprehensively describe the overall situation of rural households’ livelihood capital and help in understanding their relative advantages. Discussing the subject regarding the aspects of level and structure will help us to comprehensively understand the influence mechanism of livelihood capital on rural households’ WTP for RHSI, and will then provide good policy implications for improving the effect of RHSI.
Considering this, on the basis of comprehensively considering rural households’ livelihood capital, this study reveals the influence mechanism of the livelihood capital level and structure on rural households’ WTP for RHSI. According to the survey data of rural households in Hubei Province, China, the total level and classification level of rural households’ livelihood capital are calculated using the entropy method and the weighted summation method, and their livelihood capital structure is divided on this basis. The rural households’ WTP for RHSI is analyzed using the contingent valuation method (CVM). Then, the effect of the livelihood capital level and structure on rural households’ WTP for RHSI is further examined by using the Probit and Tobit models. This study can help to guide decision-makers to establish a rural household payment system for RHSI, thereby providing policy guidance for establishing a long-term mechanism for RHSI and promoting the construction of beautiful and livable villages in China. It can also bring inspiration for other countries to implement RHSI.
2. Literature Review and Research Hypothesis
WTP refers to the amount that consumers are willing to pay for a certain amount of consumer goods or services [17]. Therefore, rural households’ WTP for RHSI can be defined as their payment inclination and willingness payment amount for various RHSI actions. Livelihood capital is the basic means by which rural households carry out their livelihood activities. Most existing studies have adopted the sustainable livelihood framework to classify livelihood capital into five categories: natural capital, physical capital, human capital, financial capital, and social capital [18,19]. Livelihood capital determines rural households’ affordability to pay RHSI costs, resulting in differential perceptions of RHSI policies, eventually affecting rural households’ WTP. In this study, we first make a premise assumption and then propose a research hypothesis.
Assumption 1: Rural households decide their WTP for RHSI after considering their livelihood capital level. Specifically, they are divided into the five categories, listed below.
Natural capital refers to the water, land, and biological resources on which humans live [13]. It mainly includes two components, the natural conditions and the quality of the living environment. Firstly, the natural conditions include the topography and arable farmland. Generally speaking, the better the topography, the larger the farmland size, the better the agricultural production conditions, and the lower the cultivation cost. Accordingly, rural households will increase their use of pesticides and fertilizers and apply agricultural films to obtain higher agricultural profits, which will result in an increase in agricultural production waste. To efficiently manage such productive pollution and improve their agricultural income, rural households are often willing to invest large amounts of money to support RHSI. Secondly, the quality of the living environment is the other aspect of natural capital. Individuals’ WTP for environmental protection is influenced by the environment of their living area, such as the quality of the living environment [20]. There are two views on the relationship between the human settlement quality and rural households’ WTP for RHSI. One view maintains that, in the long run, improving the human settlement quality not only effectively enhances the rural infrastructure and public services, but also better increases rural households’ living standards and quality [21,22], ultimately motivating them to invest in RHSI in the long term. The other view holds that when the quality of the living environment is high, rural households may be reluctant to pay a certain economic cost to maintain a good human settlement due to their short-sighted consumption characteristics [23], indicating a negative impact on the WTP. However, with the increasing living standards in China and the elimination of absolute poverty from the country, rural households are strongly willing to improve their life quality and build beautiful and livable villages [3]. This study adopts the first view: the higher the quality of the living environment, the stronger the expected rural households’ WTP. Based on the above analysis, we propose the following hypothesis.
Hypothesis 1 (H1):
Natural capital significantly and positively affects rural households’ WTP for RHSI.
Physical capital mainly refers to public facilities and material equipment used for production and daily life by the households [24]. It mainly has three components: family housing structure, the number of household appliances, and rural infrastructure construction. Firstly, housing is a common indicator used to characterize rural households’ physical capital [25]. The optimization of rural households’ housing structure and improvement of their housing conditions greatly facilitate the management of rural domestic waste and sewage and promote the construction and renovation of household sanitary toilets, which reflects the importance that rural households attach to environmental sanitation management. Secondly, to a certain extent, the number of household appliances reflects the living standards of the rural households. When the living standard is relatively high, rural households seek to improve their living quality and environment, and are naturally more willing to pay for RHSI. Thirdly, rural infrastructure, as the foundation of rural human settlements, is a “hard environment” directly affecting rural households’ daily experiences [4]. The better the state of rural infrastructure construction, the stronger the economic strength that the villages possess, the greater the organization and operation abilities that the village collectives have, and the more strength and confidence the rural households have to participate in rural infrastructure supply. However, the rural public infrastructure supply by the government can also rule out rural households’ self-supply, increasing their dependence on government supply and eventually reducing their enthusiasm to participate in rural infrastructure supply. Therefore, the effects (positive or negative) of rural infrastructure construction on rural households’ WTP for RHSI remain elusive. Based on the above analyses, the following hypothesis is proposed.
Hypothesis 2 (H2):
Physical capital significantly affects rural households’ WTP for RHSI.
Human capital refers to the capital possessed by the laborers themselves, such as their knowledge, skills, labor ability, and health status [12]. It mainly consists of three components: the quantity of human capital, quality of human capital, and environmental remediation training. Firstly, families with larger numbers of laborers usually have higher household incomes and more time and energy to participate in RHSI; thus, they may be more willing to pay for RHSI. Secondly, the quality of human capital involves the head of the household’s education level and the health status of the household members. With the education level of rural households increasing, their awareness of eco-environmental protection is being enhanced [26,27]. In addition, rural households with family members in better health have more energy to be engaged in production activities and show more concern for human settlement issues; thus, they are more likely to have a stronger WTP for RHSI. Thirdly, rural households with more professional training exhibit greater acknowledgment of environmentally friendly behavior [28]. Training on RHSI can enhance rural households’ enthusiasm to participate in environmental remediation, thereby increasing their WTP. Based on the above analysis, the following hypothesis is proposed.
Hypothesis 3 (H3):
Human capital significantly and positively affects rural households’ WTP for RHSI.
Financial capital is an individual’s financial ability to achieve their livelihood goals, which is manifested via their income status, consumption expenditure, and loans obtained through various channels [12]. Financial capital consists of two main components, namely the household income situation and financing capacity. Firstly, the household income situation refers to the annual household income and income stability. Rural households with high annual incomes pursue a high-quality life that can meet their economic, cultural, ecological, and other needs [29,30], pay more attention to the human settlement problems, and tend to have a higher WTP for RHSI. In addition, income stability reflects rural households’ stable ability to access economic resources and resist risk. Rural households with higher income stability are likely to have a stronger WTP when faced with RHSI payments that may affect the household income. Secondly, the financing capacity can be measured by the households’ ability to obtain loans. The financing capacity reflects the minimum security capacity of rural households, especially those highly dependent on agriculture for income, to cope with risks and withstand shocks. This capacity has a certain guarantee effect on rural households’ WTP. Based on the above analysis, the following hypothesis is proposed.
Hypothesis 4 (H4):
Financial capital significantly and positively affects rural households’ WTP for RHSI.
Social capital represents the emotional relationships or resource exchanges that people form during social interactions, and its core elements mainly include social trust, reciprocal norms, and social networks [31]. Firstly, social trust refers to people’s conceptualized expectations of the reliability of interaction objects during an interaction, and social trust can be divided into interpersonal trust and institutional trust. Interpersonal trust can enhance individuals’ WTP for environmental policy practices because they believe that other community members will also be ready to pay for advocated policies [32,33]. Institutional trust is triggered by impersonal relationship-based social phenomena, and institutional policies have been reported to directly or indirectly influence individuals’ motivation and willingness to participate in environment protection projects [34,35]. Therefore, the higher the recognition and trust that the rural households have in the RHSI-related system and policies, the more optimistic they are towards the prospects of RHSI, and the higher WTP they have. Secondly, reciprocity norms refer to the interdependence between individuals. In a community that advocates for mutual benefit, individuals’ WTP for environmental governance actions will affect the environmental participation behavior of other community members [36]. Thirdly, social networks refer to the links between participants in social structures. A good social network can remove barriers of awareness, technology, and finance so that rural households can participate in environment remediation, and can also effectively resolve interest conflicts within the community [37]. Therefore, good social networks contribute to shaping the communication function of RHSI to induce the generation of rural households’ WTP. Based on the above analyses, the following hypothesis is proposed.
Hypothesis 5 (H5):
Social capital significantly and positively affects rural households’ WTP for RHSI.
Assumption 2: There are differences in mobility and substitution among various rural households’ livelihood capital. Theoretically, the impact effects of capital endowment are the results of the synergistic action of capital endowment abundance and capital endowment density [38]. Capital endowment abundance can be divided into the total level and multidimensional level. Capital endowment density is mainly manifested as differences in the capital endowment structure [39]. The differences in substitution and mobility among different types of capital endowments are reflected in both the level and structure of the capital endowments [40,41]. Due to the substitutability among various types of livelihood capital, rural households will use their stronger livelihood capital to compensate for the deficiencies caused by their weaker livelihood capital, and will make a decision on their WTP for RHSI after thoughtful consideration. For example, rural households can use their stronger financial capital to compensate for the deficiencies resulting from lower human capital, in turn reducing the negative impact on paying for RHSI due to insufficient household labor. Because of the low availability or high substitution costs of certain livelihood capital types, the substitution rates and mobility are different among the different types of livelihood capital. Therefore, rural households will reduce their WTP due to a relative shortage of a certain type of livelihood capital. For example, low availability of social capital leads to limited access to environment remediation information and technology for rural households, thereby reducing their WTP for RHSI. Based on the above analysis, the following hypothesis is proposed.
Hypothesis 6 (H6):
The livelihood capital structure significantly affects rural households’ WTP for RHSI.
According to the above influence mechanism analysis and research hypothesis, the theoretical analysis framework for this study is as shown in Figure 1.
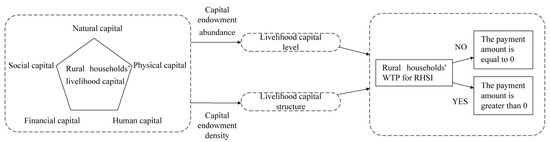
Figure 1.
The theoretical analysis framework for this study.
3. Materials and Methods
3.1. Study Area and Data Collection
To ensure the typicality and representativeness of the research area, this study combines typical sampling and random sampling to select the research area. In recent years, the overall quality of China’s rural human settlements has improved, with a gradient difference between the eastern region (high) and the central or western regions (low). The quality of rural human settlements in the central region is the closest to the national average level [42]. Hubei Province, one of the nine central provinces, has been implementing the Three-Year Action Plan for RHSI issued by the State Council in recent years and vigorously promoted RHSI, ranking among the top in Central China in the national third-party field monitoring assessment in 2019 and 2020. Therefore, Hubei Province is selected as a representative study area to examine the current RHSI implementation in China comprehensively. Wuhan City, Xianning City, and Ezhou City are selected as research areas at the city level because these three cities have actively implemented RHSI and have achieved remarkable effects since 2018. Wuhan, the capital city of Hubei Province, has taken the lead in implementing the Three-Year Action Plan for RHSI. Ezhou, the frontline of reform and opening up in Hubei Province, has also carried out a three-year campaign to improve the rural human settlements. Xianning, bordering Wuhan and Ezhou, is deeply influenced by these two cities in its RHSI work, and it has also implemented a three-year action plan. These three cities are representative RHSI areas in Hubei Province, and their RHSI effect exceeds the provincial average.
A field survey was conducted from October to November 2020 in the above three cities in combination with stratified and random sampling. Specifically, the survey was performed as follows. Firstly, we randomly selected 2 counties (districts) from each city. Secondly, according to the regional population number and area, 4~5 villages were extracted from each county (district). Finally, based on the village population number, 15~25 rural households were randomly selected from each village for the questionnaire. The survey was conducted in face-to-face interviews, and the respondents were all household heads or people with important voices in the family. The survey mainly focused on the rural households’ basic information, livelihood capital status, and WTP for RHSI. A total of 524 questionnaires were distributed in the survey. After eliminating invalid questionnaires with errors or missing key information, 442 valid questionnaires were finally obtained, accounting for 84.35%. The location of the study area is shown in Figure 2.
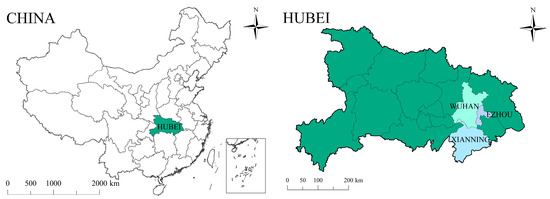
Figure 2.
Location of the study area.
The basic characteristics of the sampled rural households are shown in Table 1. In general, the sampled rural households are characterized by being middle-aged or above, having a low household head education level, having a medium family size but a high proportion of part-time employment, and having a relatively high annual household income.

Table 1.
Basic characteristics of respondents.
3.2. Variable Selection
(1) Dependent variables: rural households’ WTP for RHSI, including the payment inclination and willingness payment amount, and it is calculated using the contingent valuation method (CVM). This method directly examines the respondents’ economic behavior in a hypothetical market using questionnaires to infer people’s WTP for protecting the benefits of public goods [43,44]. To help the respondents to better understand the rural households’ WTP for RHSI, we provide a hypothetical scenario where, in order to create and maintain good rural human settlements and enhance rural households’ happiness and satisfaction, the government finances the RHSI work, but government funding alone is far from sufficient. Based on the principle of beneficiary payments, rural households are expected to pay for the environmental benefits and economic gains brought about by local RHSI. In addition, since the government funding is non-profit in nature, the monthly fee paid by rural households will be invested in RHSI projects. In the questionnaire, two core questions examine rural households’ WTP. One is “Are you willing to pay a certain monthly amount to support RHSI?”. “Willing to pay” is assigned a value of 1, and “not willing to pay” is assigned a value of 0. If the respondents have a payment inclination, the second question is asked: “How much are you willing to pay for RHSI per month?”. To reduce the respondents’ workload and avoid possible impatience in the interview process, we used a payment card approach to guide rural households’ real valuations of RHSI [45]. With reference to the amount paid by Chinese rural households for various rural environmental governance actions [15,46,47,48], there were 10 options in the questionnaire for the respondents to choose: “(A) CNY 1~10; (B) CNY 11~20; (C) CNY 21~30; (D) CNY 31~40; (E) CNY 41~50; (F) CNY 51~60; (G) CNY 61~70; (H) CNY 71~80; (I) CNY 81~90; (J) CNY 91~100”. The respondents determined their own willingness payment amount based on the options. For the respondents with no payment inclination, their willingness payment amount was recorded as 0.
(2) Core independent variables: the livelihood capital level and structure of rural households. The meaning, assignment rules, and descriptive statistical characteristics of the livelihood capital variables are shown in Table 2. This study adopts the entropy method to normalize the five types of livelihood capital variables and calculate their weights. The five types of livelihood capital levels and the total livelihood capital level are calculated through the weighted summation method. In addition, this study classifies rural households into five dominant types based on five types of livelihood capital levels: the natural-capital-dominant (ND) type, physical-capital-dominant (PD) type, human-capital-dominant (HD) type, financial-capital-dominant (FD) type, and social-capital-dominant (SD) type. For example, the ND type indicates that the rural households own the highest level of natural capital among the five types of livelihood capital that they possess.
Table 2.
Setting and assignment of livelihood capital variables.
(3) Control variables. Individual and household characteristics, as common control variables in the studies of rural household behavioral intentions, have a significant impact on the rural households’ participation in RHSI, such as domestic waste and sewage treatment initiatives [37,48]. To make the model more scientific, this study introduces gender, age, age-squared, and occupation type for the individual characteristics, and the total population number of household characteristics as the control variable.
3.3. Research Methods
3.3.1. Entropy Method
The entropy method is a commonly used objective weighting method, which can determine the index weight according to the discrete degree of the index, so it can effectively avoid the deviation caused by human factors [49]. If the information entropy contained in an indicator is smaller, this means that the indicator is more discrete and contains more information and has a greater impact on the comprehensive evaluation, so it needs to be given a greater weight. Conversely, if the information entropy contained in an indicator is larger, it needs to be given a smaller weight. Referring to the relevant studies [50,51], this study uses the entropy method to calculate the weights of various livelihood capital measurement indicators and then calculates the total level and classification level of the rural households’ livelihood capital through the weighted summation method. The specific steps are as listed below.
Step 1: Build the original data matrix X:
where represents the value of the j-th livelihood capital indicator of the i-th rural household; .
Step 2: Data normalization. Since the measurement units of each indicator in this study are not uniform, it is necessary to standardize the value of each indicator. The positive and negative indicator values have different meanings, so different algorithms are used to standardize the indicators.
Positive indicators:
Negative indicators:
where is the standardized value; and are the maximum and minimum values of the j-th indicator, respectively.
Step 3: Data translation processing. The value processed in the previous step may equal zero, so data translation processing is required.
Step 4: Calculation of the indicator weights. Calculate the proportion of the j-th indicator in the i-th rural household.
Step 5: Calculation of the information entropy. Calculate the information entropy of the j-th indicator.
Step 6: Calculation of the difference coefficient. Calculate the difference coefficient of the j-th indicator.
Step 7: Calculation of indicator weights. Calculate the weight of the j-th indicator.
Step 8: Calculation of the comprehensive evaluation value. The comprehensive evaluation value U is calculated using the weighted summation method.
According to Formula (8), the five types of livelihood capital levels of rural households can be calculated. The total level of rural households’ livelihood capital can be obtained by adding up the five types of livelihood capital levels.
3.3.2. Model Selection
The rural households’ WTP for RHSI includes payment inclination (whether they are willing to pay) and willingness payment amount (how much they are willing to pay). This study firstly examines the effects of the livelihood capital level and structure on rural households’ payment inclination, and then examines the effects of the livelihood capital level and structure on rural households’ willingness payment amount. To obtain robust regression results and refer to related studies on similar issues [52,53,54], this study uses the Probit model and Tobit model to estimate the effects of the livelihood capital level and structure on rural households’ WTP for RHSI.
In the payment inclination model, the payment inclination is the dependent variable. Willingness to pay is assigned a value of 1, and unwillingness to pay is 0. Since the dependent variables in this study are binary variables, the ordinary linear regression model is no longer applicable. Therefore, this study uses the classical Probit model to analyze the effects of the livelihood capital level and structure on payment inclination. The Probit model is as follows:
In Equation (10), indicates that rural households are willing to pay for RHSI; is the independent variable; is the coefficient to be estimated; is a function with values strictly ranging from 0 to 1; for all real numbers, , ; ; is the standard normal distribution function.
In the willingness payment amount model, the willingness payment amount is the dependent variable, which belongs to the continuous left-censored data with partial zero values. If the least-squares estimation is used, the estimation results will be biased. The Tobit model can solve this estimation bias problem well. The latent variable model of the Tobit model is as follows:
In Equation (11), , .
In Equation (12), the dependent variable is the latent variable, and is the observed variable of . When > 0, the observed variable = ; when ≤ 0, = 0; is the independent variable, and is the parameter to be estimated.
4. Results and Discussion
4.1. Analysis of Rural Households’ Livelihood Capital
4.1.1. Level Analysis
This study calculates the weights of the various livelihood capital variables using the entropy method, and then calculates the total level and classification level of the rural households’ livelihood capital using the weighted summation method (Table 3). For the total livelihood capital level, its maximum value differs greatly from its minimum value, with a mean of 0.4792 and a large standard deviation of 0.1216, indicating a great difference in the total livelihood capital level among the rural households. In terms of the livelihood capital classification levels, based on the means, the various types of livelihood capital are ranked in the following order: human capital (0.1292) > natural capital (0.1053) > financial capital (0.0950) > physical capital (0.0778) > social capital (0.0719). The standard deviation is ranked in the same order. This result indicates that the sampled rural households exhibit the highest level of human capital with large internal variation and the lowest level of social capital with small internal variation.
Table 3.
Evaluation of total level and classification levels of rural households’ livelihood capital.
To further reveal the differences in livelihood capital among the rural households, this study classifies the rural households whose livelihood capitals are below the mean value as the weak capital type and those above the mean value as the strong capital type, based on the mean value of the livelihood capital level. In terms of the total livelihood capital level, the number of rural households with strong capital is small (191, accounting for 43.21%), while the number of rural households with weak capital is large (251, accounting for 56.79%). In terms of the natural capital, human capital, and financial capital, the weak-capital-type rural households represent a high proportion, and the three types of livelihood capital ranked by proportion are as follows: human capital (83.48%) > natural capital (65.61%) > financial capital (56.56%). Rural households exhibit the most significant differences in human capital level, which is consistent with the above-mentioned analysis result showing the large internal variation in human capital. In terms of both physical capital and social capital, strong-capital-type rural households represent a high proportion, ranked as follows: physical capital (61.99%) > social capital (50.23%). This result indicates a balanced distribution between the two types of rural households (strong type vs. weak type) and a lower level of social capital for both types, which is in line with the above analysis result showing the small internal differences in social capital.
4.1.2. Structure Analysis
Based on the calculation results, the livelihood capital structure of the sampled rural households was analyzed (Table 4). Among the 442 sampled rural households, the number of HD-type rural households was the largest (181), accounting for 40.95%, followed by the ND-type (129, 29.19%) and FD-type rural households (104, 23.53%), respectively. The number of PD-type rural households was relatively small (26), accounting for 5.88%, and the number of SD-type rural households was the smallest (only 2), accounting for less than 1%. These results reconfirm the lowest level of social capital among the five types of livelihood capital that rural households possess. In addition, no compound-type capital rural households were found according to our classification of the livelihood capital structure.
Table 4.
Livelihood capital structure of rural households.
4.2. Analysis of Rural Households’ WTP for RHSI
Table 5 shows the distribution of rural households’ WTP for RHSI. The results show that only 51.13% of the sample rural households have a payment inclination for RHSI. The distribution of each payment amount range is quite different, showing obvious polarization. The willingness payment amounts of rural households are mainly distributed in the low payment range of CNY 1~20 and the high payment range of CNY 71~100. The reason may be that the rural households with high income have a higher WTP for RHSI. The statistical results show that there are 78 rural households in the high payment range (CNY 71~100), of which 79.49% of them have an annual income of more than 50,000 yuan; there are 64 rural households in the low payment range (CNY 1~20), of which 54.69% of them have an annual income of no more than 50,000 yuan.
Table 5.
The distribution of rural households’ WTP for RHSI.
Referring to relevant studies [50,55], this study uses the following formula to calculate the upper limit of the rural households’ average payment amount:
where represents the -th payment range; represents the payment amount determined by rural households in the -th payment range; is the possibility of selecting the -th payment range for rural households, which is obtained by calculating the proportion of rural households in the -th payment range. It can be calculated that the upper limit of rural households’ payment for RHSI is CNY 28.32 per month.
Referring to relevant studies [41], this study uses the following formula to calculate the lower limit of the willingness payment amount for a single rural household:
where indicates the proportion of rural households with no payment inclination. It can be calculated that the lower limit of rural households’ payment for RHSI is CNY 14.48 per month. Finally, the average payment amount of rural households for RHSI is CNY 14.48~28.32 per month.
4.3. Cross-Analysis of Livelihood Capital and Rural Households’ WTP for RHSI
According to our classification of the livelihood capital level and structure, we examined the surveyed rural households’ WTP for RHSI (Table 6). In terms of the classification of the livelihood capital level, the proportion of strong-capital-type rural households willing to pay for RHSI is up to 59.69%, and the mean value of their payment amount is CNY 28.24 per month, whereas the proportion of weak-capital-type rural households that are willing to pay is only 44.62%, and their average payment amount is CNY 13.08 per month.
Table 6.
Cross-analysis of livelihood capital and rural households’ WTP for RHSI.
In terms of the different livelihood capital structures, there are significant differences in WTP for RHSI among the rural households. Among the three types of ND, HD, and FD, more than half of the rural households are willing to pay, accounting for 55.04%, 51.93%, and 50.96%, respectively, with relatively high average payment amounts of CNY 20.17 per month, CNY 19.8 per month, and CNY 22.61 per month, respectively. The proportion of the PD-type rural households willing to pay is the lowest, only accounting for 34.62%, with a low mean payment amount of CNY 10.74 per month. In contrast, only two SD-type rural households are willing to pay, with the lowest willingness payment amount of CNY 5.63 per month.
To summarize, the differences in the level and structure of the livelihood capital affect rural households’ WTP for RHSI, and the significant level difference and unreasonable structure of the livelihood capital may be the reasons for rural households’ low WTP for RHSI.
4.4. Model Regression Results
A multicollinearity test of livelihood capital variables was performed prior to the model regression analysis. The test results show that the variance inflation factor (VIF) range is between 1.03 and 1.46 (far below 10), indicating no serious multicollinearity. The effects of the livelihood capital level and structure on the rural households’ WTP for RHSI are investigated through the Probit model and Tobit model to verify the six hypotheses proposed above, and the regression results are shown in Table 7. Model (1), Model (3), and Model (5), based on the Probit model, are used to explore the effects of the livelihood capital level and structure on the payment inclination, while Model (2), Model (4), and Model (6), based on the Tobit model, are employed to investigate the effects of the livelihood capital level and structure on the willingness payment amount. The level of livelihood capital includes two aspects: the total level and classification level. To avoid the “dummy variable trap”, the PD type is selected as the reference, and the remaining four types are set as dummy variables to examine the effects of the livelihood capital structure on rural households’ WTP for RHSI.
Table 7.
Effect of the livelihood capital level and structure on rural households’ WTP for RHSI.
Models (1) and (2) are the regression results of the total livelihood capital level (TC). The results show that the total livelihood capital level significantly and positively affects the rural households’ WTP for RHSI. High-quality efficient livelihood capital is the basis for rural households’ ecological production activities [40]. The higher the total livelihood capital level, the easier it is to pay for RHSI, and the more likely they are to have WTP.
Models (3) and (4) are the regression results of the livelihood capital classification level. The results show that the natural capital level (NC), human capital level (HC), and financial capital level (FC) significantly and positively affect the rural households’ WTP for RHSI, which verifies H1, H3, and H4. A high natural capital level indicates that the rural households have more natural resources for agricultural production, such as for farmland, and a good living environment to obtain stable agricultural income and maintain a high-quality life [56]. In this case, rural households are often willing to pay for RHSI and invest heavily in the long term. A high level of human capital generally indicates that the rural households’ members have a better health status, a higher level of education, and a large number of family laborers [57]. Such rural households have more energy to be engaged in production activities, show more concern about habitat issues, and are more willing to pay for RHSI. A high level of financial capital means that the rural households have a high annual income, low difficulty in borrowing, and a good credit environment [58]. The increase in annual income also enhances their demand for a high-quality life, so they usually have a higher WTP for RHSI. The low loaning difficulty reflects that the rural households have a good credit environment and good minimum security against risks, meaning that they may have a strong ability to pay for RHSI. The social capital level (SC) significantly and positively affects the rural households’ WTP for RHSI, corroborating H5. Harmonious neighborhood relationships can shape and enhance the sense of identity among rural households, facilitating a reciprocal mechanism of risk-sharing and benefit-sharing among rural households [59]. The more trust that rural households have in their friends and neighbors, the more smoothly they can exchange information with each other, and the lower the cooperation cost is between them, resulting in a stronger WTP. Rural households with higher institutional trust exhibit higher recognition of RHSI-related policies [60], display more active responses to the calls of the government and village collectives, and are more willing to participate in government projects such as RHSI.
However, the effect of the physical capital level (PC) on the rural households’ WTP does not pass the significance test, meaning that H2 is not verified. It should be noted that although the physical capital level does not show a significant impact, its influence on the rural households’ WTP for RHSI cannot be denied. The reason for this insignificance may be that the positive and negative effects of the variables (such as the family housing structure, the number of household appliances, and the rural infrastructure construction) offset each other, which is in accordance with the theoretical analysis.
Models (5) and (6) show the regression results for the four dummy variables of the livelihood capital structure. The ND type and FD type both significantly positively affect the rural households’ WTP for RHSI. RHSI projects can effectively control the agricultural non-point source pollution, creating favorable conditions for developing ecological agriculture [61], and the improvement of the village appearance and rural public infrastructure also provides supporting facilities for developing leisure agriculture. Therefore, in order to improve the agricultural operation income and broaden the income sources, ND-type rural households are naturally willing to participate and invest heavily in RHSI projects. The financial capital is relatively easy to be transformed into other types of livelihood capital [62]. For FD-type rural households, the reasonable structural allocation of various livelihood capital funds required to pay for RHSI can be easily achieved. The HD type significantly and positively affects the rural households’ willingness payment amount for RHSI, indicating that the improvement of rural households’ ability to pay for RHSI is highly dependent on human capital. The ability to pay is directly reflected in the amount that the rural households are willing to pay [63]. The dominance of human capital for the rural households suggests that they have a higher-quality labor force to obtain income and increase their household savings, which directly enhances the ability of the rural households to pay for environmental management. The above results indicate that the livelihood capital structure significantly affects the rural households’ WTP for RHSI, which verifies H6. Notably, although the SD type shows no significant impact, its impact on the rural households’ WTP is not denied in this study. Previous studies have found that the dominance of social capital in the capital structure significantly affects rural households’ willingness to invest in green production [41] and rural households’ ecological production activities [40]. This is true for the PD type, which is not included in the model.
Among the control variables, age positively affects rural households’ WTP for RHSI but not significantly, while age-squared significantly negatively affects the rural households’ WTP for RHSI. Age and the rural households’ WTP for RHSI show an inverted U-shaped relationship that first increases and then decreases, and the inflection point is at 54 years old. A possible explanation is that the physical quality and labor ability of farmers over 54 years old are declining yearly, and it is difficult for them to obtain a stable agricultural income through agricultural production activities, meaning that they are facing livelihood risks. They are more concerned about family livelihood issues than the village living environment, and do not have a strong WTP for RHSI. In addition, rural households with a large household population and a high degree of part-time employment have a strong WTP for RHSI.
4.5. Robustness Test
To test the robustness of the model regression results above, the dependent variables are reprocessed in this study with the other variables remaining unchanged. The variable processing method is as follows. The payment amount of the rural households unwilling to pay is assigned as 0. The payment amount within the range of 1~10 is assigned as 1. The payment amounts within the ranges of 11~20, 21~30, 31~40, 41~50, 51~60, 61~70, 71~80, 81~90, and 91~100 are assigned as 2, 3, 4, 5, 6, 7, 8, 9, and 10, respectively. The reprocessed dependent variables are ordered categorical variables; therefore, an ordered Probit model is used for regression. The regression results for Models (7), (8), and (9) show that the total livelihood capital level, livelihood capital classification level, and livelihood capital structure affect the rural households’ WTP for RHSI (Table 8). The robustness test results are basically consistent with the previous regression results (Table 7). This indicates that the regression results for Models (1) to (6) in this study are relatively robust, and the conclusions are reliable.
Table 8.
Robustness test results.
5. Conclusions
This study analyzed the influence mechanism of the livelihood capital level and structure on the rural households’ WTP for RHSI. According to the survey data of rural households in Hubei Province, China, the level and structure of the rural households’ livelihood capital and their WTP for RHSI were measured and analyzed. In addition, the effects of the livelihood capital level and structure on the rural households’ WTP for RHSI were tested using Probit and Tobit models. The major conclusions are as follows.
First, significant differences in the livelihood capital level and structure are observed among the surveyed rural households. The mean value of the rural households’ total livelihood capital level is 0.4792, and according to the mean values, the various types of livelihood capital are ranked as human capital (0.1292) > natural capital (0.1053) > financial capital (0.0950) > physical capital (0.0778) > social capital (0.0719). In terms of the structure, HD-type rural households are the largest group, accounting for 40.95%. Second, more than half of the rural households are willing to pay for RHSI, and the distribution of willingness payment amounts shows a clear polarization pattern. The proportion of rural households with both high (CNY 71~100 range) and low (CNY 1~20 range) willingness payment amounts is high. The average willingness payment amount is CNY 14.48~28.32 per month. Third, the livelihood capital level and structure significantly affect the rural households’ WTP for RHSI. Both the total livelihood capital level and the classification level (natural capital, human capital, financial capital, and social capital) significantly positively affect the rural households’ WTP. The ND type and FD type both significantly and positively affect the rural households’ WTP, and the HD type has a significant positive effect on the willingness payment amount.
The above conclusions reflect that livelihood capital is an essential factor affecting the rural households’ WTP for RHSI. Improving rural households’ livelihood capital stocks in multiple dimensions can help to enhance the rural households’ WTP for RHSI. However, it takes a great deal of resource investment and a long time to improve the livelihood capital stocks of rural households, so comprehensively improving rural households’ livelihood capital is a long-term project. Due to the mobility and substitution differences among the various types of rural households’ livelihood capital, it is of great practical significance to discuss how to enhance rural households’ WTP by optimizing the structure of livelihood capital. This study analyzes the effects of the livelihood capital level and structure on rural households’ WTP for RHSI, which not only helps us to understand the current weak links in rural households’ livelihood capital accumulation, but also helps to explore a breakthrough to enhance rural households’ WTP for environmental governance. This study also provides policy guidance for implementing an RHSI payment system and improving the effectiveness of RHSI projects. Based on the above findings, this study proposes the below policy recommendations.
First, the multi-dimensional rural household livelihood capital level should be enhanced, and the role of livelihood capital in influencing rural households’ WTP for RHSI should be emphasized. Thus, the natural conditions of different regions should be considered, and the moderate-scale operation of farmland should be encouraged through land transfer and other methods to optimize rural households’ natural capital. Great efforts should be made to provide village cadres and rural households with RHSI training and to enhance their civilization and health awareness for co-building a beautiful countryside through publicity and education, thereby enhancing the rural households’ human capital. A long-term mechanism should be established to increase the rural households’ income and consolidate poverty alleviation achievements, and importance should be attached to the construction of social security and financial services in rural areas so as to increase rural households’ financial capital. Finally, special attention should be paid to RHSI-related institutional creation and policy guidance to enhance the government’s credibility and the constraint force of relevant policies and regulations, thereby enhancing the rural households’ social capital.
Second, the structural allocation of rural households’ livelihood capital should be optimized to give full play to the integration effect of livelihood capital. To this end, the first aim is to clarify the advantages and disadvantages of different rural households’ livelihood capital in different regions, and then to formulate differentiated policies, thereby enhancing their WTP for RHSI. The second aim is to improve the level of rural households’ comprehensive livelihood capital by taking advantage of the substitution between various types of livelihood capital to compensate for the deficiencies caused by weak livelihood capital with rural households’ own strong livelihood capital. For example, when rural households have sufficient financial capital but lack a labor force, they are suggested to develop mechanized production services; when rural households have superior natural capital but low agricultural operation income, they are suggested to develop ecological agriculture or leisure agriculture so as to broaden their income channels. Only in this way can rural households make full use of their own advantages to effectively strengthen their capacity, eventually increasing their WTP for RHSI.
Author Contributions
Conceptualization, W.W.; theoretical framework, Y.C. and W.W.; methodology, Y.C.; investigation, W.W. and Z.F.; writing—original draft preparation, Y.C. and W.W.; writing—review and editing, Y.C. and L.Y.; supervision, W.Z.; funding acquisition, W.W. All authors have read and agreed to the published version of the manuscript.
Funding
This study was supported and funded by the National Natural Science Foundation of China (grant number: 71774065, 72274074). The authors are grateful for the receipt of the fund.
Institutional Review Board Statement
Not applicable.
Informed Consent Statement
Not applicable.
Data Availability Statement
The data used to support the findings of this study are available from the authors upon request.
Conflicts of Interest
The authors declare no conflict of interest.
References
- Doxiadis, C.A. Ekistics; an Introduction to the Science of Human Settlements; Oxford University Press: New York, NY, USA, 1968. [Google Scholar]
- Rollnick, R. World habitat day. Cities-engines of rural development. Habitat. Debate. 2004, 10, 4–19. [Google Scholar]
- Hu, Q.Y.; Wang, C. Quality evaluation and division of regional types of rural human settlements in China. Habitat Int. 2020, 105, 102278. [Google Scholar] [CrossRef]
- Zhao, X.; Sun, H.B.; Chen, B.; Xia, X.H.; Li, P.F. China’s rural human settlements: Qualitative evaluation, quantitative analysis and policy implications. Ecol. Indic. 2019, 105, 398–405. [Google Scholar] [CrossRef]
- Xie, W.; Chen, C.; Li, F.; Cai, B.; Yang, R.; Cao, L.; Wu, P.; Pang, L. Key factors of rural households’ willingness to pay for cleaner heating in Hebi: A case study in northern China. Sustainability 2021, 13, 633. [Google Scholar] [CrossRef]
- Zhang, G.; Zhou, M. Voluntary provision of village-level public goods from the view of the “one case one meeting” system. China Agr. Econ. Rev. 2010, 2, 484–494. (In Chinese) [Google Scholar] [CrossRef]
- Lin, R.T.; Ma, X.W.; Li, B.Z.; Ye, X.Y.; Chen, X.M.; Liang, S.K. A study on the participation of peasants in rural environmental improvement from the perspective of sustainable development. Front. Environ. Sci. 2022, 10, 853849. [Google Scholar] [CrossRef]
- Wang, W.; Gong, H.; Yao, L.; Yu, L. Preference heterogeneity and payment willingness within rural households’ participation in rural human settlement improvement. J. Clean. Prod. 2021, 312, 127529. [Google Scholar] [CrossRef]
- Zhu, K.; Gao, Q.; Jin, L. Rural households’ willingness to pay for treatment of domestic solid wastes in the southwestern poverty regions. J. Arid. Land. Resour. Environ. 2021, 35, 54–62. (In Chinese) [Google Scholar]
- Yang, S.Y.; Yang, L.; Li, Y.Z.; Xie, C.F. Analyzing the impacts of virtual social network and income on farmers’ willingness to pay for rural environmental governance based on a survey data in Fujian, Henan, and Sichuan. Res. Agric. Mod. 2021, 42, 451–461. (In Chinese) [Google Scholar]
- Bourdieu, P. The forms of capital. In The Sociology of Economic Life; Routledge: New York, NY, USA, 2011; ISBN 978-0-429-49433-8. [Google Scholar]
- Xu, D.; Zhang, J.; Rasul, G.; Liu, S.; Xie, F.; Cao, M.; Liu, E. Household livelihood strategies and dependence on agriculture in the mountainous settlements in the three gorges reservoir area, China. Sustainability 2015, 7, 4850–4869. [Google Scholar] [CrossRef]
- Guo, S.; Liu, S.; Peng, L.; Wang, H. The impact of severe natural disasters on the livelihoods of farmers in mountainous areas: A case study of Qingping township, Mianzhu city. Nat. Hazards 2014, 73, 1679–1696. [Google Scholar] [CrossRef]
- Al-Amin, A.; Alam, K.; Shrestha, U.B.; Prodhan, M.H.; Hossain, M.; Sattar, N.; Hossain, M.J.; Akhter, T. Ecosystems, livelihood assets and willingness to pay for wetland conservation in Bangladesh. Environ. Dev. Sustain. 2021, 23, 17503–17534. [Google Scholar] [CrossRef]
- He, K.; Zhang, J.B.; Zeng, Y.M. Households’ willingness to pay for energy utilization of crop straw in rural China: Based on an improved UTAUT model. Energy Policy 2020, 140, 111373. [Google Scholar] [CrossRef]
- Li, L.; Yabe, M.; Yuan, Y.L. Farmers’ willingness to pay for the recycling of household kitchen waste: Evidence from Guanzhong area of Shaanxi province, China. J. Fac. Agric. Kyushu Univ. 2022, 67, 103–110. [Google Scholar] [CrossRef]
- Kang, K.H.; Stein, L.; Heo, C.Y.; Lee, S. Consumers’ willingness to pay for green initiatives of the hotel industry. Int. J. Hosp. Manag. 2012, 31, 564–572. [Google Scholar] [CrossRef]
- Marulanda, L.P.; Lavelle, P.; Jepsen, M.R.; Castro-Nunez, A.; Francesconi, W.; Camilo, K.; Vanegas-Cubillos, M.; Romero, M.A.; Suarez, J.C.; Solarte, A.; et al. Farmscape composition and livelihood sustainability in deforested landscapes of Colombian amazonia. Agriculture 2020, 10, 588. [Google Scholar] [CrossRef]
- Jezeer, R.E.; Verweij, P.A.; Boot, R.G.A.; Junginger, M.; Santos, M.J. Influence of livelihood assets, experienced shocks and perceived risks on smallholder coffee farming practices in Peru. J. Environ. Manag. 2019, 242, 496–506. [Google Scholar] [CrossRef]
- Givens, J.E.; Jorgenson, A.K. The effects of affluence, economic development, and environmental degradation on environ-mental concern: A multilevel analysis. Organ. Environ. 2011, 24, 74–91. [Google Scholar] [CrossRef]
- Nie, X.; Chen, Z.P.; Yang, L.F.; Qing, Y.T.; Wang, H. Does the protection of river basin ecosystems produce broken window effect? Evidence from spatial choice experiment in Xijiang River basin, China. Front. Mar. Sci. 2022, 9, 842491. [Google Scholar] [CrossRef]
- Liu, J.Y.; Wu, J.; Che, T.T. Understanding perceived environment quality in affecting tourists’ environmentally responsible behaviours: A broken windows theory perspective. Tour. Manag. Perspect. 2019, 31, 236–244. [Google Scholar] [CrossRef]
- Zalejska-Jonsson, A. Stated WTP and rational WTP: Willingness to pay for green apartments in Sweden. Sustain. Cities Soc. 2014, 13, 46–56. [Google Scholar] [CrossRef]
- Wang, X.; Peng, L.; Xu, D.; Wang, X. Sensitivity of rural households’ livelihood strategies to livelihood capital in poor mountainous areas: An empirical analysis in the upper reaches of the Min river, China. Sustainability 2019, 11, 2193. [Google Scholar] [CrossRef]
- Liu, M.; Rao, D.; Yang, L.; Min, Q. Subsidy, training or material supply? The impact path of eco-compensation method on farmers’ livelihood assets. J. Environ. Manag. 2021, 287, 112339. [Google Scholar] [CrossRef]
- Liu, A.J.; Osewe, M.; Wang, H.X.; Xiong, H. Rural residents’ awareness of environmental protection and waste classification behavior in Jiangsu, China: An empirical analysis. Int. J. Env. Res. Public Health 2020, 17, 8928. [Google Scholar] [CrossRef] [PubMed]
- Westbury, D.B.; Park, J.R.; Mauchline, A.L.; Crane, R.T.; Mortimer, S.R. Assessing the environmental performance of English arable and livestock holdings using data from the farm accountancy data network (FADN). J. Environ. Manag. 2011, 92, 902–909. [Google Scholar] [CrossRef] [PubMed]
- Cui, Y.; Zhao, K.; He, J.; Qu, M. Effect of capital endowment on farmers’ decision-making in protecting cultivated land in a rice-growing area: An empirical study based on a double-hurdle model. China J. Eco. Agric. 2019, 27, 959–970. (In Chinese) [Google Scholar]
- Wang, X.; Fan, P.; Wu, Z.; Liang, Q. Pollution, demographic, and public willingness to participate in environment protection in China—A study based on micro-survey data. Environ. Sci. Pollut. Res. 2019, 26, 25117–25129. [Google Scholar] [CrossRef] [PubMed]
- Xiong, K.; Zhang, N.; Kung, C.; Kong, F. Determinants of residents’ willingness to accept and their levels for ecological conservation in Ganjiang river basin, China: An empirical analysis of survey data for 677 households. Sustainability 2019, 11, 6138. [Google Scholar] [CrossRef]
- Jones, N.; Evangelinos, K.; Gaganis, P.; Polyzou, E. Citizens’ perceptions on water conservation policies and the role of social capital. Water Resour. Manag. 2010, 25, 509–522. [Google Scholar] [CrossRef]
- Polyzou, E.; Jones, N.; Evangelinos, K.I.; Halvadakis, C.P. Willingness to pay for drinking water quality improvement and the influence of social capital. J. Socio Econ. 2010, 40, 74–80. [Google Scholar] [CrossRef]
- Wiser, R.H. Using contingent valuation to explore willingness to pay for renewable energy: A comparison of collective and voluntary payment vehicles. Ecol. Econ. 2007, 62, 419–432. [Google Scholar] [CrossRef]
- Santos, G.; Fraser, G. Road pricing: Lessons from London. Econ. Policy 2006, 46, 263–310. [Google Scholar] [CrossRef]
- Van Diepen, A.; Voogd, H. Sustainability and planning: Does urban form matter? Int. J. Sustain. Dev. 2001, 4, 59–74. [Google Scholar] [CrossRef]
- Halkos, G.E.; Jones, N. Modeling the effect of social factors on improving biodiversity protection. Ecol. Econ. 2012, 78, 90–99. [Google Scholar] [CrossRef]
- Zhang, R.; Zheng, H.W.; Zhang, H.; Hu, F. Study on the influence of social capital on farmers’ participation in rural domestic sewage treatment in Nanjing, China. Int. J. Env. Res. Public Health 2020, 17, 2479. [Google Scholar] [CrossRef]
- Ohlin, B. Interregional and International Trade; Harvard University Press: Cambridge, UK, 1935. [Google Scholar]
- Chang, Q.; Shi, Y.; Zhang, C.; Zhao, M. The willingness of intergenerational transmission of herdsmens grassland livestock management: From the dual perspective of capital endowment level and structure. J. Arid. Land Resour. Environ. 2020, 34, 21–26. (In Chinese) [Google Scholar]
- Liu, K.; Qi, Z.; Huang, W.; Ye, S. Research on the influence of capital endowment heterogeneity on farmers’ ecological pro-duction: Analysis from horizontal and structural perspectives. China. Popul. Resour. Environ. 2019, 29, 87–96. (In Chinese) [Google Scholar] [CrossRef]
- Zhang, T.; Yan, T.; He, K.; Zhang, J. Impact of capital endowment on peasants’ willingness to invest in green production: Taking crop straw returning to the field as an example. China. Popul. Resour. Environ. 2017, 27, 78–89. (In Chinese) [Google Scholar]
- Li, C.; Zhao, R.; Tang, Q. Spatial and temporal variation of rural human settlements in China based on provincial data. Shengtaixue Zazhi 2019, 38, 1472–1481. (In Chinese) [Google Scholar]
- Ferreira, S.; Marques, R.C. Contingent valuation method applied to waste management. Resour. Conserv. Recycl. 2015, 99, 111–117. [Google Scholar] [CrossRef]
- Wang, Y.; Zhang, Y.-S. Air quality assessment by contingent valuation in Ji’nan, China. J. Environ. Manag. 2009, 90, 1022–1029. [Google Scholar] [CrossRef] [PubMed]
- Lu, W.; Peng, Y.; Webster, C.; Zuo, J. Stakeholders’ willingness to pay for enhanced construction waste management: A Hong Kong study. Renew. Sustain. Energy Rev. 2015, 47, 233–240. [Google Scholar] [CrossRef]
- Xu, M.M.; Lin, B.Q. Exploring the “not in my backyard” effect in the construction of waste incineration power plants—Based on a survey in metropolises of China. Environ. Impact Assess. Rev. 2020, 82, 106377. [Google Scholar] [CrossRef]
- Yang, X.M.; Cheng, L.L.; Yin, C.B.; Lebailly, P.; Azadi, H. Urban residents’ willingness to pay for corn straw burning ban in Henan, China: Application of payment card. J. Clean. Prod. 2018, 193, 471–478. [Google Scholar] [CrossRef]
- Zeng, C.; Niu, D.J.; Li, H.F.; Zhou, T.; Zhao, Y.C. Public perceptions and economic values of source-separated collection of rural solid waste: A pilot study in China. Resour. Conserv. Recycl. 2016, 107, 166–173. [Google Scholar] [CrossRef]
- Paul, S.; Das, T.K.; Pharung, R.; Ray, S.; Mridha, N.; Kalita, N.; Ralte, V.; Borthakur, S.; Burman, R.R.; Tripathi, A.K.; et al. Development of an indicator based composite measure to assess livelihood sustainability of shifting cultivation dependent ethnic minorities in the disadvantageous northeastern region of India. Ecol. Indic. 2020, 110, 105934. [Google Scholar] [CrossRef]
- Cheng, P.; Dong, Y.; Wang, Z.H.; Tang, H.T.; Jiang, P.; Liu, Y.L. What are the impacts of livelihood capital and distance effect on farmers’ willingness to pay for coastal zone ecological protection? Empirical analysis from the Beibu Gulf of China. Ecol. Indic. 2022, 140, 109053. [Google Scholar] [CrossRef]
- Zhang, S.Y.; Xie, X.X.; Zhao, M.J. Asset specificity on the intention of farmers to continue land recuperation: Based on the perspective of farmer differentiation. Land 2021, 10, 603. [Google Scholar] [CrossRef]
- Wang, J.Q.; Long, R.Y.; Chen, H.; Li, Q.W. Willingness of rural residents to pay for clean coal and stoves in winter: An empirical study from Zoucheng, Shandong. Environ. Sci. Pollut. Res. 2021, 28, 1948–1965. [Google Scholar] [CrossRef]
- Belay, G.; Ketema, M.; Hasen, M. Households’ willingness to pay for soil conservation on communal lands: Application of the contingent valuation method in north eastern Ethiopia. J. Environ. Plan. Manag. 2020, 63, 2227–2245. [Google Scholar] [CrossRef]
- Ma, S.; Swinton, S.M.; Lupi, F.; Jolejole-Foreman, C. Farmers’ willingness to participate in payment-for-environmental-services programmes. J. Agr. Econ. 2012, 63, 604–626. [Google Scholar] [CrossRef]
- Abdullah, S.; Jeanty, P.W. Willingness to pay for renewable energy: Evidence from a contingent valuation survey in Kenya. Renew. Sustain. Energy Rev. 2011, 15, 2974–2983. [Google Scholar] [CrossRef]
- Yang, X.; Sang, Y.M.; Zhang, A.L. How livelihood capital affects farmers’ willingness to pay for farmland non-market value? Evidence from Jianghan Plain, China. Environ. Sci. Pollut. Res. 2022, 29, 51456–51468. [Google Scholar] [CrossRef] [PubMed]
- Zhou, W.F.; Ma, Z.X.; Guo, S.L.; Deng, X.; Xu, D.D. Livelihood capital, evacuation and relocation willingness of residents in earthquake-stricken areas of rural China. Saf. Sci. 2021, 141, 105350. [Google Scholar] [CrossRef]
- He, Y.F.; Chen, T.G.; Takahashi, Y.; Yabe, M. The livelihood strategy transformation of retired fishing households under the background of the fishing ban policy in the Yangtze River, China. J. Fac. Agric. Kyushu Univ. 2022, 67, 83–92. [Google Scholar] [CrossRef]
- Zhu, Q.; Chen, Y.; Yuan, K.; Wang, X.; Gan, C. Research on the relationship between capital endowment and farmers’ willingness to pay for cultivated land protection: Comparing the suburban and outer suburbs. Resour. Environ. Yangtze Basin. 2020, 29, 1885–1895. (In Chinese) [Google Scholar]
- Chen, G.Y.; Tan, W.; Zhang, S.M.; Yan, B.Q. Influence of interpersonal and institutional trust on the participation willingness of farmers in E-commerce poverty alleviation. Front. Psychol. 2021, 12, 727644. [Google Scholar] [CrossRef]
- Qing, C.; Guo, S.L.; Deng, X.; Xu, D.D. Farmers’ awareness of environmental protection and rural residential environment improvement: A case study of Sichuan province, China. Environ. Dev. Sustain. 2021, 24, 11301–11319. [Google Scholar] [CrossRef]
- Xu, D.D.; Deng, X.; Guo, S.L.; Liu, S.Q. Sensitivity of livelihood strategy to livelihood capital: An empirical investigation using nationally representative survey data from rural China. Soc. Indic. Res. 2018, 144, 113–131. [Google Scholar] [CrossRef]
- Muttaqien, M.; Setiyaningsih, H.; Aristianti, V.; Coleman, H.; Hidayat, M.S.; Dhanalvin, E.; Siregar, D.R.; Mukti, A.G.; Kok, M.O. Why did informal sector workers stop paying for health insurance in Indonesia? Exploring enrollees’ ability and willingness to pay. PLoS ONE 2021, 16, e0252708. [Google Scholar] [CrossRef]
Publisher’s Note: MDPI stays neutral with regard to jurisdictional claims in published maps and institutional affiliations. |
© 2022 by the authors. Licensee MDPI, Basel, Switzerland. This article is an open access article distributed under the terms and conditions of the Creative Commons Attribution (CC BY) license (https://creativecommons.org/licenses/by/4.0/).