Article

Coupling Coordination and Spatiotemporal Dynamic Evolution between Agricultural Carbon Emissions and Agricultural Modernization in China 2010–2020

1
School of Economics, Guangxi University, 100 Daxue Road, Nanning 530004, China
2
The Centre for Global Food and Resources, The University of Adelaide, Adelaide 5005, Australia
3
The People’s Bank of China Zhengzhou Central Sub-branch, 21 Shangwu Road, Zhengzhou 450018, China
*
Author to whom correspondence should be addressed.
Agriculture 2022, 12(11), 1809; https://doi.org/10.3390/agriculture12111809
Submission received: 28 August 2022 / Revised: 27 October 2022 / Accepted: 27 October 2022 / Published: 30 October 2022
(This article belongs to the Special Issue Greenhouse Gas Mitigation in Agriculture)

Abstract

:
Modern agriculture contributes significantly to greenhouse gas emissions. How to reduce such emissions without sacrificing agricultural development is a common issue concerning most developing countries. In China, a rural revitalization strategy proposed in 2018 aims to achieve agricultural modernization by 2050, while reaching a carbon emission peak by 2030 and neutrality by 2060. However, China’s progress towards these goals is largely unknown. This study evaluates the coupling coordination and spatiotemporal dynamic evolution between agricultural carbon emissions and agricultural modernization in China from 2010 to 2020 through a joint employment of spatial autocorrelation and coupling coordination degree modeling. The results show that from 2010 to 2020, the agricultural modernization level increased from 0.155 to 0.272, and the agricultural carbon emission intensity decreased from 4.9 tons per 10 thousand CNY to 2.43 tons. Agricultural carbon emissions and the agricultural modernization level manifest significant spatially agglomerative patterns with noticeable discrepancies across different regions. Moreover, the coupling coordination degree between agricultural carbon emissions and agricultural modernization has increased every year, but disparities among provinces continued to widen. Specifically, coupling coordination in northern China is significantly higher than that in the south, and its spatial distribution exhibits a positive correlation and increasing levels of clustering. These results point to the continued need for sustainable agricultural development efforts, such as strengthening rural infrastructure and diffusing green technologies in achieving China’s dual carbon emission and agricultural modernization goals. This study also examines the sustainable agricultural development issue from a new perspective, and the findings can provide policy references for sustainable agricultural development policies in China.

1. Introduction

Agricultural modernization refers to the transformation from traditional agriculture to modern agriculture, which critically relies on the adoption of both advanced agricultural machinery and improved farm management practices. However, carbon emissions may consequently grow, which could adversely affect agricultural production [1,2]. For example, agricultural intensification as part of the modernization process has led to biodiversity losses and worsening agroecological conditions [3]. Large emissions of carbon dioxide are also an important cause of climate change [4], as manifested in both global warming and climate extremes, which have a negative impact on agricultural production [5]. Thus, sustainable agriculture is the best pathway for modernizing the sector [6], which looks to not only improve agricultural productivity but also to reduce agricultural carbon emissions. In other words, agricultural modernization must be coordinated with agricultural carbon emissions to minimize the environmental impacts.
Agriculture in China has grown rapidly since its reform and opening-up in 1978, with a gross domestic product (GDP) contribution valued at USD 1.13 trillion in 2020. The rapid agricultural growth has benefited from the ongoing process of agricultural modernization. On the one hand, the introduction of the household responsibility system that holds farm households responsible for the agricultural profits and losses has greatly stimulated enthusiasm toward the adoption of new technologies. On the other hand, rising off-farm employment opportunities with industrialization and associated urbanization has increased the opportunity cost of farm labor and consequently promoted land transfers and farm expansion [7], encouraging agricultural machinery utilization. Consequently, rapid agricultural growth has been underpinned by large amounts of chemical input use and energy consumption, which are key drivers of carbon emissions [8]. Over time, there has been increasing pressure to reduce carbon emissions, and it is necessary to switch focus from purely stimulating the adoption of advanced agricultural technologies toward promoting sustainable agricultural production.
At present, the proportion of carbon emissions in China’s agricultural sector is higher than the world average, while the proportion of carbon sinks is lower [9]. Despite its fast growth, the agricultural sector is relatively underdeveloped. China’s current level of agricultural modernization is on par with that of India and Brazil and comparable to that of the United Kingdom and the United States from the late 1960s to the early 1980s or that of Japan in the early 1990s [10]. In face of this, a rural revitalization strategy was proposed in the 19th National People’s Congress of China in 2017, establishing a timeline to achieve basic agricultural modernization by 2035 and complete modernization and rural revitalization by 2050. On the other hand, at the 75th United Nations General Assembly in 2020, China formally proposed the goal of carbon peaking by 2030 and carbon neutrality by 2060. To achieve these goals, agricultural modernization needs to be coordinated with carbon emissions. The dual task to promote agricultural modernization and reduce agricultural carbon emissions at the same time can be challenging and clearly demands a better scholarly understanding that may feed back into the processes.
The coupled and coordinated development of agricultural modernization and agricultural carbon reduction, meaning that agricultural carbon reduction is achieved at the same time as agricultural modernization is promoted, is conducive to the realization of the Sustainable Development Goals (SDGs). The interaction between these two is shown in Figure 1. Specifically, the dual carbon target puts forward higher requirements for agricultural carbon emission reduction. It can promote the development of agricultural modernization while constraining agricultural carbon emissions. On the one hand, the reduction of carbon emissions from agriculture can mitigate climate change, reduce environmental risks, and provide a better environment for agricultural production, which is conducive to the stability and growth in agriculture [11]. On the other hand, in order to reduce agricultural carbon emissions, policies, such as green finance and environmental regulations in agricultural production, will guide the flow of social capital, encourage green technological innovation, and force the green transformation of enterprises to promote the optimization and upgrading of the agricultural industry [12,13]. All of these are the manifestations of the advancement of the agricultural modernization process. Conversely, agricultural modernization can also promote agricultural carbon emission reduction. Agricultural modernization means more advanced equipment and technologies, the improvement of management in agricultural business, and the promotion of large-scale production in agriculture. These can increase the efficiency of the agricultural resources used and thus reduce the carbon emission intensity of agriculture. They will also help to update the production mindset of agricultural producers, which will facilitate the development of green and low-carbon agriculture and promote the sustainable development of agriculture.
In practice, China has undertaken extensive carbon reduction measures in the agricultural sector since 2010. To reduce carbon emissions in cropland ecosystems, the Chinese government has endeavored for zero growth in chemical fertilizers and pesticides from 2015 to 2020, implemented arable land conservation programs, promoted crop residual reuse, and stimulated organic fertilizer adoption in the hopes of reducing carbon emissions from land use [8]. Moreover, the promotion of energy-efficient agricultural machinery, improved varieties, and sustainable farming practices have been implemented to decrease carbon emissions from crop farming [9]. In the livestock sector, measures, such as improved feeding practices, have also been designed to reduce carbon emissions [14]. However, it remains to be scientifically assessed whether these measures have collectively led to a reduction in agricultural carbon emissions as agricultural modernization progresses. While China has made great achievements in agricultural production in the past decades, whether continued agricultural modernization can be approached in a carbon-neutral manner remains a concern for policy makers and the rest of the world. Hence, a comprehensive understanding of agricultural modernization and carbon emissions in the current period, as well as their spatial and temporal characteristics, will be of great value in helping policy makers to scientifically formulate agriculture development and carbon reduction policies.
The aims of this paper include analyzing the basic status of the coordinated development of agricultural modernization and agricultural carbon emissions in China, exploring whether the two can be developed in a coordinated manner, and whether there are problems of unbalanced and insufficient regional development associated with the coordinated development. In general, this paper explores the question of how to make China’s agricultural production develop in a coordinated manner in a more environmentally friendly, modern, adequate, and balanced direction. This paper has important research significance and application value for the comprehensive promotion of rural revitalisation, agriculture modernisation, green agriculture transformation, and achievement of sustainable agriculture development goals in China and countries at a similar stage of development.
Using province-level panel data from China covering the period from 2010 to 2020, this article seeks to narrow the abovementioned knowledge gaps. It first measures the relationship between agricultural carbon emissions and agricultural modernization in 30 province-level administrative divisions (provinces and municipalities directly under the central government’s control and autonomous regions, all termed as ‘provinces’ hereafter). It then explores the dynamic relationship between agricultural carbon emissions and agricultural modernization through the estimation of coupling and coordination degrees. The study seeks to answer the following questions: (1) What characterizes the current status as well as the recent dynamics of agricultural carbon emissions and agricultural modernization in China? (2) What is the coupling coordination between the two? It specifically looks to clarify the spatial and temporal characteristics of regional agricultural carbon emissions, agricultural modernization, and their relationship.
The rest of this article proceeds as follows. Section 2 describes data sources and empirical methods. Section 3 reports results. Section 4 provides a further in-depth discussion interpreting the findings. Section 5 finally concludes the manuscript.

2. Data and Methods

2.1. Data Sources

The study focuses on 30 inland province-level administrative divisions in China, excluding the Tibet autonomous region, which has significant missing data issues. Given that China’s economic and environmental regulatory policies have experienced significant changes since 2010, when agricultural modernization and carbon reduction have been receiving increasing attention, this research specifically focuses on the period of 2010–2020. Data used in the following analysis are obtained from the main statistical yearbooks of China published each year. Among them, data related to the measurement of agricultural carbon emissions were obtained from The China Statistical Yearbook and The China Rural Statistical Yearbook. Data used to construct the comprehensive evaluation index system of agricultural modernization level were obtained from The China Statistical Yearbook, The China Rural Statistical Yearbook, The China Rural Management Statistical Annual Report, The China Agricultural Machinery Industry Yearbook, and The China Insurance Statistical Yearbook. All data used in this paper were sourced from The Statistical Yearbook of the Chinese Government or published studies and are publicly available.

2.2. Index System of Agricultural Carbon Emissions and Agriculture Modernization

2.2.1. Indicator System of Agricultural Carbon Emissions

This study used two indicators to measure agricultural carbon emissions, namely the total amount and intensity. Total carbon emissions are calculated by multiplying the consumption of each type of carbon emission source with the carbon emission factor (kilograms (C) per unit, detail factors see Section 2.3), and the carbon emission intensity is the ratio of total agricultural carbon emissions to agricultural GDP. Based on the findings of existing studies, total carbon emissions are measured in terms of land-use carbon emissions, crop farming carbon emissions, and livestock carbon emissions [9]. In addition, it is important to note that this paper also added nitrous oxide and methane emissions to the treatment of agricultural carbon emissions, considering that they are important sources of greenhouse gas emissions [15]. In addition, in the specific calculation process, methane (CH4) and nitrous oxide (N2O) emissions were converted to an equivalent amount of carbon dioxide (CO2) emissions using the global warming potential (GWP) method (GWP(CO2) = 1, GWP(CH4) = 28, GWP(N2O) = 265) [16].To ensure the accuracy of the carbon emission measurement, this study took into account the N2O emissions of major crops in China, such as wheat, maize, and cotton; carbon emissions from straw burning and livestock manure disposal N2O emissions in addition to the agricultural carbon emission measurement system developed by Wang et al. [17]. As shown in Figure 2, carbon emissions from land use were measured from six major sources: fertilizers, pesticides, agricultural plastic films, agricultural diesel oil, irrigation, and sowing. Carbon emissions from crop farming were measured in terms of N2O and CH4 from the cultivation of major crops, such as rice, wheat, soybeans, and burning of various types of crop residues. Finally, N2O and CH4 emissions from livestock were measured from the intestinal regurgitation and manure disposal of various types of livestock.

2.2.2. Indicator System of Agriculture Modernization

This study constructs an index system to measure the agricultural modernization in five dimensions: production equipment and technology, managerial practices, agriculture-related social services, production efficiency, and sustainability. Following the existing literature [18,19], 17 indicators were finally selected to reflect the agricultural modernization level in these five dimensions, as shown in Table 1. All indicators were standardized to facilitate empirical computation below.

2.3. Carbon Emission Factor Accounting

Carbon emission accounting was exercised in the following analysis. The Intergovernmental Panel on Climate Change (IPCC) is the United Nations body for assessing the science related to climate change, which provides a methodology for carbon emission calculating widely used today. The IPCC carbon emission factor accounting sums up total carbon emissions based on the multiplication of the use of each source and the corresponding carbon emission factors. These carbon emission factors are based on published reports from major research institutes and findings from relevant studies. Specifically, the carbon emission factors for land use were obtained from the Oak Ridge National Laboratory (ORNL), Institute of Resources, Ecosystem and Environment of Agriculture (IREEA), and Nanjing Agricultural University [8,17,21]. Emission factors for crop farming were adopted from Wang, Liao, and Jiang [17] and Min and Hu [22]. The carbon emission factors for livestock came from the IPCC report. Specific carbon emission factors are shown in Supplementary Materials Tables S1 and S2.

2.4. Entropy Method

The entropy method was used to determine the weight of indicators for the agriculture modernization index system. The entropy method determines the weights of indicators based on the magnitudes of data discrepancy [23]. A higher entropy of an indicator implies greater data variation (more chaotic) and, by assigning heavier weights, it will have a greater impact on the overall evaluation. Conversely, a lower entropy means a more ordered system with more homogeneous data and a smaller weight share. In the calculation of weights, the indicators were first standardized. Then, an objective weighting was calculated to obtain the agricultural modernization level score [20]. The results of the weight of indicators are shown in column 5 of Table 1.

2.5. Spatial Autocorrelation

Spatial autocorrelation is commonly used to describe the presence of systematic linkages of variables across adjacent geographical units. Moran’s I index is one of the most popular measures of such a spatial correlation [24]. Moran’s I index can take two forms, namely the global Moran’s I index ( I g ) and the local Moran’s I index ( I l ). Moran’s I index is mathematically defined as follows:
I g = n i = 1 n j = 1 n W i j ( x i x ¯ ) ( x j x ¯ ) i = 1 n j = 1 n W i j i = 1 n ( x i x ¯ ) 2
I l = ( x i x ¯ ) j = 1 n W i j ( x j x ¯ ) 1 n i = 1 n ( x i x ¯ ) 2
In Equations (1) and (2), x i and x j are the x attribute observations for regions i and j , respectively. n is the total number of regions observed. x ¯ is the average of the observations, and W i j is the spatial weight matrix. If province i is adjacent to province j , the spatial weight is 1; otherwise the spatial weight is 0. The spatial weight matrix was further normalized in this study, where the sum of elements W i j in each subset equals 1.
The global Moran’s I index reflects the overall spatial distribution of an attribute in the study area. It takes values between −1 and 1. If the global Moran’s I index is greater than 0, it represents a positive spatial correlation (agglomerative distribution); less than 0 represents a negative spatial correlation (disperse distribution), and equal to 0 represents a spatially uncorrelated (random) distribution.
The local Moran’s I index reflects the correlation of a certain attribute between a specific region and its neighboring regions. Moran’s scatterplot can be used to illustrate the characteristics of spatial agglomeration or dispersion. The horizontal axis of the scatterplot represents an indicator in each province, while the vertical axis is the corresponding spatial lag. The first and third quadrants show positive spatial autocorrelation, while the second and fourth quadrants show negative spatial autocorrelation. Specifically, the first and third quadrants represent H-H and L-L, respectively, indicating that high-value provinces are surrounded by neighboring high-value provinces and low-value provinces are surrounded by neighboring low-value provinces. The second and fourth quadrants represent L-H and H-L, respectively, indicating that low-value provinces are surrounded by neighboring high-value provinces and high-value provinces are surrounded by neighboring low-values provinces.

2.6. Coupling Coordination Degree

The coupling coordination degree is commonly used to measure the relationship between agricultural carbon emissions and agricultural modernization in terms of their mutual influence and interaction. Coupling is a physical concept and refers to the phenomenon whereby two or more systems interact with each other, and it has been widely adopted to study the relationship among multiple systems [25]. In this study, the coupling degree between agricultural carbon emissions and modernization could be computed as follows:
C = U 1 × U 2 ( U 1 + U 2 )
where C represents the coupling degree between agricultural carbon emissions and agricultural modernization; U 1 is the agricultural carbon emission reduction index obtained through the negative standardization of total agricultural carbon emissions, and U 2 is the value of the agriculture modernization level obtained by the entropy method. In order to simplify the analysis and to better compare the differences in coupling degrees among provinces, the values and levels of coupling degrees were divided into four stages in this article, namely the low-level coupling stage, the basic coupling stage, the moderate coupling stage, and the high-level coupling stage [20], as shown in Table 2.
Since the coupling degree mainly captures the magnitude of the mutual influence of two systems, but not the direction of the advantages and disadvantages of the action, the coupling coordination degree is often used to analyze the strength of coupling coordination between agricultural carbon emissions and agricultural modernization, which can reflect the coordinated development stage and type. The coupling coordination degree model was computed as follows:
D = C × T
T = a u 1 + b u 2
where D indicates the degree of coupling and coordination between agricultural carbon emissions and agricultural modernization; T is the comprehensive evaluation index of the coupling coordination level between agricultural carbon emissions and agricultural modernization. a and b indicate the contribution of agricultural modernization of agricultural carbon emissions to the comprehensive system, respectively. Referring to the study by Xu et al. [26], we assumed that both are of equal importance, and therefore they were given the same weight of 0.5. In this study, the degree of coupling coordination of agricultural carbon emissions and agricultural modernization was divided into 10 levels [27]. Then, the coordination development stages were divided into 5 stages [26]. The values and rankings of the coupling and coordination degrees are shown in Table 3.

3. Results

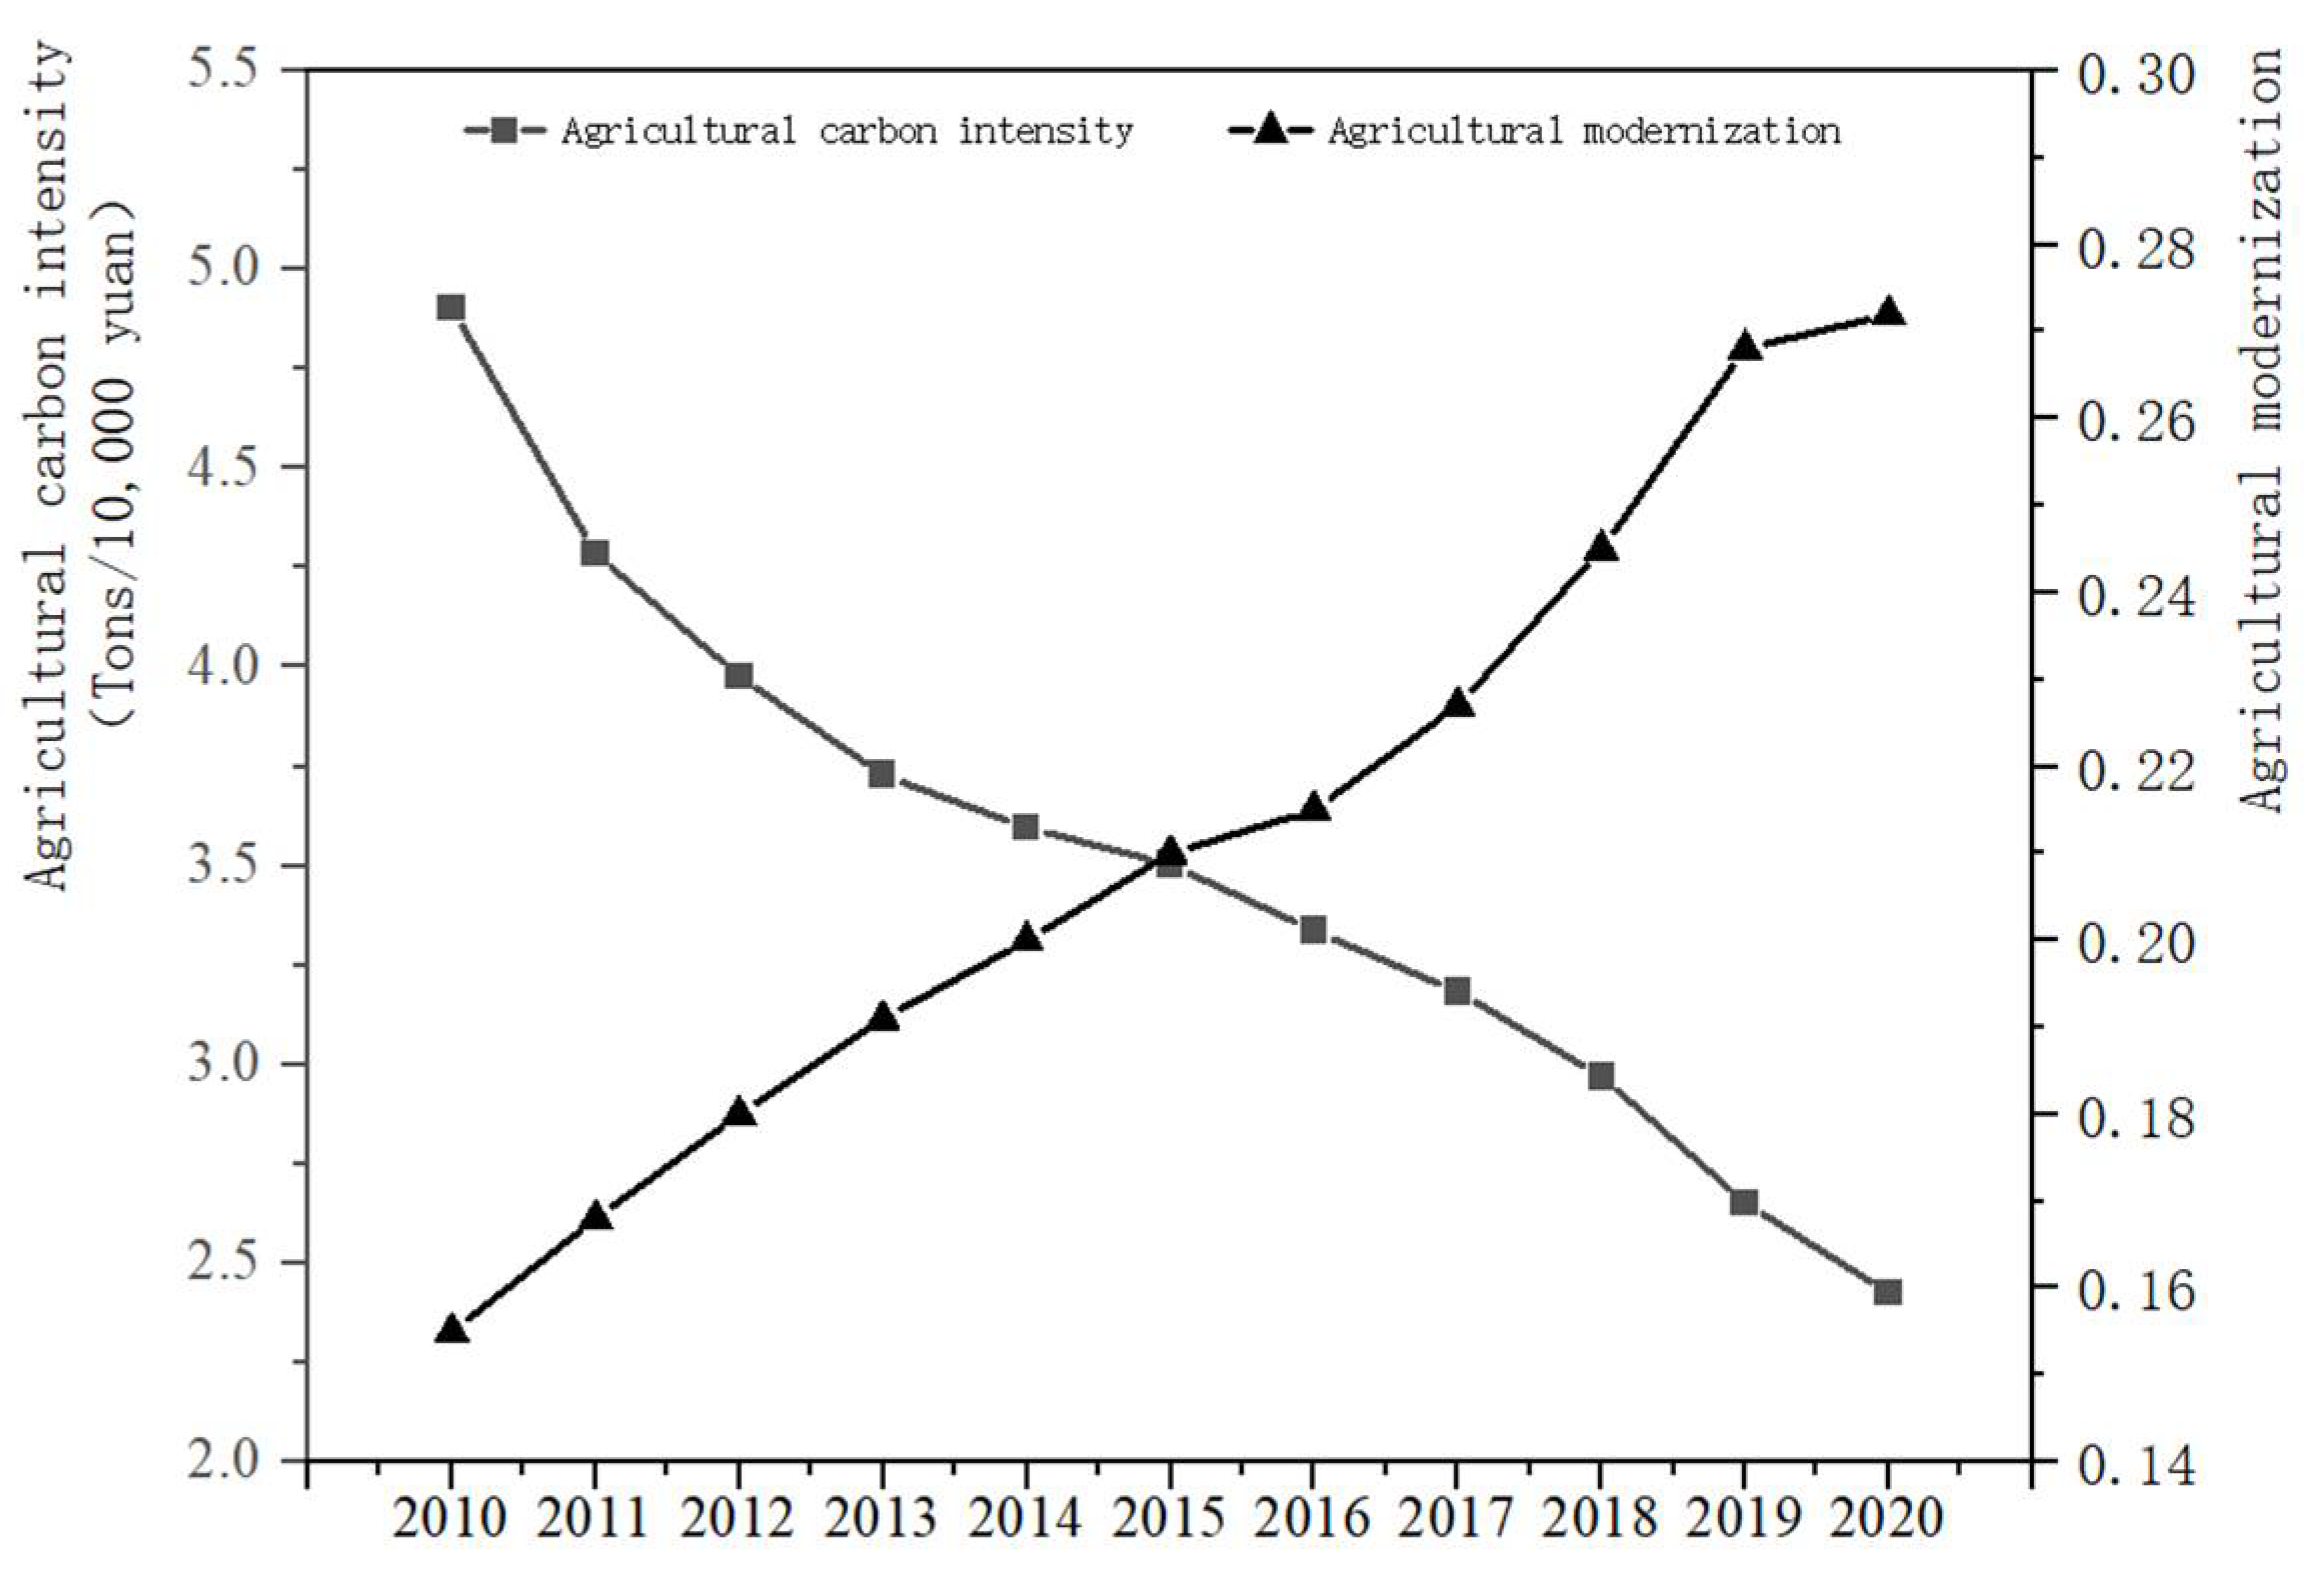
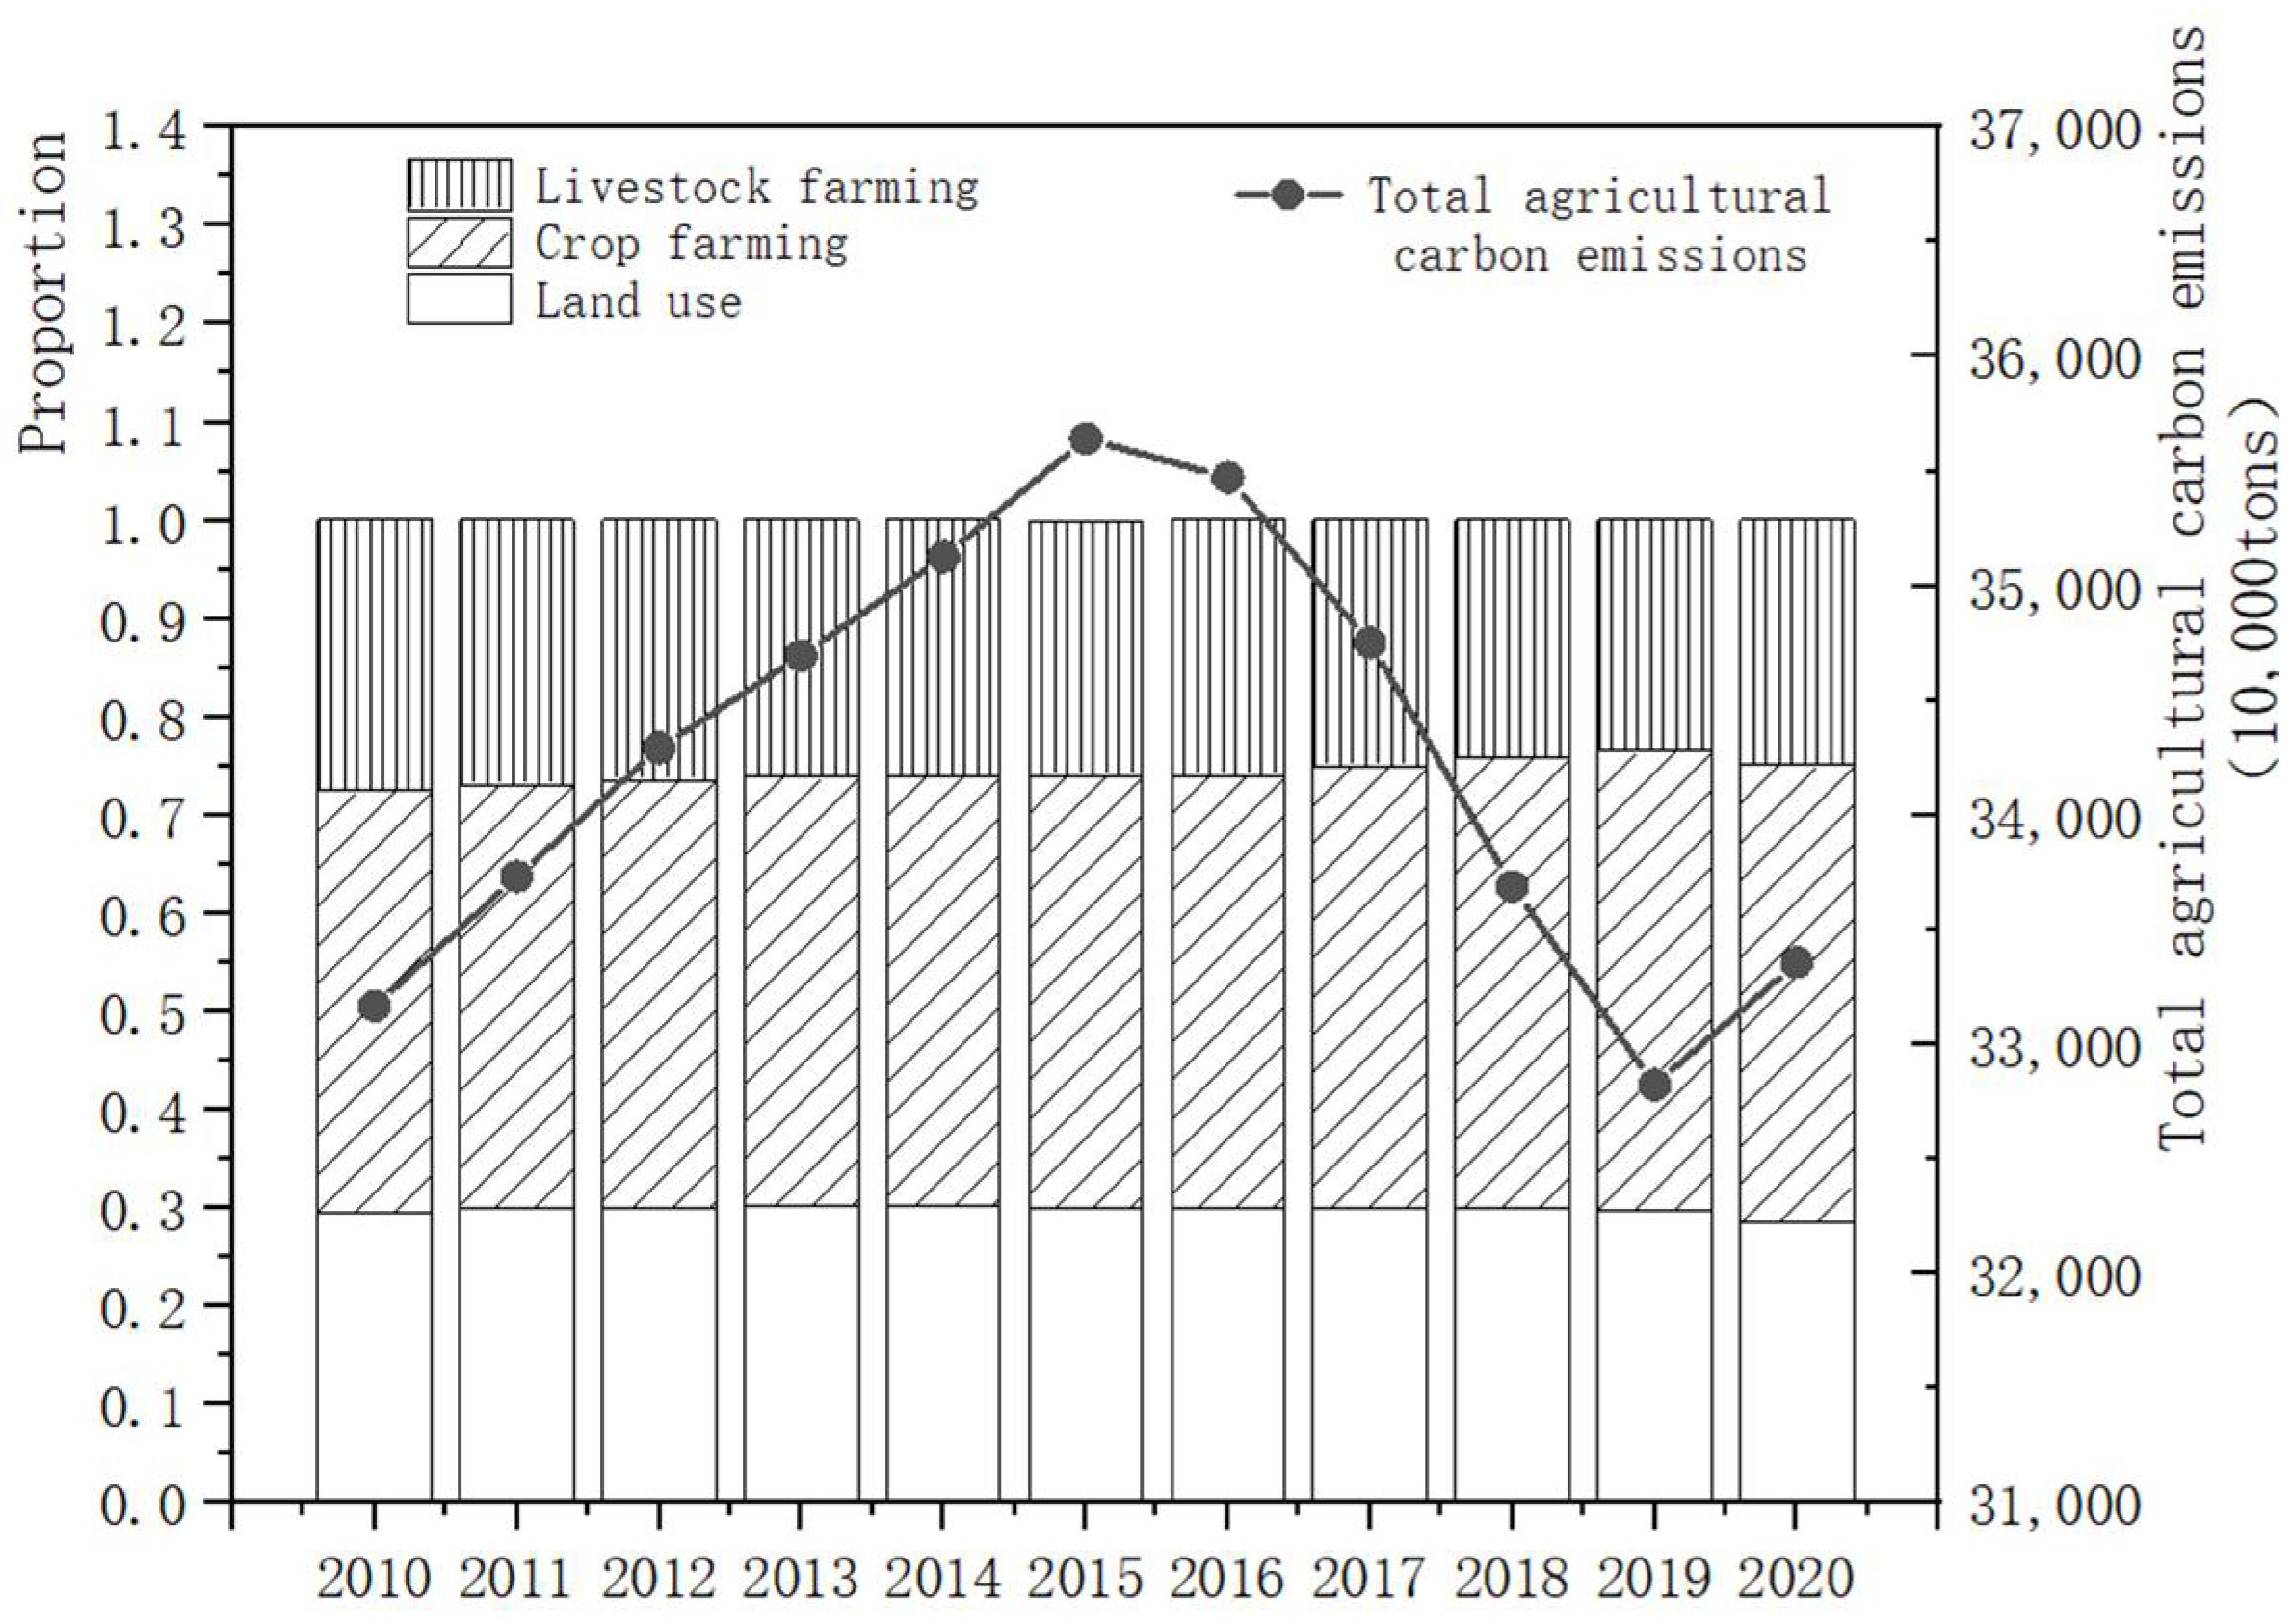
3.1. Temporal Characteristics of Agricultural Carbon Emissions and Agricultural Modernization

Figure 3 shows the annual average changes of carbon emission intensity and agricultural modernization level of 30 provinces in inland China from 2010 to 2020. As shown in Figure 3, the development level of agriculture modernization at the national level was steadily rising over the study period, and the agriculture carbon emission intensity continued to decline. The agricultural modernization level at the national average changed from 0.155 in 2010 to 0.272 in 2020, exhibiting a rapid annual growth rate of 7.55%. At the same time, the national average value of the agricultural carbon emission intensity decreased from 4.9 tons per 10 thousand CNY (Average exchange rate between the US dollar and the Chinese yuan for the period 2010–2020 was USD 1 = CNY 6.54.) in 2010 to 2.43 tons in 2020, a more than half reduction. The negative change in the agricultural carbon emission intensity in the past decade clearly indicates that the agricultural economy is growing much faster than agricultural carbon emissions.
Figure 4 further shows the annual average changes of total agricultural carbon emissions and the carbon emission structure of 30 provinces in inland China from 2010 to 2020. As shown in Figure 4, the total agricultural carbon emissions of China showed a trend of growth followed by decline. During the decade from 2010 to 2020, the total agricultural carbon emissions generally fluctuated around 330,000,000 tons, reaching a maximum of 356,421,400 tons in 2015. There was an obvious upward trend from 2010 to 2015 and a noticeable downward trend from 2015 to 2019, with a slight rebound in 2020. In addition, the source structure of agricultural carbon emissions was basically stable, with a small fluctuating share of total carbon emissions from crop farming, livestock, and land use. According to Figure 4, the largest share of carbon emissions came from crop farming, followed by land use and livestock. Although the overall structure was relatively stable, the share of crop farming showed a clear growth trend, while that of carbon emissions from livestock and land use decreased.

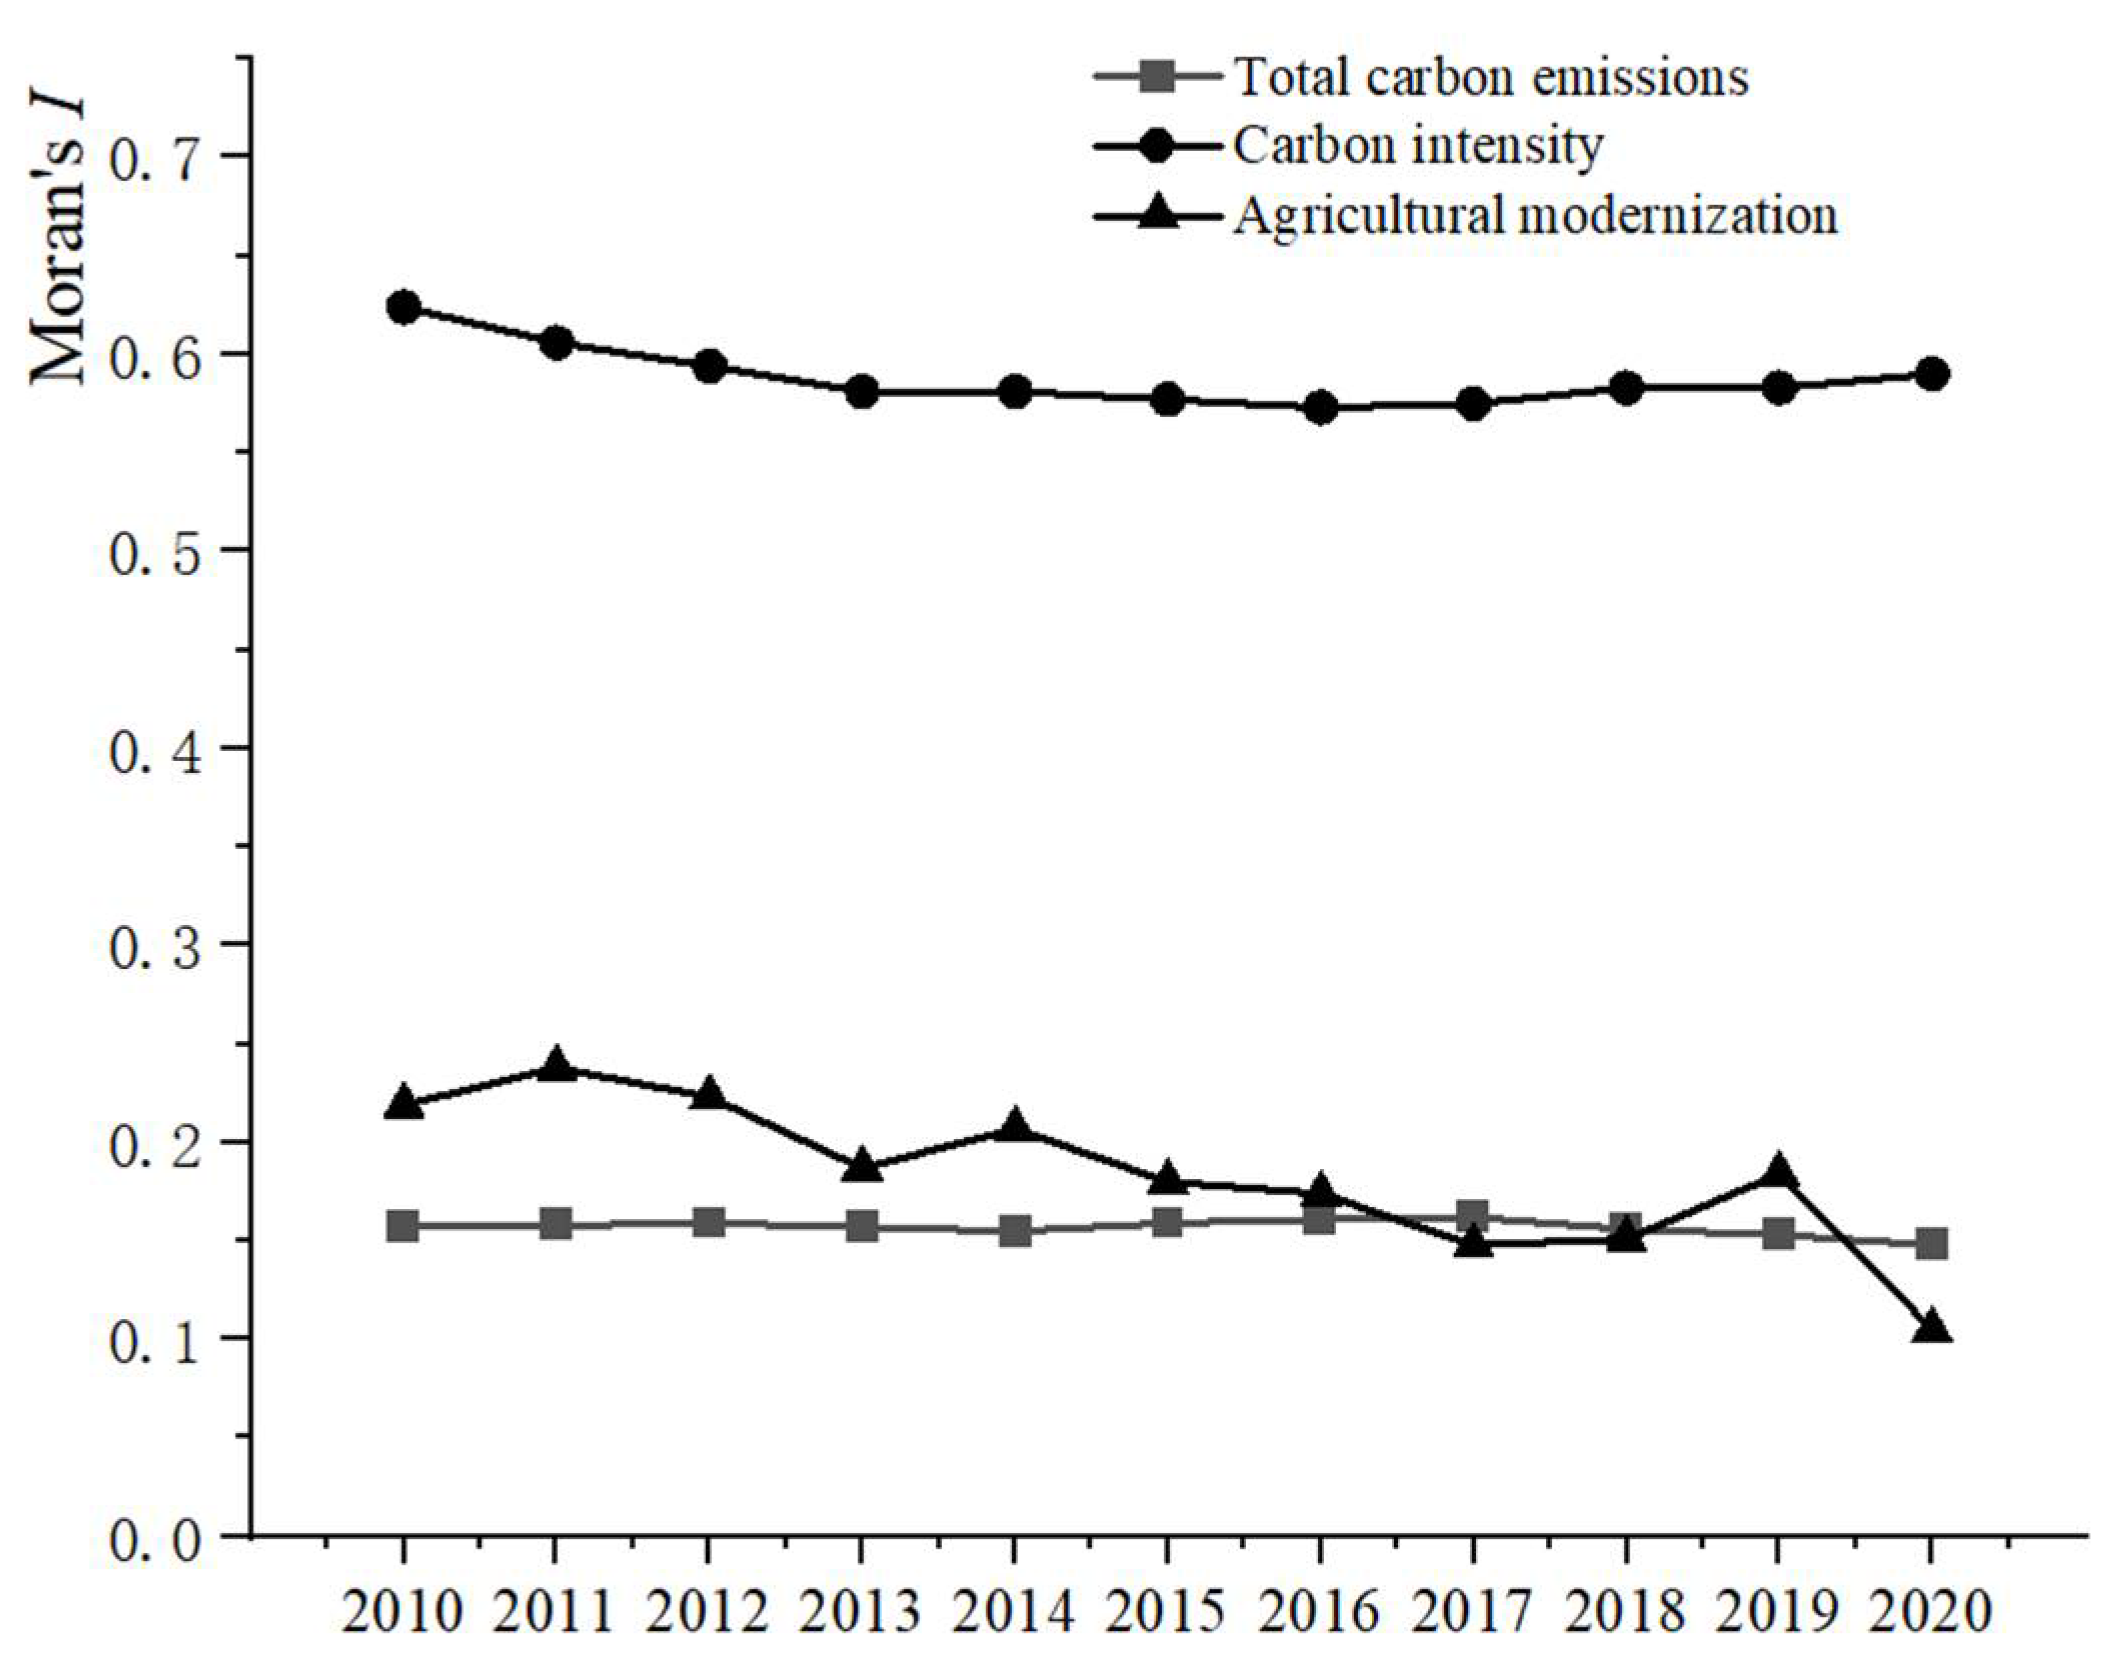
3.2. Spatial Variability Characteristics of Agricultural Carbon Emissions and Agricultural Modernization

Table 4 presents the descriptive statistics on the total agricultural carbon emissions, the intensity of agricultural carbon emissions, and the level of agricultural modernization for 30 Chinese provinces in 2010, 2015, and 2020. There was a wide disparity among provinces in terms of both agricultural modernization and agricultural carbon emissions. The total agricultural carbon emissions of the highest province were 43 times that of the lowest one in 2010, which increased to 60 times in 2015, reaching 113 times in 2020. On the other hand, the gap in carbon emission intensity between the highest and lowest provinces remained at around 57 times over the decade. Additionally, provincial disparities in agricultural modernization were evident. Disparities in agricultural modernization levels were first widening and then narrowing, yet until 2020, the gap between the maximum and minimum across the provinces was still as much as twice that of the minimum.
Figure 5 reports the global Moran’s I value for total agricultural carbon emissions, carbon emission intensity, and agricultural modernization from 2010 to 2020. The Moran’s I indices were all greater than 0 and significant at the 10% level, which suggest an obvious positive autocorrelation in the spatial distribution of total agricultural carbon emissions, carbon emission intensity, and agricultural modernization levels. It also further shows that the agricultural carbon emissions and agricultural modernization manifested significant spatial agglomeration.

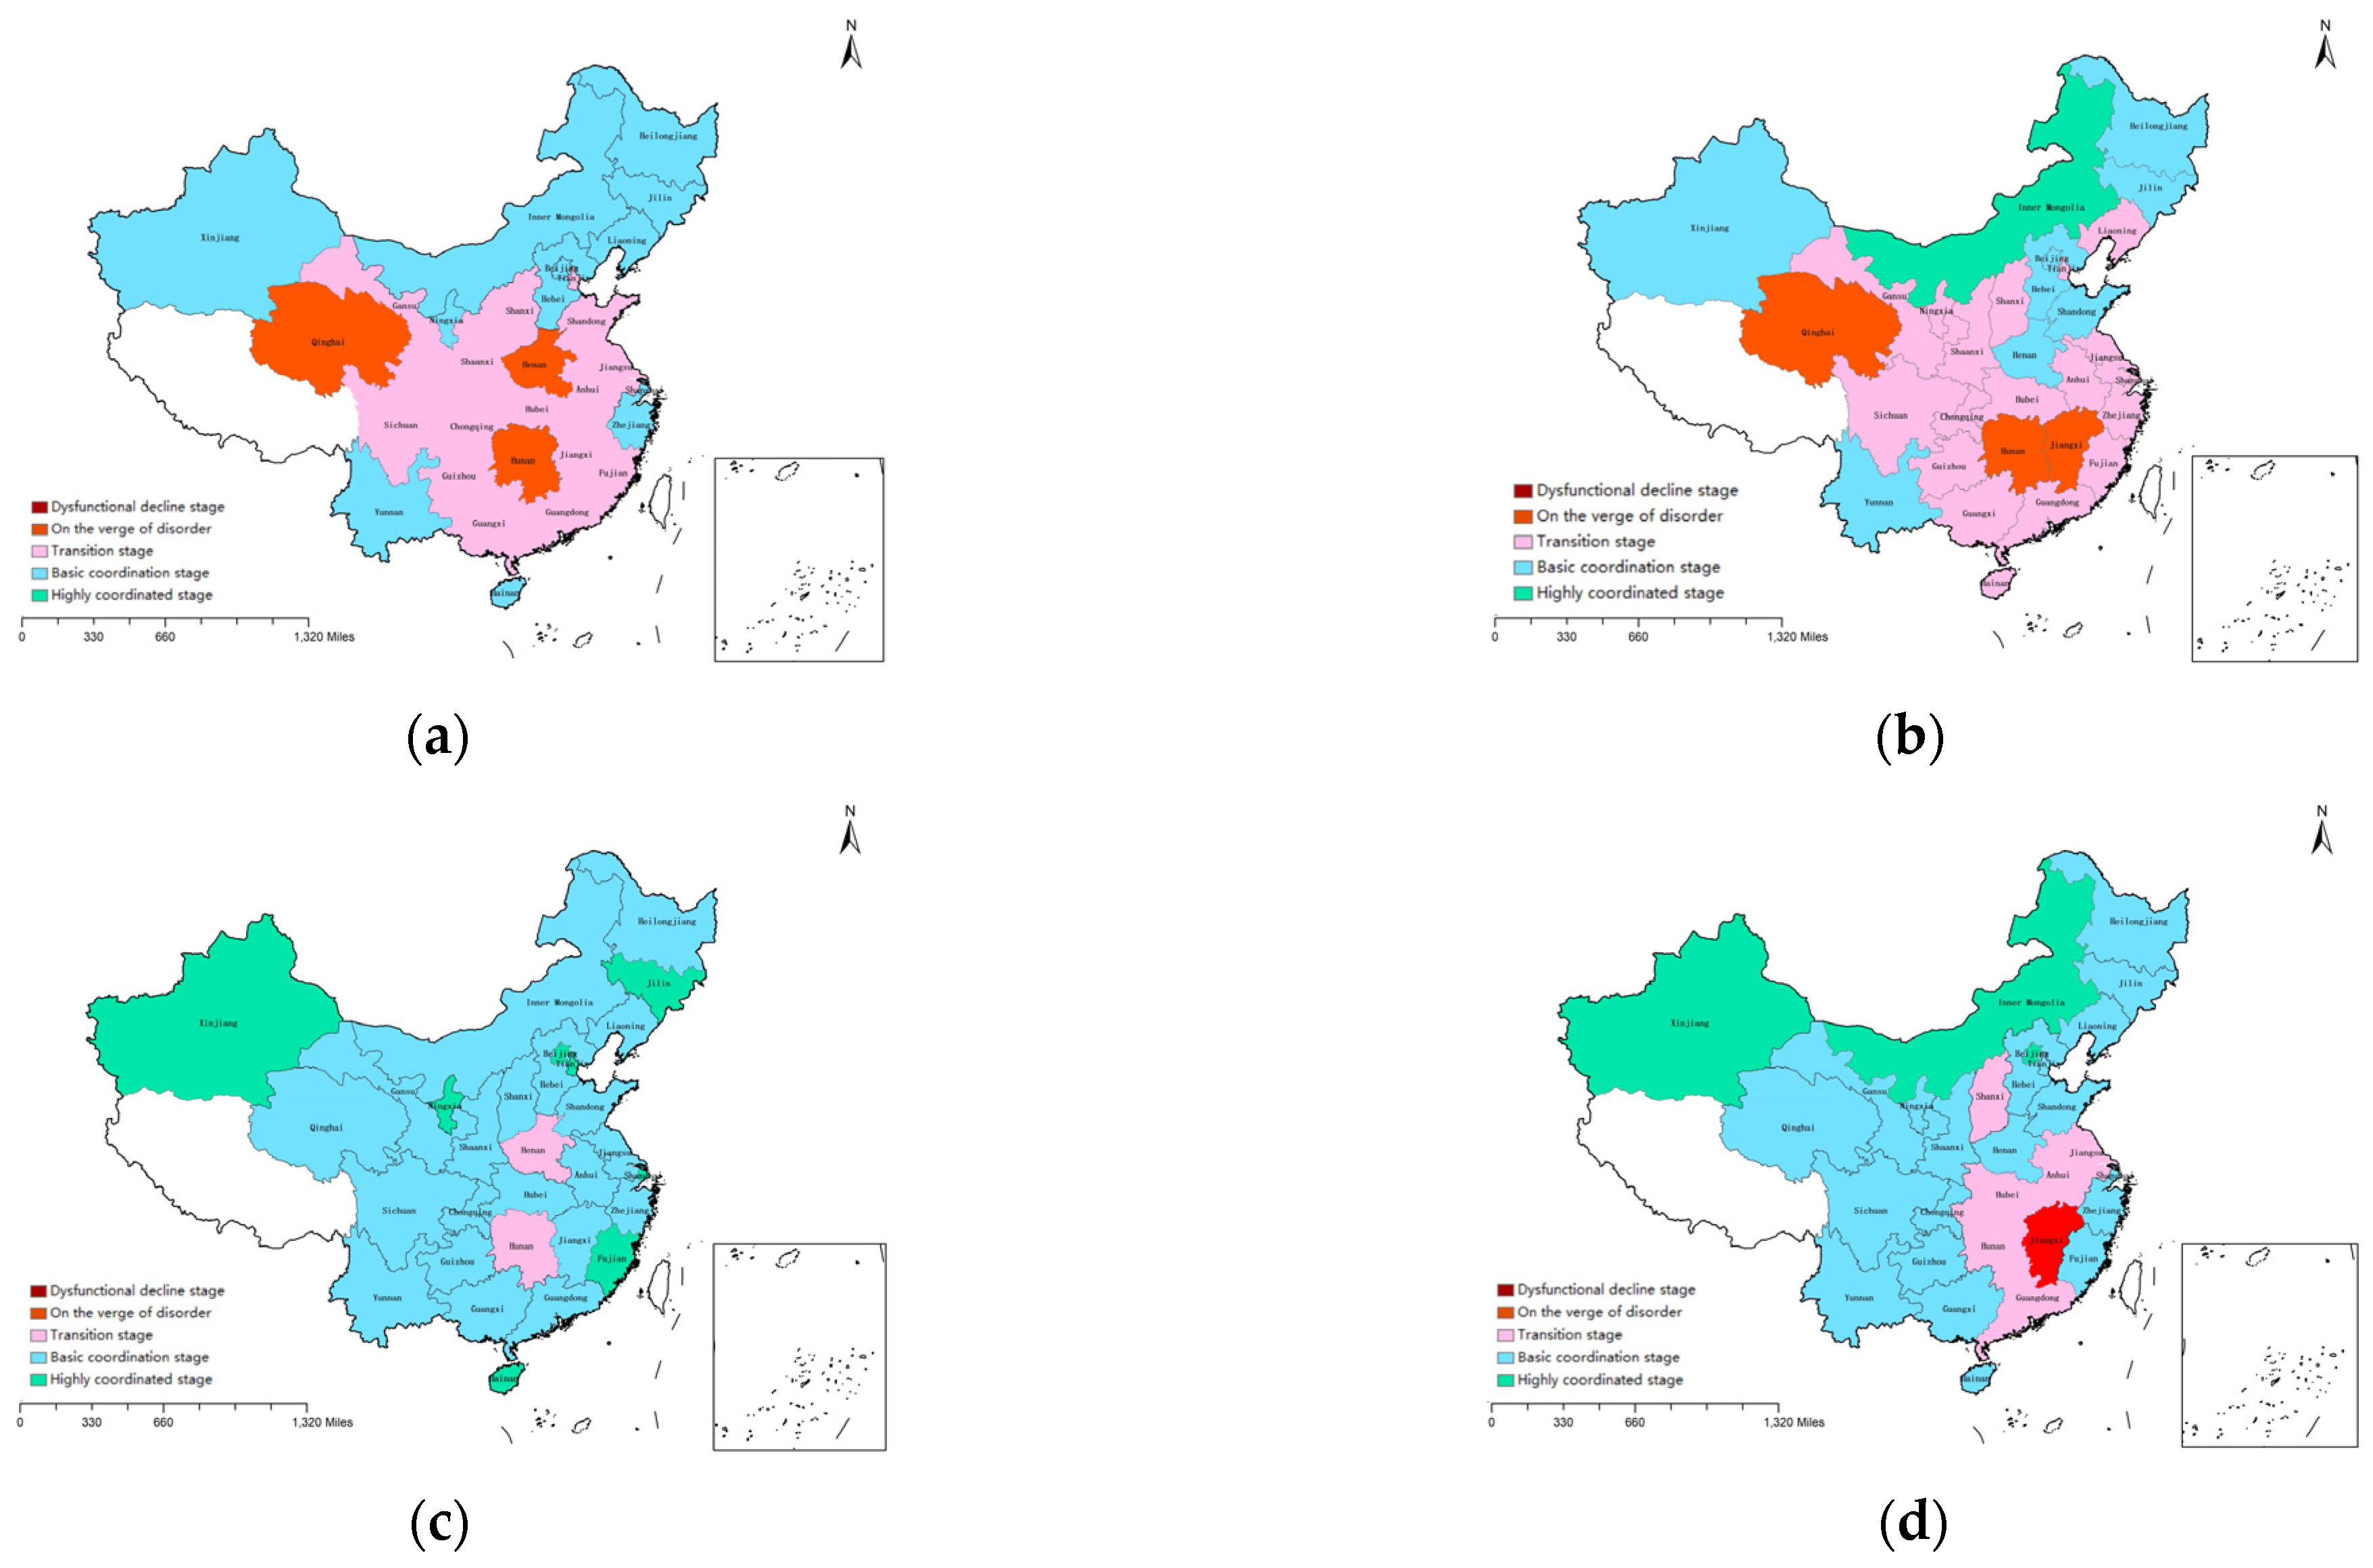
3.3. The Coupled and Coordinated Relationship between Agricultural Carbon Emissions and Agricultural Modernization

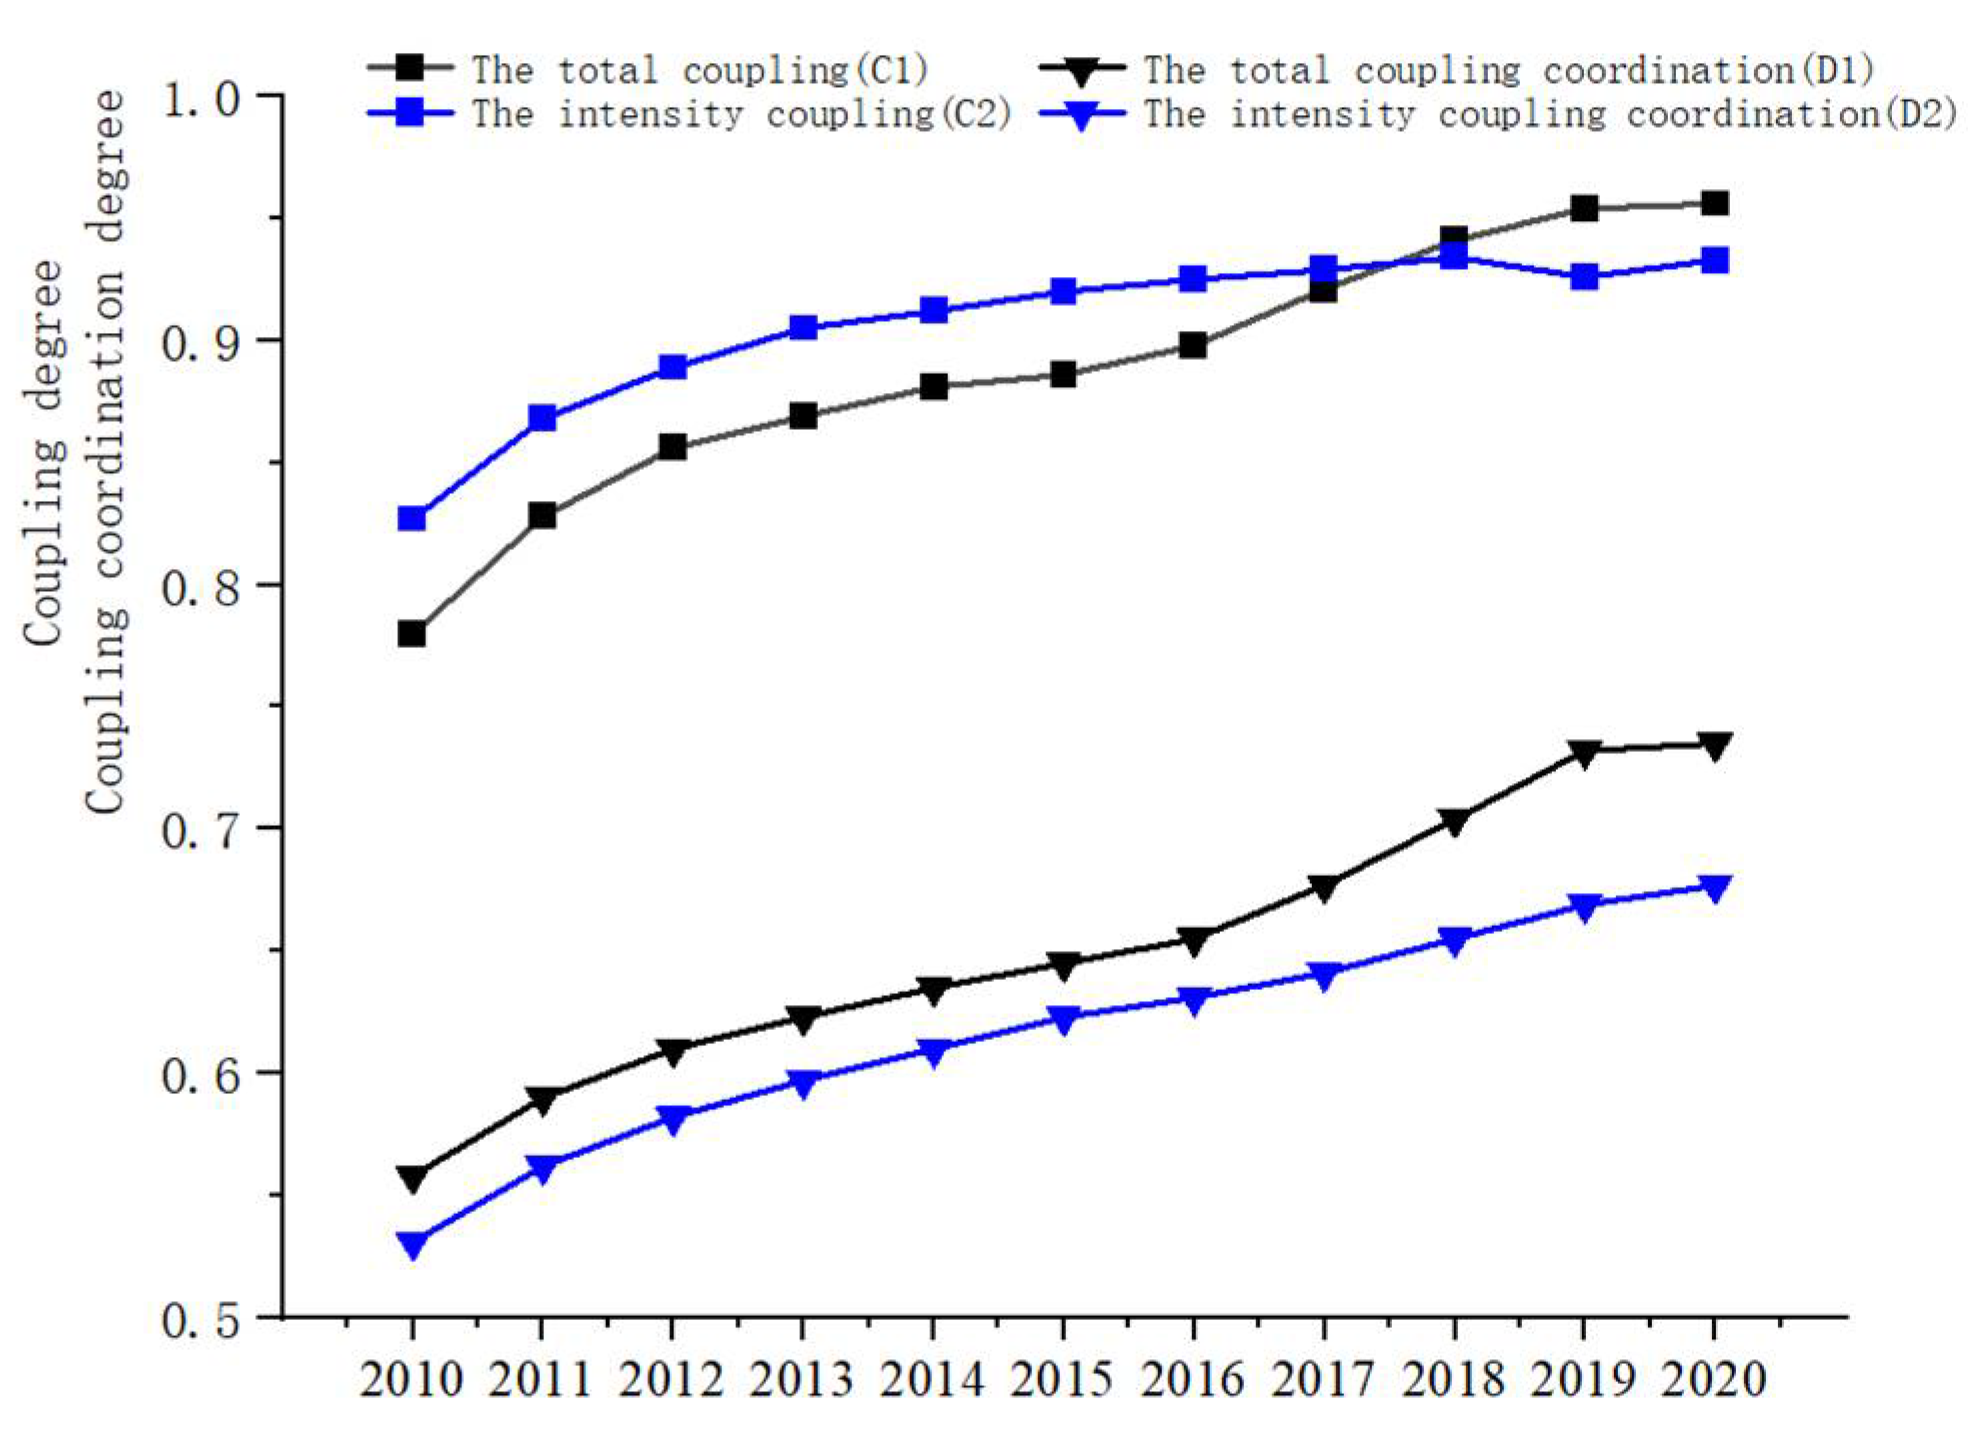
3.3.1. Temporal Characteristics of Coupling and Coupling Coordination

Figure 6 shows changes in the annual average values for coupling degree and coupling coordination degree between agricultural carbon emissions and agricultural modernization across 30 Chinese provinces from 2010 to 2020. Detailed data are reported in Table S3 in the Supplementary Materials in three representative years: 2010, 2015, and 2020.
The coupling degree between agricultural carbon emissions and agricultural modernization in China steadily increased and reached a high level of coupling from 2010 to 2020. Specifically, the coupling degree between total agricultural carbon emissions and agricultural modernization (C1) increased from 0.780 to 0.956 in the decade of 2010–2020, while the coupling degree between agricultural carbon emission intensity and agricultural modernization (C2) increased from 0.827 to 0.933. These findings indicate an increased interaction between agricultural carbon emissions and agricultural modernization in China, a close correlation, as well as an increasingly optimized coupling relationship.
Figure 6 also shows that the coupling coordination degree between agricultural carbon emissions and agricultural modernization in China again increased from 2010 to 2020, and the coordination level improved year by year. According to the coupling coordination level classification criteria in Table 3, the coupling coordination degree between total agricultural carbon emissions and agricultural modernization (D1) in China increased from 0.56 (near coordination) in 2010 to 0.74 (moderate coordination) in 2020, with the coordination level improving year by year in terms of magnitude. D1 improved the fastest from 2016 to 2019. On the other hand, the coupling coordination degree of agricultural carbon emission intensity and agricultural modernization (D2) increased from 0.53 (near coordination) to 0.66 (primary coordination) from 2010 to 2020. However, both D1 and D2 fell short of the coordination level required to achieve the dual goals of carbon emission reduction.
Figure 6 also shows a gradually widening gap in the coupling coordination among different provinces. Take D1 as an example, a backstage check (as reported in Table S3 in Supplementary Materials) showed the lowest coupling coordination degree among provinces in 2010 was in Qinghai, with a coupling coordination degree of 0.31 (mild imbalance), which was in the slightly dissonant stage. In contrast, Beijing, the highest province, had a coupling coordination of 0.76 (moderate coordination), exceeding Qinghai Province by four coordination levels. Although D1 increased year by year, the lowest coupling coordination level in 2020 was 0.49 in Henan province, which is still in the slightly dissonant stage. In contrast, Beijing, which had the highest coupling coordination, was already on a superiorly coordinated stage, with a gap of five coordination levels to Henan.

3.3.2. Temporal Characteristics of Coupling and Coupling Coordination

Figure 7 presents the geographical distributions of the total coupling coordination (D1) and intensity of coupling coordination (D2) for 30 provinces in 2010 and 2020. The degree of coupling coordination between agricultural carbon emissions and agricultural modernization increased from 2010 to 2020, with greater changes from the central and western provinces. Specifically, Ningxia, Sichuan, Chongqing, Hubei, and Hunan improved their coupling coordination levels by one or two levels, and many other provinces in those regions improved by at least one level. Most provinces moved up from the basic coordination stage of coupling coordination in 2010 to the moderately coordinated stage in 2020.
There are noticeable spatial discrepancies in the coupling coordination among provinces, which is generally high in the north and low in the south. As shown in Figure 7, the coupling coordination degree in 2010 in Xinjiang, Inner Mongolia, Heilongjiang, Jilin, and Liaoning in the north of China stepped up to a higher stage of basic coordination in both D1 and D2, and Inner Mongolia achieved the highly coordinated stage in terms of D2. In addition, in 2020, in terms of D1, Jilin in the northeast and Xinjiang in the northwest were the first to enter the superiorly coordinated stage, with the best coupling coordination. In terms of D2, Inner Mongolia and Xinjiang in the north entered the superiorly coordinated stage. In contrast, most central and southern provinces were in the moderately coordinated stage, while a few provinces were still in the basic coordination stage. Provinces such as Jiangxi were still in the slightly dissonant stage in terms of D2.

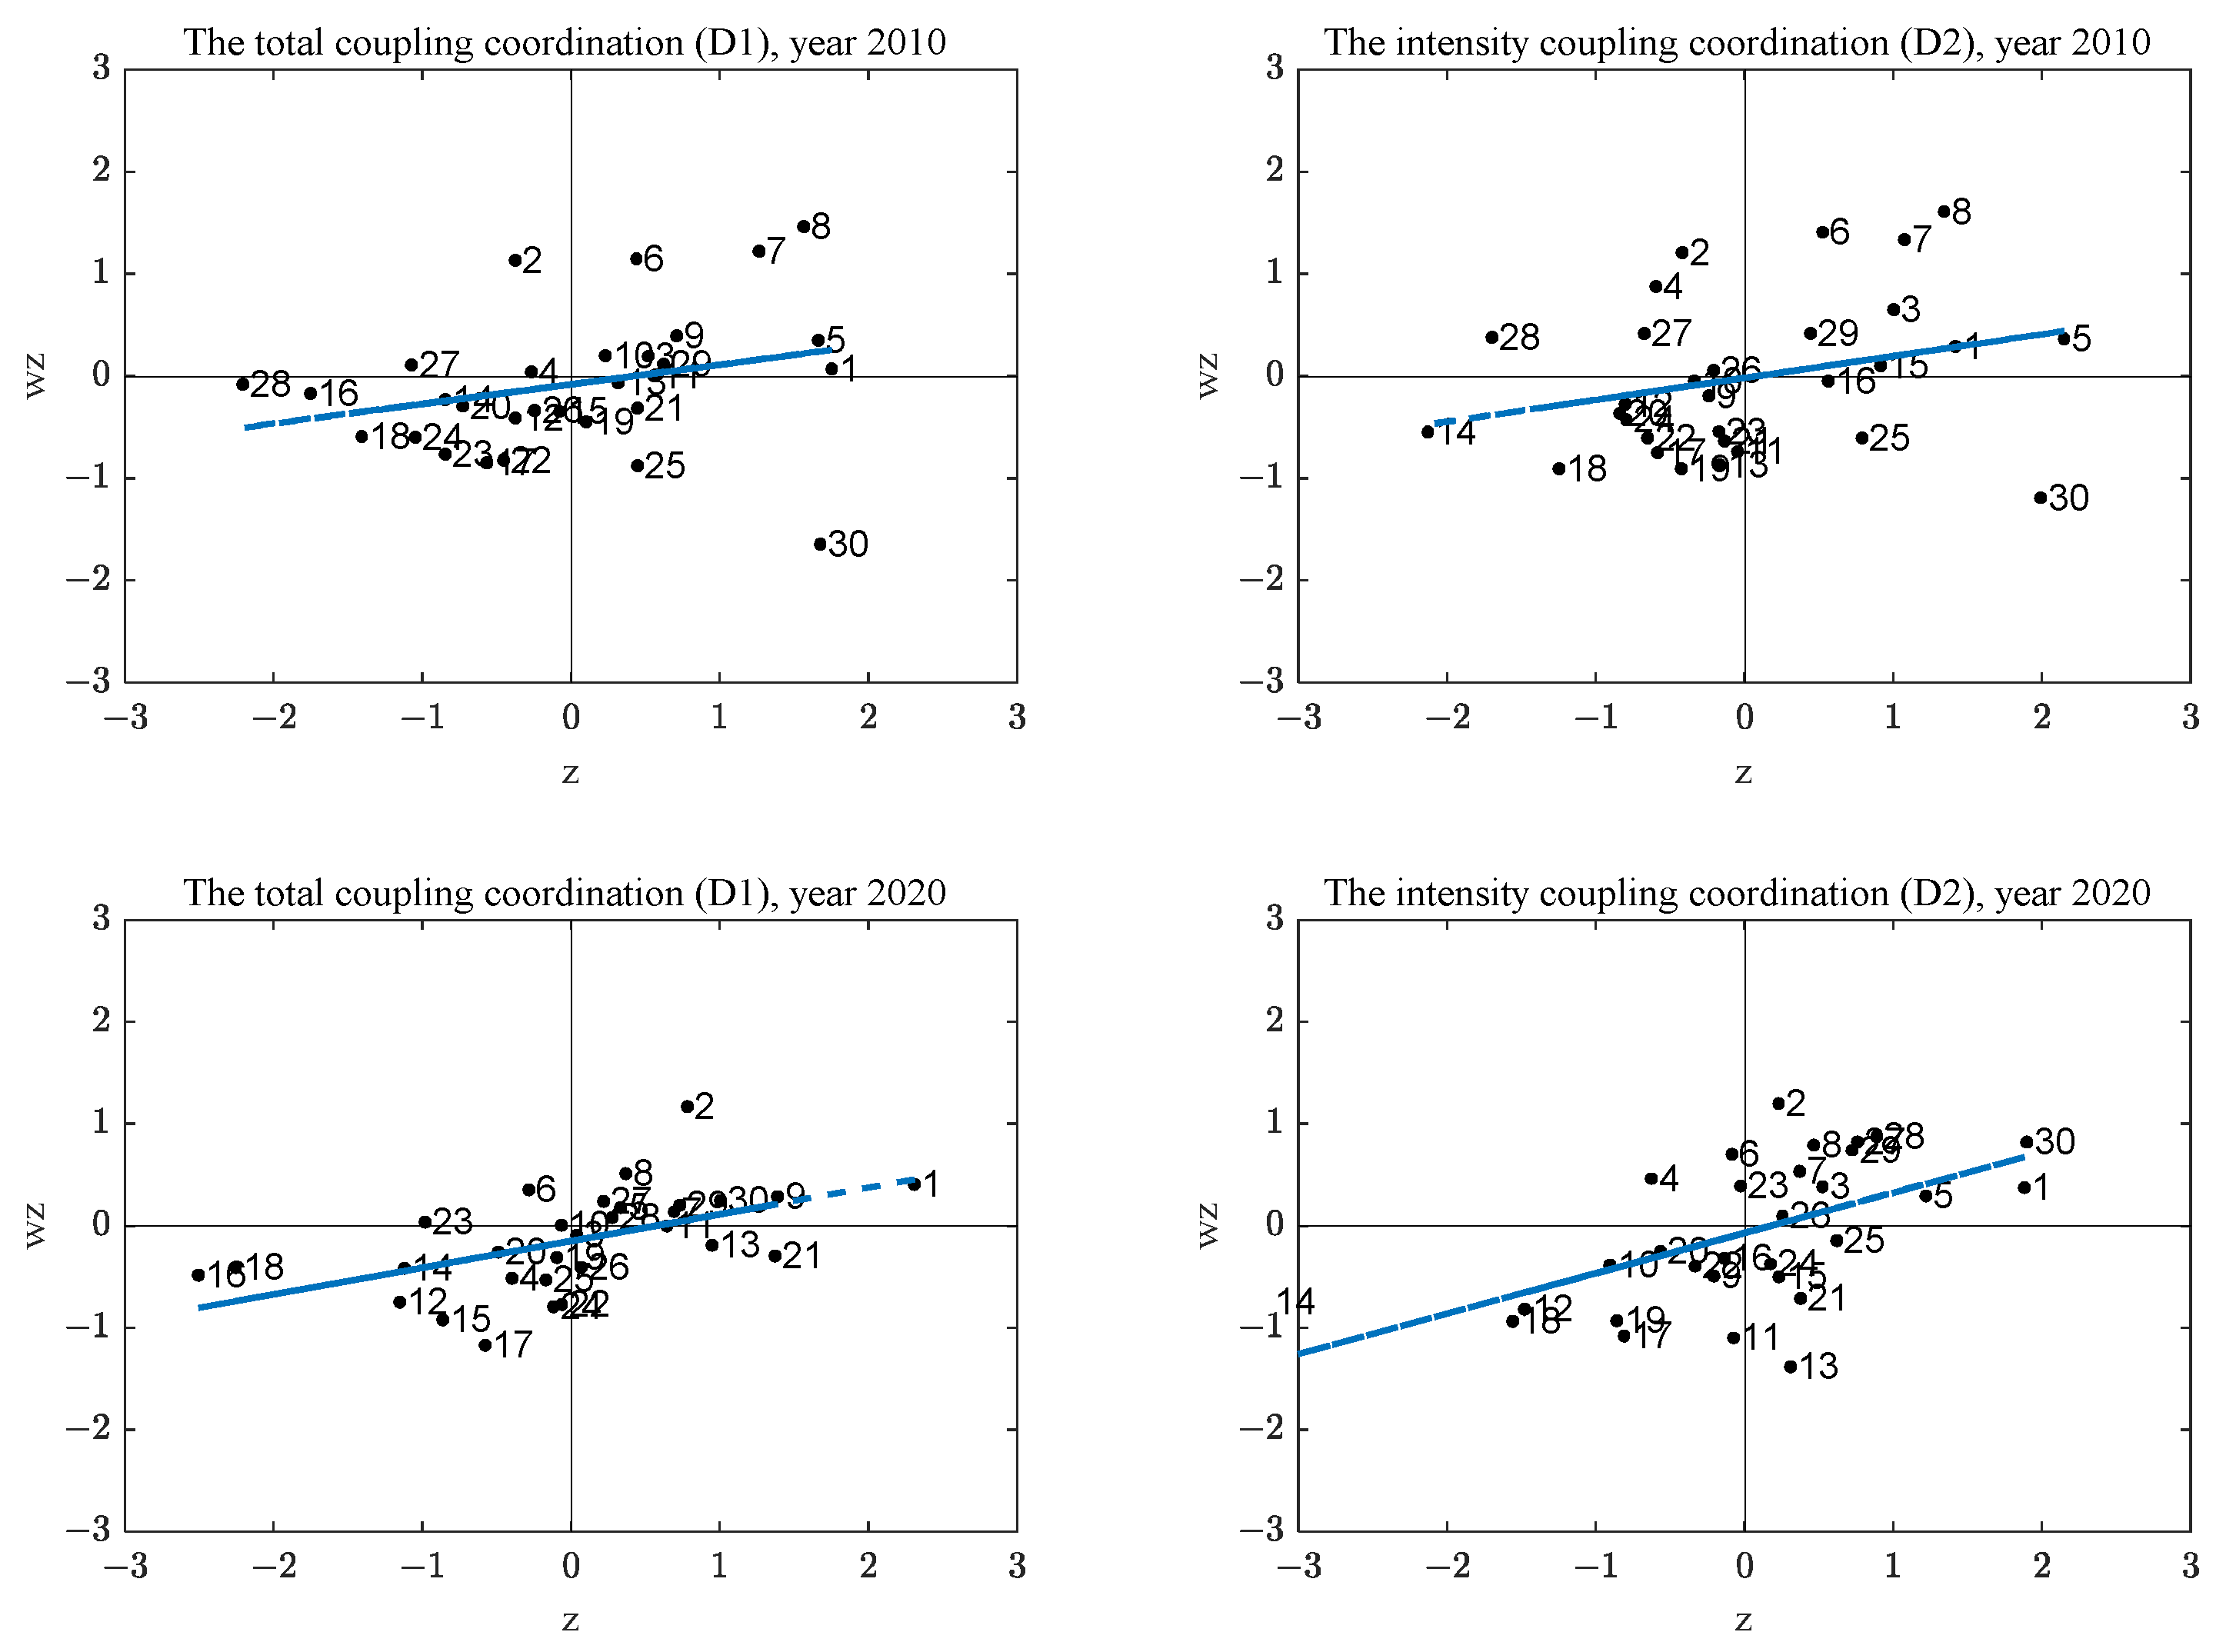
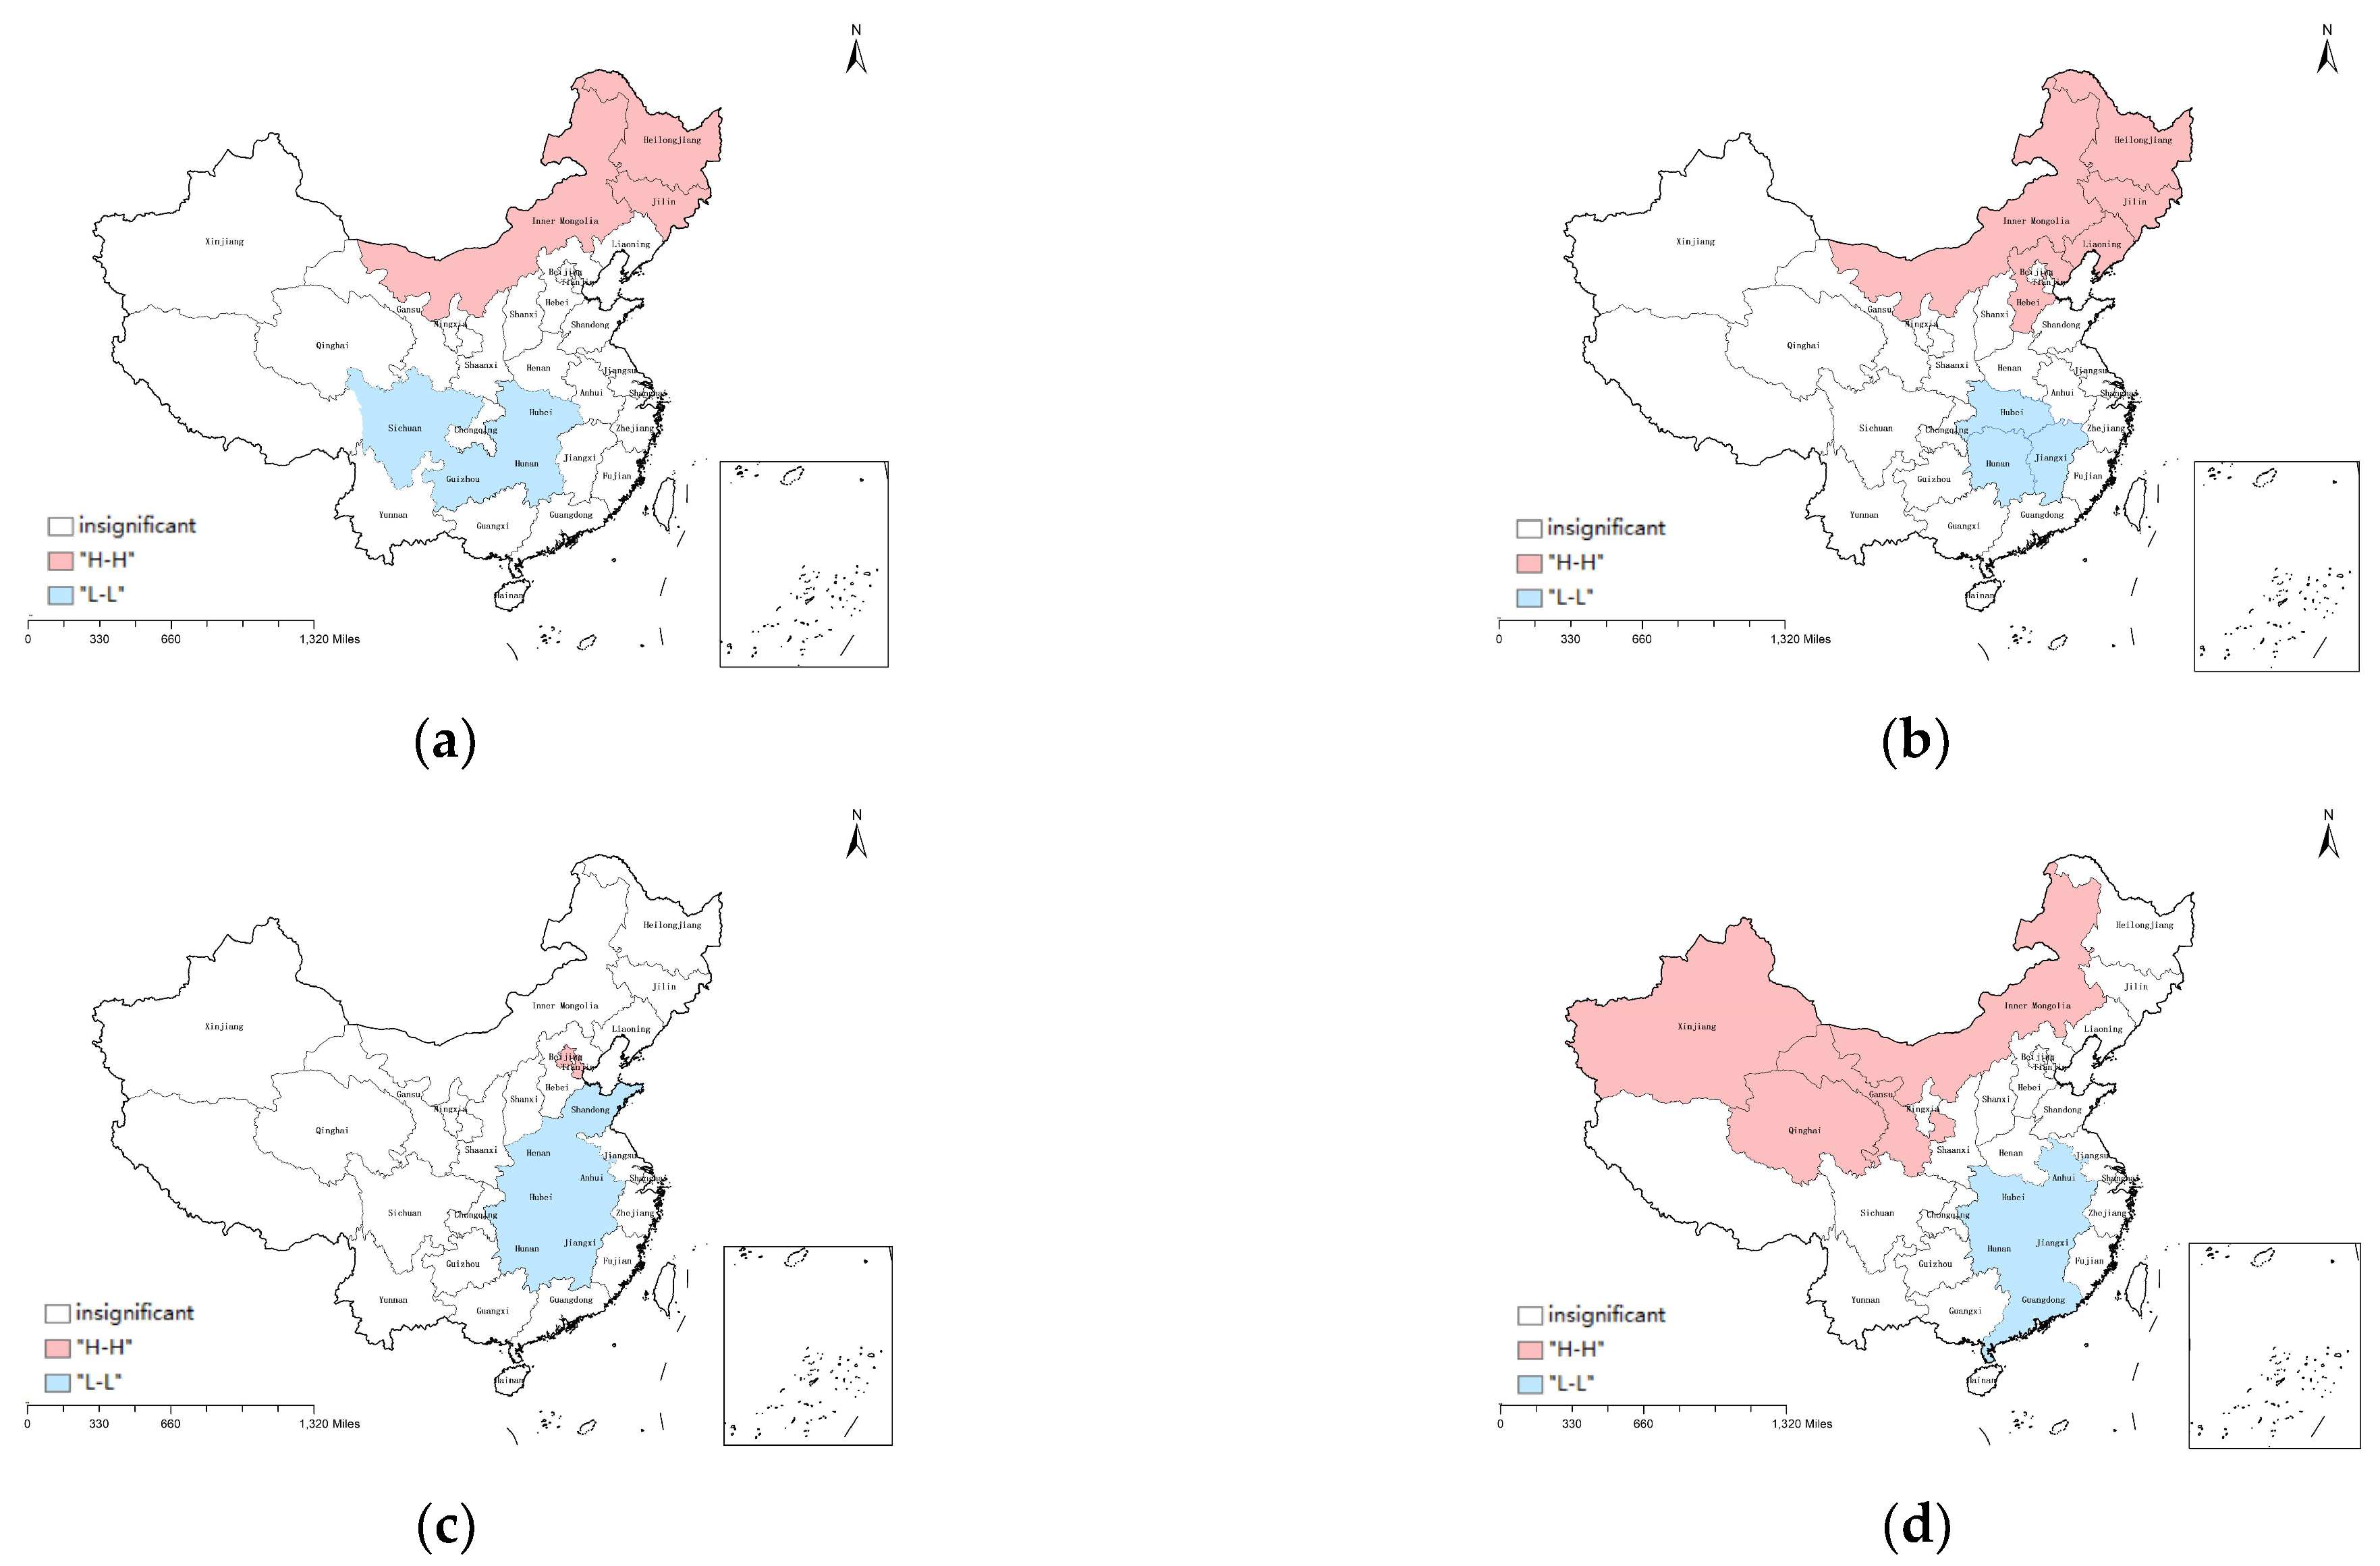
3.3.3. Spatial Autocorrelation of Coupling Coordination

Table 5 shows the global Moran’s I indices for the coupling coordination between agricultural carbon emissions and agricultural modernization in China from 2010 to 2020. The global Moran’s I of D1 and D2 in 2010 was significant at a 5% significance level, and in 2015 and 2020, the indices were significant at a 1% significance level, indicating a strong spatial autocorrelation between agricultural carbon emissions and agricultural modernization as measured by coupling coordination. In addition, the Moran’s I indices increased by year, demonstrating a statistically significant increase in a spatial clustering trend.
The Moran scatterplot of the coupling coordination degree is visualized in Figure 8. The slopes of the fitted lines in all the four scatterplots are positive, which show positive spatial autocorrelation with both D1 and D2 in the years 2010 and 2020. Most scattered points are distributed in the first and third quadrants, with only a few in the second and fourth quadrants, which jointly evidence clustering effects at the province level. Looking into the dynamics of the local Moran’s I for D1, there are 22 provinces in the first and third quadrants in 2010 and 2020, while the mean value of the local Moran’s I decreased from 0.439 to 0.391. For D2, the number of provinces distributed in the first and third quadrants is also 22, but the mean value of the local Moran’s I increased from 0.512 to 0.601. The number of provinces distributed in the first and third quadrants did not change, but the value of the local Moran’s I and the quadrant position of most provinces changed. This suggests that the spatial characteristics of each province changed slightly, but still showed agglomeration overall. For provinces in the first and third quadrants, the spatial agglomeration degree of D1 decreased, while D2 increased. In addition, Figure 8 further illustrates that the “H-H” areas are mainly located in northwest, north, and northeast of China, while the “L-L” patterns are mainly seen in central, east, and south China.
Local indicators of spatial association (LISA) may be interpreted as indicators of local pockets of nonstationary or hot spots and may be used to assess the influence of individual locations on the magnitude of the global statistic and to identify “outliers,” as in the Moran scatterplot [28]. LISA are generally divided into local Moran’s I and Geary‘s C indices. In this paper, the LISA cluster map was adopted to explain the spatial dependence and spatial differentiation characteristics according the local Moran’s I. The LISA cluster map and the Moran scatterplot work in a similar way. However, the Moran scatterplot does not reveal the statistical significance of agglomeration, whereas the LISA map captures this and visualizes the areas with significant agglomerations in the map [29]. The LISA cluster map of the coupling coordination (Figure 9) shows the “H-H” areas in the northeast and northwest regions and the “L-L” areas in the central region. According to the normal distribution approximation test, the spatial distribution was not significant beyond a 10% significance level in most provinces in 2010 and 2020, but in the provinces where it was significant beyond 10%, there were only the “H-H” and “L-L” clustering patterns but no “H-L” or “L-H” ones. Therefore, these nonsignificant provinces are not presented in Figure 9. On the one hand, the spatial clustering of carbon emission intensity of the coupling coordination in 2020 was the strongest, with “H-H” clustering in Inner Mongolia, Gansu, Qinghai, and Xinjiang in the northwest region and “L-L” clustering mainly in Guangdong and Hubei, Hunan, Anhui, and Jiangxi in the central region. On the other hand, the spatial clustering of total carbon emission coupling coordination was the weakest in 2020, with Beijing and Tianjin observing the “H-H” pattern and many central provinces still within the “L-L” category.

4. Discussion

4.1. Coupling Coordination Relationship between Agricultural Carbon Emissions and Agricultural Modernization in China

The coupling coordination relationship between agricultural carbon emissions and agricultural modernization have not yet reached a highly coordinated stage in China, but they are not contradictory in nature and can be achieved in coordination. In the past decade of 2010–2020, China’s agricultural modernization increased rapidly, whereas the total agricultural carbon emissions in 2020 increased by only 0.57% compared to 2010. These numbers lend confidence that agricultural carbon reduction goals can be achieved with the ongoing agricultural modernization. Modern agriculture is likely to result in lower carbon emissions due to the greater scale of operation, more efficient and intensive technology adoption, and reduced agricultural inputs per unit area [30]. The modernization of agriculture also features ecological and circular agriculture [31,32], which is an important dimension to reduce carbon emissions. In addition, agricultural modernization inevitably requires financial support, and green financial system can force agricultural enterprises to improve energy efficiency, reduce the use of pesticides and fertilizers, and strengthen the conservation of arable land [33,34], thereby reducing agricultural carbon emissions. Furthermore, the environmental Kuznets curve shows an inverted U-shaped relationship between the level of environmental pollution and economic development, and this relationship also exists in the agricultural sector [11]. As China’s agricultural modernization continues to improve, total agricultural carbon emissions are growing slowly with decreasing intensity, and the level of coupling and coordination continues to improve. Thus, China seems to be approaching the turning point of its inverted “U” curve, as agricultural modernization is becoming increasingly green and sustainable. Of course, these may also be the results of the gradual improvement of carbon emission reduction policies, related legal and regulatory systems, accelerated green transformation of agricultural production, and significant increases in investments in environmental protection and energy saving [35].

4.2. Factors Influencing Spatial Differences of the Coupling and Coordination of Agricultural Carbon Emissions and Agricultural Modernization

Multiple factors may lead to significant spatial differences among the provinces of China in terms of the agricultural carbon emissions, agricultural modernization, and their coupling relations. Firstly, the different product portfolios and production scales in each province have resulted in diversified agricultural modernization and carbon emission levels. As seen above, most provinces with low agricultural carbon emission intensity are mainly located in the northwest and northeast regions, where the level of agricultural modernization is higher and the coupling coordination stage is among the highest in the country. In these areas, the advantageous land resources facilitate the implementation of large-scale agricultural production and modern technology adoption, resulting in more efficient and higher-quality agricultural production [36] and a reduction in the intensity of agricultural carbon emissions. Secondly, the development of ecoagriculture and green finance helps to promote the modernization of agriculture and at the same time reduce agricultural carbon emissions. Modernizing agriculture while focusing on protecting agricultural resources and the environment is key to achieving sustainable agricultural development [37]. Over the past decade, China has launched a number of policies to support the development of ecoagriculture and circular agriculture [31,32] and vigorously promoted the green financial system [38], which has strongly contributed to the agricultural modernization. One example is the Zero-Growth Action Plan for Fertilizer Use by 2020, which has been in place since 2015 and constituted a strong contribution to the reduction of chemical input use in the agricultural sector [8]. In addition, China has been restructuring its livestock industry over the past decade and has launched several ecological and environmental policies to restrain pollution in the production process, which help to reduce carbon emissions from livestock farming [16]. Finally, varying climate, landscape, and soil conditions, as well as different socioeconomic conditions, such as infrastructure, market size, and transportation, may result in spatial differences in the level of coordination between agricultural carbon emissions and agricultural modernization [39].

4.3. Policy Recommendations

Agricultural carbon reduction in the process of agricultural modernization deserves increased attention from policy makers. Firstly, resources are continually needed in the research and development of green and clean agricultural technologies, green financial systems, and agricultural environmental regulation [40]. Specific attention is required in infrastructure development, such as high-quality farmland, rural roads, electricity, and irrigation in rural areas, which are facilitators in achieving carbon reductions in agriculture. Secondly, synergistic cooperation among regions is essential to break down barriers of agricultural carbon emission reduction in the process of agricultural modernization. Based on the resource endowment of different regions [41], governmental or nongovernmental organizations can establish inter-regional carbon market trading mechanisms and carry out inter-regional cooperation through market mechanisms in achieving agricultural carbon emission reduction [42]. Thirdly, encouraging agricultural producers and consumers to participate in green emission reduction programs cannot be overemphasized. On the one hand, encouraging farmers to use clean energy in their production and daily lives thereby reducing their use of traditional fossil fuels and improving the efficiency of agricultural energy use are needed changes from farmers, which can upgrade the energy consumption structure in agriculture and reduce carbon emissions [43,44]. On the other hand, support to farmers is needed in using organic fertilizers, reducing the use of pesticides and chemical fertilizers, and adopting green and circular ecological agriculture [8].
At one time, China’s rapid agricultural development came at the expense of environmental degradation through large amounts of carbon emissions. For this reason, the Chinese government has initiated a new development strategy toward a highly technological, green, open, and shared development model. As a result, the Chinese government is pushing forward with the modernization of agriculture, while at the same time placing more strict regulation standards on green and sustainable development. This study clarifies the relationship between agricultural modernization and agricultural carbon emissions by exploring the spatial evolutionary characteristics from 2010 to 2020 in China. This study examined the unbalanced and insufficient problems in agricultural development and further discussed the factors that are affecting coordinated development, which are conducive to the green development of Chinese agriculture. The above findings and discussions generally suggest that agriculture modernization and agricultural carbon emissions can be developed in a coupled and coordinated way. Although there is still a high level of carbon emissions in China’s agricultural sector, agriculture modernization and agricultural carbon emissions can achieve a win-win situation if a green and sustainable approach to modern agriculture is adopted and continually adhered to. This study is meaningful as a reference for China to become a modern and environmentally friendly agricultural powerhouse and could also potentially provide some lessons for other developing countries around the world.

5. Conclusions

This study developed index systems to measure agricultural carbon emissions and the agricultural modernization level and then employed coupling coordination and spatial autocorrelation methods to analyze their coupled coordination relationship in China from 2010 to 2020. The agricultural carbon emission intensity at the national average decreased from 4.9 tons per 10 thousand CNY in 2010 to 2.43 tons in 2020, a reduction of more than half. At the same time, the agricultural modernization level at the national average changed from 0.155 in 2010 to 0.272 in 2020. China experienced a continuous decline in agricultural carbon emission intensity and an increase in the level of agricultural modernization during the decade from 2010 to 2020. Yet, both agricultural carbon emissions and the level of agricultural modernization manifested obvious clustering characteristics, with significant spatial disparities among provinces although the degree of coupling and coordination among provinces increased year by year and the degree of coordinated development gradually strengthened. In 2020, D1 was 0.74, and D2 was only 0.66, and neither was at a high-level coordination stage. The gap among provinces is still widening year by year. The results of the study reflect the uneven and insufficient development of Chinese agriculture. There is thus a need to consider measures, especially in the central and western regions of China, to introduce and stimulate the take-up of a green modernization pathway and intensify carbon reduction in agriculture.
In this study, we summarized and analyzed the spatial and temporal characteristics of regional agricultural carbon emissions and agricultural modernization in 30 Chinese provinces, as well as the coupling coordination between the two. The evidence shows that agricultural carbon reduction and agricultural modernization can be coupled and coordinated and that the two are not necessarily substituting but possibly complementing each other. The findings of this study attest to China’s achievements over the last decade in terms of the SDGs for agriculture. Furthermore, the exploration of the relationship between agricultural modernization and agricultural carbon emissions provides coordinated development directions for agriculture to better achieve the SDGs.
The research confirms the coordinated relationship between agricultural carbon emissions and agricultural modernization, identifies the unbalanced development among the provinces in China. The research provides a theoretical basis for the high-speed, high-quality and balanced sustainable development of Chinese agriculture. However, there are some limitations to this study given its explorative nature. Due to the limited availability of data, this study only focused on the coupling coordination analysis from 2010 to 2020 at the province level in China. There is a lack of further empirical research exploring the factors affecting the coordination of agricultural modernization and agricultural carbon emissions. Furthermore, the indicators of agricultural modernization and agricultural carbon emissions can be improved when finer-scale data become available. In a word, with the further implementation of the Chinese government’s policy on dual carbon and rural revitalization, more in-depth microscopic research will be needed in the future.

Supplementary Materials

The following supporting information can be downloaded at: https://www.mdpi.com/article/10.3390/agriculture12111809/s1, Table S1: Emission factors of different carbon emission sources; Table S2: Carbon emission factors of rice cultivation in different provinces; Table S3: Coupling and coupling coordination of agricultural carbon emissions with agricultural modernization in 2010, 2015, and 2020.

Author Contributions

Conceptualization, X.C. and D.Z.; methodology, M.X. and Q.H.; formal analysis, M.X.; writing—original draft preparation, X.C. and M.X.; writing—review and editing, D.Z. and Q.H. All authors have read and agreed to the published version of the manuscript.

Funding

This research was funded by the National Natural Sciences Foundation of China (Grant No. 72063002), the Ministry of Education of Humanities and Social Science project (22YJA790010), and the Natural Sciences Foundation of Guangxi Province (Grant No. 2019JJA180063).

Institutional Review Board Statement

Not applicable.

Informed Consent Statement

Not applicable.

Data Availability Statement

Data are openly accessible and freely available to everyone.

Conflicts of Interest

The authors declare no conflict of interest.

References

  1. Bai, Y.P.; Deng, X.Z.; Jiang, S.J.; Zhao, Z.; Miao, Y. Relationship between Climate Change and Low-Carbon Agricultural Production: A Case Study in Hebei Province, China. Ecol. Indic. 2019, 105, 438–447. [Google Scholar] [CrossRef]
  2. Madden, S.M.; Ryan, A.; Walsh, P. Exploratory Study on Modelling Agricultural Carbon Emissions in Ireland. Agriculture 2022, 12, 12. [Google Scholar] [CrossRef]
  3. Rosin, Z.M.; Part, T.; Low, M.; Kotowska, D.; Tobolka, M.; Szymanski, P.; Hiron, M. Village Modernization May Contribute More to Farmland Bird Declines Than Agricultural Intensification. Conserv. Lett. 2021, 14, 10. [Google Scholar] [CrossRef]
  4. Sun, L.Y.; Wang, M.H. Global Warming and Global Dioxide Emission: An Empirical Study. J. Environ. Manage. 1996, 46, 327–343. [Google Scholar] [CrossRef]
  5. Pickson, R.B.; Gui, P.; Chen, A.; Boateng, E. Empirical Analysis of Rice and Maize Production under Climate Change in China. Environ. Sci. Pollut. Res. 2022, 29, 70242–70261. [Google Scholar] [CrossRef]
  6. Amin, N.; Song, H.; Farrukh, M.U. Does Sectoral Modernization Promote CO2 Emissions? Dynamic Panel Analysis of Selected Asian Countries. Environ. Sci. Pollut. Res. 2022, 12. [Google Scholar] [CrossRef]
  7. Chen, X.J.; Zeng, D.; Zhang, H.; Kang, C. Farm Expansion under Credit Constraint: Evidence from Commercial Rice Farmers in Guangxi, China. Int. Food Agribus. Manag. Rev. 2020, 23, 203–215. [Google Scholar] [CrossRef]
  8. Guo, L.; Zhao, S.; Song, Y.; Tang, M.; Li, H. Green Finance, Chemical Fertilizer Use and Carbon Emissions from Agricultural Production. Agriculture 2022, 12, 313. [Google Scholar] [CrossRef]
  9. Lin, B.; Xu, M.; Wang, X. Mitigation of Greenhouse Gas Emissions in China’s Agricultural Sector: Current Status and Future Perspectives. Chin. J. Eco-Agric. 2022, 30, 500–515. [Google Scholar]
  10. Hu, Z.; Zhu, D.; Xin, L.; Hou, L.; Wang, D. Comparison Study on the Level of International Agricultural Modernization Based on the Method of Generation Gap of Industry Elements. Sci. Agric. Sin. 2018, 51, 1412–1420. [Google Scholar]
  11. Balsalobre-Lorente, D.; Driha, O.M.; Bekun, F.V.; Osundina, O.A. Do Agricultural Activities Induce Carbon Emissions? The Brics Experience. Environ. Sci. Pollut. Res. 2019, 26, 25218–25234. [Google Scholar] [CrossRef]
  12. Chen, S.; Ji, C.; Jin, S.Q. Costs of an Environmental Regulation in Livestock Farming: Evidence from Pig Production in Rural China. J. Agric. Econ. 2022, 73, 541–563. [Google Scholar] [CrossRef]
  13. Xiao, Z.M.; Yu, L.; Liu, Y.W.; Bu, X.N.; Yin, Z.C. Does Green Credit Policy Move the Industrial Firms toward a Greener Future? Evidence from a Quasi-Natural Experiment in China. Front. Environ. Sci. 2022, 9, 11. [Google Scholar] [CrossRef]
  14. Hussain, I.; Rehman, A. How CO2 Emission Interacts with Livestock Production for Environmental Sustainability? Evidence from Pakistan. Environ. Dev. Sustain. 2022, 24, 8545–8565. [Google Scholar] [CrossRef]
  15. Guo, H.P.; Fan, B.Q.; Pan, C.L. Study on Mechanisms Underlying Changes in Agricultural Carbon Emissions: A Case in Jilin Province, China, 1998–2018. Int. J. Environ. Res. Public Health 2021, 18, 17. [Google Scholar] [CrossRef]
  16. Xiong, C.; Su, W.; Li, H.; Guo, Z. Influencing Mechanism of Non-CO2 Greenhouse Gas Emissions and Mitigation Strategies of Livestock Sector in Developed Regions of Eastern China: A Case Study of Jiangsu Province. Environ. Sci. Pollut. Res. 2022, 29, 39937–39947. [Google Scholar] [CrossRef]
  17. Wang, G.; Liao, M.; Jiang, J. Research on Agricultural Carbon Emissions and Regional Carbon Emissions Reduction Strategies in China. Sustainability 2020, 12, 2627. [Google Scholar] [CrossRef] [Green Version]
  18. Zhang, Z.; Li, Y.; Elahi, E.; Wang, Y. Comprehensive Evaluation of Agricultural Modernization Levels. Sustainability 2022, 14, 5069. [Google Scholar] [CrossRef]
  19. Chen, K.J.; Tian, G.L.; Tian, Z.; Ren, Y.J.; Liang, W. Evaluation of the Coupled and Coordinated Relationship between Agricultural Modernization and Regional Economic Development under the Rural Revitalization Strategy. Agronomy 2022, 12, 21. [Google Scholar] [CrossRef]
  20. Liu, M.M.; Pan, P.P.; Ren, J.X.; Wen, J.Y.; Zhang, B. Coupling and Coordination of Food Security and Agricultural Water Security in Beijing-Tianjin-Hebeiregion. J. China Agric. Resour. Reg. Plan. 2022, 78, 287–294. [Google Scholar]
  21. Han, H.B.; Zhong, Z.Q.; Guo, Y.; Xi, F.; Liu, S.L. Coupling and Decoupling Effects of Agricultural Carbon Emissions in China and Their Driving Factors. Environ. Sci. Pollut. Res. 2018, 25, 25280–25293. [Google Scholar] [CrossRef] [PubMed]
  22. Min, J.; Hu, H. Calculation of Greenhouse Gases Emission from Agricultural Production in China. Chin. J. Popul. Resour. Environ. 2012, 22, 21–27. [Google Scholar]
  23. Yin, D.Y.; Yu, H.C.; Ma, J.; Liu, J.N.; Liu, G.J.; Chen, F. Interaction and Coupling Mechanism between Recessive Land Use Transition and Food Security: A Case Study of the Yellow River Basin in China. Agriculture 2022, 12, 21. [Google Scholar] [CrossRef]
  24. Waldhor, T. The Spatial Autocorrelation Coefficient Moran’s I under Heteroscedasticity. Stat. Med. 1996, 15, 887–892. [Google Scholar] [CrossRef]
  25. Guo, H.; Yi, X.; Pan, C.; Yang, B.; Li, Y. Analysis on the Temporal and Spatial Features of the Coupling and Coordination of Industrialization and Agricultural Green Development in China During 1990–2019. Int. J. Environ. Res. Public Health 2021, 18, 8320. [Google Scholar] [CrossRef]
  26. Xu, S.; Zuo, Y.; Law, R.; Zhang, M.; Han, J.; Li, G.; Meng, J. Coupling Coordination and Spatiotemporal Dynamic Evolution between Medical Services and Tourism Development in China. Front. Public Health 2022, 10, 731251. [Google Scholar] [CrossRef]
  27. Li, Y.; Zhang, X.; Gao, X. An Evaluation of the Coupling Coordination Degree of an Urban Economy–Society–Environment System Based on a Multi-Scenario Analysis: The Case of Chengde City in China. Sustainability 2022, 14, 6790. [Google Scholar] [CrossRef]
  28. Anselin, L. Local Indicators of Spatial Association—Lisa. Geogr. Anal. 1995, 27, 93–115. [Google Scholar] [CrossRef]
  29. Anselin, L. The Moran Scatterplot as an Esda Tool to Assess Local Instability in Spatial Association. In Spatial Analytical Perspectives on Gis; Ficher, M.M., Scholten, H.J., Unwin, D., Eds.; Taylor and Francis: London, UK, 1996. [Google Scholar]
  30. Burney, J.A.; Davis, S.J.; Lobell, D.B. Greenhouse Gas Mitigation by Agricultural Intensification. Proc. Natl. Acad. Sci. USA 2010, 107, 12052–12057. [Google Scholar] [CrossRef] [Green Version]
  31. Liu, Y.; Zhou, Y.; Zha, H.; Mathieu, S.S. Impact of Financial Subsidies on Ecological Agriculture Benefits: Evidence from China. Transform. Bus. Econ. 2021, 20, 704–722. [Google Scholar]
  32. Shan, W. Ecological Environment Protection and Agricultural Regional Economic Development in the Yellow River Basin. J. Environ. Prot. Ecol. 2021, 22, 2241–2250. [Google Scholar]
  33. Jiang, Y.P.; Li, K.R.; Chen, S.F.; Fu, X.L.; Feng, S.Y.; Zhuang, Z.S. A Sustainable Agricultural Supply Chain Considering Substituting Organic Manure for Chemical Fertilizer. Sustain. Prod. Consump. 2022, 29, 432–446. [Google Scholar] [CrossRef]
  34. Khan, M.A.; Riaz, H.; Ahmed, M.; Saeed, A. Does Green Finance Really Deliver What Is Expected? An Empirical Perspective. Borsa Istanb. Rev. 2022, 22, 586–593. [Google Scholar] [CrossRef]
  35. Zhang, K.; Li, Y.C.; Qi, Y.; Shao, S. Can Green Credit Policy Improve Environmental Quality? Evidence from China. J. Environ. Manage. 2021, 298, 11. [Google Scholar] [CrossRef]
  36. Xie, K.; Ding, M.; Zhang, J.; Chen, L. Trends Towards Coordination between Grain Production and Economic Development in China. Agriculture 2021, 11, 975. [Google Scholar] [CrossRef]
  37. Knickel, K.; Ashkenazy, A.; Chebach, T.C.; Parrot, N. Agricultural Modernization and Sustainable Agriculture: Contradictions and Complementarities. Int. J. Agric. Sustain. 2017, 15, 575–592. [Google Scholar] [CrossRef]
  38. Fang, Z.; Yang, C.; Song, X. How Do Green Finance and Energy Efficiency Mitigate Carbon Emissions without Reducing Economic Growth in G7 Countries? Front. Psychol. 2022, 13, 879741. [Google Scholar] [CrossRef]
  39. Cui, Y.; Khan, S.U.; Deng, Y.; Zhao, M.J. Regional Difference Decomposition and Its Spatiotemporal Dynamic Evolution of Chinese Agricultural Carbon Emission: Considering Carbon Sink Effect. Environ. Sci. Pollut. Res. 2021, 28, 38909–38928. [Google Scholar] [CrossRef]
  40. Appiah, K.; Appah, R.; Barnes, W.; Darko, E.A. Testing the Validity of Disaggregated Agricultural-Induced Growth–Environmental Pollution Nexus in Selected Emerging Economies. Int. J. Environ. Sci. Technol. 2022, 16. [Google Scholar] [CrossRef]
  41. Zhang, Y.; Yu, Z.; Zhang, J. Research on Carbon Emission Differences Decomposition and Spatial Heterogeneity Pattern of China’s Eight Economic Regions. Environ. Sci. Pollut. Res. 2022, 29, 29976–29992. [Google Scholar] [CrossRef]
  42. Cui, Y.; Khan, S.U.; Deng, Y.; Zhao, M.; Hou, M. Environmental Improvement Value of Agricultural Carbon Reduction and Its Spatiotemporal Dynamic Evolution: Evidence from China. Sci. Total Environ. 2021, 754, 142170. [Google Scholar] [CrossRef] [PubMed]
  43. Dong, K.Y.; Dong, X.C.; Jiang, Q.Z. How Renewable Energy Consumption Lower Global CO2 Emissions? Evidence from Countries with Different Income Levels. World Econ. 2020, 43, 1665–1698. [Google Scholar] [CrossRef]
  44. Elahi, E.; Khalid, Z.; Zhang, Z.X. Understanding Farmers’ Intention and Willingness to Install Renewable Energy Technology: A Solution to Reduce the Environmental Emissions of Agriculture. Appl. Energy 2022, 309, 15. [Google Scholar] [CrossRef]
Figure 1. Coupling framework of agricultural carbon emissions and agricultural modernization.
Agriculture 12 01809 g001
Figure 2. Evaluation index system of agricultural carbon emissions. Note: Only methane emissions from rice were considered in this paper, as rice is the most significant source of methane emissions from crop cultivation, while other crops are largely negligible [17].
Agriculture 12 01809 g002
Figure 3. Temporal characteristics of agricultural carbon emission intensity and agricultural modernization level. Source: Authors’ calculations. Same below.
Agriculture 12 01809 g003
Figure 4. Temporal characteristics of total agricultural carbon emissions and structural proportions.
Agriculture 12 01809 g004
Figure 5. Global Moran’s I of agricultural carbon emission and modern agricultural levels.
Agriculture 12 01809 g005
Figure 6. Coupling degree and coupling coordination degree of agricultural carbon emission reduction and agricultural modernization.
Agriculture 12 01809 g006
Figure 7. Distribution of coupling coordination degree between agricultural carbon emissions and agricultural modernization. Note: (a) Total coupling coordination (D1) in 2010. (b) Intensity of coupling coordination (D2) in 2010. (c) Total coupling coordination (D1) in 2020. (d) Intensity of coupling coordination (D2) in 2020.
Agriculture 12 01809 g007
Figure 8. Moran scatterplot of coupling coordination degree. Note: 1–30 represent: 1 Beijing, 2 Tianjin, 3 Hebei, 4 Shanxi, 5 Inner Mongolia, 6 Liaoning, 7 Jilin, 8 Heilongjiang, 9 Shanghai, 10 Jiangsu, 11 Zhejiang, 12 Anhui, 13 Fujian, 14 Jiangxi, 15 Shandong, 16 Henan, 17 Hubei, 18 Hunan, 19 Guangdong, 20 Guangxi, 21 Hainan, 22 Chongqing, 23 Sichuan, 24 Guizhou, 25 Yunnan, 26 Shaanxi, 27 Gansu, 28 Qinghai, 29 Ningxia, and 30 Xinjiang.
Agriculture 12 01809 g008
Figure 9. Local indicators of spatial association (LISA) cluster maps of coupling coordination degree in 2010 and 2020. Note: (a) Total coupling coordination (D1) in 2010. (b) Intensity of coupling coordination (D2) in 2010. (c) Total coupling coordination (D1) in 2020. (d) Intensity of coupling coordination (D2) in 2020.
Agriculture 12 01809 g009
Table 1. Evaluation index system of agricultural modernization level.
Target LayerIndicatorsIndicator CalculationsDirectionWeight
Agricultural equipment and technologyLevel of agricultural mechanizationTotal agricultural machinery power (10 thousand kilowatts)+0.0910
Level of agricultural irrigationEffective irrigated farmland/total cultivated area (%)+0.0288
Level of agricultural informatizationRural broadband access users/total rural households (%)+0.0828
Agricultural business managementModerate-scale operationsNumber of households with cultivated land area of 2 hectares or above/total number of households (%)+0.1996
Farm land scaling and land transferProportion of households with more than 0.67 hectares cultivated land × 0.5 + Proportion of total transferred land of total cultivated land × 0.5 (%)+0.0876
Agricultural disaster prevention rate1 − (Disaster area of crops/sown area of crops) (%)+0.0980
Disposable income per rural residentsPer capita disposable income of rural residents (Chinese yuan/person)+0.0540
Agricultural Social ServiceFarmer organization levelNumber of rural cooperative members/total number of peasant households (%)+0.0687
Agricultural socialization service levelNumber of specialized agricultural machinery service institutions/number of peasant households (%)+0.0832
Depth of agricultural insuranceTotal agricultural insurance premiums/GDP from agriculture sector (%)+0.1130
Agricultural output efficiencyAgricultural labor productivityAverage value added of each agricultural employee (Chinese yuan/person)+0.0521
Land productivityOutput value of plantation per unit area (Chinese yuan/ha)+0.0700
Grain productivityGrain yield (kg/ha)+0.0251
Green agricultural productionWater usage per unit of agricultural added valueWater usage/GDP from agriculture sector (kg/CNY 10,000)0.0068
Energy consumption per unit of agricultural added valueTotal diesel usage in agriculture/GDP from agriculture sector (kg/CNY 10,000)0.0147
Fertilizer reductionAnnual sequential reduce rate in fertilizer (%)0.0099
Pesticide reductionAnnual sequential reduce rate in pesticides (%)0.0029
Note: Weight of indicators in column 5 were calculated by the entropy method [20]. The average exchange rate between the US dollar and the Chinese yuan for the period 2010–2020 was USD 1 = CNY 6.54.
Table 2. Classification standard of coupling types.
Coupling DegreeCoupling Stage
(0.0~0.3)Low-level coupling stage
[0.3~0.5)Basic coupling stage
[0.5~0.8)Moderate coupling stage
[0.8~1.0)High-level coupling stage
Note: According to the existing research of Liu, Pan, Ren, Wen, and Zhang [20], the coupling degree was classified into four stages in this paper.
Table 3. Classification standard of coupling coordination types.
Coordination StageCoupling Coordination DegreeCoordination Level
Seriously dissonant stage(0.0, 0.1)Extreme imbalance
[0.1, 0.2)Serious imbalance
Slightly dissonant stage[0.2, 0.3)Moderate imbalance
[0.3, 0.4)Mild imbalance
Basic coordination stage[0.4, 0.5)On the verge of imbalance
[0.5, 0.6)Near coordination
Moderately coordinated stage[0.6, 0.7)Primary coordination
[0.7, 0.8)Moderate coordination
Superiorly coordinated stage[0.8, 0.9)Good coordination
[0.9, 1.0)Extreme coordination
Note: According to the existing research of Li, Zhang, and Gao [27] and Xu, Zuo, Law, Zhang, Han, Li, and Meng [26], the degree of coupling coordination of agricultural carbon emissions and agricultural modernization was divided into 10 levels, and development stage was divided into 5 stages.
Table 4. Descriptive statistics on agricultural carbon emissions and the level of agricultural modernization in 30 provinces.
Total Carbon EmissionsCarbon Emission IntensityAgricultural Modernization
201020152020201020152020201020152020
Max2880.93045.92714.40.7420.7380.7610.3070.3790.404
Min66.850.824.90.0130.0130.0130.0810.1300.188
Mean1105.61188.11111.90.3660.3730.3970.1550.2100.272
S.D.765.0822.9761.80.1820.1820.1880.0540.0610.057
Median910.81146.51119.30.3530.3760.4150.1420.1990.264
Table 5. Global Moran’s I of coupling coordination degree.
Total Moran’s I (D1)E (I)Sd (I)Zp-Value
20100.192−0.0340.1201.8790.030
20150.229−0.0340.1132.3360.010
20200.262−0.0340.1182.5160.006
Intensity Moran’s I (D2)E (I)Sd (I)Zp-Value
20100.214−0.0340.1202.0690.019
20150.346−0.0340.1173.2550.001
20200.397−0.0340.1153.7580.000
Note: Significance test conducted by normal distribution approximation test (Z-test).
Publisher’s Note: MDPI stays neutral with regard to jurisdictional claims in published maps and institutional affiliations.

