Abstract
Global warming will increase pest insect population sizes and diminish the effectiveness of biological control. This biological control failure scenario appears to be of particular concern for areas with a significant increase in maximum temperatures, such as the increase experienced in the Central Valley of Chile over the last 40 years. We assessed the impact of different climatic zones and maximum temperatures along the coast and the Chilean Central Valley on the grain aphid (Sitobion avenae) density, parasitism rate, and facultative endosymbionts in wheat fields during the growing season in the springs of 2017 and 2018. A significant effect on aphid density due to zones and maximum temperatures was detected; however, this depended on the zone and year analyzed. Changes between zones and seasons were observed for parasitism rates, while maximum temperatures only significantly affected the parasitism rate in 2017. The main parasitoid wasp found was Aphidius ervi in both zones and seasons. Regiella insecticola infected 95% of the samples in both zones, although it does not seem to have a protective role at the field level. Our findings suggest that, at present, global warming does not significantly affect the grain aphid outbreaks and their biological control in Chile. However, this study points out the importance of pre-emptive monitoring to detect aphids and the synchrony loss of their parasitoid wasps.
1. Introduction
Climate change (e.g., increased environmental temperature, increased atmospheric CO2, unstable climates, and altered frequency/intensity of extreme weather events) is the most serious concern for agriculture [1,2]. Global warming, characterized by increased and extreme temperatures that will become more frequent, affects crop yields, mainly through crop pest biology and distribution changes, especially in invasive pest species [3,4,5].
Aphids (Hemiptera: Aphididae) are a highly invasive pest species due to their broad phenotypic plasticity, which includes (a) their reproduction mode (see [6]), (b) the systematic development of insecticide resistance, (c) the development of defenses against plant chemistry and natural enemies, and (d) their symbiosis with obligate and facultative bacteria, which confer aphids with several relative advantages, including protection against natural enemies and heat tolerance [7,8]. A worldwide pest of cereals, the English grain aphid, Sitobion avenae (Fabricius) [9,10], originated from Europe and the Mediterranean zone and was introduced to Chile in the late 1960s, causing significant losses to cereal production [11]. Mild winters in Chile favored asexual reproduction all year round, allowing aphid populations to distribute rapidly and widely across most of the cereal production area [12]. Several Aphidiinae endoparasitoid species were introduced to Chile from different geographic origins during the late 1970s to cope with this pest as part of a governmental biocontrol program [13]. Hence, a parasitoid assemblage (i.e., the set of parasitoid species attacking aphids) has provided an essential contribution to the suppression of high population densities of cereal aphids in Chile to date, with minimal input from insecticides [14]. Indeed, Chile is considered one of the best examples of successful aphid biological control programs to combat the English grain aphid [15].
Global warming, however, threatens the dynamics, synchronization, and temporal and spatial structures of the interactions among pests and their natural enemies [16]. Global warming can potentially increase the frequency of bacterial endosymbionts that provide aphids with abiotic protective effects, such as heat tolerance, even further [17,18,19,20,21]. If their transmission and geographic distribution increase at higher temperatures, the success of the biological control program may be threatened [21,22,23,24].
Of particular concern are the maximum daily temperatures and frequency of warm events. These variables have the most critical effect on the life history traits of insect pests and biological control agents, making pest-derived problems likely to become more unpredictable [25,26,27]. The troubling fact is that Chile’s central valleys have shown one of the most striking increases in maximum temperatures in recent decades, which threatens to continue [28,29].
The monitoring of the temporal dynamics of interacting species in the agroecosystems is crucial to anticipate climate change effects on aphid outbreaks and biocontrol populations, especially those prone to global warming, highlighting the urgent need for these types of studies [16,30]. Hence, this study aimed to determine whether spatial and temporal variations in maximum temperatures modify the density of both S. avenae aphids and their parasitism rate in the field. We assessed the aphid density, parasitism rates, and frequency of facultative endosymbionts over two consecutive years throughout the wheat growing season, comparing the situation among field crops located in two areas—one with temperatures regulated by the Pacific Rim and the other with significant temperature increases in recent decades. We discuss the results in terms of management practices that ensure the continuity of the biological control of S. avenae.
2. Materials and Methods
2.1. Sampling Sites and Climates
Surveys were conducted in commercial insecticide-free spring wheat fields in two zones with contrasting climatic conditions (Figure 1) (Table S1, Supplementary Materials). Zone 1 is located close to the Pacific Rim and displays a coastal temperate Mediterranean climate, with rainfed wheat crops. Zone 2 is in the middle of the Chilean Central Valley, where a warmer Mediterranean temperate climate dominates, and wheat crops need periodic irrigation (four irrigation periods per season, occurring from September to December). The distance between fields in each zone ranged from 1.5 km to 19 km. Because of crop rotation, some wheat fields were different across the two years.
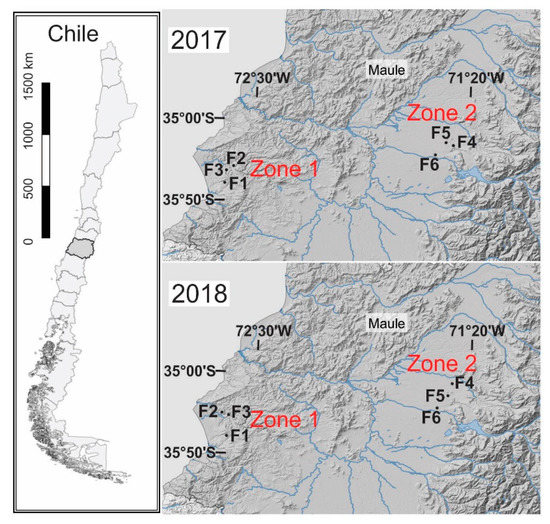
Figure 1.
Location of the sampled zones for 2017 and 2018. F1–F3 are the fields collected in Zone 1, and F4–F6 are fields collected in Zone 2 (Table S1).
Meteorological data were collected from the national agrometeorological network [31]. We selected wheat fields located close to a meteorological station to achieve more accurate environmental temperature measurements. Hence, one meteorological station was used per zone (two in total). Figure S1 shows the temperatures recorded on each sampling date. We computed the average annual temperatures from the last three years of data (2015–2018) to develop a clearer picture of the climatic differences between the studied zones. Thus, Zone 1′s temperatures ranged between 17.5 °C (max) and 7.8 °C (min) with 742 mm of rainfall, while Zone 2′s temperatures ranged between 21 °C (max) and 7.3 °C (min) with 668 mm of rainfall. Moreover, Zone 2 showed an alarming increase in its maximum temperature in recent decades [29,32].
Because both zones had similar average temperatures, we determined the number of >30 °C events and the average maximum temperatures (2015–2018) during the austral spring (September–December), which is the growing period for most wheat cultivars in Chile, as indicators. Zone 1 showed no days with temperatures >30 °C and an average maximum temperature of 17.5 °C, while Zone 2 showed 37 days with temperatures >30 °C and an average maximum temperature of 22.6 °C.
2.2. Aphids and Parasitoids Samplings
Three wheat fields were sampled in each zone. To standardize the sampling effort, we collected aphids and parasitized aphids (referred to as “mummies”) from a predefined area of 1 ha per field, avoiding borders (Table S1). Live aphids and mummies were collected every 14 days from the wheat tillering stage to the dough-ripening stage, from September to December (austral spring), for two consecutive years (2017 and 2018). We sampled the total population of aphids and mummies observed on 20 wheat tillers in five randomly selected sampling points in each field, separated by at least 3 m from the field border and 10 m from one another [33,34]. The leaves and ears of the tillers infected with aphids were clipped off and carefully transferred to modified Petri dishes with ventilation and sealed with Parafilm®.
All fields were sampled on the same day and repeated every two weeks to complete six sampling dates (T1–T6). Once in the laboratory, aphids and mummies were counted and identified following taxonomic keys [9]. Mummies were kept in Petri dishes until the emergence of wasps, and the parasitoids were identified using taxonomic keys [11]. Live aphids were kept in cages containing wheat seedlings (Triticum aestivum cultivar Pantera) for 15 days and checked for mummification every two days. New S. avenae mummies were removed from the seedlings and kept in Petri dishes for counting and identification.
We collected an additional sample of 10–30 adult S. avenae aphids during each sampling date (field, zone, and year). We collected aphids through a linear transect to limit the chances of sampling individuals that belonged to the same parthenogenetic colony (i.e., clonal lineages) by taking one single wingless individual every 10 m. All aphids from those samples were stored in Eppendorf tubes with 95% ethanol until bacterial endosymbiont screening (700 aphids in total) (Table S2).
2.3. Aphid Bacterial Endosymbionts
The total DNA from each stored aphid was extracted by the salting-out method [35]. We screened for the presence of the most frequent endosymbionts harbored by aphids (Hamiltonella defensa, Regiella insecticola, Serratia symbiotica, Fukatsuia symbiotica, Rickettsia sp., Ricketsiella sp., and Spiroplasma sp.) using a polymerase chain reaction based protocol (PCR) described previously [36,37]. The obligate endosymbiont, Buchnera aphidicola, was used as a positive control.
2.4. Data Analysis
All data were analyzed in the R software version 3.6.1. [38]. Differences in maximum temperatures were log-transformed and analyzed with a linear model.
To test the effect of every zone, year, and sampling date on S. avenae, parasitism rate, and facultative endosymbiont proportion, we used generalized linear mixed models (GLMMs).
The density of the English grain aphid S. avenae was analyzed as the number of individuals per 100 tillers in each field, with a Poisson distribution error. Due to the low number of emerged parasitoids in some fields and sampling dates, we did not perform statistical analysis for the composition of parasitoid species; therefore, data are only descriptive and were calculated as the proportion of each identified parasitoid species to the total of emerged parasitoids for every zone, year, and sampling date. The parasitism rate was calculated only for those fields with a frequency of S. avenae >6. Hence, the parasitism rate was calculated as the proportion of parasitized S. avenae individuals, i.e., the number of mummies found in 100 tillers/number of aphids plus the number of mummies found in 100 tillers [33] for every zone, year, and sampling date, and analyzed with a binomial distribution error. Changes in the density of S. avenae during the season were evaluated for every zone and year.
Because R. insecticola was the predominant facultative endosymbiont (except for a single aphid individual bearing a co-infection with R. insecticola and H. defensa), we calculated the proportion of infected aphids as the number of aphids carrying R. insecticola divided by the total number of individuals collected per year, zone, and sampling date (Table S2), analyzed with a binomial distribution error.
We used the year, zone, and sampling date (T1–T6) as fixed parameters and the field in each zone as a random factor. The effect of each factor was evaluated by type II Wald chi-squared tests [39]. Comparisons of each fixed factor for S. avenae, parasitism rate, and facultative endosymbiont proportion were performed with the R package multcomp [40]. Because maximum temperatures differed between zones and years, the effect of maximum temperature on S. avenae, parasitism rate, and facultative endosymbiont proportion was analyzed separately for every zone and year using a GLMM with the maximum temperature as a fixed factor and the field as a random factor.
3. Results
3.1. Registered Temperatures in the Field
Our results show that Zone 2 registered higher maximum temperatures than Zone 1 in both seasons across the sampling dates (2017: F (F-statistic) = 93.2, df = 1, p ≤ 0.001; 2018: F = 68.5, df = 1, p ≤ 0.001) (Figure S1). In 2017, Zone 1 displayed a maximum temperature range of 11.8–21.2 °C, with an average maximum temperature of 16.1 °C, while, in 2018, it displayed a range of 11.7–21.5 °C, with an average of 17.2 °C. No extreme maximum temperature events were recorded for either of the studied seasons (>30 °C). Zone 2 displayed a maximum temperature range of 11.6–31.1 °C in 2017 (with an average maximum temperature of 21.3 °C) and one single extreme high-temperature event (between T5 and T6), and 13.2–32.7 °C in 2018, with an average maximum temperature of 22 °C and two extreme high-temperature events (between T3–T4 and T5–T6). Data for the daily accumulated rainfall are provided in Figure S2.
3.2. Sitobion avenae Density
For the 2017 campaign, we collected 1305 aphids and mummies, from which 68.3% were identified as S. avenae. The S. avenae sample contained 192 mummies. For the 2018 campaign, we sampled 1128 aphids, 84.4% of which belonged to S. avenae, with 123 mummies (Table S2). We found a maximum of 109 S. avenae aphids per 100 wheat tillers (1.09 aphids per tiller on average).
When the effects of the zone, year, and sampling date on S. avenae density were tested, the results showed that S. avenae did not change significantly between the two years. However, the zone, the sampling date, and the interaction between the three factors had a significant impact (Table 1). The differences between zones were mainly due to the fact that there were significantly lower aphid densities in Zone 1 than Zone 2 (Table S2). In contrast, differences in zones by year were due to a decrease in the aphid population in Zone 1 from 2017 (n = 495) to 2018 (n = 343) (Table S2).

Table 1.
Type II Wald chi-squared tests for Sitobion avenae density, parasitism rate, and R. insecticola proportion.
Changes in the density of S. avenae during the season were analyzed separately for every zone and year. In 2017, a higher number of aphids was observed in Zone 1 at the beginning of the season (χ2 = 20.94, df = 5, p = 0.0008) (T1; Figure 2A). However, this effect was not observed in Zone 2 (χ2 = 6.08, df = 5, p = 0.30) (Figure 2B). In 2018, the density of S. avenae also changed throughout the season in Zone 1 (χ2 = 17.03, df = 5, p = 0.004), where a lower number of aphids was observed at T3 compared to T6 (Figure 2C). Similarly, the density of the S. avenae also changed throughout the season in Zone 2 (χ2 = 22.8, df = 5, p ≤ 0.01), with a marked decrease at T6 (Figure 2D).
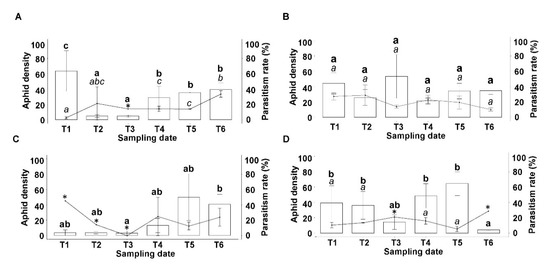
Figure 2.
Aphid density (Mean ± Standard error bars) and parasitism rate (Mean ± Standard error, lines) per 100 wheat tillers in three fields sampled during the sampling dates (All fields were sampled on the same day and repeated every two weeks to complete six sampling dates T1–T6) in (A) Zone 1 and (B) Zone 2 throughout 2017; and (C) Zone 1 and (D) Zone 2 throughout 2018. Different letters show significant differences at p < 0.05 (bold letters for aphid density and italic letters for parasitism rate). * Data were obtained from one field, and hence multiple comparisons were impossible to calculate.
Overall, data analyses showed no significant effect of maximum temperatures in 2017 for any zone (Zone 1: χ2 = 2.5244, df = 1, p = 0.112; Zone 2: χ2 = 0.5892, df = 1, p = 0.443) (Figure 3A,B). In 2018, maximum temperatures showed a significant effect on S. avenae density, but only in Zone 1 (Figure 3C) (Zone 1: χ2 = 8.2314, df = 1, p = 0.004; Zone 2: χ2 = 0.5532, df = 1, p = 0.457, Figure 3D), which indicates that the S. avenae density increased with the increase in maximum temperature (Figure 3).
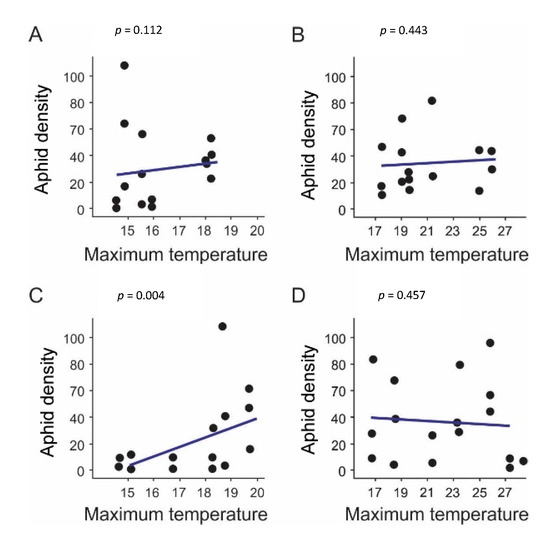
Figure 3.
Effect of maximum temperature on aphid density (number of S. avenae per 100 wheat tillers). (A) Zone 1 and (B) Zone 2 throughout 2017; and (C) Zone 1 and (D) Zone 2 throughout 2018. p indicates the p-value obtained from a generalized linear mixed model (GLMM).
3.3. Parasitoid Composition
Seven parasitoid species belonging to the Braconidae family were found. Six species belonged to the Aphidius genus (Aphidius ervi, A. uzbekistanicus, A. rhopalosiphi, A. avenae, A. matricariae, and A. colemani), and one unidentified species belonged to the Praon genus (Praon sp.). From a total of 203 emerged parasitoids, the A. ervi wasp was the most frequent (58.6%), followed by A. uzbekistanicus (12.3%), A. rhopalosiphi (11.8%), A. matricariae (6.9%), A. avenae (4.4%), A. colemani (3%), and Praon sp. (3%) (Table S2). Figure 4 shows the variation in the parasitoid composition throughout the season in 2017 (Figure 4A,B) and 2018 (Figure 4C,D).
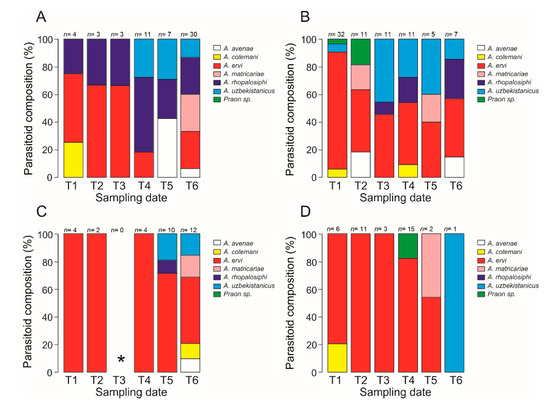
Figure 4.
Parasitoid species composition according to the sampling date (T1–T6). (A) Zone 1 and (B) Zone 2 throughout 2017; and (C) Zone 1 and (D) Zone 2 throughout 2018. n= total number of individuals emerged. * No mummies were found.
3.4. Parasitism Rate
The zone had no effect on the parasitism rate; however, the year parameter had a small but significant effect. The sampling date and the interactions among the three factors were also significant (Table 1). A significant increase in the parasitism rate was observed in Zone 1 from 2017 to 2018 (χ2 = 1948.2, df = 1, p ≤ 0.001; 17.19% and 20.65%, respectively), while the opposite occurred in Zone 2 (χ2 = 6.2623, df = 1, p = 0.012) (20.78% and 13.05%, respectively, for 2017 and 2018) (Table S2).
Changes in the parasitism rates at different sampling dates were analyzed separately for every zone and season. The sampling date showed a significant effect on the parasitism rate in 2017 for Zone 1 (χ2 = 43.57, df = 5, p ≤ 0.001), with most differences observed when T1 (which displays a lower parasitism rate) was compared with T4 and T6 (Figure 2A). In contrast, the parasitism rate did not change throughout the season in Zone 2 (χ2 = 7.91, df = 5, p = 0.16) (Figure 2B). In 2018, very low S. avenae densities were found in most of the fields belonging to Zone 1 (Table S2), making it impossible to collect enough data to calculate the effect of the sampling date on the parasitism rate in this season; therefore, we did not include comparisons for this season, but the data are still shown in Figure 2C.
No variation in the parasitism rate of S. avenae was detected throughout 2018 in Zone 2 (χ2 = 6.74, df = 5, p = 0.240). Because low aphid densities were detected at T3 and T6 in most of the fields in this zone, we did not calculate parasitism rates for these sampling dates (Figure 2D), and they were not included in the multiple comparisons.
The maximum temperature influenced the parasitism rate in both studied zones, but only in 2017 (Figure 5A,B) (2018: Zone 1: χ2 = 0.0054, df = 1, p = 0.94, Figure 5C; Zone 2: χ2 = 0.238, df = 1, p = 0.418, Figure 5D). In Zone 1, there was an increase in the parasitism rate as the maximum temperature increased (χ2 = 5445.2, df = 1, p ≤ 0.001) (Figure 5A), while the opposite trend was observed in Zone 2 (χ2 = 12.135, df = 1, p = 0.005) (Figure 5B).

Figure 5.
Effect of maximum temperature on parasitism rate in (A) Zone 1 and (B) Zone 2 throughout 2017; and (C) Zone 1 and (D) Zone 2 throughout 2018. p indicates the p-value obtained from GLMM.
3.5. Composition of Facultative Endosymbionts
Out of the seven facultative bacterial endosymbiont species screened, only R. insecticola and H. defensa were detected in both years and zones (Table S2). The bacteria R. insecticola was carried by 95% of the sampled aphids, mostly as single infections, while 4.9% of the aphids showed no infection. Co-infections with R. insecticola and H. defensa bacteria were observed in one individual, which was excluded from the analysis to avoid distortions. When the frequency of infections with R. insecticola was analyzed, no effects of the year, zone, or sampling date were detected (Table 1). The maximum temperatures had no effect on R. insecticola proportions in any zone and year (Zone 1, 2017: χ2 = 2.1, df = 1, p = 0.145; Zone 2, 2017: χ2 = 0.4, df = 1, p = 0.517; Zone 1, 2018: χ2 = 0.02, df = 1, p = 0.884 and Zone 2, 2018: χ2 = 0.003, df = 1, p = 0.952).
4. Discussion
Climate can shape species’ distribution and their interactions, and temperature is one of the most critical climatic factors. Changes in environmental temperatures may therefore impact the geographic distribution of pests and their biological control agents [41].
The effect of high temperatures has been broadly studied, mainly under laboratory-controlled conditions. The potential impact of daily maximum temperatures, however, has been poorly studied at the field level. Because the daily maximum temperature has increased rapidly in recent years and has been shown to have a more substantial effect on pest insects and their interacting species [42], it is a more realistic approach for evaluating global warming’s effects on biological control. Our study considered two zones with differences in their maximum temperatures, and we assessed the impact of these factors on the temporal densities of S. avenae and their parasitoids. Furthermore, we considered the frequency of infections with facultative endosymbionts in S. avenae, which are expected to have a role in the adaptive potential of aphids to face global warming and their interactions with parasitoids [42].
4.1. Factors Shaping Spatial and Temporal Sitobion avenae Populations
Our results show a clear difference in S. avenae densities between zones, with a higher aphid density in the warmer zone (Zone 2). Even if temperatures above 30 °C reduce the fecundity and extend the physiological development period of pests, reducing their population growth [43], an increase in temperature, as long as it does not exceed the thermal threshold of a given species, has been shown to have positive effects on aphid populations [44]. In S. avenae, significantly higher population growth is reported at 25 °C than at 15 °C [45]. Therefore, the temperatures recorded in Zone 2 seem to have a positive impact on S. avenae population numbers, which explains the higher density of S. avenae in that zone. It is important to note that Zone 2 also shows some extremely high-temperature events (>30 °C). However, they do not seem to have negatively affected S. avenae (Figure S1) because no decrease in S. avenae density was observed after these events. The frequency of extremely high temperature events can negatively impact aphid biology because aphids may not have enough time and resources to recover from the potential heat damage produced by these events [46]. For example, field experiments in China showed a decrease in S. avenae densitywhen the frequency of extreme temperatures (>30 °C) was artificially increased by 60% compared with natural conditions [27]. Intriguingly, in our study, maximum temperatures during the season only positively affect aphid density in Zone 1 for 2018 (from T4 to T6). As we previously described, Zone 1 is located close to the Pacific Ocean, within a coastal, temperate Mediterranean climate with strong oceanic regulation. The increases in maximum temperatures observed in 2018 did not exceed the thermal threshold of S. avenae [45], instead, having a positive effect on S. avenae density. No effect of maximum temperatures was detected in Zone 2, probably because the maximum temperatures recorded throughout the seasons under study were not extremely high but close to the optimal temperature that would allow for an S. avenae population increase.
Although our study was focused on the climate particularities of each zone, mainly temperatures, it is important to keep in mind other factors, which were not studied, that could also influence temporal variations in S. avenae density(i.e., host plant phenology, the effects of biological control agents, landscape, rainfall, etc.). Temporal changes in S. avenae densityamong sampling dates were detected for both zones and seasons. Our study considered zones with different climates and temperatures that could affect aphid performance and their host plants’ phenology [47]. In cereals, the highest peak of aphid density is usually observed at the milk-ripening stage [33], but the timing of this crop growth stage may vary according to the climate. Moreover, the synergy, additive, or antagonistic interaction of natural enemies, including parasitoids, predators, and pathogens (i.e., viruses, bacteria, and fungi) can decrease aphid density in fields and account for temporal variations in aphids throughout the season [48,49,50]. The complexity of the landscape could also impact aphid density because complex landscapes contain various grasses that could act as migration sources, thereby transferring aphids to wheat fields [51]. Zone 2 is characterized by a higher area of arable land than Zone 1; however, we did not find a lower aphid density in this zone, as expected. Hence, the landscape did not appear to be an important factor in explaining the S. avenae densities found in our results.
On the other hand, climate change and global warming favor drought in many areas worldwide [52], which may indirectly impact aphid density [53,54,55]. For instance, water deficits can increase the concentration of nitrogen and amino acid contents in the host plants of aphids, thus benefiting their growth and reproduction [56,57]. Moreover, water deficits can also decrease the parasitism rate by altering the parasitoid preference, thus impacting aphids’ biological control [58]. Since 2010, central Chile has faced a dramatic sequence of dry years, with deficits in rainfall between 25% and 45%, referred to as the “Mega Drought,” characterized by a few events of extreme precipitation followed by long periods with no rain [59]. Because Zone 2 has higher temperatures than Zone 1, this must mean that it bears the consequences of the drought of the last decade more significantly, thereby increasing the water deficit on plants, which could also account for the higher density of S. avenae in this zone.
4.2. Parasitoid Assemblage
Most parasitoid wasps collected in wheat fields belonged to the sub-family Aphidiinae, in which Aphidius ervi represented 82% of the whole sample. This observation agrees with previous reports showing that A. ervi and A. uzbekistanikus are the most common parasitoids attacking cereal aphids in Chile [50]. Interestingly, the parasitoid assemblage changed as the season progressed. While the most frequent parasitoid in both zones and seasons was A. ervi early in the season, other parasitoid species gained relevance later; nevertheless, these results must be interpreted with caution because very low numbers of parasitoids emerged at some sampling dates. Changes in population dynamics throughout the season seem to be a feature of the parasitoid assemblages that parasitize cereal aphids, as previously observed in various European countries [60,61,62]. The seasonal activities of some parasitoid species seem to match their thermal tolerances. Some studies [63,64] have reported that the thresholds for A. ervi from egg to mummy were 2.2 °C and 6.6 °C for mummy to adult development, respectively, while A. rhopalosiphi were 4.5 °C and 7.2 °C, and those for P. volucre were 3.8 °C and 5.5 °C, respectively. Early parasitization is critical in preventing aphid outbreaks [60,65]. A parasitoid able to develop at low temperatures could mean an earlier appearance in the field, which is essential for parasitizing aphids, as they start to multiply early. This feature does not appear to be affected by the climate conditions at present and may explain the early presence of A. ervi in wheat fields found in our study and the biocontrol of S. avenae in Chile. Nevertheless, permanent temporal and spatial studies similar to ours are needed to monitor the biological control status for this pest and others in the coming years, as we discuss below.
4.3. Spatial and Temporal Changes in Parasitism Rate
The demographic balance between aphids and parasitoid wasps is critical for the efficacy of biological control. Nevertheless, this balance can suffer from increased environmental temperatures due to phenological desynchronization between aphids and parasitoids, which disrupts their trophic relationships and ultimately contributes to aphid outbreaks [5,66].
Our results show that the parasitism rate varied between seasons and zones. Zone 1 showed a higher parasitism rate in 2018 than in 2017, while the opposite trend was observed in Zone 2. However, these results should be interpreted with caution since we had to remove data with a low number of aphids to avoid overestimating parasitism rates (Table S2). It has been reported that A. ervi shows a better parasitism rate at 25 °C than at 15 °C or 20 °C and the worst performance at 30 °C [67]. The rise in the maximum temperature from 2017 to 2018 in Zone 1 seemed to positively impact the parasitism rate because the colder zone (Zone 1) became a bit warmer (Figure S1). But this produced a contrasting effect in the warmer zone (Zone 2), where temperatures are continuing to rise to levels at which the performance of parasitoid wasps significantly decays [5,66,67]. It is well known that species at higher trophic levels, such as parasitoids, are highly susceptible to temperatures close to 30 °C [42,68]. Similar to those recorded for Zone 2 in 2018, high temperatures can decrease the parasitoid attack rate [69] and alter life-history traits, such as the developmental time and lifespan of parasitoids [41]. Hence, during the last decade in central Chile, global warming-related phenomena could be following a sustained and troubling trend [29], which explains the differences in the parasitism rates observed between zones and seasons in this study and alerts us to the outcomes of biological control programs in upcoming years. More monitoring is needed to test this hypothesis.
Intriguingly, the maximum temperatures recorded throughout the season only influenced the parasitism rate in 2017. Assessing the effect of temperature on the parasitism rate at the field level is challenging because a single species does not attack aphids, but an assemblage of parasitoid wasps. Several parasitoid species with different thermal tolerances can attack S. avenae aphids; therefore, the outcome of parasitism depends on each parasitoid species’ thermal tolerances. A more random parasitism rate was found in 2018 according to maximum temperatures and sampling dates (which were higher than those in 2017); this could mean that temperatures may affect each parasitoid species differently. For instance, the parasitoid wasp A. avenae is more tolerant of high temperatures, whereas A. rhopalosiphi is more susceptible [63], while A. ervi seems to tolerate low temperatures, but not temperatures over 30 °C [67,70]. Because A. ervi is the primary parasitoid attacking S. avenae in Chile, the predicted global warming could result in pernicious consequences for the biological control of S. avenae and wheat yields.
It is important to consider other factors that could impact parasitism rates, such as secondary parasitoids and predator attacks. Secondary parasitoids can cause a mortality rate of over 50% in parasitoid larvae [71], while predators can alter the parasitism rate by consuming parasitized aphids and adult wasps [72]. We only observed the appearance of secondary parasitoids at the last sampling date; hence, they probably did not impact our results significantly. On the other hand, predators were rarely observed during the samplings; however, their effect should not be entirely excluded.
4.4. Facultative Endosymbionts
Global warming can also affect the insect microbiome because increased temperatures have been shown to alter the composition of bacterial endosymbionts, which mediate aphid–parasitoid interactions [68,73].
All aphids carry an obligated bacterial endosymbiont, B. aphidicola, which provides aphids with essential amino acids and vitamins that they cannot obtain from plant sap [74]. Moreover, aphids can harbor various facultative endosymbionts that are non-essential but can confer relative advantages to aphids [75]. Facultative endosymbionts can increase thermal tolerance in aphids [18], broaden the host plant range [76], and offer protection against natural enemies (e.g., parasitoids and predators) [77,78,79]. Facultative endosymbionts are considered a significant phenotypic variation source, mainly in introduced aphid pest species, which are frequently characterized by asexual populations and reduced genetic diversities [7]. Hence, aphids can rapidly evolve in new environments and face global warming [42], which also has important implications for their interactions with their natural enemies [77,78,80,81,82]. In warmer and dryer areas, Chilean populations of S. avenae are typically infected with R. insecticola, as the most frequent endosymbiont in central Chile [14,37]. Our results show a high frequency (95%) of R. insecticola in all fields, zones, and on all dates sampled, supporting the previously reported high frequencies of this bacteria, regardless of the range of maximum temperatures recorded in the two studied zones. It is likely that, because of the differences in both zones’ temperatures, these temperatures are not sufficient to affect the facultative endosymbionts of S. avenae.
Increased temperatures can affect the frequency of infections with facultative endosymbionts. For instance, the rate of vertical transmission of R. insecticola indicates failure at >28 °C. However, when high temperatures are maintained for several generations, the transmission rate of R. insecticola is increased by up to 100%, showing that R. insecticola can improve aphid responses to heat [21]. Facultative endosymbionts providing environmental adaptations, such as tolerance to increased temperatures, could improve their prevalence quickly, which may increase and/or modify the distribution of aphids (e.g., in warmer climates) [18,83]. Whether the R. insecticola strain(s) found in our study provide aphids with heat tolerance should be tested under laboratory conditions. However, the high prevalence of strain(s) of R. insecticola in the field during the wheat growing season is an exciting observation, suggesting that there is no cost in relation to the fitness of S. avenae and no evidence of a strong selection against non-infected aphids.
5. Conclusions
Increases in the environmental temperatures can significantly improve aphid performance, positively impacting aphid population numbers [21]. Adverse effects on parasitoid wasps’ performance can disable biological control [68]. In classical biological control scenarios, when both the pest and its natural enemy are introduced species, they usually have reduced genetic diversity and limited evolvability due to the actions of evolutionary factors during their introduction in the form of founding effects, selection (e.g., insecticide applications, natural enemies, climate), and genetic drift (e.g., reduced population sizes) [12,84,85]. Therefore, environmental stability appears to be an essential factor that maintains the balance of population sizes threatened by global warming. It can alter the herbivores in natural and managed systems and change the interactions between aphids and their natural enemies [86].
Nevertheless, at present, the biological control of S. avenae by parasitoid wasps does not appear to be significantly affected in Chile since the densities of S. avenae are still below the threshold of economic damage (five aphids per tiller [87]). Furthermore, facultative endosymbionts such as R. insecticola do not appear to have any protective effect against parasitism at the field level [14]. However, noteworthily, the warmer year in our study produced lower parasitism rates in the warmer zone, which could already be an indicator of the effects of global warming. Our research presents the current situation regarding the biological control of the English grain aphid in Chile at the field level, which may be useful for future comparisons. Finally, we suggest that periodic monitoring should be carried out to assess the densities of aphids and their facultative endosymbionts, as well as parasitoids and the inclusion of other biotic (e.g., hyperparasitoid and predator population dynamics) and abiotic (e.g., landscape composition, rainfall, etc.) factors that shape aphid–parasitoid interactions.
Supplementary Materials
The following are available online at https://www.mdpi.com/article/10.3390/agriculture11040344/s1, Figure S1: Daily temperatures recorded for every zone and year throughout the season, Figure S2: Daily accumulated rainfall for every zone and year throughout the season, Table S1: Geographical coordinates and area of the wheat fields sampled in both studied zones and years, Table S2: Data obtained in 2017 and 2018 for every zone, year and field.
Author Contributions
Conceptualization, D.A.S., M.C.G.C. and C.C.F.; formal analysis, D.A.S. and G.B.; funding acquisition, D.A.S. and C.C.F.; investigation, D.A.S., G.B., M.C.G.C. and C.C.F.; Methodology, D.A.S., M.C.G.C. and C.C.F.; project administration, C.C.F.; resources, D.A.S. and C.C.F.; supervision, M.C.G.C., L.E.C. and C.C.F.; writing—original draft preparation, D.A.S., M.C.G.C. and C.C.F.; writing—review and editing, D.A.S., M.C.G.C., L.E.C. and C.C.F. All authors have read and agreed to the published version of the manuscript.
Funding
This study was funded by FONDECYT grant 1170943 to Christian C. Figueroa and the National Agency for Research and Development (ANID)/Scholarship Program/DOCTORADO NACIONAL-21161651 supported Daniela A. Sepúlveda. The funding agencies had no role in the study design, data collection, analysis, decision to publish, or manuscript preparation.
Institutional Review Board Statement
Not applicable.
Informed Consent Statement
Not applicable.
Data Availability Statement
The data presented in this study are available upon request from the corresponding author.
Acknowledgments
We thank Nicolás Álamos, Lucía Briones, Mauricio Mosqueda, Pablo Córdova, and Joseph Lademann for their valuable help during the fieldwork. We also thank Cinthya Villegas for helping with the parasitoid identification. The Instituto de Ciencias Biológicas at the University of Talca provided the pickup truck for the field sampling.
Conflicts of Interest
The authors declare no conflict of interest.
References
- Nelson, G.C.; Valin, H.; Sands, R.D.; Havlík, P.; Ahammad, H.; Deryng, D.; Elliott, J.; Fujimori, S.; Hasegaw, T.; Heyhoe, E.; et al. Climate change effects on agriculture: Economic responses to biophysical shocks. Proc. Natl. Acad. Sci. USA 2014, 111, 3274–3279. [Google Scholar] [CrossRef]
- Campbell, B.M.; Vermeulen, S.A.; Aggarwal, P.K.; Corner-Dolloff, C.; Girvetz, E.; Loboguerrero, A.M.; Ramirez-Villegas, J.; Rosentock, T.; Sebastian, L.; Thornton, P.K.; et al. Reducing risks to food security from climate change. Glob. Food Sec. 2016, 11, 34–43. [Google Scholar] [CrossRef]
- Ziska, L.H.; Blumenthal, D.M.; Runion, G.B.; Hunt, E.R.; Diaz-Soltero, H. Invasive species and climate change: An agronomic perspective. Clim. Chang. 2011, 105, 13–42. [Google Scholar] [CrossRef]
- Bebber, D.P. Range-Expanding Pests and Pathogens in a Warming World. Annu. Rev. Phytopathol. 2015, 53, 335–356. [Google Scholar] [CrossRef] [PubMed]
- Furlong, M.J.; Zalucki, M.P. Climate change and biological control: The consequences of increasing temperatures on host–parasitoid interactions. Curr. Opin. Insect Sci. 2017, 20, 39–44. [Google Scholar] [CrossRef] [PubMed]
- Simon, J.C.; Rispe, C.; Sunnucks, P. Ecology and evolution of sex in aphids. Trends Ecol. Evol. 2002, 17, 34–39. [Google Scholar] [CrossRef]
- Figueroa, C.C.; Fuentes-Contreras, E.; Molina-Montenegro, M.A.; Ramírez, C.C. Biological and genetic features of introduced aphid populations in agroecosystems. Curr. Opin. Insect Sci. 2018, 26, 63–68. [Google Scholar] [CrossRef]
- Simon, J.C.; Peccoud, J. Rapid evolution of aphid pests in agricultural environments. Curr. Opin. Insect Sci. 2018, 26, 17–24. [Google Scholar] [CrossRef]
- Blackman, R.L.; Eastop, V.F. Aphids on the World’s Crops: An Identification and Information Guide; John Wiley & Sons Ltd.: Chichester, UK, 2000. [Google Scholar]
- Dedryver, C.A.; Le Ralec, A.; Fabre, F. The conflicting relationships between aphids and men: A review of aphid damage and control strategies. Comptes Rendus Biol. 2010, 333, 539–553. [Google Scholar] [CrossRef]
- Starý, P. The Aphidiidae of Chile (Hymenoptera, Ichneumonoidea, Aphidiidae). Dtsch. Entomol. Z. 1995, 42, 113–138. [Google Scholar] [CrossRef]
- Figueroa, C.C.; Simon, J.-C.; Le Gallic, J.-F.; Prunier-Leterme, N.; Briones, L.M.; Dedryver, C.; Niemeyer, H.M. Genetic structure and clonal diversity of an introduced pest in Chile, the cereal aphid Sitobion avenae. Heredity 2005, 95, 24–33. [Google Scholar] [CrossRef]
- Starý, P.; Gerding, M.; Norambuena, H.; Remaudière, G. Environmental-Research on aphid parasitoid biocontrol agents in Chile (Hym, Aphidiidae, Hom, Aphidoidea). J. Appl. Entomol. 1993, 115, 292–306. [Google Scholar] [CrossRef]
- Zepeda-Paulo, F.; Villegas, C.; Lavandero, B. Host genotype-endosymbiont associations and their relationship with aphid parasitism at the field level. Ecol. Entomol. 2017, 42, 86–95. [Google Scholar] [CrossRef]
- Zuñiga, E.; Van den Boch, R.; Drea, J.; Gruber, F. The biological control project against the cereal aphids (Hom., Aphididae) in Chile. II. Exploration, importation and quarantine of predator and parasitoid species. Agric. Téc. 1986, 46, 479–487. [Google Scholar]
- Welch, K.D.; Harwood, J.D. Temporal dynamics of natural enemy-pest interactions in a changing environment. Biol. Control 2014, 75, 18–27. [Google Scholar] [CrossRef]
- Heyworth, E.R.; Smee, M.R.; Ferrari, J. Aphid Facultative Symbionts Aid Recovery of Their Obligate Symbiont and Their Host After Heat Stress. Front. Ecol. Evol. 2020, 8, 1–10. [Google Scholar] [CrossRef]
- Montllor, C.B.; Maxmen, A.; Purcell, A.H. Facultative bacterial endosymbionts benefit pea aphids Acyrthosiphon pisum under heat stress. Ecol. Entomol. 2002, 27, 189–195. [Google Scholar] [CrossRef]
- Heyworth, E.R.; Ferrari, J. Heat stress affects facultative symbiont-mediated protection from a parasitoid wasp. PLoS ONE 2016, 11, e0167180. [Google Scholar] [CrossRef] [PubMed]
- Doremus, M.R.; Smith, A.H.; Kim, K.L.; Holder, A.J.; Russell, J.A.; Oliver, K.M. Breakdown of a defensive symbiosis, but not endogenous defences, at elevated temperatures. Mol. Ecol. 2017, 27, 2138–2151. [Google Scholar] [CrossRef]
- Liu, X.D.; Lei, H.X.; Chen, F.F. Infection pattern and negative effects of a facultative endosymbiont on its insect host are environment-dependent. Sci. Rep. 2019, 9, 4013. [Google Scholar] [CrossRef]
- Bensadia, F.; Boudreault, S.; Guay, J.-F.; Michaud, D.; Cloutier, C. Aphid clonal resistance to a parasitoid fails under heat stress. J. Insect Physiol. 2006, 52, 146–157. [Google Scholar] [CrossRef]
- McLean, A.H.C.; Parker, B.J.; Hrcek, J.; Henry, L.M.; Godfray, H.C.J. Insect symbionts in food webs. Philos. Trans. R. Soc. B Biol. Sci. 2016, 371, 20150325. [Google Scholar] [CrossRef]
- Thierry, M.; Hrček, J.; Lewis, O.T. Mechanisms structuring host–parasitoid networks in a global warming context: A review. Ecol. Entomol. 2019, 44, 581–592. [Google Scholar] [CrossRef]
- Bannerman, J.A.; Roitberg, B.D. Impact of extreme and fluctuating temperatures on aphid-parasitoid dynamics. Oikos 2014, 123, 89–98. [Google Scholar] [CrossRef]
- Ma, G.; Hoffmann, A.A.; Ma, C.S. Daily temperature extremes play an important role in predicting thermal effects. J. Exp. Biol. 2015, 218, 2289–2296. [Google Scholar] [CrossRef] [PubMed]
- Ma, G.; Rudolf, V.H.W.; Ma, C.S. Extreme temperature events alter demographic rates, relative fitness, and community structure. Glob. Chang. Biol. 2015, 21, 1794–1808. [Google Scholar] [CrossRef]
- Falvey, M.; Garreaud, R.D. Regional cooling in a warming world: Recent temperature trends in the southeast Pacific and along the west coast of subtropical South America (1979–2006). J. Geophys. Res. Atmos. 2009, 114, D04102. [Google Scholar] [CrossRef]
- Piticar, A. Changes in agro-climatic indices related to temperature in Central Chile. Int. J. Biometeorol. 2019, 63, 499–510. [Google Scholar] [CrossRef] [PubMed]
- Macfadyen, S.; McDonald, G.; Hill, M.P. From species distributions to climate change adaptation: Knowledge gaps in managing invertebrate pests in broad-acre grain crops. Agric. Ecosyst. Environ. 2018, 253, 208–219. [Google Scholar] [CrossRef]
- INIA Agrometereología. Available online: https://agrometeorologia.cl/# (accessed on 3 March 2020).
- Araya-Osses, D.; Casanueva, A.; Román-Figueroa, C.; Uribe, J.M.; Paneque, M. Climate change projections of temperature and precipitation in Chile based on statistical downscaling. Clim. Dyn. 2020, 54, 4309–4330. [Google Scholar] [CrossRef]
- Gagic, V.; Hänke, S.; Thies, C.; Scherber, C.; Tomanovic, Z.; Tscharntke, T. Agricultural intensification and cereal aphid-parasitoid-hyperparasitoid food webs: Network complexity, temporal variability and parasitism rates. Oecologia 2012, 170, 1099–1109. [Google Scholar] [CrossRef]
- Yang, F.; Xu, L.; Wu, Y.K.; Wang, Q.; Yao, Z.W.; Žikić, V.; Tomanović, Ž.; Ferrer-Suay, M.; Selfa, J.; Pujade-Villar, J.; et al. Species composition and seasonal dynamics of aphid parasitoids and hyperparasitoids in wheat fields in northern China. Sci. Rep. 2017, 7, 1–9. [Google Scholar] [CrossRef]
- Sunnucks, P.; England, P.R.; Taylor, A.C.; Hales, D.F. Microsatellite and chromosome evolution of parthenogenetic sitobion aphids in Australia. Genetics 1996, 144, 747–756. [Google Scholar] [CrossRef] [PubMed]
- Peccoud, J.; Bonhomme, J.; Mahéo, F.; de la Huerta, M.; Cosson, O.; Simon, J.-C. Inheritance patterns of secondary symbionts during sexual reproduction of pea aphid biotypes. Insect Sci. 2013, 21, 291–300. [Google Scholar] [CrossRef] [PubMed]
- Sepúlveda, D.A.; Zepeda-Paulo, F.; Ramírez, C.C.; Lavandero, B.; Figueroa, C.C. Diversity, frequency, and geographic distribution of facultative bacterial endosymbionts in introduced aphid pests. Insect Sci. 2017, 24, 511–521. [Google Scholar] [CrossRef] [PubMed]
- R Development Core Team. R: A Language and Environment for Statistical Computing; R Foundation for Statistical Computing: Vienna, Austria, 2019. [Google Scholar]
- Fox, J.; Weisberg, S. An R Companion to Applied Regression, 3rd ed.; Sage: Thousand Oaks, CA, USA, 2019. [Google Scholar]
- Hothorn, T.; Bretz, F.; Westfall, P. Simultaneous inference in general parametric models. Biom. J. 2008, 50, 346–363. [Google Scholar] [CrossRef] [PubMed]
- Jeffs, C.T.; Lewis, O.T. Effects of climate warming on host-parasitoid interactions. Ecol. Entomol. 2013, 38, 209–218. [Google Scholar] [CrossRef]
- Ma, C.S.; Ma, G.; Pincebourde, S. Survive a Warming Climate: Insect Responses to Extreme High Temperatures. Annu. Rev. Entomol. 2021, 66, 163–184. [Google Scholar] [CrossRef]
- Jeffs, C.T.; Leather, S.R. Effects of extreme, fluctuating temperature events on life history traits of the grain aphid, Sitobion avenae. Entomol. Exp. Appl. 2014, 150, 240–249. [Google Scholar] [CrossRef]
- Han, P.; Becker, C.; Sentis, A.; Rostás, M.; Desneux, N.; Lavoir, A.V. Global change-driven modulation of bottom–up forces and cascading effects on biocontrol services. Curr. Opin. Insect Sci. 2019, 35, 27–33. [Google Scholar] [CrossRef]
- Asin, L.; Pons, X. Effect of high temperature on the growth and reproduction of corn aphids (homoptera: Aphididae) and implications for their population dynamics on the Northeastern Iberian Peninsula. Environ. Entomol. 2001, 30, 1127–1134. [Google Scholar] [CrossRef]
- Sentis, A.; Hemptinne, J.L.; Brodeur, J. Effects of simulated heat waves on an experimental plant-herbivore-predator food chain. Glob. Chang. Biol. 2013, 19, 833–842. [Google Scholar] [CrossRef] [PubMed]
- Ciss, M.; Parisey, N.; Fournier, G.; Taupin, P.; Dedryver, C.A.; Pierre, J.S. Response of insect relative growth rate to temperature and host-plant phenology: Estimation and validation from field data. PLoS ONE 2014, 9, e86825. [Google Scholar] [CrossRef] [PubMed]
- Roy, H.E.; Pell, J.K. Interactions between entomopathogenic fungi and other natural enemies: Implications for biological control. Biocontrol Sci. Technol. 2000, 10, 737–752. [Google Scholar] [CrossRef]
- Ramsden, M.; Menendez, R.; Leather, S.; Wäckers, F. Do natural enemies really make a difference? Field scale impacts of parasitoid wasps and hoverfly larvae on cereal aphid populations. Agric. For. Entomol. 2017, 19, 139–145. [Google Scholar] [CrossRef]
- Ortiz-Martínez, S.A.; Lavandero, B. The effect of landscape context on the biological control of Sitobion avenae: Temporal partitioning response of natural enemy guilds. J. Pest Sci. 2018, 91, 41–53. [Google Scholar] [CrossRef]
- Yang, L.; Liu, B.; Zhang, Q.; Zeng, Y.; Pan, Y.; Li, M.; Lu, Y. Landscape structure alters the abundance and species composition of early-season aphid populations in wheat fields. Agric. Ecosyst. Environ. 2019, 269, 167–173. [Google Scholar] [CrossRef]
- Spinoni, J.; Naumann, G.; Carrao, H.; Barbosa, P.; Vogt, J. World drought frequency, duration, and severity for 1951–2010. Int. J. Climatol. 2014, 34, 2792–2804. [Google Scholar] [CrossRef]
- Aslam, T.J.; Johnson, S.N.; Karley, A.J. Plant-mediated effects of drought on aphid population structure and parasitoid attack. J. Appl. Entomol. 2013, 137, 136–145. [Google Scholar] [CrossRef]
- Romo, C.M.; Tylianakis, J.M. Elevated Temperature and Drought Interact to Reduce Parasitoid Effectiveness in Suppressing Hosts. PLoS ONE 2013, 8, e58136. [Google Scholar] [CrossRef]
- Beetge, L.; Krüger, K. Drought and heat waves associated with climate change affect performance of the potato aphid Macrosiphum euphorbiae. Sci. Rep. 2019, 9, 1–9. [Google Scholar] [CrossRef]
- Mattson, W.J.; Haack, R.A. The role of drought in outbreaks of plant-eating insects. Bioscience 1987, 37, 110–118. [Google Scholar] [CrossRef]
- Cui, H.; Wang, L.; Reddy, G.V.P.; Zhao, Z. Mild Drought Facilitates the Increase in Wheat Aphid Abundance by Changing Host Metabolism. Ann. Entomol. Soc. Am. 2020, 1–5. [Google Scholar]
- Tariq, M.; Wright, D.J.; Bruce, T.J.A.; Staley, J.T. Drought and Root Herbivory Interact to Alter the Response of Above-Ground Parasitoids to Aphid Infested Plants and Associated Plant Volatile Signals. PLoS ONE 2013, 8, e069013. [Google Scholar]
- Garreaud, R.D.; Boisier, J.P.; Rondanelli, R.; Montecinos, A.; Sepúlveda, H.H.; Veloso-Aguila, D. The Central Chile Mega Drought (2010–2018): A climate dynamics perspective. Int. J. Climatol. 2020, 40, 421–439. [Google Scholar] [CrossRef]
- Sigsgaard, L. A survey of aphids and aphid parasitoids in cereal fields in Denmark, and the parasitoids’ role in biological control. J. Appl. Entomol. 2002, 126, 101–107. [Google Scholar] [CrossRef]
- Andrade, T.O.; Outreman, Y.; Krespi, L.; Plantegenest, M.; Vialatte, A.; Gauffre, B.; Van Baaren, J. Spatiotemporal variations in aphid-parasitoid relative abundance patterns and food webs in agricultural ecosystems. Ecosphere 2015, 6, Art113. [Google Scholar] [CrossRef]
- Eoche-Bosy, D.; Outreman, Y.; Oliveira Andrade, T.; Krespi, L.; van Baaren, J. Seasonal variations of host resources influence foraging strategy in parasitoids. Entomol. Exp. Appl. 2016, 161, 11–19. [Google Scholar] [CrossRef]
- Le Lann, C.; Roux, O.; Serain, N.; Van Alphen, J.J.M.; Vernon, P.; Van Baaren, J. Thermal tolerance of sympatric hymenopteran parasitoid species: Does it match seasonal activity? Physiol. Entomol. 2011, 36, 21–28. [Google Scholar] [CrossRef]
- Sigsgaard, L. The temperature-dependent duration of development and parasitism of three cereal aphid parasitoids, Aphidius ervi, A. rhopalosiphi, and Praon volucre. Entomol. Exp. Appl. 2000, 95, 173–184. [Google Scholar] [CrossRef]
- Tomanović, Ž.; Kavallieratos, N.G.; Starý, P.; Petrović-Obradović, O.; Athanassiou, C.G.; Stanisa Vljević, L.Ž. Cereal aphids (Hemiptera: Aphidoidea) in Serbia: Seasonal dynamics and natural enemies. Eur. J. Entomol. 2008, 105, 495–501. [Google Scholar] [CrossRef]
- Harvey, J.A.; Heinen, R.; Gols, R.; Thakur, M.P. Climate change-mediated temperature extremes and insects: From outbreaks to breakdowns. Glob. Chang. Biol. 2020, 26, 6685–6701. [Google Scholar] [CrossRef]
- Malina, R.; Praslička, J. Effect of temperature on the developmental rate, longevity and parasitism of Aphidius ervi haliday (Hymenoptera: Aphidiidae). Plant Prot. Sci. 2008, 44, 19–24. [Google Scholar] [CrossRef]
- Flores-Mejia, S.; Guay, J.F.; Fournier, V.; Cloutier, C. The influence of a parasitoid’s response to temperature on the performance of a tri-trophic food web. Ecol. Entomol. 2016, 41, 431–441. [Google Scholar] [CrossRef]
- Le Lann, C.; Lodi, M.; Ellers, J. Thermal change alters the outcome of behavioural interactions between antagonistic partners. Ecol. Entomol. 2014, 39, 578–588. [Google Scholar] [CrossRef]
- Ismail, M.; Van Baaren, J.; Hance, T.; Pierre, J.S.; Vernon, P. Stress intensity and fitness in the parasitoid Aphidius ervi (Hymenoptera: Braconidae): Temperature below the development threshold combined with a fluctuating thermal regime is a must. Ecol. Entomol. 2013, 38, 355–363. [Google Scholar] [CrossRef]
- Mackauer, A.M.; Völkl, W.; Url, S. Regulation of Aphid Populations by Aphidiid Wasps: Does Parasitoid Foraging Behaviour or Hyperparasitism Limit Impact? Oecologia 1993, 94, 339–350. [Google Scholar] [CrossRef]
- Traugott, M.; Bell, J.R.; Raso, L.; Sint, D.; Symondson, W.O.C. Generalist predators disrupt parasitoid aphid control by direct and coincidental intraguild predation. Bull. Entomol. Res. 2012, 102, 239–247. [Google Scholar] [CrossRef] [PubMed]
- Feldhaar, H. Bacterial symbionts as mediators of ecologically important traits of insect hosts. Ecol. Entomol. 2011, 36, 533–543. [Google Scholar] [CrossRef]
- Baumann, P. Biology bacteriocyte-associated endosymbionts of plant sap-sucking insects. Annu. Rev. Microbiol. 2005, 59, 155–189. [Google Scholar] [CrossRef]
- Oliver, K.M.; Degnan, P.H.; Burke, G.R.; Moran, N.A. Facultative symbionts in aphids and the horizontal transfer of ecologically important traits. Annu. Rev. Entomol. 2010, 55, 247–266. [Google Scholar] [CrossRef]
- Tsuchida, T.; Koga, R.; Fukatsu, T. Host plant specialization governed by facultative symbiont. Science 2004, 303, 1989. [Google Scholar] [CrossRef]
- Oliver, K.M.; Russell, J.A.; Moran, N.A.; Hunter, M.S. Facultative bacterial symbionts in aphids confer resistance to parasitic wasps. Proc. Natl. Acad. Sci. USA 2003, 100, 1803–1807. [Google Scholar] [CrossRef]
- Vorburger, C.; Gehrer, L.; Rodriguez, P.; Douglas, A.E.; Ferrari, J.; Müller, C.B.; Kraaijeveld, A.R.; Godfray, H.C.J.; Ferrari, J.; Darby, A.C.; et al. A strain of the bacterial symbiont Regiella insecticola protects aphids against parasitoids. Biol. Lett. 2010, 6, 109–111. [Google Scholar] [CrossRef] [PubMed]
- Łukasik, P.; van Asch, M.; Guo, H.; Ferrari, J.; Godfray, H.C.J. Unrelated facultative endosymbionts protect aphids against a fungal pathogen. Ecol. Lett. 2013, 16, 214–218. [Google Scholar] [CrossRef] [PubMed]
- Oliver, K.M.; Degnan, P.H.; Hunter, M.S.; Moran, N.A. Bacteriophages encode factors required for protection in a symbiotic mutualism. Science 2009, 325, 992–994. [Google Scholar] [CrossRef] [PubMed]
- Degnan, P.H.; Moran, N.A. Diverse phage-encoded toxins in a protective insect endosymbiont. Appl. Environ. Microbiol. 2008, 74, 6782–6791. [Google Scholar] [CrossRef] [PubMed]
- Hansen, A.K.; Vorburger, C.; Moran, N.A. Genomic basis of endosymbiont-conferred protection against an insect parasitoid. Genome Res. 2012, 22, 106–114. [Google Scholar] [CrossRef]
- Chen, D.Q.; Purcell, A.H. Occurrence and transmission of facultative endosymbionts in aphids. Curr. Microbiol. 1997, 34, 220–225. [Google Scholar] [CrossRef]
- Sakai, A.K.; Allendorf, F.W.; Holt, J.S.; Lodge, D.M.; Molofsky, J.; With, K.A.; Baughman, S.; Cabin, R.J.; Cohen, J.E.; Ellstrand, N.C.; et al. The population biology of invasive species. Annu. Rev. Ecol. Syst. 2001, 32, 305–332. [Google Scholar] [CrossRef]
- Zepeda-Paulo, F.; Dion, E.; Lavandero, B.; Mahéo, F.; Outreman, Y.; Simon, J.C.; Figueroa, C.C. Signatures of genetic bottleneck and differentiation after the introduction of an exotic parasitoid for classical biological control. Biol. Invasions 2016, 18, 565–581. [Google Scholar] [CrossRef]
- Harmon, J.P.; Moran, N.A.; Ives, A.R. Species Response to Environmental Change: Impacts of Food Web Interactions and Evolution. Science 2009, 323, 1347–1350. [Google Scholar] [CrossRef] [PubMed]
- Giller, P.S.; Ryan, B.; Kennedy, T.; Connery, J. Aphid-parasitoid interactions in a winter cereal crop: Field trials involving insecticide application. J. Appl. Entomol. 1995, 119, 233–239. [Google Scholar] [CrossRef]
Publisher’s Note: MDPI stays neutral with regard to jurisdictional claims in published maps and institutional affiliations. |
© 2021 by the authors. Licensee MDPI, Basel, Switzerland. This article is an open access article distributed under the terms and conditions of the Creative Commons Attribution (CC BY) license (https://creativecommons.org/licenses/by/4.0/).