Article

Prediction of Reproductive Success in Multiparous First Service Dairy Cows by Parameters from In-Line Sensors

by
Ramūnas Antanaitis
1,*,
Vida Juozaitienė
2,
Dovilė Malašauskienė
1,
Mindaugas Televičius
1,
Mingaudas Urbutis
1,
Gintaras Zamokas
3 and
Walter Baumgartner
4
1
Large Animal Clinic, Veterinary Academy, Lithuanian University of Health Sciences, Tilžės str 18, LT-47181 Kaunas, Lithuania
2
Department of Animal Breeding, Veterinary Academy, Lithuanian University of Health Sciences, Tilžės str 18, LT-47181 Kaunas, Lithuania
3
Dr. Leonas Kriaučeliūnas Small Animal Clinic, Veterinary Academy, Lithuanian University of Health Sciences, Tilžės str 18, LT-47181 Kaunas, Lithuania
4
University Clinic for Ruminants, University of Veterinary Medicine, Veterinaerplatz 1, A-1210 Vienna, Austria
*
Author to whom correspondence should be addressed.
Agriculture 2021, 11(4), 334; https://doi.org/10.3390/agriculture11040334
Submission received: 21 February 2021 / Revised: 5 April 2021 / Accepted: 6 April 2021 / Published: 8 April 2021
(This article belongs to the Special Issue Digital Innovations in Agriculture)

Abstract

:
The aim of the current study was to evaluate the relationship of different parameters from an automatic milking system (AMS) with the pregnancy status of multiparous cows at first service and to assess the accuracy of such a follow-up with regard to blood parameters. Before the insemination of cows, blood samples for measuring biochemical indices were taken from the coccygeal vessels and the concentrations of blood serum albumin (ALB), cortisol, non-esterified fatty acids (NEFA) and the activities of aspartate aminotransferase (AST) and gamma glutamyltransferase (GGT) were determined. From oestrus day to seven days after oestrus, the following parameters were registered: milk yield (MY), electric milk conductivity, lactate dehydrogenase (LDH) and β-hydroxybutyric acid (BHB). The pregnancy status was evaluated using ultrasound “Easy scan” 30–35 days after insemination. Cows were grouped by reproductive status: PG− (non-pregnant; n = 48) and PG+ (pregnant; n = 44). The BHB level in PG− cows was 1.2 times higher (p < 0.005). The electrical conductivity of milk was statistically significantly higher in all quarters of PG− cows (1.07 times) than of PG+ cows (p < 0.05). The arithmetic mean of blood GGT was 1.61 times higher in PG− cows and the NEFA value 1.23 times higher (p < 0.05) compared with the PG+ group. The liver function was affected, the average ALB of PG− cows was 1.19 times lower (p < 0.05) and the AST activity was 1.16 times lower (p < 0.05) compared with PG+ cows. The non-pregnant group had a negative energy balance demonstrated by high in-line milk BHB and high blood NEFA concentrations. We found a greater number of cows with cortisol >0.0.75 mg/dL in the non-pregnant group. A higher milk electrical conductivity in the non-pregnant cows pointed towards a greater risk of mastitis while higher GGT activities together with lower albumin concentrations indicated that the cows were more affected by oxidative stress.

1. Introduction

As milk production per cow has increased, fertility in dairy cows has decreased. This can be explained by genetics, physiology, nutrition and management issues and these variables have been examined at the animal, organ and cellular level at critical time points during the production life of dairy cows [1]. An increased adoption of technologies will enable farmers to have access to rich data sources that can aid in further improving animal health and welfare [2].
The system “Herd Navigator” (Lattec I/S, Hillerød, Denmark), according to Yu and Maeda [3], works autonomously and delivers real-time physiological information about lactating cows and at the same time also helps with farm management decisions. This system alerts and advises dairy farmers of each cow’s condition and health. The system contains unique biological models that consider measured parameters, cow information and additional risk factors to keep the herd healthy. In this way, it prevents costly treatments and large production losses. Significant improvement results on reproduction, mastitis and ketosis have been proven on the farms that are running the system [3]. The use of Herd Navigator technology enhances our understanding of the factors influencing the modern milk cow’s reproductive physiology and informed decision-making can enhance fertility in dairy cows. In addition to helping with reproductive management decisions, Herd Navigator generated data offers a new opportunity to evaluate luteal activity parameters [4]. Inferior cattle performance can be monitored on a real-time basis with Herd Navigator and factors that lead to ketosis and reproductive management can be recognized and corrected to increase farm performance [5]. Although it requires a considerable investment during the installation stage, which would be costly for small farms, the tool is profitable for large farms compared with the frequent manual collection of progesterone information [6]. Additional assays augmented by the analyzer (urea nitrogen, lactate dehydrogenase and β-hydroxybutyrate) can be used in real-time to classify metabolic diseases and animal mastitis for more detailed monitoring [7]. According to Yu and Maeda [3], an in-line Herd Navigator system automatically provides real-time physiological information on lactating dairy cows for farm management decisions. This is not only a new tool for scientific research but also may enhance production, food safety, animal wellbeing and the environment. According to our past study, we found that the real-time measured β-hydroxybutyrate levels and changes in their dynamics correlated with different reproductive statuses, productivity and number of lactations [8]. Previous results highlighted that lactate dehydrogenase changes in the automatic milking system (AMS) indicators of cows may be considered an additional tool for improving reproductive management in dairy herds but further research-based studies are necessary before a practical application [9]. The Herd Navigator system has led to promising preliminary results but further work is required to validate it [2]. The aim of this study was to determine the prediction of reproductive success in multiparous first service dairy cows by parameters from in-line sensors and blood metabolic profiles. We hypothesized that in-line measurements could be predictive of the fertility status in dairy cows. To test our hypothesis, we investigated the relationship between the AMS and blood biochemical parameters with cow reproductive success.

2. Materials and Methods

2.1. Location and Animals

The research was conducted during the period from 1 February to 30 October in 2019 (272 days). The experiment was carried out on a commercial dairy farm (in total around 1300 cows) located in the southern part of Lithuania (54.9753923° N, 23.7662303° E). A total of 92 Lithuanian Holstein cows were selected based on the following criteria: having had two or more lactations (2.9 ± 0.13 lactation), from 60–90 (on average 78 ± 6) days in milk (DIM) and being clinically healthy. The cows were kept in a free housing system, milked with 15 DeLaval milking robots (DeLaval Inc. Tumba, Sweden) (average number of milkings per day = 3.5) and were fed a total mixed ration (TMR) two times per day at a set time, balanced according to their physiological requirements. The TMR was composed of 25% corn silage, 15% grass silage, 4% grass hay and 50% grain concentrate. The main nutritional characteristics were dry matter (DM) (%) 48.8%, neutral detergent fiber (% of DM) 28.2% DM, acid detergent fiber (% of DM) 19.8% DM, non-fiber carbohydrates (% of DM) 38.7% DM and crude protein (% of DM) 15.8% DM; the net energy for lactation (Mcal/kg DM) was 1.6. The feed ration was composed to fit the requirements of a 550 kg Holstein cow producing on average 35 kg/day of milk (during the experiment). The average of the body condition score in a 5-point scale was 2.70 (±0.15). Oestrus was identified when a cow exhibited one or more of the following signs: progesterone alarm (registered by the Herd Navigator system), an increase on the walking activity of cows (registered by the AMS), mucosal discharge, restlessness, vigilance, tail lift, the occlusion of the vulvar mucosa and a strong uterine tone by clinical examination. Twelve hours after the onset of oestrus, the cows were inseminated. The pregnancy status was evaluated using ultrasound “Easy scan” (IVM imaging, Scotland) 30–35 days after insemination. Cows were grouped by reproductive status: PG− (non-pregnant; n = 48) and PG+ (pregnant; n = 44).
Welfare and Protection of the Republic of Lithuania (study approval number PK016965).

2.2. Measurements

From oestrus day to seven days after oestrus, the following parameters from the AMS were registered: milk yield (MY), electric milk conductivity (EC) front right (FR), front left (FL), back left (BL), back right (BR), lactate dehydrogenase (LDH), β-hydroxybutyric acid (BHB) and blood parameters: albumin (ALB), aspartate aminotransferase (AST), gamma glutamyltransferase (GGT), blood cortisol concentration and non-esterified fatty acids (NEFA) (Table 1).
The research was carried out in accordance with the provisions of the Law on Animal.
The blood samples were collected using an evacuated tube without an anticoagulant (BD Vacutainer®, Eysin, Switzerland). The blood samples were centrifuged at 3500 RPM for 10–15 min. Samples were delivered to the Large Animal Clinic’s Laboratory of Clinical Tests at the Lithuanian University of Health Sciences Veterinary Academy. The obtained blood serum was examined using the Hitachi 705 analyzer (Hitachi, Tokyo, Japan)) and DiaSys reagents (Diagnostic Systems GmbH, Berlin, Germany) to determine the concentrations of blood serum albumin (ALB) and the activities of aspartate aminotransferase (AST) and gamma glutamyltransferase (GGT). The blood cortisol concentration levels were determined with automated immunoassay analyzer AIA-360 (Tosoh Bioscience, USA) using the fluorescence enzyme immunoassay method. The samples for NEFA were analyzed using an automated wet chemistry analyzer (Rx Daytona, Randox Laboratories Ltd., London, UK) using reagents from Rx Daytona (Randox Laboratories Ltd., London, UK).
An automated real-time analyzer, Herd Navigator, was used in combination with a DeLaval milking robot for milk BHB and LDH detection (DeLaval Inc, Tumba, Sweden). An in-line sampler in the milking robot automatically took a representative sample of several milliliters of milk from an individual cow during milking and determined the concentration of those parameters. In the Herd Navigator system, the LDH activity and BHB values were measured using dry stick technology. The raw measurements were corrected according to company-determined methods to account for variations in the surrounding humidity and differences between sets of dry sticks. The most extreme outliers were then taken out of the equation. Measurements exceeding 200 µmol/min per liter were set to a 200 maximum value and all negative values were removed because they did not comply with the usual range of measurements obtained from the Herd Navigator system. This editing of data is usual for data from the Herd Navigator system.

2.3. Data Analysis and Statistics

The statistical analysis of the AMS and Herd Navigator variables was carried out using SPSS 25.0 software (IBM Corp, released 2017, IBM SPSS Statistics for Windows, Version 25.0. Armonk, NY, USA: IBM Corp.). The data (according to a Shapiro–Wilk test) were normally distributed. The results were expressed as a standard error of the mean of a sample (M and SEM). Data of parameters from in-line sensors were tested for significance (p < 0.05) using the repeated measures analysis. A general linear model was used to evaluate the differences between groups (PG− and PG+) of cows and variables with repeated (seven days) measurements (MY, FL, FR, BL, BR, LDH, BHB and cortisol, ALB, AST, GGT, NEFA). The difference in times of the variables with repeated measurements was tested using a Bonferroni post-hoc test.
The relationship between the level of indicators of the metabolic blood profile, the AMS variables and the group of cows according to their reproductive status was determined using the chi-squared (χ2) statistic. A multivariable binary logistic regression technique was carried out using pregnancy as the dependent variable (where 1 denoted pregnancy and 0 denoted absence) to investigate the relationship between the predicted variable and variables from the AMS and the blood metabolic profile indicators of cows. The predictors for logistic regression were considered class variables in the analyses. The values of ALB were classified: <21 g/L, 21–36 g/L and > 36 g/L [10], AST: <78 U/L and 78–132 U/L [10], GGT: <8.11 U/L and 8.11–27.79 U/L [11] and NEFA: <0.320 mmol/L and ≥0.320 mmol/L [12]. The cortisol of cows was recorded as < 0.45 mg/dL, 0.47–0.75 mg/dL and > 0.0.75 mg/dL [10]. The values of milk LDH were grouped as being ≤ 25 µmol/min or > 25 µmol/min, MY ≤ 44 kg/d and >44 kg/d, BHB < 0.06 mmol/L and >0.06 mmol/L and were classified on the basis of the arithmetic mean. Based on the average of all udder quarters, cows were divided into three EC levels: (1) EC = 3.5–3.9 mS/cm, (2) EC = 4.0–4.4 mS/cm and (3) EC = 4.5–5.0 mS/cm [13]. For each cow, we calculated the difference in udder quarters EC (DifEC) between the maximum and minimum EC values. With this in mind, we grouped the cow data into classes: DifEC < 0.5 mS/cm and DifEC ≥ 0.5 mS/cm. The factors that contributed to the possibility of pregnancy were analyzed with multivariable logistic regression models by applying a backward stepwise logistic model to eliminate all non-significant explanatory variables. The results of the logistic regression are presented in terms of the odds ratio (OR) and its 95% confidence interval (PI), which indicates a 95% probability that the true OR is likely to be within the specified range.

3. Results

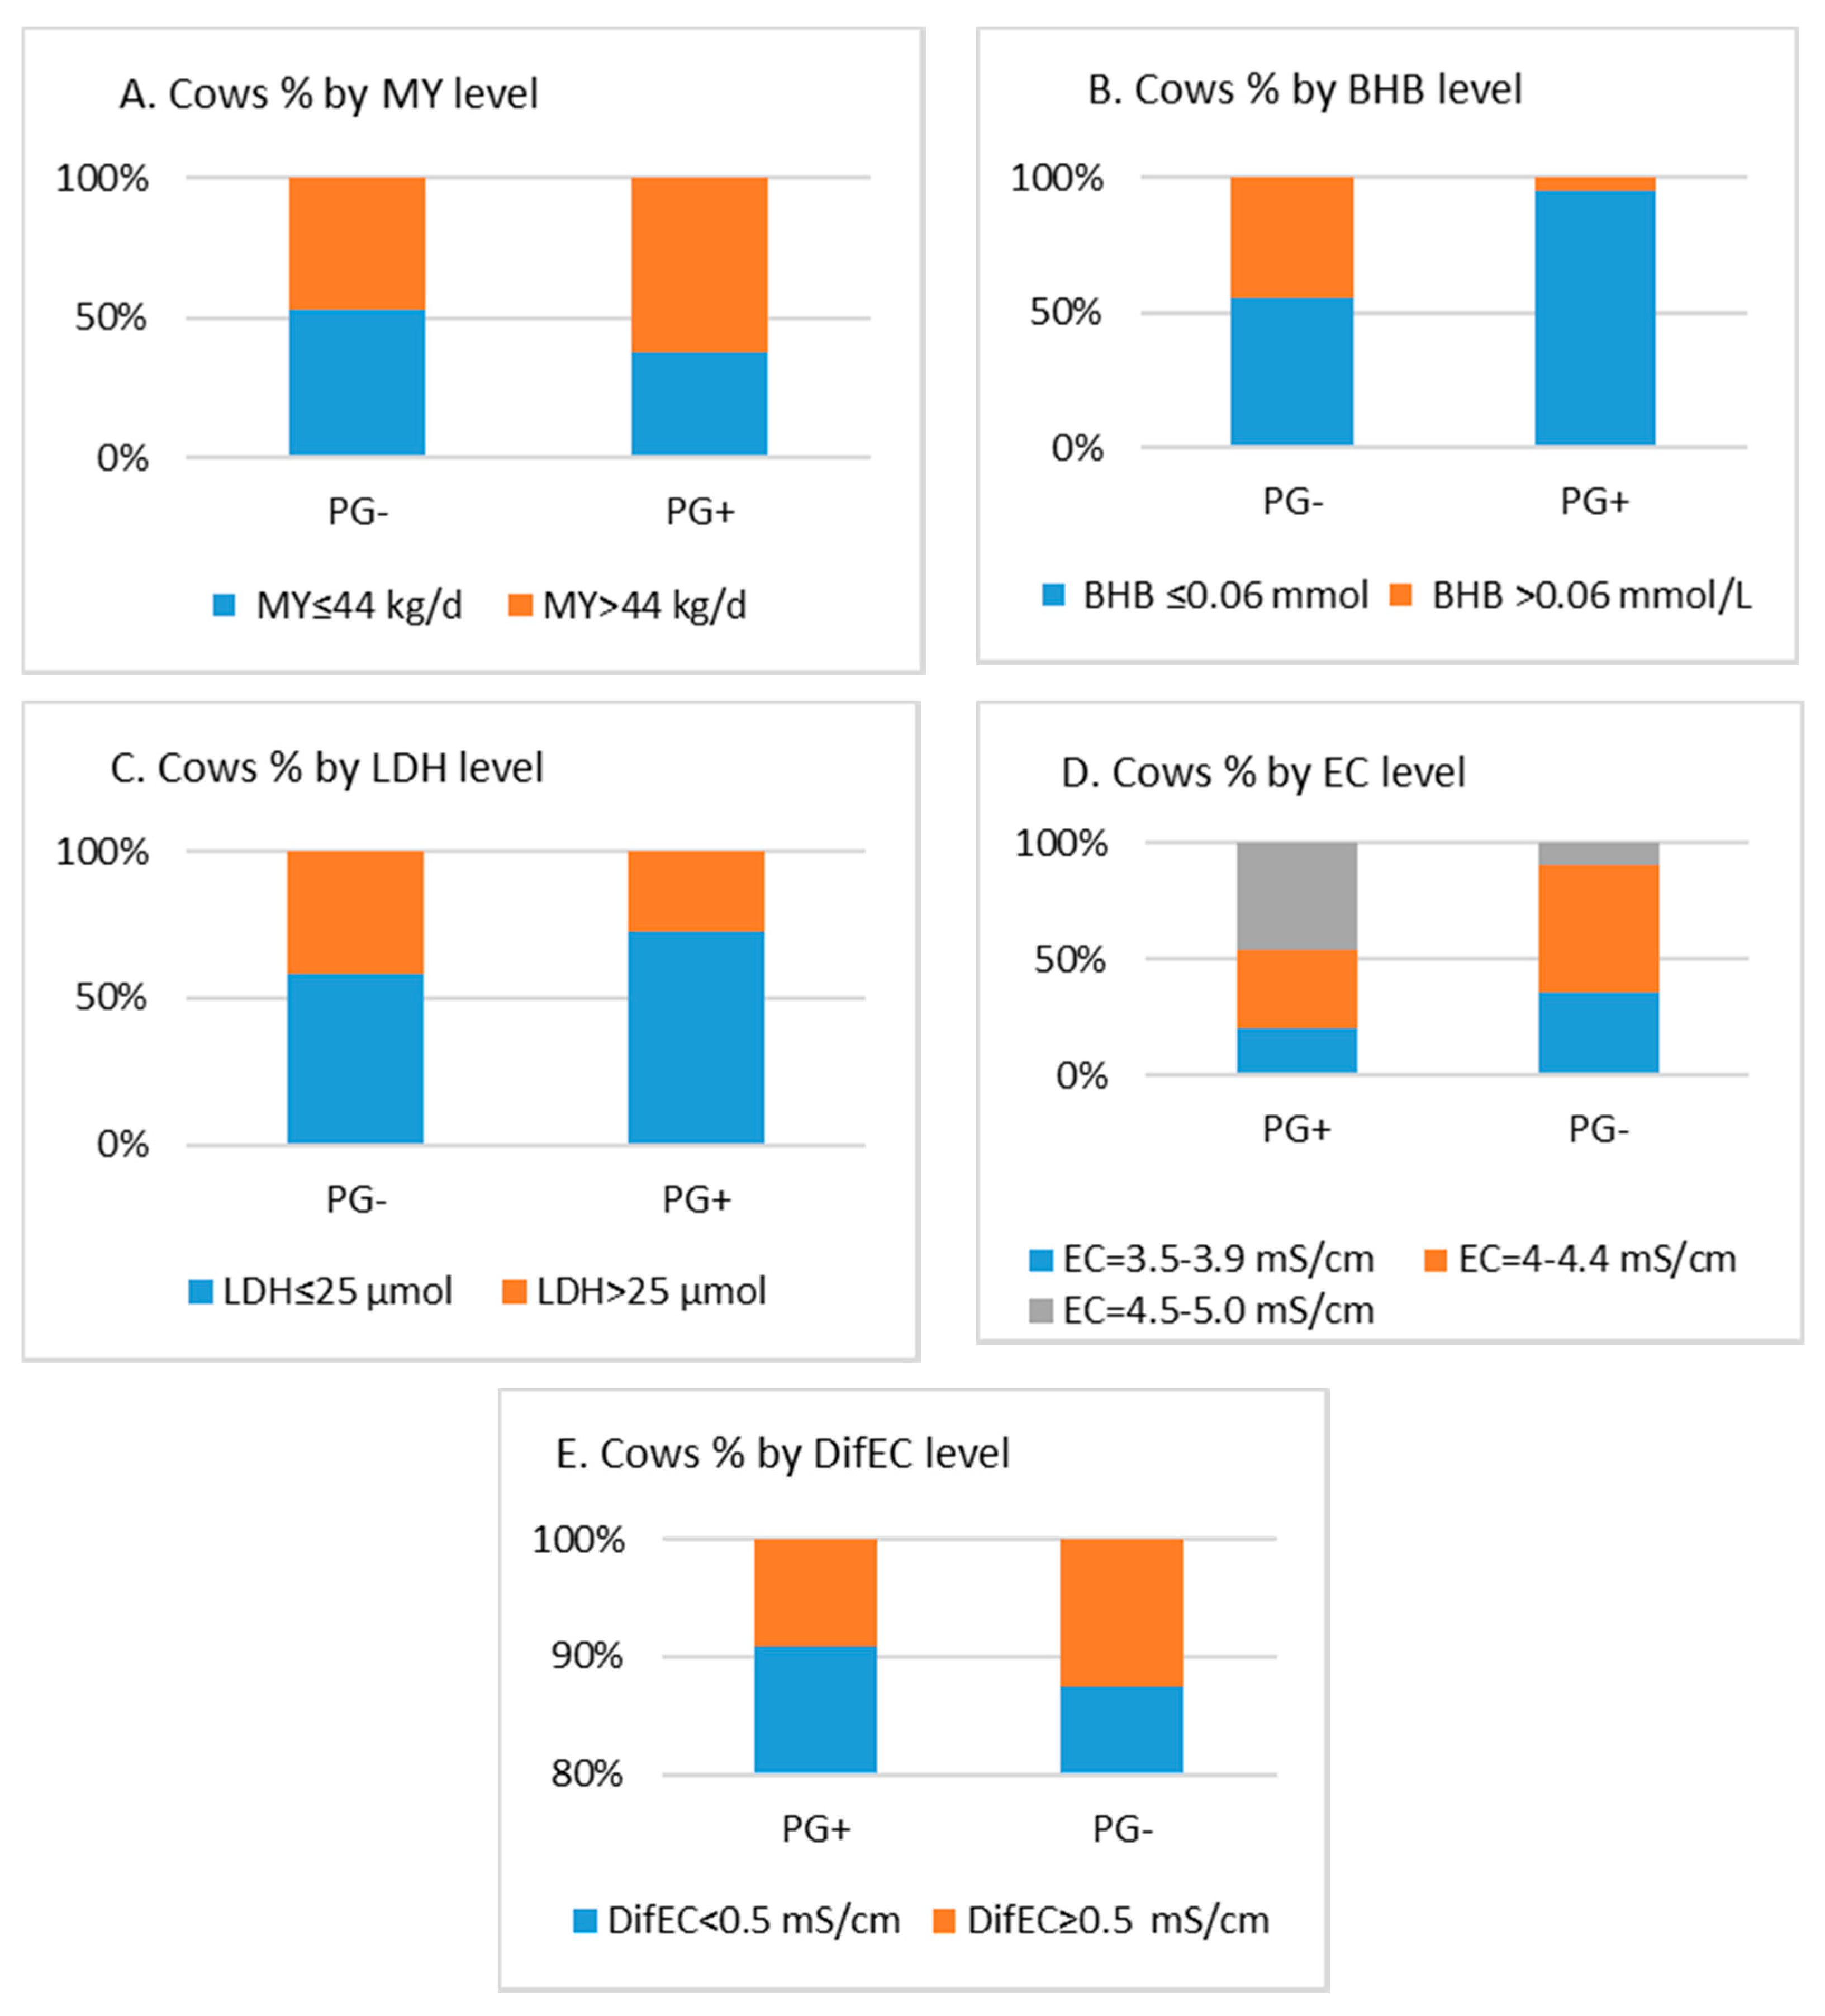
3.1. Relation of Cows’ Pregnancy Success with Automatic Milking System (AMS) Parameters

The analysis revealed a statistically significant relationship of changes of the AMS parameters on the pregnancy success of cows (Table 2). The BHB level in PG− cows was 1.2 times higher (p = 0.003). The electrical conductivity of milk was statistically significantly higher in all quarters of PG− cows (1.06–1.07 times) than that of PG+ cows (p < 0.05). Although LDH was 1.28 times higher in the PG− group, the difference with the PG+ group was not statistically significant.

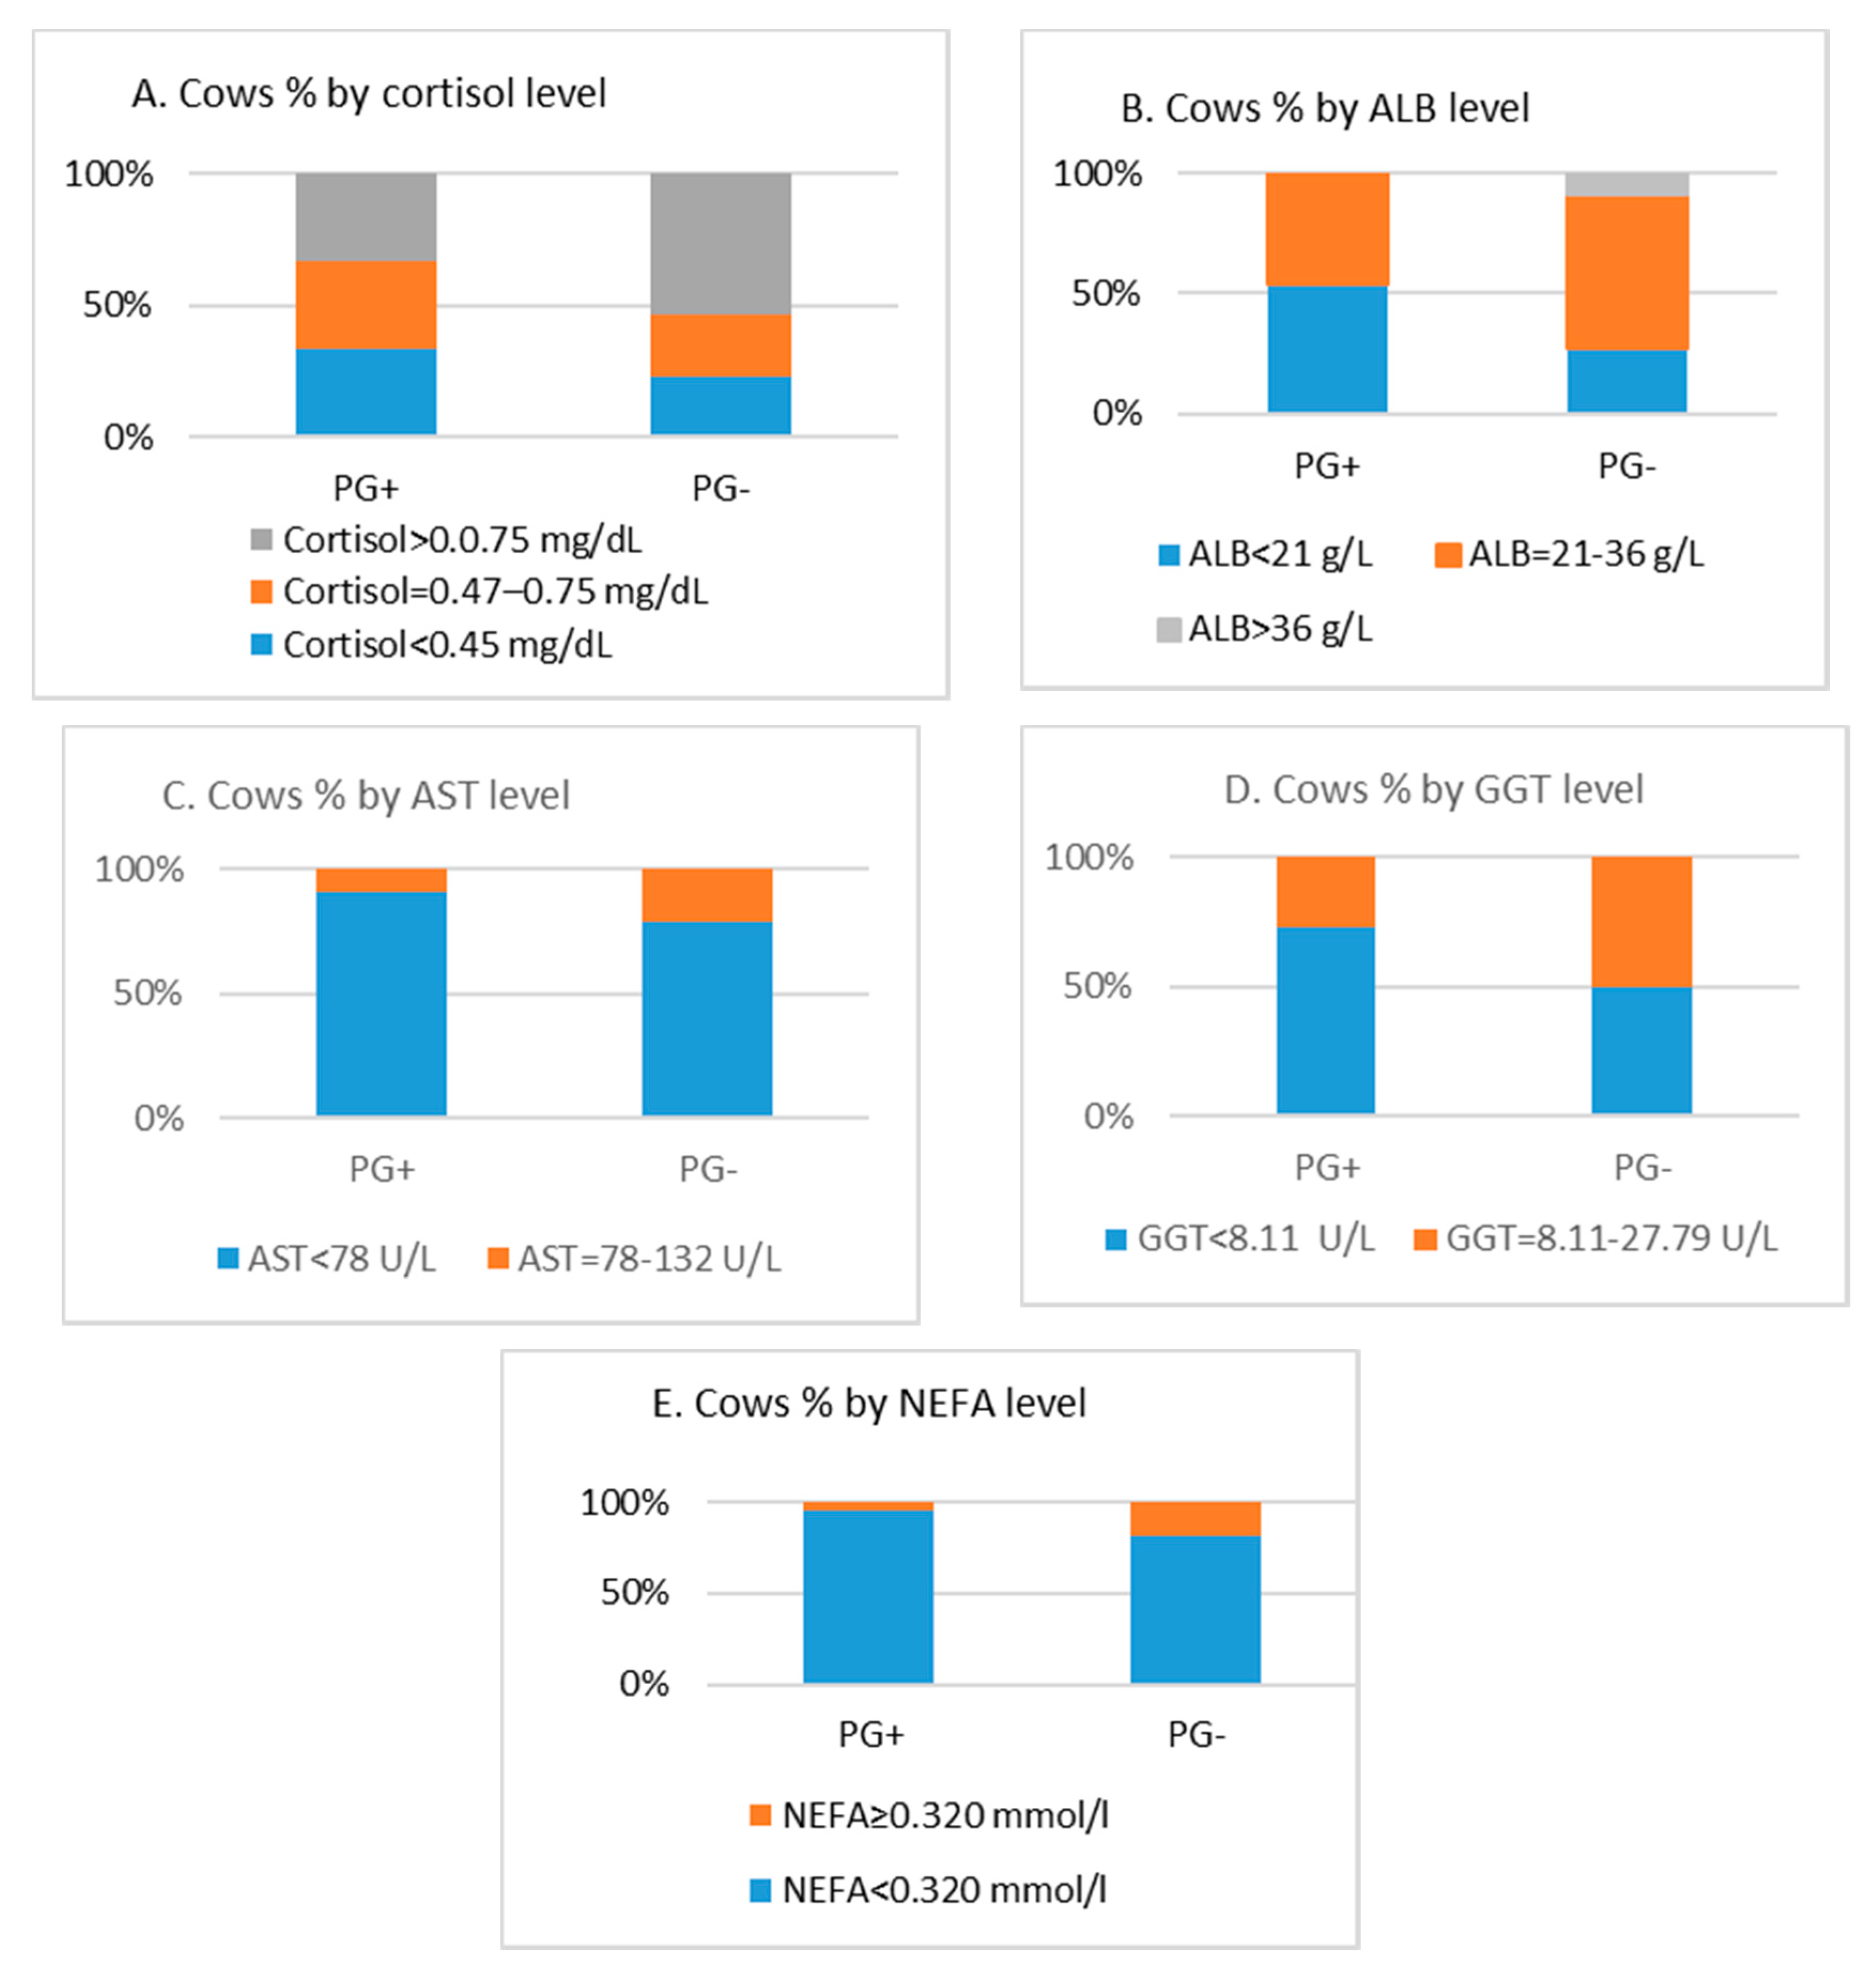
3.2. Relation Between Cows’ Pregnancy Success and Biochemical Parameters in Serum

The arithmetic mean of blood GGT activity was 1.61 times higher in PG− cows compared with the PG+ group (p = 0.017). The NEFA value was 1.23 times higher compared with PG+ cows (p = 0.049). On the other hand, the average ALB level of PG− cows was 1.19 times lower (p = 0.017) and the AST activity was1.15 times lower (p = 0.048). The average cortisol value was 1.66 times lower in PG+ cows but this difference was not statistically significant (Table 3).

3.3. The Relationship of Cow Pregnancy with Milk and Blood Parameters

There were 1.7-fold more cows with cortisol > 0.0.75 mg/dL in the PG− group compared with the PG+ group but also 1.7-fold fewer cows with cortisol < 0.45 mg/dL (Figure 1A). PG+ cows tended to have higher blood ALB levels compared with the PG− group (p = 0.008). Cows with ALB < 21 g/L accounted for 27.3% in the PG+ group (there were 2.1 times fewer in the PG− group). The recommended ALB level was set for a 1.3 times higher number of cows in the PG+ group compared with the PG− group. On the other hand, 9.1% of cows with ALB > 36 g/L were found in the PG+ group while there were no such cows in the PG− group (Figure 1B). There were 1.2 times more cows with AST < 78 U/L (p = 0.117) in the PG+ group compared with the PG− group. The chi-squared independence test (Figure 1), in which a question was asked about the relationship between the pregnancy of cows and the level of AST, did not show a statistically significant relationship (Figure 1C). PG+ cows tended to have a lower GGT (Figure 1D). If there were 50% of such cows in the PG− group, then in the PG+ group there were twice as many. There were four times more cows with NEFA > 0.320 mmol/L (p = 0.031) in the PG− group compared with the PG+ group (Figure 1E).
When analyzing the dependence of cow pregnancy success and studied milk indicators (Figure 2), a statistically significant relationship was found only with milk BHB and EC (p < 0.001). The number of cows with BHB ≤ 0.06 mmol in the PG+ group was 2.6 times higher than in the PG− group (Figure 2B). The analysis showed that relatively low EC levels in milk (3.5–5.0 mS/cm) were found in the studied cows (Figure 2B). The PG+ group had a 1.6-fold higher number of cows (p < 0.001) with a low EC (3.5–3.9 mS/cm) compared with the PG− group. In the PG− group, more (1.4–1.5-fold) cows were found with a larger EC difference between udder quarters in milk (Figure 2E) and also a larger MY (Figure 2A).
A multivariable logistic regression analysis showed that cows with a higher ALB activity in the blood were less likely (OR = 4.230; 95% CI = 1.635–10.946, p = 0.003) to become pregnant (p = 0.049). We also found that at relatively low EC levels in milk, cows were more likely to become pregnant (OR = 4.230; 95% CI = 1.635–10.946, p = 0.01) when their milk ECs were higher and met recommended levels [14].

4. Discussion

We found that in-line milk BHB levels in non-pregnant multiparous dairy cows at first service was 1.2 times higher than in pregnant cows. Animals with an elevated blood BHB had lower pregnancy success at first artificial insemination than healthy cows [3]. However, a decrease of pregnancy success within 70 days post-voluntary waiting period was reported by Ospina et al. [14]. Moreover, a greater number of inseminations per pregnancy (2.8 vs. 2.0, respectively), a lower peak activity (35% less activity), a shorter activity at oestrus (14% less hours) and a longer interval from calving to first observed oestrus also prolonged days open for multiparous cows in cows with ketosis than in healthy cows [15]. The mean predicted blood BHB of cows with ketosis was higher in early [16] lactation but decreased rapidly with the stage of lactation toward the level found in more healthy cows [8]. Subsequent studies revealed that there was an association between excessive negative energy balance (NEB) and decreased reproductive performance [17] According to the milk BHB results we can state that non-pregnant cows had a higher risk of ketosis.
According to our results, the in-line electrical milk conductivity of non-pregnant cows was 1.06–1.07 higher. Norberg et al. [18] aimed to evaluate the accuracy of electric milk conductivity (EMC) for predicting infection status; it also has some potential in terms of detecting mastitis. EMCs are parameters for the detection of mastitis in dairy farms equipped with in-line sensors [19]. During mammary tissue inflammation, the osmotic balance is maintained by an increase of Na+ and Cl−; in particular, Na+ derived from the highly Na+ concentrated extracellular environment is the main ion responsible for the increase of the electrical conductivity [20]. Based on that, we can suspect that non-pregnant cows have a greater risk of mastitis.
Our results of the blood biochemical parameters of non-pregnant cows showed that the GGT activities and NEFA values were higher and the albumin concentration was lower. We found that pregnant cows tended to have a higher blood albumin concentration. In dairy cows in the puerperium, a certain degree of fatty liver is noticed, which leads to the dysfunction of organs, releasing the enzymes of hepatocytes. Thus, the GGT activity in the blood increases significantly [21]. The strong association between NEFA concentrations and reproductive performance is likely because of the more direct physiological relationship between NEFA concentrations and a NEB [22]. The concentration of NEFA increases because of lipolysis, which is positively stimulated by glucagon [23]. According to Yang et al. [24], increased serum GGT may be a marker of oxidative stress, which is strongly associated with hypertension, dyslipidemia and an abnormal glucose tolerance. Albumin can be considered to be a negative acute-phase protein [25] with subnormal concentrations indicating an impaired liver function following a diverted synthesis to positive acute-phase proteins [26]. A low level of serum albumin may be associated with hepatocyte dysfunction, fat infiltration, degeneration and damage to liver tissue [27]. Albumins are also negative acute-phase proteins and their low serum levels can be found in various acute or chronic inflammations [28]. In the cows tested, slightly reduced serum albumin levels may have been caused by testing and a slightly reduced feed intake, which only confirmed the need to monitor the internal homeostasis of high-yielding animals [29].
Considering the data of our study, the AST was significantly lower in PG− compared with PG+ but the GGT activity was higher. This can be explained as the AST acts as a non-specific liver enzyme and is not inevitably accompanied by liver damage but often appears in connection with puerperal disorders. Increased AST activities were also measured shortly before and after normal parturition in cows and can be explained by the caruncle transformation and their degradation. Higher levels of AST enzymes were also recorded with a higher rate of muscle cell damage caused by the mobilization of body reserves [22].
Our results described in this study showed that the non-pregnant group had a negative energy balance demonstrated by high in-line milk BHB and high blood NEFA concentrations. Several studies have reported that a NEB as measured by NEFA or BHB has a strong association with reproductive performance. NEFA and BHB have a detrimental effect on reproductive performance [8]. In the early postpartum period, dairy cows resynthesize fat and muscle to support lactation and this in turn alters the blood metabolic and hormone profiles, which affects milk yield and fertility [16].
In our study we found a greater number of cows with cortisol > 0.0.75 mg/dL in the non-pregnant group. According to Burnett et al. [30] chronic and acute stress can trigger disruptions in reproductive function. Chronic stress is linked to disruptions in the pulsatile pattern of gonadotropin-releasing hormone (GnRH) and the consequent impairment of estrous behavior expression [31]. Stressors such as isolation, transport and restraint (acute causes) have been found to interfere with the endocrine events preceding ovulation and thus results in ovulation failure [32].
According to our results we found a positive correlation between LDH and milk EC at udder quarter level and BHB. In the AMS, the sensors that measure electrical conductivity are the most commonly used to detect mastitis. These sensors can continuously measure the concentration of ions in milk during the milk harvesting process, albeit with variable results [33]. Although lactate dehydrogenase testing at present is only commercially available in Herd Navigator, it is currently used for the automatic detection of mastitis [34]. According to Khatun et al. [33] LDH activity was strongly associated with mastitis. Subclinical ketosis is a risk factor for subsequent diseases and has been associated with mastitis. It has been demonstrated that BHB concentrations exceeding thresholds of 1.1 and 1.6 mmol/L are associated with a decreased probability of pregnancy and an increased culling risk, respectively [35]. According to our results we found that the Herd Navigator system does not just take a role as a novel tool for scientific research but could also be used in managing cow reproduction from a practical point. An in-line system automatically provides real-time physiological information for farm management decisions [3]. We confirmed the hypothesis that that in-line measurements could be predictive of the fertility status in dairy cows. By monitoring in-line parameters from the Herd Navigator such as BHB and EMC we could predict reproductive success in multiparous first service dairy cows. Our results suggest paying attention to non-pregnant cows having a higher risk of a negative energy balance and mastitis greatly affected by oxidative stress.

5. Conclusions

According to the results of the current study, we can conclude that the prediction of reproductive success in multiparous first service dairy cows by parameters from in-line sensors can be achieved through in-line biomarkers such as BHB and EMC. BHB levels were 1.2 times higher and electrical milk conductivity was 1.06–1.07 times higher in non-pregnant cows compared with pregnant cows. We also found that cows in the non-pregnant group had a negative energy balance indicated by high milk BHB and high blood NEFA concentrations. Higher milk EMC in the non-pregnant cows pointed towards a greater risk of mastitis while higher GGT activities together with lower albumin concentrations indicated that the cows were more affected by oxidative stress. More cows with a higher cortisol concentration in the non-pregnant cow group indicated the negative impact of stress on pregnancy success.

Author Contributions

R.A.—overall research study process including literature search, carrying out research experiments and compiling the final manuscript. The entire process was revised by the co-authors. V.J.—assisted in designing and setting up field data collection activities and developed the software and algorithm for data analysis. D.M. and M.T.—aided in fieldwork set up, data collection and sampling of the experimental animals. M.U. and G.Z.—design of the field experiment and data collection. W.B.—major support in processing of data in the study. All authors have read and agreed to the published version of the manuscript.

Funding

This research received no external funding.

Institutional Review Board Statement

The study was conducted according to the guidelines of the Declaration of Helsinki, and ap-proved by Ethics Committee (The study approval number is PK016965, 6 June 2017).

Informed Consent Statement

Informed consent was obtained from all subjects involved in the study.

Data Availability Statement

The data presented in this study are available within the article.

Conflicts of Interest

The authors declare no conflict of interest.

References

  1. Walsh, S.W.; Williams, E.J.; Evans, A.C.O. A review of the causes of poor fertility in high milk producing dairy cows. Animal Reprod. Sci. 2011, 123, 127–138. [Google Scholar] [CrossRef] [PubMed]
  2. Barkema, H.W.; Von Keyserlingk, M.A.; Kastelic, J.P.; Lam, T.J.; Luby, C.; Roy, J.P.; LeBlanc, S.J.; Keefe, G.P.; Kelton, D.F. Invited review: Changes in the dairy industry affecting dairy cattle health and welfare. J. Dairy Sci. 2015, 98, 7426–7445. [Google Scholar] [CrossRef] [PubMed] [Green Version]
  3. Yu, G.M.; Maeda, T. Inline progesterone monitoring in the dairy industry. Trends Biotechnol. 2017, 35, 579–582. [Google Scholar] [CrossRef]
  4. Larson, S.F.; Butler, W.R.; Currie, W.B. Reduced fertility associated with low progesterone postbreeding and increased milk urea nitrogen in lactating cows. J. Dairy Sci. 1997, 80, 1288–1295. [Google Scholar] [CrossRef]
  5. Blom, J.Y.; Christensen, J.M.; Ridder, C. Real-time analyses of BHB in milk can monitor ketosis and its impact on reproduction in dairy cows. In Precision Livestock Farming Applications: Making Sense of Sensors to Support Farm Management; Wageningen Academic Publishers: Wageningen, The Netherlands, 2015; pp. 2788–2796. [Google Scholar]
  6. Nyman, S.; Johansson, K.; de Koning, D.J.; Berry, D.P.; Veerkamp, R.F.; Wall, E.; Berglund, B. Genetic analysis of atypical progesterone profiles in Holstein-Friesian cows from experimental research herds. J. Dairy Sci. 2014, 97, 7230–7239. [Google Scholar] [CrossRef] [Green Version]
  7. Saint-Dizier, M.; Chastant-Maillard, S. Methods and on-farm devices to predict calving time in cattle. Vet. J. 2015, 205, 349–356. [Google Scholar] [CrossRef]
  8. Antanaitis, R.; Juozaitienė, V.; Televičius, M.; Malašauskienė, D. Changes in the real-time registration of milk β-hydroxybutyrate according to stage and lactation number, milk yield, and status of reproduction in dairy cows. Pol. J. Vet. Sci. 2018, 21, 763–768. [Google Scholar]
  9. Antanaitis, R.; Malašauskienė, D.; Televičius, M.; Juozaitienė, V.; Rutkauskas, A.; Palubinskas, G. Inline changes in lactate dehydrogenase, milk concentration according to the stage and number of lactation periods, including the status of reproduction and milk yield in dairy cows. Pol. J. Vet. Sci. 2020, 23, 153–156. [Google Scholar]
  10. Jackson, P.G.G.; Cockcroft, P.D. Clinical Examination of Farm Animals; Copyright© Blackwell Science Ltd.: Oxford, UK, 2002. [Google Scholar]
  11. Stojević, Z.; Piršljin, J.; Milinković-Tur, S.; Zdelar-Tuk, M.; Ljubić, B.B. Activities of AST, ALT and GGT in clinically healthy dairy cows during lactation and in the dry period. Veterinarski Arhiv 2005, 75, 67–73. [Google Scholar]
  12. Petrera, F.; Napolitano, F.; Dal Prà, A.; Abeni, F. Plasma parameters related to energy and lipid metabolism in periparturient M odenese and Italian Friesian cows. J. Animal Physiol. Animal Nutr. 2015, 99, 962–973. [Google Scholar] [CrossRef] [PubMed]
  13. Hillerton, J.E.; Walton, A.W. Identification of subclinical mastitis with a hand-held electrical conductivity meter. Vet. Record 1991, 128, 513–515. [Google Scholar] [CrossRef]
  14. Ospina, P.A.; Nydam, D.V.; Stokol, T.; Overton, T.R. Associations of elevated nonesterified fatty acids and β-hydroxybutyrate concentrations with early lactation reproductive performance and milk production in transition dairy cattle in the northeastern United States. J. Dairy Sci. 2010, 93, 1596–1603. [Google Scholar] [CrossRef] [Green Version]
  15. Rutherford, A.J.; Oikonomou, G.; Smith, R.F. The effect of subclinical ketosis on activity at estrus and reproductive performance in dairy cattle. J. Dairy Sci. 2016, 99, 4808–4815. [Google Scholar] [CrossRef] [PubMed] [Green Version]
  16. Ospina, P.A.; Nydam, D.V.; Stokol, T.; Overton, T.R. Association between the proportion of sampled transition cows with increased nonesterified fatty acids and β-hydroxybutyrate and disease incidence, pregnancy rate, and milk production at the herd level. J. Dairy Sci. 2010, 93, 3595–3601. [Google Scholar] [CrossRef]
  17. Wathes, D.C.; Fenwick, M.; Cheng, Z.; Bourne, N.; Lewellyn, S.; Morris, D.G.; Fitzpatrick, R. Influence of negative energy balance on cyclicity and fertility in the high producing dairy cow. Theriogenology 2007, 68, S232–S241. [Google Scholar] [CrossRef] [PubMed]
  18. Norberg, E.; Hogeveen, H.; Korsgaard, I.R.; Friggens, N.C.; Sloth, K.N.; Løvendahl, P. Electrical conductivity of milk: Ability to predict mastitis status. J. Dairy Sci. 2004, 87, 1099–1107. [Google Scholar] [CrossRef] [Green Version]
  19. Televičius, M.; Juozaitiene, V.; Malašauskienė, D.; Antanaitis, R.; Rutkauskas, A.; Urbutis, M.; Baumgartner, W. Inline Milk Lactose Concentration as Biomarker of the Health Status and Reproductive Success in Dairy Cows. Agriculture 2021, 11, 38. [Google Scholar] [CrossRef]
  20. Costa, A.; Egger-Danner, C.; Mészáros, G.; Fuerst, C.; Penasa, M.; Sölkner, J.; Fuerst-Waltl, B. Genetic associations of lactose and its ratios to other milk solids with health traits in Austrian Fleckvieh cows. J. Dairy Sci. 2019, 102, 4238–4248. [Google Scholar] [CrossRef] [PubMed]
  21. Ježek, J.; Cincović, M.R.; Nemec, M.; Belić, B.; Djoković, R.; Klinkon, M.; Starič, J. Beta-hydroxybutyrate in milk as screening test for subclinical ketosis in dairy cows. Pol. J. Vet. Sci. 2017, 20, 507–512. [Google Scholar] [CrossRef] [Green Version]
  22. Bastin, C.; Abdelsayed, M.; Gengler, N.; Bradley, A.J. Invited review: Opportunities for genetic improvement of metabolic diseases. J. Dairy Sci. 2016, 99, 6855–6873. [Google Scholar]
  23. Tatone, E.H.; Duffield, T.F.; LeBlanc, S.J.; DeVries, T.J.; Gordon, J.L. Investigating the within-herd prevalence and risk factors for ketosis in dairy cattle in Ontario as diagnosed by the test-day concentration of β-hydroxybutyrate in milk. J. Dairy Sci. 2017, 100, 1308–1318. [Google Scholar] [CrossRef] [Green Version]
  24. Yang, D.A.; Johnson, W.O.; Müller, K.R.; Gates, M.C.; Laven, R.A. Estimating the herd and cow level prevalence of bovine digital dermatitis on New Zealand dairy farms: A Bayesian superpopulation approach. Prev. Vet. Med. 2019, 165, 76–84. [Google Scholar] [CrossRef]
  25. Fleck, A. Clinical and nutritional aspects of changes in acutephase proteins during inflammation. Proc. Nutr. Soc. 1989, 48, 347–354. [Google Scholar] [CrossRef] [PubMed]
  26. Mohebbi-Fani, M.; Omidi, A.; Mirzaei, A.; Nazifi, S.; Nowroozi, K.H. A field study on glucose, non-esterified fatty acids, betahydroxybutyrate and thyroid hormones in dairy cows during the breeding period in Fars province, Iran. Iran J. Vet. Res. 2018, 1, 55. [Google Scholar]
  27. Farid, A.S.; Honkawa, K.; Fath, E.M.; Nonaka, N.; Horii, Y. Serum paraoxonase-1 as biomarker for improved diagnosis of fatty liver in dairy cows. BMC Vet. Res. 2013, 9, 73. [Google Scholar] [CrossRef] [PubMed] [Green Version]
  28. Ametaj, B.N.; Bradford, B.J.; Bobe, G.; Lu, Y.; Nafikov, R.; Sonon, R.N.; Young, J.W.; Beitz, D.C. Acute phase response indicates inflammatory conditions may play a role in the pathogenesis of fatty liver in dairy cows. J. Dairy Sci. 2002, 85, 189. [Google Scholar]
  29. Mordak, R.; Kupczyński, R.; Kuczaj, M.; Niżański, W. Analysis of correlations between selected blood markers of liver function and milk composition in cows during late lactation period. Ann. Anim. Sci. 2020, 20, 871–886. [Google Scholar] [CrossRef]
  30. Burnett, T.A.; Madureira, A.M.; Silper, B.F.; Tahmasbi, A.; Nadalin, A.; Veira, D.M.; Cerri, R.L. Relationship of concentrations of cortisol in hair with health, biomarkers in blood, and reproductive status in dairy cows. J. Dairy Sci. 2015, 98, 4414–4426. [Google Scholar] [CrossRef] [Green Version]
  31. Walker, S.L.; Smith, R.F.; Jones, D.N.; Routly, J.E.; Dobson, H. Chronic stress, hormone profiles and estrus intensity in dairy cattle. Horm. Behav. 2008, 53, 493–501. [Google Scholar] [CrossRef] [PubMed]
  32. Moberg, G.P. Biological response to stress: Implications for animal welfare. In The Biology of Animal Stress: Basic Principles and Implications for Animal Welfare 1; University of California: Davis, CA, USA, 2000; p. 21. [Google Scholar]
  33. Khatun, M.; Bruckmaier, R.M.; Thomson, P.C.; House, J.; García, S.C. Suitability of somatic cell count, electrical conductivity, and lactate dehydrogenase activity in foremilk before versus after alveolar milk ejection for mastitis detection. J. Dairy Sci. 2019, 102, 9200–9212. [Google Scholar] [CrossRef] [PubMed] [Green Version]
  34. Mollenhorst, H.; Rijkaart, L.J.; Hogeveen, H. Mastitis alert preferences of farmers milking with automatic milking systems. J. Dairy Sci. 2012, 95, 2523–2530. [Google Scholar] [CrossRef] [PubMed] [Green Version]
  35. Roberts, T.; Chapinal, N.; LeBlanc, S.J.; Kelton, D.F.; Dubuc, J.; Duffield, T.F. Metabolic parameters in transition cows as indicators for early-lactation culling risk. J. Dairy Sci. 2012, 95, 3057–3063. [Google Scholar] [CrossRef] [PubMed]
Figure 1. Frequency of PG+ and PG− cows by level of metabolic blood profile indicators: (A)—cows ℅ by cortisol level; (B)—cows ℅ by albumin level; (C)—cows ℅ by aspartate aminotransferase level; (D)—cows ℅ by gamma glutamyltransferase level; (E)—cows ℅ by non-esterified fatty acids level; ALB = albumin; AST = aspartate aminotransferase; GGT = gamma glutamyltransferase; NEFA = non-esterified fatty acids; PG+ = pregnant cows; PG− = non-pregnant cows.
Agriculture 11 00334 g001
Figure 2. Frequency of PG+ and PG− cows by level of AMS variables. (A)—cows ℅ by milk yield level; (B)—cows ℅ by β-hydroxybutyric acid level; (C)—cows ℅ by lactate dehydrogenase level; (D)—cows ℅ by electric milk conductivity level; (E)—cows ℅ by difference between electric milk conductivity values in udder quarters level; MY = milk yield; BHB = β-hydroxybutyric acid; LDH = lactate dehydrogenase; EC = electric milk conductivity; DifEC = difference between EC values in udder quarters. PG+ = pregnant cows; PG− = non-pregnant cows.
Agriculture 11 00334 g002
Table 1. Measured parameters and their source.
Measured ParametersSource
Milk yield (MY)Herd Navigator
Electric milk conductivity (EC) front right (FR), front left (FL), back left (BL), back right (BR)Herd Navigator
Lactate dehydrogenase (LDH)Herd Navigator
β-hydroxybutyric acid (BHB)Herd Navigator
Albumin (ALB)Hitachi 705 analyzer
Aspartate aminotransferase (AST)Hitachi 705 analyzer
Gamma glutamyltransferase (GGT)Hitachi 705 analyzer
CortisolAnalyzer AIA-360
Non-esterified fatty acids (NEFA)Rx Daytona, Randox Laboratories
Table 2. Automatic milking system (AMS) variables by groups of cows.
ParameterPG− (n = 48)PG+ (n = 44)p (Between Days)p (Between Groups
MSEMMSEM
MY (kg/d)44.562.25243.992.2030.0090.231
FL (mS/cm)4.410.064.170.0480.4230.002
FR (mS/cm)4.450.054.170.0430.192<0.001
BL (mS/cm)4.370.0434.150.050.5210.002
BR (mS/cm)4.420.0474.140.0440.458<0.001
LDH (µmol/min)29.233.28822.812.3100.5600.366
BHB (mmol/L)0.060.0010.050.0010.0780.003
PG+ = pregnant cows; PG− = non-pregnant cows; M = mean; SEM = standard error of the mean of a sample; MY = milk yield; FL = electric milk conductivity of front left; FR = electric milk conductivity of front right; BL = electric milk conductivity of back left; BR = electric milk conductivity of back right; LDH = lactate dehydrogenase; BHB = β-hydroxybutyric acid.
Table 3. Metabolic profile indicators of blood.
ParameterPG−PG+p (Between Days)p (Between Groups)
MSEMMSEM
Cortisol (mmol/L)1.370.3580.830.1190.6120.227
ALB (g/L)20.851.25724.851.0460.2010.017
AST (IU/L)49.512.66657.372.7550.5430.048
GGT (IU/L)10.461.5556.500.5190.4870.017
NEFA (mmol/L)0.160.0080.140.0060.1990.049
PG+ = pregnant cows; PG− = non-pregnant cows; M = mean; SEM = standard error of the mean of a sample; ALB = albumin; AST = aspartate aminotransferase; GGT = gamma glutamyltransferase; NEFA = non-esterified fatty acids.
Publisher’s Note: MDPI stays neutral with regard to jurisdictional claims in published maps and institutional affiliations.

