

Hemoglobin-to-Red Cell Distribution Width Ratio Was Associated with Cardiovascular Diseases and Death

 ,
, 
Abstract
1. Introduction
2. Materials and Methods
2.1. NHANES Study
2.2. Data Collection
2.3. HRR Measurement
2.4. Statistical Analysis
3. Results
4. Discussion
5. Conclusions
Supplementary Materials
Author Contributions
Funding
Institutional Review Board Statement
Informed Consent Statement
Data Availability Statement
Acknowledgments
Conflicts of Interest
Abbreviations
| RBC | red blood cell |
| RDW | red blood cell distribution width |
| HRR | hemoglobin-to-red cell distribution width ratio |
| NHANES | National Health and Nutrition Examination Survey |
| ASCVD | atherosclerotic cardiovascular disease |
| CVD | cardiovascular disease |
| CHD | coronary heart disease |
| CKD | chronic kidney disease |
| NLR | neutrophil-to-lymphocyte ratio |
| ROC | receiver operating characteristic |
| AUC | area under the curve |
| HRs | hazard ratios |
| CIs | confidence intervals |
| ORs | odds ratios |
| Q | quartile |
References
- Tang, W.H.; Tong, W.; Jain, A.; Francis, G.S.; Harris, C.M.; Young, J.B. Evaluation and long-term prognosis of new-onset, transient, and persistent anemia in ambulatory patients with chronic heart failure. J. Am. Coll. Cardiol. 2008, 51, 569–576. [Google Scholar] [CrossRef] [PubMed]
- Kalra, P.R.; Greenlaw, N.; Ferrari, R.; Ford, I.; Tardif, J.C.; Tendera, M.; Reid, C.M.; Danchin, N.; Stepinska, J.; Steg, P.G.; et al. Hemoglobin and Change in Hemoglobin Status Predict Mortality, Cardiovascular Events, and Bleeding in Stable Coronary Artery Disease. Am. J. Med. 2017, 130, 720–730. [Google Scholar] [CrossRef] [PubMed]
- Tang, Y.D.; Katz, S.D. Anemia in chronic heart failure: Prevalence, etiology, clinical correlates, and treatment options. Circulation 2006, 113, 2454–2461. [Google Scholar] [CrossRef] [PubMed]
- Kaiafa, G.; Savopoulos, C.; Kanellos, I.; Mylonas, K.S.; Tsikalakis, G.; Tegos, T.; Kakaletsis, N.; Hatzitolios, A.I. Anemia and stroke: Where do we stand? Acta Neurol. Scand. 2017, 135, 596–602. [Google Scholar] [CrossRef]
- Varat, M.A.; Adolph, R.J.; Fowler, N.O. Cardiovascular effects of anemia. Am. Heart J. 1972, 83, 415–426. [Google Scholar] [CrossRef]
- Hare, G.M.; Tsui, A.K.; McLaren, A.T.; Ragoonanan, T.E.; Yu, J.; Mazer, C.D. Anemia and cerebral outcomes: Many questions, fewer answers. Anesth. Analg. 2008, 107, 1356–1370. [Google Scholar] [CrossRef]
- Chang, J.Y.; Lee, J.S.; Kim, B.J.; Kim, J.T.; Lee, J.; Cha, J.K.; Kim, D.H.; Cho, Y.J.; Hong, K.S.; Lee, S.J.; et al. Influence of Hemoglobin Concentration on Stroke Recurrence and Composite Vascular Events. Stroke 2020, 51, 1309–1312. [Google Scholar] [CrossRef]
- Hu, H.; Wang, S.; Tang, G.; Zhai, C.; Shen, L. Impact of anemia on in-stent restenosis after percutaneous coronary intervention. BMC Cardiovasc. Disord. 2021, 21, 548. [Google Scholar] [CrossRef]
- Kwok, C.S.; Tiong, D.; Pradhan, A.; Andreou, A.Y.; Nolan, J.; Bertrand, O.F.; Curzen, N.; Urban, P.; Myint, P.K.; Zaman, A.G.; et al. Meta-Analysis of the Prognostic Impact of Anemia in Patients Undergoing Percutaneous Coronary Intervention. Am. J. Cardiol. 2016, 118, 610–620. [Google Scholar] [CrossRef]
- Salvagno, G.L.; Sanchis-Gomar, F.; Picanza, A.; Lippi, G. Red blood cell distribution width: A simple parameter with multiple clinical applications. Crit. Rev. Clin. Lab. Sci. 2015, 52, 86–105. [Google Scholar] [CrossRef]
- Parizadeh, S.M.; Jafarzadeh-Esfehani, R.; Bahreyni, A.; Ghandehari, M.; Shafiee, M.; Rahmani, F.; Parizadeh, M.R.; Seifi, S.; Ghayour-Mobarhan, M.; Ferns, G.A.; et al. The diagnostic and prognostic value of red cell distribution width in cardiovascular disease; current status and prospective. BioFactors 2019, 45, 507–516. [Google Scholar] [CrossRef] [PubMed]
- Xiao, Q.; Yan, D.; Qin, J.; Chen, W.; Jiang, K.; Zhao, J.; Zhang, C.; Li, Y. Dynamic Changes in Red Cell Distribution Width Can Predict Major Adverse Cardiovascular Events after PCI in Patients with Unstable Angina Pectoris: A Retrospective Cohort Study. Dis. Markers 2022, 2022, 2735717. [Google Scholar] [CrossRef] [PubMed]
- Xue, J.; Zhang, D.; Zhang, X.G.; Zhu, X.Q.; Xu, X.S.; Yue, Y.H. Red cell distribution width is associated with stroke severity and unfavorable functional outcomes in ischemic stroke. Front. Neurol. 2022, 13, 938515. [Google Scholar] [CrossRef] [PubMed]
- Li, W.; Li, X.; Wang, M.; Ge, X.; Li, F.; Huang, B.; Peng, J.; Li, G.; Lu, L.; Yu, Z.; et al. Association between red cell distribution width and the risk of heart events in patients with coronary artery disease. Exp. Ther. Med. 2015, 9, 1508–1514. [Google Scholar] [CrossRef]
- Uyarel, H.; Ergelen, M.; Cicek, G.; Kaya, M.G.; Ayhan, E.; Turkkan, C.; Yildirim, E.; Kirbas, V.; Onturk, E.T.; Erer, H.B.; et al. Red cell distribution width as a novel prognostic marker in patients undergoing primary angioplasty for acute myocardial infarction. Coron. Artery Dis. 2011, 22, 138–144. [Google Scholar] [CrossRef]
- Felker, G.M.; Allen, L.A.; Pocock, S.J.; Shaw, L.K.; McMurray, J.J.; Pfeffer, M.A.; Swedberg, K.; Wang, D.; Yusuf, S.; Michelson, E.L.; et al. Red cell distribution width as a novel prognostic marker in heart failure: Data from the CHARM Program and the Duke Databank. J. Am. Coll. Cardiol. 2007, 50, 40–47. [Google Scholar] [CrossRef]
- Van Kimmenade, R.R.; Mohammed, A.A.; Uthamalingam, S.; van der Meer, P.; Felker, G.M.; Januzzi, J.L., Jr. Red blood cell distribution width and 1-year mortality in acute heart failure. Eur. J. Heart Fail. 2010, 12, 129–136. [Google Scholar] [CrossRef]
- Perlstein, T.S.; Weuve, J.; Pfeffer, M.A.; Beckman, J.A. Red blood cell distribution width and mortality risk in a community-based prospective cohort. Arch. Intern. Med. 2009, 169, 588–594. [Google Scholar] [CrossRef]
- Northrop-Clewes, C.A.; Thurnham, D.I. Biomarkers for the differentiation of anemia and their clinical usefulness. J. Blood Med. 2013, 4, 11–22. [Google Scholar]
- Arida, A.; Protogerou, A.D.; Kitas, G.D.; Sfikakis, P.P. Systemic Inflammatory Response and Atherosclerosis: The Paradigm of Chronic Inflammatory Rheumatic Diseases. Int. J. Mol. Sci. 2018, 19, 1890. [Google Scholar] [CrossRef]
- Chen, J.; Wu, Y.; Zhao, H.; Ruan, G.; Qin, S. Ratio of hemoglobin to red cell distribution width: An inflammatory predictor of survival in AIDS-related DLBCL. Front. Immunol. 2024, 15, 1354325. [Google Scholar] [CrossRef] [PubMed]
- Fang, Y.; Sun, X.; Zhang, L.; Xu, Y.; Zhu, W. Hemoglobin/Red Blood Cell Distribution Width Ratio in Peripheral Blood Is Positively Associated with Prognosis of Patients with Primary Hepatocellular Carcinoma. Med. Sci. Monit. 2022, 28, e937146. [Google Scholar] [CrossRef] [PubMed]
- Sun, P.; Zhang, F.; Chen, C.; Bi, X.; Yang, H.; An, X.; Wang, F.; Jiang, W. The ratio of hemoglobin to red cell distribution width as a novel prognostic parameter in esophageal squamous cell carcinoma: A retrospective study from southern China. Oncotarget 2016, 7, 42650–42660. [Google Scholar] [CrossRef]
- Xiu, W.J.; Zheng, Y.Y.; Wu, T.T.; Hou, X.G.; Yang, Y.; Ma, Y.T.; Xie, X. Hemoglobin-to-Red-Cell Distribution Width Ratio Is a Novel Predictor of Long-Term Patient Outcomes After Percutaneous Coronary Intervention: A Retrospective Cohort Study. Front. Cardiovasc. Med. 2022, 9, 726025. [Google Scholar] [CrossRef] [PubMed]
- Feng, X.; Zhang, Y.; Li, Q.; Wang, B.; Shen, J. Hemoglobin to red cell distribution width ratio as a prognostic marker for ischemic stroke after mechanical thrombectomy. Front. Aging Neurosci. 2023, 15, 1259668. [Google Scholar] [CrossRef]
- Chen, H.; Zhen, Z.; Dong, Y.; Liu, C.; Dong, B.; Xue, R. Hemoglobin to red cell distribution width ratio: A predictor of clinical outcome and diuretic response in patients with acute heart failure. Int. J. Cardiol. 2024, 394, 131368. [Google Scholar] [CrossRef]
- Qin, Z.; Liao, N.; Lu, X.; Duan, X.; Zhou, Q.; Ge, L. Relationship Between the Hemoglobin-to-Red Cell Distribution Width Ratio and All-Cause Mortality in Ischemic Stroke Patients with Atrial Fibrillation: An Analysis from the MIMIC-IV Database. Neuropsychiatr. Dis. Treat. 2022, 18, 341–354. [Google Scholar] [CrossRef]
- Sun, X.; Zhang, R.; Fan, Z.; Liu, Z.; Hua, Q. Predictive value of hemoglobin-to-red blood cell distribution width ratio for contrast-induced nephropathy after emergency percutaneous coronary intervention. Perfusion 2023, 38, 1511–1518. [Google Scholar] [CrossRef]
- Yildiz, D.; Cakir, U.; Tugcu, A.U.; Ceran, B.; Tayman, C. Hemoglobin/Red Cell Distribution width Ratio (HRR): A Novel and Promising Red Cell Parameter in Ductal Closure. Arq. Bras. Cardiol. 2023, 120, e20220339. [Google Scholar] [CrossRef]
- Lin, Q.; Liao, J.; Dong, W.; Zhou, F.; Xu, Y. The relationship between hemoglobin/red blood cell distribution width ratio and mortality in patients with intracranial hemorrhage: A possible protective effect for the elderly? Intern. Emerg. Med. 2023, 18, 2301–2310. [Google Scholar] [CrossRef]
- Rahamim, E.; Zwas, D.R.; Keren, A.; Elbaz-Greener, G.; Ibrahimli, M.; Amir, O.; Gotsman, I. The Ratio of Hemoglobin to Red Cell Distribution Width: A Strong Predictor of Clinical Outcome in Patients with Heart Failure. J. Clin. Med. 2022, 11, 886. [Google Scholar] [CrossRef] [PubMed]
- Ogden, C.L.; Carroll, M.D.; Flegal, K.M. Prevalence of obesity in the United States. JAMA 2014, 312, 189–190. [Google Scholar] [CrossRef] [PubMed]
- Centers for Disease Control and Prevention. National Health and Nutrition Examination Survey-Alcohol Use. Available online: https://wwwn.cdc.gov/Nchs/Data/Nhanes/Public/2013/DataFiles/ALQ_H.htm (accessed on 22 May 2024).
- Wang, S.; Wang, Y.; Wan, X.; Guo, J.; Zhang, Y.; Tian, M.; Fang, S.; Yu, B. Cobalamin Intake and Related Biomarkers: Examining Associations With Mortality Risk Among Adults With Type 2 Diabetes in NHANES. Diabetes Care 2022, 45, 276–284. [Google Scholar] [CrossRef] [PubMed]
- Gunter, E.W.; Lewis, B.G.; Konicowski, S.M. Laboratory Procedures Used for the Third National Health and Nutrition Survey (NHANES III), 1988–1994; U.S. Department of Health and Human Services: Washington, DC, USA, 1996.
- Xu, C.; Liang, J.; Xu, S.; Liu, Q.; Xu, J.; Gu, A. Increased serum levels of aldehydes are associated with cardiovascular disease and cardiovascular risk factors in adults. J. Hazard Mater. 2020, 400, 123134. [Google Scholar] [CrossRef]
- Qu, J.; Zhou, T.; Xue, M.; Sun, H.; Shen, Y.; Chen, Y.; Tang, L.; Qian, L.; You, J.; Yang, R.; et al. Correlation Analysis of Hemoglobin-to-Red Blood Cell Distribution Width Ratio and Frailty in Elderly Patients With Coronary Heart Disease. Front. Cardiovasc. Med. 2021, 8, 728800. [Google Scholar] [CrossRef]
- Eyiol, A.; Ertekin, B. The relationship between hemoglobin-to-red cell distribution width (RDW) ratio (HRR) and mortality in stroke patients. Eur. Rev. Med. Pharmacol. Sci. 2024, 28, 1504–1512. [Google Scholar] [CrossRef]
- Wang, X.D.; Li, C.; Hu, J.; Cao, F.; Zhu, L.; Zhu, Y.; Wen, Z.; Liu, J. Hemoglobin-to-red blood cell distribution width ratio as a protective factor against coronary artery disease: A cross-sectional analysis of NHANES (2011–2018). Front. Pharmacol. 2025, 16, 1534479. [Google Scholar] [CrossRef]
- Zhu, M.; Wei, C.; Yang, X.; Huang, Y.; Xu, Y.; Xiong, Z. Lower haemoglobin-to-red blood cell distribution width ratio is independently associated with frailty in community-dwelling older adults: A cross-sectional study. BMJ Open 2023, 13, e069141. [Google Scholar] [CrossRef]
- Li, Y.; Xu, C.; Qin, Z.; Ge, L. Relationship Between the Hemoglobin-to-Red Cell Distribution Width Ratio and in-Hospital Mortality in Patients with Chronic Heart Failure. Vasc. Health Risk Manag. 2024, 20, 553–565. [Google Scholar] [CrossRef]
- Zhou, J.; Ma, W.; Wan, Y.; Zhou, Y.; Wan, W.; Gu, W.; Li, H.; Xu, C.; Chen, L. Predictive Value of the Hb/RDW Ratio for the Risk of All-Cause Death in Patients with Heart Failure with Different Ejection Fractions. Cardiology 2024, 149, 237–247. [Google Scholar] [CrossRef]
- Li, Z.; Zhou, T.; Li, Y.; Chen, P.; Chen, L. Anemia increases the mortality risk in patients with stroke: A meta-analysis of cohort studies. Sci. Rep. 2016, 6, 26636. [Google Scholar] [CrossRef] [PubMed]
- Smith, K.J.; Bleyer, A.J.; Little, W.C.; Sane, D.C. The cardiovascular effects of erythropoietin. Cardiovasc. Res. 2003, 59, 538–548. [Google Scholar] [CrossRef] [PubMed]
- Ercan, M.; Konukoğlu, D.; Erdem, T.; Onen, S. The effects of cholesterol levels on hemorheological parameters in diabetic patients. Clin. Hemorheol. Microcirc. 2002, 26, 257–263. [Google Scholar]
- Patel, K.V.; Mohanty, J.G.; Kanapuru, B.; Hesdorffer, C.; Ershler, W.B.; Rifkind, J.M. Association of the red cell distribution width with red blood cell deformability. Adv. Exp. Med. Biol. 2013, 765, 211–216. [Google Scholar] [CrossRef]
- Egberts, J.; Hardeman, M.R.; Luykx, L.M. Decreased deformability of donor red blood cells after intrauterine transfusion in the human fetus: Possible reason for their reduced life span? Transfusion 2004, 44, 1231–1237. [Google Scholar] [CrossRef]
- Emans, M.E.; van der Putten, K.; van Rooijen, K.L.; Kraaijenhagen, R.J.; Swinkels, D.; van Solinge, W.W.; Cramer, M.J.; Doevendans, P.A.; Braam, B.; Gaillard, C.A. Determinants of red cell distribution width (RDW) in cardiorenal patients: RDW is not related to erythropoietin resistance. J. Card. Fail. 2011, 17, 626–633. [Google Scholar] [CrossRef]
- Ning, L. Research Progress of MHR, RDW, D-Dimer/Fib and Vascular Endothelial Func-tion in Chronic Heart Failure. Adv. Clin. Med. 2022, 12, 5828–5836. [Google Scholar] [CrossRef]
- Wang, J.; Chen, Z.; Yang, H.; Li, H.; Chen, R.; Yu, J. Relationship between the Hemoglobin-to-Red Cell Distribution Width Ratio and All-Cause Mortality in Septic Patients with Atrial Fibrillation: Based on Propensity Score Matching Method. J. Cardiovasc. Dev. Dis. 2022, 9, 400. [Google Scholar] [CrossRef]
- Agarwal, N.; Prchal, J.T. Anemia of chronic disease (anemia of inflammation). Acta Haematol. 2009, 122, 103–108. [Google Scholar] [CrossRef]
- He, Y.; Liu, C.; Zeng, Z.; Ye, W.; Lin, J.; Ou, Q. Red blood cell distribution width: A potential laboratory parameter for monitoring inflammation in rheumatoid arthritis. Clin. Rheumatol. 2018, 37, 161–167. [Google Scholar] [CrossRef]
- Weiss, G.; Ganz, T.; Goodnough, L.T. Anemia of inflammation. Blood 2019, 133, 40–50. [Google Scholar] [CrossRef] [PubMed]
- Castellanos, M.; Castillo, J.; García, M.M.; Leira, R.; Serena, J.; Chamorro, A.; Dávalos, A. Inflammation-mediated damage in progressing lacunar infarctions: A potential therapeutic target. Stroke 2002, 33, 982–987. [Google Scholar] [CrossRef] [PubMed]
- He, J.; Song, C.; Zhang, R.; Yuan, S.; Li, J.; Dou, K. Discordance Between Neutrophil to Lymphocyte Ratio and High Sensitivity C-Reactive Protein to Predict Clinical Events in Patients with Stable Coronary Artery Disease: A Large-Scale. J. Inflamm. Res. 2023, 16, 5439–5450. [Google Scholar] [CrossRef] [PubMed]
- Zahorec, R. Neutrophil-to-lymphocyte ratio, past, present and future perspectives. Bratisl. Lek. Listy 2021, 122, 474–488. [Google Scholar] [CrossRef]
- Li, X.; Ji, Y.; Kang, J.; Fang, N. Association between blood neutrophil-to-lymphocyte ratio and severity of coronary artery disease: Evidence from 17 observational studies involving 7017 cases. Medicine 2018, 97, e12432. [Google Scholar] [CrossRef]
- Delcea, C.; Buzea, C.A.; Dan, G.A. The neutrophil to lymphocyte ratio in heart failure: A comprehensive review. Rom. J. Intern. Med. 2019, 57, 296–314. [Google Scholar] [CrossRef]
- Chen, C.; Cong, B.L.; Wang, M.; Abdullah, M.; Wang, X.L.; Zhang, Y.H.; Xu, S.J.; Cui, L. Neutrophil to lymphocyte ratio as a predictor of myocardial damage and cardiac dysfunction in acute coronary syndrome patients. Integr. Med. Res. 2018, 7, 192–199. [Google Scholar] [CrossRef]
- Straat, M.; van Bruggen, R.; de Korte, D.; Juffermans, N.P. Red blood cell clearance in inflammation. Transfus. Med. Hemotherapy 2012, 39, 353–361. [Google Scholar] [CrossRef]
- Dinkla, S.; van Eijk, L.T.; Fuchs, B.; Schiller, J.; Joosten, I.; Brock, R.; Pickkers, P.; Bosman, G.J. Inflammation-associated changes in lipid composition and the organization of the erythrocyte membrane. BBA Clin. 2016, 5, 186–192. [Google Scholar] [CrossRef]
- Muzzarelli, S.; Pfisterer, M. Anemia as independent predictor of major events in elderly patients with chronic angina. Am. Heart J. 2006, 152, 991–996. [Google Scholar] [CrossRef]
- Friedman, J.S.; Lopez, M.F.; Fleming, M.D.; Rivera, A.; Martin, F.M.; Welsh, M.L.; Boyd, A.; Doctrow, S.R.; Burakoff, S.J. SOD2-deficiency anemia: Protein oxidation and altered protein expression reveal targets of damage, stress response, and antioxidant responsiveness. Blood 2004, 104, 2565–2573. [Google Scholar] [CrossRef]
- Rana, J.S.; Cote, M.; Després, J.P.; Sandhu, M.S.; Talmud, P.J.; Ninio, E.; Wareham, N.J.; Kastelein, J.J.; Zwinderman, A.H.; Khaw, K.T.; et al. Inflammatory biomarkers and the prediction of coronary events among people at intermediate risk: The EPIC-Norfolk prospective population study. Heart Br. Card. Soc. 2009, 95, 1682–1687. [Google Scholar] [CrossRef] [PubMed]
- Tziakas, D.; Chalikias, G.; Grapsa, A.; Gioka, T.; Tentes, I.; Konstantinides, S. Red blood cell distribution width: A strong prognostic marker in cardiovascular disease: Is associated with cholesterol content of erythrocyte membrane. Clin. Hemorheol. Microcirc. 2012, 51, 243–254. [Google Scholar] [CrossRef] [PubMed]
- Connelly, P.J.; Jandeleit-Dahm, K.A.M.; Delles, C. Sex and gender aspects in vascular pathophysiology. Clin. Sci. 2020, 134, 2203–2207. [Google Scholar] [CrossRef] [PubMed]
- Madonna, R.; Balistreri, C.R.; De Rosa, S.; Muscoli, S.; Selvaggio, S.; Selvaggio, G.; Ferdinandy, P.; De Caterina, R. Impact of Sex Differences and Diabetes on Coronary Atherosclerosis and Ischemic Heart Disease. J. Clin. Med. 2019, 8, 98. [Google Scholar] [CrossRef]

| Variables | Overall (47,719) N = 207,540,003 | Without CVD (42,474) N = 189,102,339 | With CVD (5245) N = 18,437,664 | p-Value |
|---|---|---|---|---|
| Age, years | 47.2 (17.0) | 45.4 (16.2) | 64.8 (13.6) | <0.001 |
| Female | 25,780 (52%) | 23,331 (53%) | 2449 (47%) | <0.001 |
| Race | <0.001 | |||
| Non-Hispanic White | 22,089 (69%) | 18,949 (68%) | 3140 (76%) | |
| Non-Hispanic Black | 10,131 (11%) | 8979 (11%) | 1152 (11%) | |
| Other Hispanic | 4094 (5.6%) | 3751 (5.8%) | 343 (3.4%) | |
| Mexican American | 8776 (8.2%) | 8125 (8.6%) | 651 (4.2%) | |
| Other Races | 4539 (6.9%) | 4215 (7.0%) | 324 (5.9%) | |
| Education | <0.001 | |||
| Below high school | 13,438 (17%) | 11,430 (16%) | 2008 (26%) | |
| High school or above | 36,121 (83%) | 32,534 (84%) | 3587 (74%) | |
| Marital status | <0.001 | |||
| Married/Living with partner | 29,718 (64%) | 26,632 (64%) | 3086 (60%) | |
| Widowed/Divorced/Separated | 10,943 (19%) | 8846 (17%) | 2097 (34%) | |
| Never married | 8488 (17%) | 8111 (19%) | 377 (6.5%) | |
| Drinking | <0.001 | |||
| Never | 6579 (12%) | 5814 (11%) | 765 (14%) | |
| Mild | 14,692 (36%) | 13,033 (36%) | 1659 (37%) | |
| Moderate | 6607 (17%) | 6207 (18%) | 400 (8.7%) | |
| Heavy | 8832 (21%) | 8327 (22%) | 505 (11%) | |
| Former | 7951 (15%) | 6295 (13%) | 1656 (30%) | |
| Smoking | <0.001 | |||
| Never | 26,940 (54%) | 24,733 (55%) | 2207 (39%) | |
| Former | 12,315 (25%) | 10,026 (23%) | 2289 (40%) | |
| Now | 10,331 (21%) | 9220 (21%) | 1111 (21%) | |
| Vascular diseases | ||||
| Diabetes | 8665 (13%) | 6425 (11%) | 2240 (36%) | <0.001 |
| Hypertension | 21,295 (38%) | 16,783 (34%) | 4512 (77%) | <0.001 |
| Hyperlipidemia | 35,621 (71%) | 30,794 (69%) | 4827 (88%) | <0.001 |
| Chronic kidney diseases | 9133 (15%) | 6572 (12%) | 2561 (41%) | <0.001 |
| Laboratory tests | ||||
| White blood cells, 1000 cells/uL | 7.30 (2.50) | 7.27 (2.44) | 7.54 (3.05) | <0.001 |
| Platelet count, 1000 cells/uL | 254 (66) | 255 (65) | 237 (72) | <0.001 |
| Glucose, mg/dL | 105 (31) | 104 (29) | 120 (43) | <0.001 |
| HDL, mg/dL | 53 (16) | 53 (16) | 50 (16) | <0.001 |
| LDL, mg/dL | 116 (36) | 117 (35) | 104 (39) | <0.001 |
| Triglyceride, mg/dL | 133 (114) | 131 (115) | 150 (105) | <0.001 |
| Total cholesterol, mg/dL | 196 (42) | 197 (41) | 186 (46) | <0.001 |
| Hemoglobin, g/L | 143 (15) | 143(15) | 140 (16) | <0.001 |
| RDW (%) | 13.03 (1.24) | 12.98 (1.21) | 13.58 (1.46) | <0.001 |
| HRR (g/L/%) | 11.08 (1.63) | 11.14 (1.61) | 10.46 (1.71) | <0.001 |
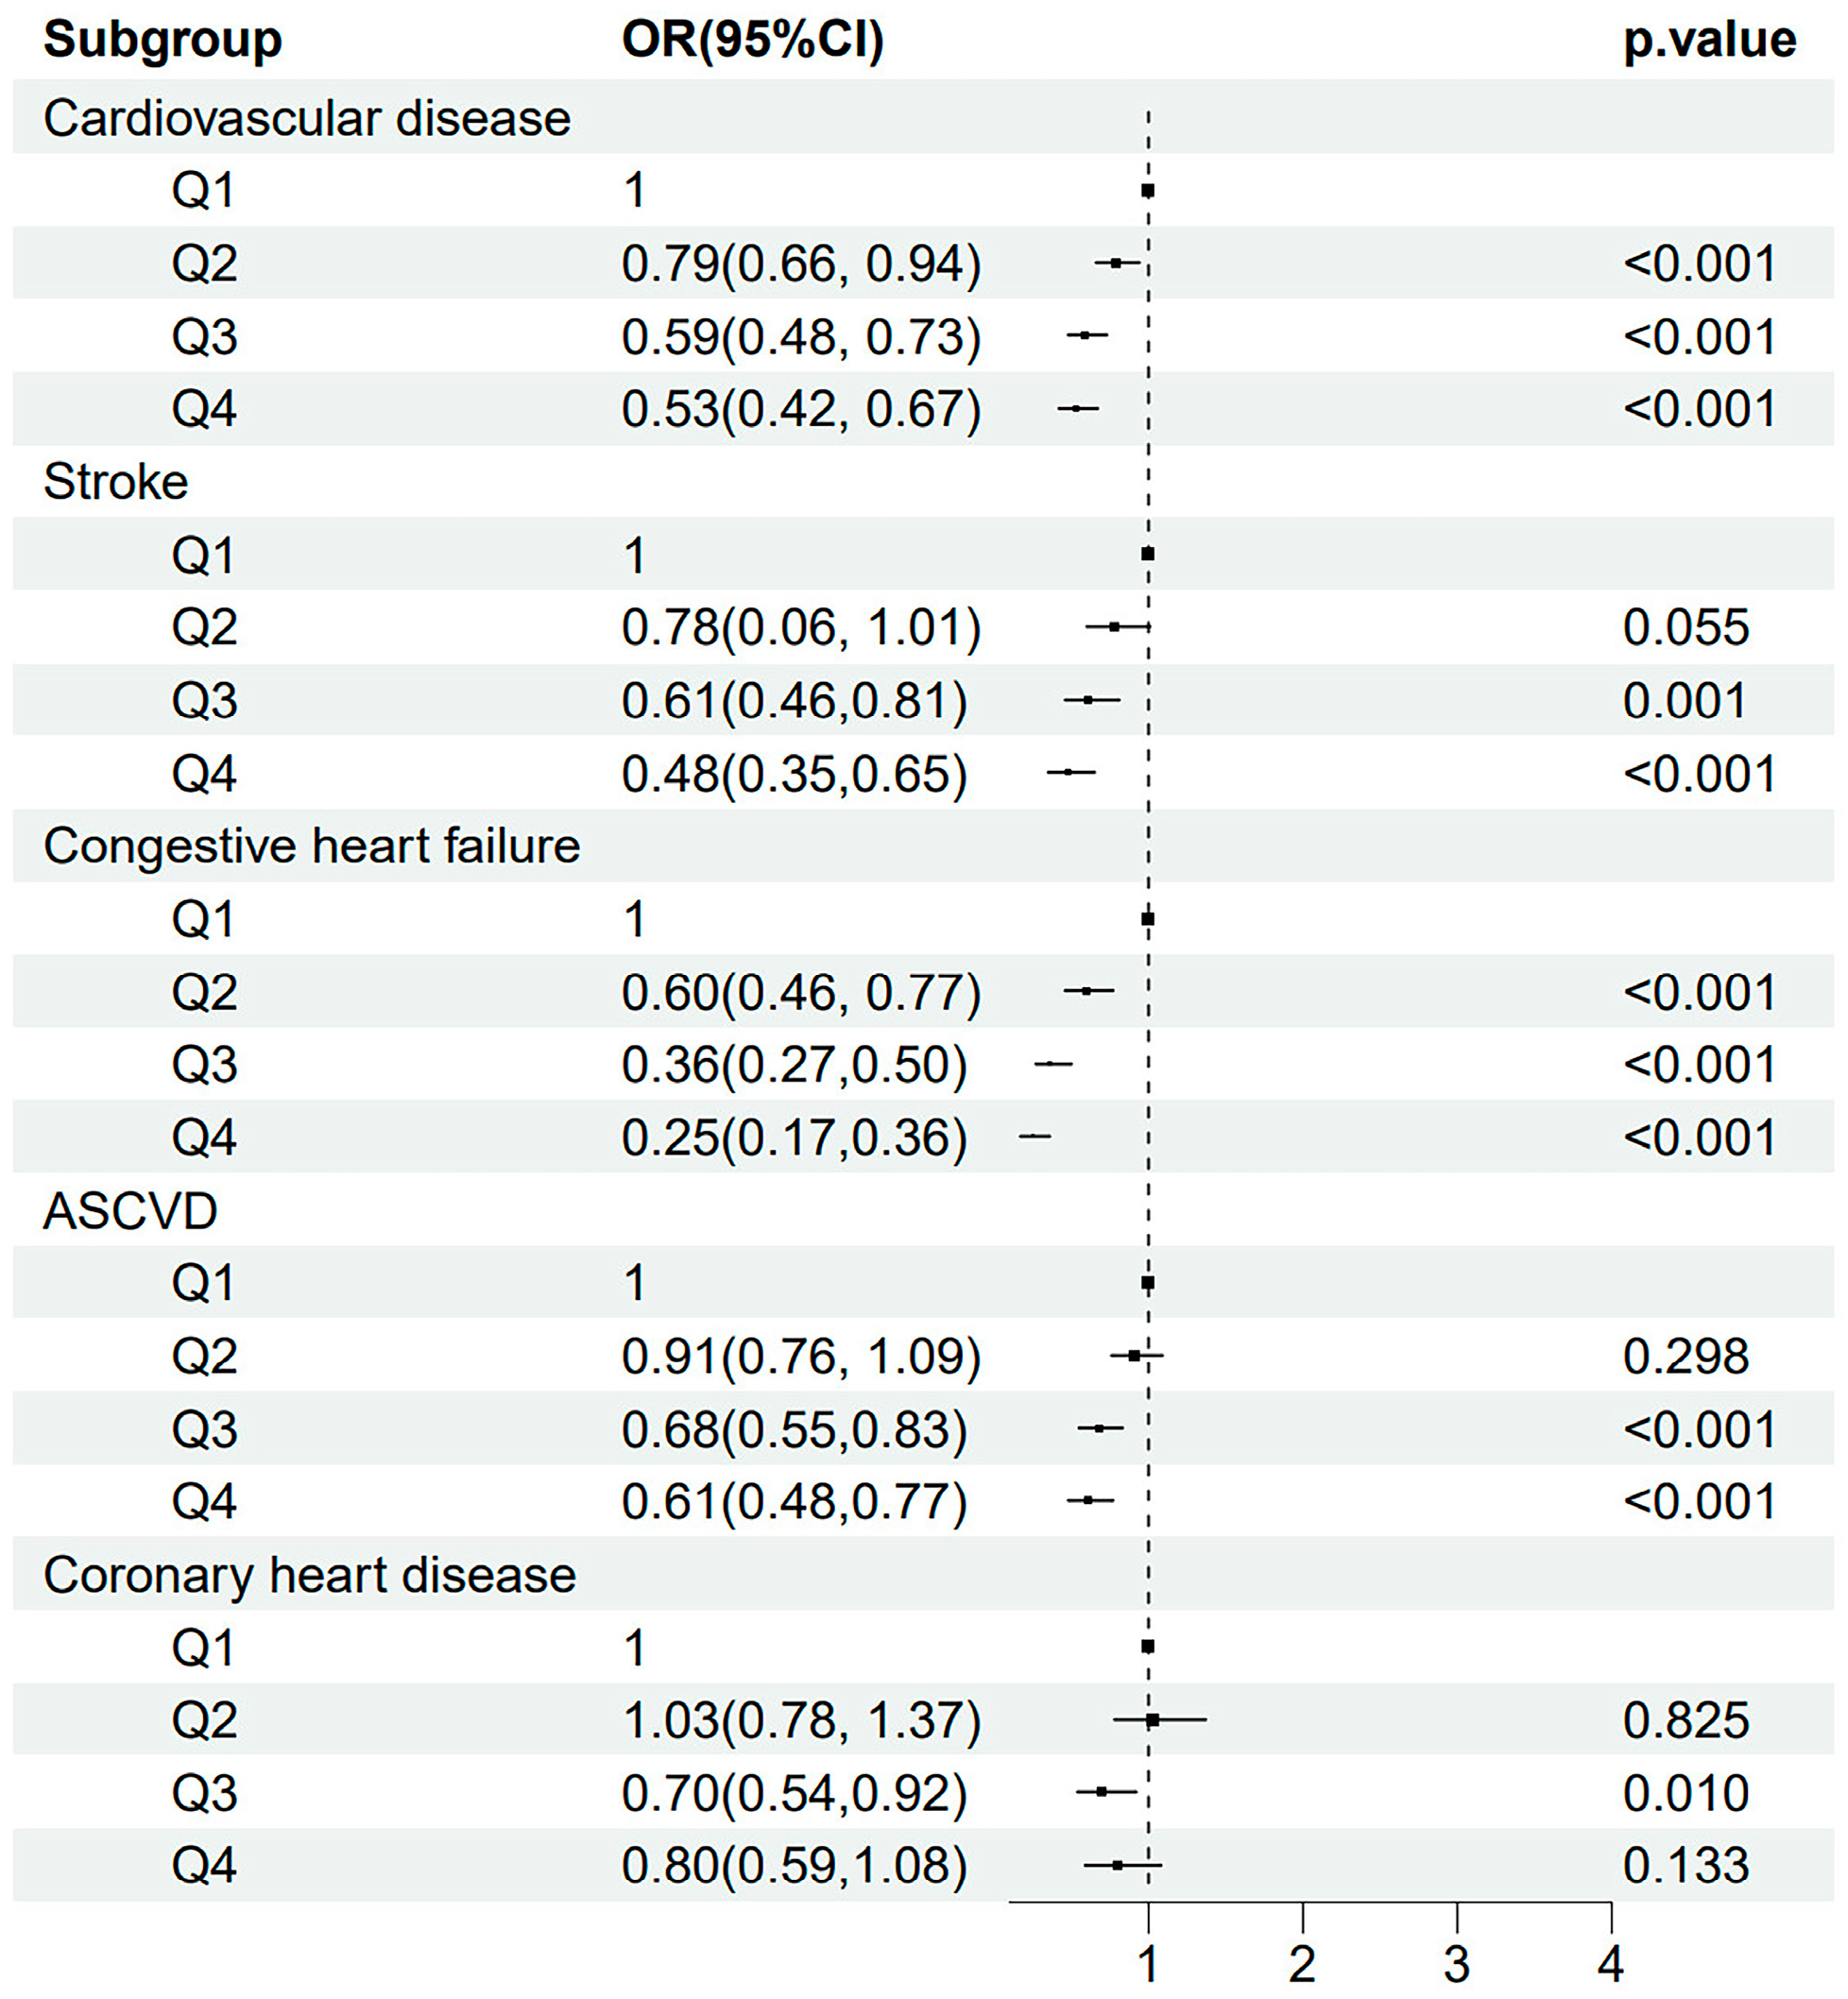
| The Risk of Stroke | Univariate Analysis | Model 1 | Model 2 |
|---|---|---|---|
| Cardiovascular disease | 0.79 (0.78, 0.81), <0.001 | 0.83 (0.80, 0.85), <0.001 | 0.85 (0.81, 0.89), <0.001 |
| Cardiovascular disease | |||
| Q1 | Ref. | Ref. | Ref. |
| Q2 | 0.63 (0.57, 0.70), <0.001 | 0.68 (0.62, 0.75), <0.001 | 0.79 (0.66, 0.94), 0.009 |
| Q3 | 0.46 (0.41, 0.52), <0.001 | 0.54 (0.48, 0.61), <0.001 | 0.59 (0.48, 0.73), <0.001 |
| Q4 | 0.33 (0.30, 0.37), <0.001 | 0.46 (0.40, 0.52), <0.001 | 0.53 (0.42, 0.67), <0.001 |
| p for trend | <0.001 | <0.001 | <0.001 |
| Stroke | 0.78 (0.76, 0.80), <0.001 | 0.84 (0.82, 0.87), <0.001 | 0.85 (0.81, 0.90), <0.001 |
| Stroke | |||
| Q1 | Ref. | Ref. | Ref. |
| Q2 | 0.61 (0.52, 0.72), < 0.001 | 0.71 (0.60, 0.83), < 0.001 | 0.78 (0.60, 1.01), 0.055 |
| Q3 | 0.40 (0.33, 0.48), <0.001 | 0.54 (0.45, 0.65), <0.001 | 0.61 (0.46, 0.81), 0.001 |
| Q4 | 0.28 (0.23, 0.34), <0.001 | 0.49 (0.39, 0.61), <0.001 | 0.48 (0.35, 0.65), <0.001 |
| p for trend | <0.001 | <0.001 | <0.001 |
| Congestive heart failure | 0.71 (0.69, 0.74), <0.001 | 0.73 (0.70, 0.75), <0.001 | 0.73 (0.69, 0.78), <0.001 |
| Congestive heart failure | |||
| Q1 | Ref. | Ref. | Ref. |
| Q2 | 0.46 (0.39, 0.54), < 0.001 | 0.49 (0.42, 0.59), < 0.001 | 0.60 (0.46, 0.77), <0.001 |
| Q3 | 0.25 (0.21, 0.30), <0.001 | 0.29 (0.24, 0.34), <0.001 | 0.36 (0.27, 0.50), <0.001 |
| Q4 | 0.18 (0.15, 0.23), <0.001 | 0.24 (0.19, 0.30), <0.001 | 0.25 (0.17, 0.36), <0.001 |
| p for trend | <0.001 | <0.001 | <0.001 |
| ASCVD | 0.81 (0.80, 0.83), <0.001 | 0.85 (0.83, 0.88), <0.001 | 0.88 (0.84, 0.92), <0.001 |
| ASCVD | |||
| Q1 | Ref. | Ref. | Ref. |
| Q2 | 0.70 (0.63, 0.77), <0.001 | 0.77 (0.69, 0.85), <0.001 | 0.91 (0.76, 1.09), 0.298 |
| Q3 | 0.52 (0.46, 0.58), <0.001 | 0.62 (0.54, 0.70), <0.001 | 0.68 (0.55, 0.83), <0.001 |
| Q4 | 0.37 (0.33, 0.41), <0.001 | 0.51 (0.45, 0.58), <0.001 | 0.61 (0.48, 0.77), <0.001 |
| p for trend | <0.001 | <0.001 | <0.001 |
| Coronary heart disease | 0.82 (0.79, 0.85), <0.001 | 0.85 (0.82, 0.89), <0.001 | 0.91 (0.86, 0.98), 0.009 |
| Coronary heart disease | |||
| Q1 | Ref. | Ref. | Ref. |
| Q2 | 0.71 (0.61, 0.82), < 0.001 | 0.79 (0.68, 0.92), 0.003 | 1.03 (0.78, 1.37), 0.825 |
| Q3 | 0.55 (0.46, 0.65), <0.001 | 0.64 (0.53, 0.78), <0.001 | 0.70 (0.54, 0.92), 0.010 |
| Q4 | 0.39 (0.33, 0.46), <0.001 | 0.51 (0.42, 0.62), <0.001 | 0.80 (0.59, 1.08), 0.133 |
| p for trend | <0.001 | <0.001 | 0.021 |
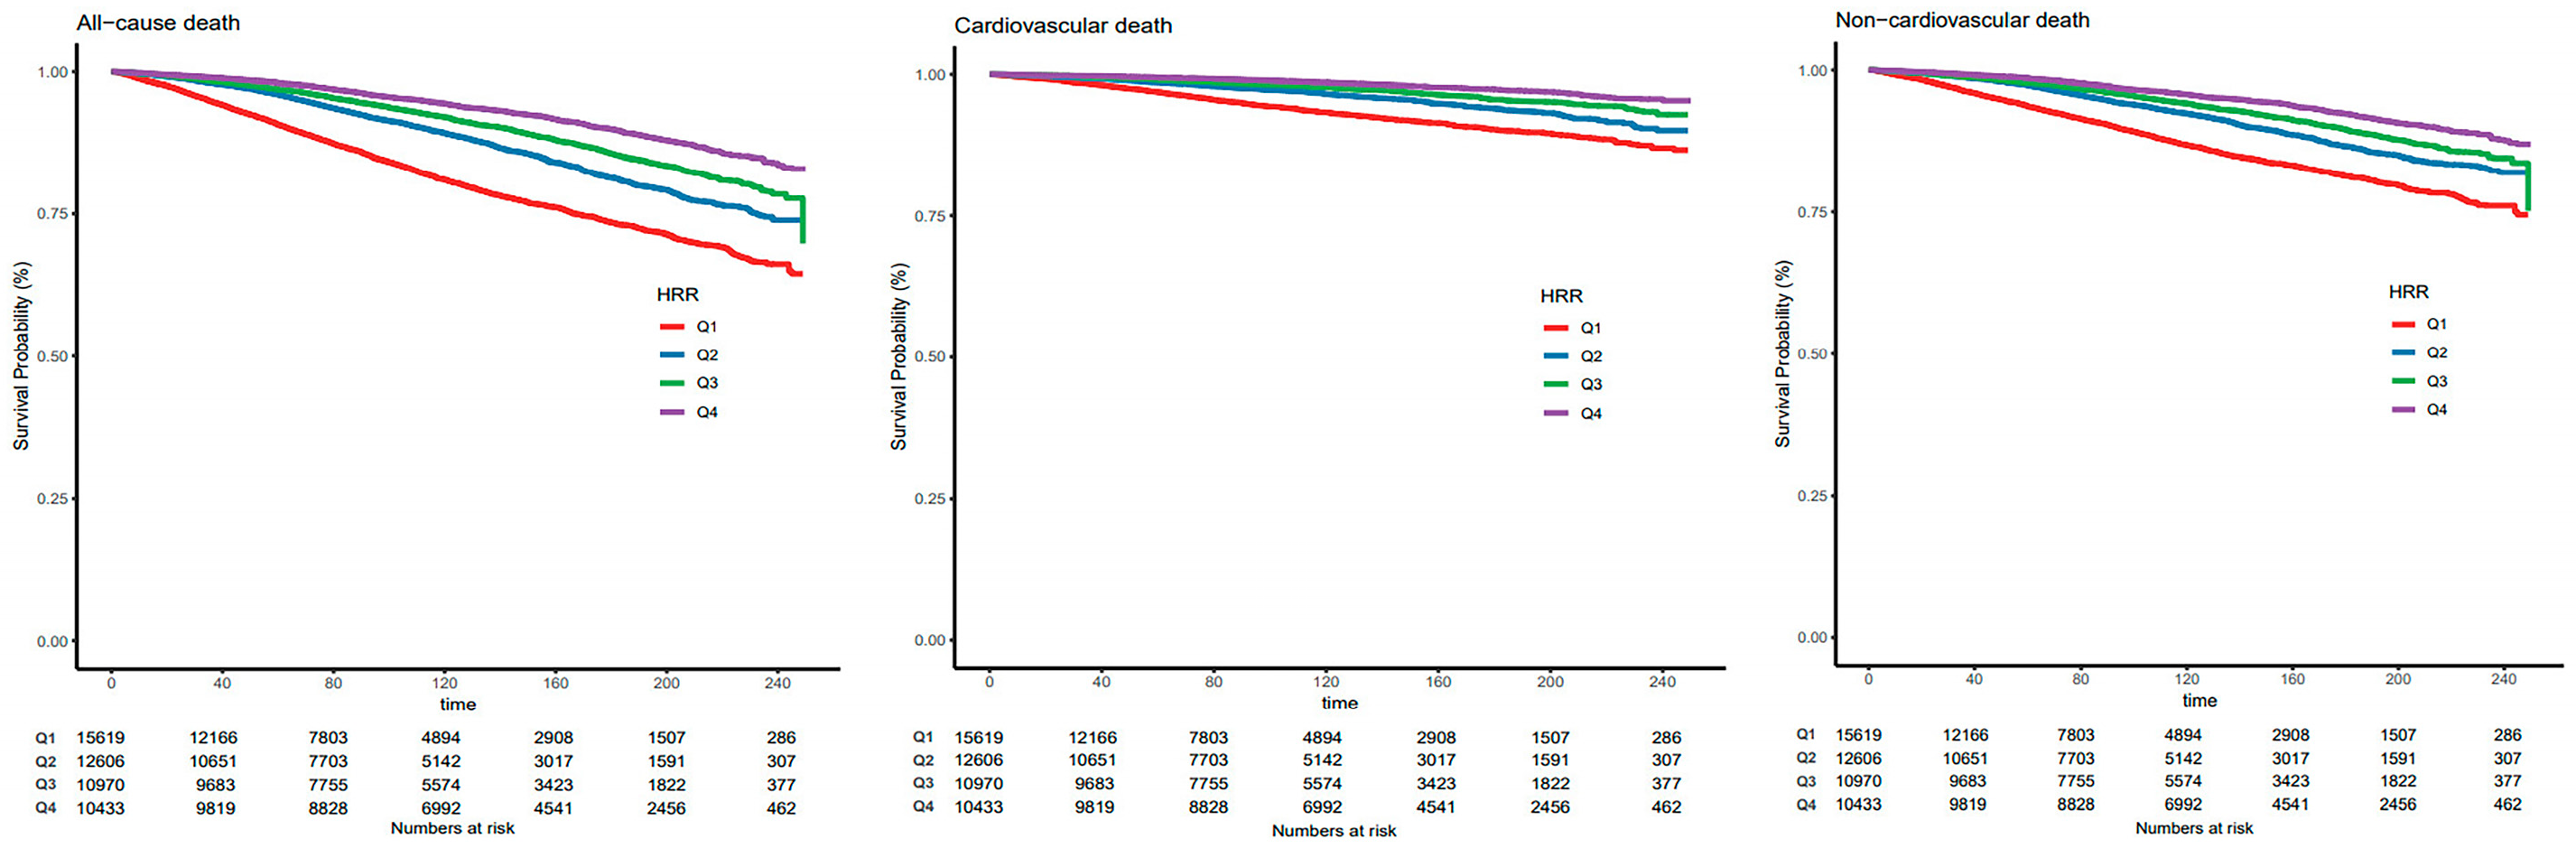
| The Risk of Death | Univariate Analysis | Model 1 | Model 2 |
|---|---|---|---|
| All-cause death | 0.78 (0.77, 0.80), <0.001 | 0.81 (0.79, 0.82), <0.001 | 0.82 (0.79, 0.85), <0.001 |
| All-cause death | |||
| Q1 | Ref. | Ref. | Ref. |
| Q2 | 0.58 (0.54, 0.62), <0.001 | 0.61 (0.57, 0.66), <0.001 | 0.66 (0.58, 0.74), <0.001 |
| Q3 | 0.45 (0.41, 0.49), <0.001 | 0.54 (0.49, 0.58), <0.001 | 0.62 (0.53, 0.74), <0.001 |
| Q4 | 0.32 (0.29, 0.34), <0.001 | 0.47 (0.43, 0.51), <0.001 | 0.52 (0.44, 0.61), <0.001 |
| p for trend | <0.001 | <0.001 | <0.001 |
| Cardiovascular death | 0.76 (0.74, 0.77), <0.001 | 0.79 (0.76, 0.81), <0.001 | 0.80 (0.75, 0.84), <0.001 |
| Cardiovascular death | |||
| Q1 | Ref. | Ref. | Ref. |
| Q2 | 0.56 (0.49, 0.64), <0.001 | 0.59 (0.52, 0.67), <0.001 | 0.62 (0.51, 0.76), <0.001 |
| Q3 | 0.38 (0.33, 0.44), <0.001 | 0.48 (0.42, 0.55), <0.001 | 0.56 (0.43, 0.73), <0.001 |
| Q4 | 0.25 (0.21, 0.29), <0.001 | 0.40 (0.34, 0.46), <0.001 | 0.45 (0.33, 0.61), <0.001 |
| p for trend | <0.001 | <0.001 | <0.001 |
| Non-cardiovascular death | 0.79 (0.78, 0.81), <0.001 | 0.82 (0.80, 0.84), <0.001 | 0.83 (0.79, 0.86), <0.001 |
| Non-cardiovascular death | |||
| Q1 | Ref. | Ref. | Ref. |
| Q2 | 0.59 (0.55, 0.64), <0.001 | 0.62 (0.57, 0.68), <0.001 | 0.67 (0.59, 0.77), <0.001 |
| Q3 | 0.48 (0.43, 0.53), <0.001 | 0.56 (0.51, 0.63), <0.001 | 0.65 (0.53, 0.80), <0.001 |
| Q4 | 0.35 (0.32, 0.39), <0.001 | 0.51 (0.46, 0.56), <0.001 | 0.56 (0.46, 0.67), <0.001 |
| p for trend | <0.001 | <0.001 | <0.001 |
| Variables | NRI | p-Value | IDI | p-Value |
|---|---|---|---|---|
| Basic model + hemoglobin | 0.081 (0.055, 0.107) | <0.001 | 0.005 (0.003, 0.006) | <0.001 |
| Basic model + RDW | 0.092 (0.067, 0.117) | <0.001 | 0.007 (0.006, 0.009) | <0.001 |
| Basic model + HRR | 0.095 (0.069, 0.121) | <0.001 | 0.009 (0.007, 0.011) | <0.001 |
Disclaimer/Publisher’s Note: The statements, opinions and data contained in all publications are solely those of the individual author(s) and contributor(s) and not of MDPI and/or the editor(s). MDPI and/or the editor(s) disclaim responsibility for any injury to people or property resulting from any ideas, methods, instructions or products referred to in the content. |
© 2025 by the authors. Licensee MDPI, Basel, Switzerland. This article is an open access article distributed under the terms and conditions of the Creative Commons Attribution (CC BY) license (https://creativecommons.org/licenses/by/4.0/).
Share and Cite
Li, M.; Li, H.; Zhong, W.; Wang, S.; Liu, R.; Cheng, H.; Li, L.; Wei, Q.; Wang, L. Hemoglobin-to-Red Cell Distribution Width Ratio Was Associated with Cardiovascular Diseases and Death. J. Clin. Med. 2025, 14, 4464. https://doi.org/10.3390/jcm14134464
Li M, Li H, Zhong W, Wang S, Liu R, Cheng H, Li L, Wei Q, Wang L. Hemoglobin-to-Red Cell Distribution Width Ratio Was Associated with Cardiovascular Diseases and Death. Journal of Clinical Medicine. 2025; 14(13):4464. https://doi.org/10.3390/jcm14134464
Chicago/Turabian StyleLi, Mengyi, Hanbin Li, Wen Zhong, Shiqi Wang, Rui Liu, Hongxin Cheng, Lijuan Li, Quan Wei, and Lu Wang. 2025. "Hemoglobin-to-Red Cell Distribution Width Ratio Was Associated with Cardiovascular Diseases and Death" Journal of Clinical Medicine 14, no. 13: 4464. https://doi.org/10.3390/jcm14134464
APA StyleLi, M., Li, H., Zhong, W., Wang, S., Liu, R., Cheng, H., Li, L., Wei, Q., & Wang, L. (2025). Hemoglobin-to-Red Cell Distribution Width Ratio Was Associated with Cardiovascular Diseases and Death. Journal of Clinical Medicine, 14(13), 4464. https://doi.org/10.3390/jcm14134464