Systematic Review

Electrophysiological and Imaging Biomarkers to Evaluate Exercise Training in Patients with Neuromuscular Disease: A Systematic Review

by
Lisa Pomp
1,
Jeroen Antonius Lodewijk Jeneson
1,
W. Ludo van der Pol
2 and
Bart Bartels
1,*
1
Child Development and Exercise Center, Wilhelmina Children’s Hospital, University Medical Center Utrecht, 3584 CX Utrecht, The Netherlands
2
Department of Neurology, Brain Center Rudolf Magnus, University Medical Center Utrecht, 3584 CX Utrecht, The Netherlands
*
Author to whom correspondence should be addressed.
J. Clin. Med. 2023, 12(21), 6834; https://doi.org/10.3390/jcm12216834
Submission received: 20 September 2023 / Revised: 13 October 2023 / Accepted: 18 October 2023 / Published: 29 October 2023

Abstract

:
Exercise therapy as part of the clinical management of patients with neuromuscular diseases (NMDs) is complicated by the limited insights into its efficacy. There is an urgent need for sensitive and non-invasive quantitative muscle biomarkers to monitor the effects of exercise training. Therefore, the objective of this systematic review was to critically appraise and summarize the current evidence for the sensitivity of quantitative, non-invasive biomarkers, based on imaging and electrophysiological techniques, for measuring the effects of physical exercise training. We identified a wide variety of biomarkers, including imaging techniques, i.e., magnetic resonance imaging (MRI) and ultrasound, surface electromyography (sEMG), magnetic resonance spectroscopy (MRS), and near-infrared spectroscopy (NIRS). Imaging biomarkers, such as muscle maximum area and muscle thickness, and EMG biomarkers, such as compound muscle action potential (CMAP) amplitude, detected significant changes in muscle morphology and neural adaptations following resistance training. MRS and NIRS biomarkers, such as initial phosphocreatine recovery rate (V), mitochondrial capacity (Qmax), adenosine phosphate recovery half-time (ADP t1/2), and micromolar changes in deoxygenated hemoglobin and myoglobin concentrations (Δ[deoxy(Hb + Mb)]), detected significant adaptations in oxidative metabolism after endurance training. We also identified biomarkers whose clinical relevance has not yet been assessed due to lack of sufficient study.

1. Introduction

The health impact of endurance exercise training lies in the improvement of cardiovascular and skeletal muscle function by improving oxidative metabolism through increasing capillary density, muscle blood flow, mitochondrial size and density, and enzyme activity in skeletal muscle. In addition, endurance training leads to decreased heart rate at rest, increased cardiac stroke volume, and increased total blood volume. The combination of these adaptations increases the aerobic work capacity and anaerobic threshold [1,2,3,4,5]. Resistance or strength training leads to increased power, increased lactic threshold, increased maximal oxygen uptake, and decreased body fat, and promotes neural adaptations, skeletal muscle hypertrophy, and strength gains in healthy people [6,7,8,9,10]. To monitor exercise training efficacy, non-invasive methodologies and various quantitative indices have been used as ‘biomarkers’ of muscle health. For example, magnetic resonance imaging (MRI), magnetic resonance spectroscopy (MRS), surface electromyography (sEMG), ultrasound, and near-infrared spectroscopy (NIRS) have been used in addition to conventional clinical outcome measures, such as peak force and peak torque [11,12,13,14,15,16]. MRI is a non-invasive method for creating detailed images of organs and tissues using magnetic fields and radiofrequency. The difference between various types of tissues can be seen based on the body’s natural magnetic properties [17]. MRS non-invasively measures the concentrations of tissue metabolites, providing information on a wide range of biochemical processes in the body in vivo [18]. In muscles, phosphorus MRS (31P MRS) is mostly used to monitor muscle energy metabolism [19]. sEMG assesses the myoelectric output of a muscle, such as the intensity of muscle contraction, the myoelectric expression of muscle fatigue, and the recruitment of motor units [20,21]. Ultrasound utilizes sound waves to produce non-invasive internal images, and NIRS measures the tissue oxygen status [22].
Exercise may represent a therapy approach for patients with neuromuscular diseases (NMDs) characterized by reduced muscle strength and endurance, but its application is limited by the heterogeneity of NMD, safety concerns, and limited insights into which strategies work best. NMDs constitute a heterogeneous group of probably more than 500 genetic and acquired disorders characterized by dysfunction of the peripheral neuromuscular system, i.e., motor-neurons, nerves, neuromuscular junctions, and muscles [23]. Many NMDs are progressive, causing increasing levels of disability due to muscular weakness, exercise intolerance, and fatigue [24]. This may result in a vicious cycle of incremental inactivity, leading to further deconditioning, loss of muscular strength, and increased fatigability. Since there is no cure for the majority of known NMDs, the primary aim of treatment is to maintain function and mobility [11], to which exercise therapy could contribute.
The efficacy of exercise training approaches in patients with NMD is largely unknown. Most NMDs are rare, which hampers the execution of larger studies. Moreover, exercise intervention protocols often differ regarding the frequency, intensity, type, and time (FITT factors), and functional outcome measures may not always be suitable for the training intervention [24,25].
These inherent limitations, when exploring the efficacy of exercise training in NMD, could at least partially be addressed using sensitive biomarkers [26]. Biomarkers would allow the quantitative assessment of training efficacy within the spectrum of NMDs, caused by changes in the physiology or function of the motor unit [27]. In addition, biomarkers can be used as a tool to maintain the safety of an intervention program by monitoring potential complications, such as muscle inflammation or edema [28].
The objective of this systematic review is, therefore, to critically appraise and summarize the evidence for the sensitivity of available, quantitative, non-invasive imaging and electrophysiological biomarkers used to measure the effect of a physical exercise training intervention in people with an NMD.

2. Methods

The review was not registered, and the review protocol was not prepared.

2.1. Eligibility Criteria

We included studies in which the study design fulfilled all the following criteria:
(1)
The patients studied had a confirmed diagnosis of neuromuscular disease (we excluded patients with diagnoses of diabetic neuropathies, compression, or entrapment neuropathies,, radiculopathy, thoracic outlet syndrome, or complex regional pain syndrome).
(2)
The study involved a longitudinal exercise intervention of more than 6 weeks, the minimal period for neural adaptations.
(3)
The key outcomes were measured by MRI, MRS, sEMG, ultrasound, or NIRS.
(4)
The study included a comparison with non-exercise intervention controls within NMD patients, and/or a comparison before and after the intervention within NMD patients, and/or a comparison with healthy controls.
We excluded animal studies, case reports, and studies with invasive measurement techniques.

2.2. Search Strategy

We searched PubMed, EMBASE, CINAHL, and Cochrane databases to identify all original articles concerning human neuromuscular disease studies with imaging and/or electrophysiological biomarkers for exercise therapy. We included articles up until 9 January 2023. The search strategy included three main components: (1) ‘neuromuscular disease’; (2) ‘exercise therapy’ OR ‘exercise’; and (3) ‘magnetic resonance imaging (MRI)’ OR ‘magnetic resonance spectroscopy (MRS)’ OR ‘ultrasonography’ OR ‘electromyography (EMG)’ OR ‘Spectroscopy, Near-Infrared (NIRS)’. The terms consisted of title abstract keywords and indexed subject headings (MeSH and Emtree terms in the databases). The full search string can be found in Supplementary Materials—Tables S1–S4. We imported all retrieved studies to EndNote 20 software (Thomson Reuters, NY, USA) and removed duplicates.

2.3. Study Selection and Data Extraction

Two of the authors (L.P. and B.B.) screened article references independently against the inclusion criteria. First, title and abstract (TIAB) screening were performed using Rayyan (www.rayyan.ai, Qatar Computing Research Institute (QCRI), Doha, Qatar. URL accessed on 9 January 2023). Second, two researchers (L.P. and B.B.) performed a full-text screening independently. Any disagreements regarding the inclusion or exclusion of a particular publication were resolved by discussion. One author (L.P.) performed the data extraction of the following study characteristics from eligible records:
  • Method: date of the study and study type.
  • Participants: number, age, gender, disease, and baseline characteristics.
  • Interventions: intervention (frequency, intensity, type, time), comparison, concomitant treatments, and excluded treatments.
  • Outcomes: primary and secondary outcomes specified and collected, and time points. p-values were provided when given.

2.4. Risk of Bias

Two authors (L.P. and B.B.) independently appraised the study quality. We used the Cochrane Risk of Bias 2.0 (RoB 2) tool to assess the risk of bias in randomized controlled trials (RCTs) [29]. Furthermore, we assessed the non-randomized controlled trials with The Risk Of Bias In Non-randomized Studies-of Interventions (ROBINS-I) assessment tool [30]. We rated the pre–post studies using the Quality Assessment Tool for Before–After (Pre–Post) Studies with No Control Group (12 items) of the National Institutes of Health (NIH). We subsequently classified the RCTs and pre–post studies as low, with some concerns or a high risk of bias using the guidance provided within the appointed tools. The non-randomized controlled trials were classified as low, moderate, serious, and critical risk of bias using ROBINS-I.

2.5. Best Evidence Synthesis

We identified imaging and electrophysiological biomarkers from the studies with a low risk of bias or with some concerns and excluded the studies with a high or serious risk of bias. To gain insight into the sensitivity of the biomarkers, we compared the effect of endurance and/or resistance training on functional outcomes per study with the effect measured by imaging and electrophysiological biomarkers.

3. Results

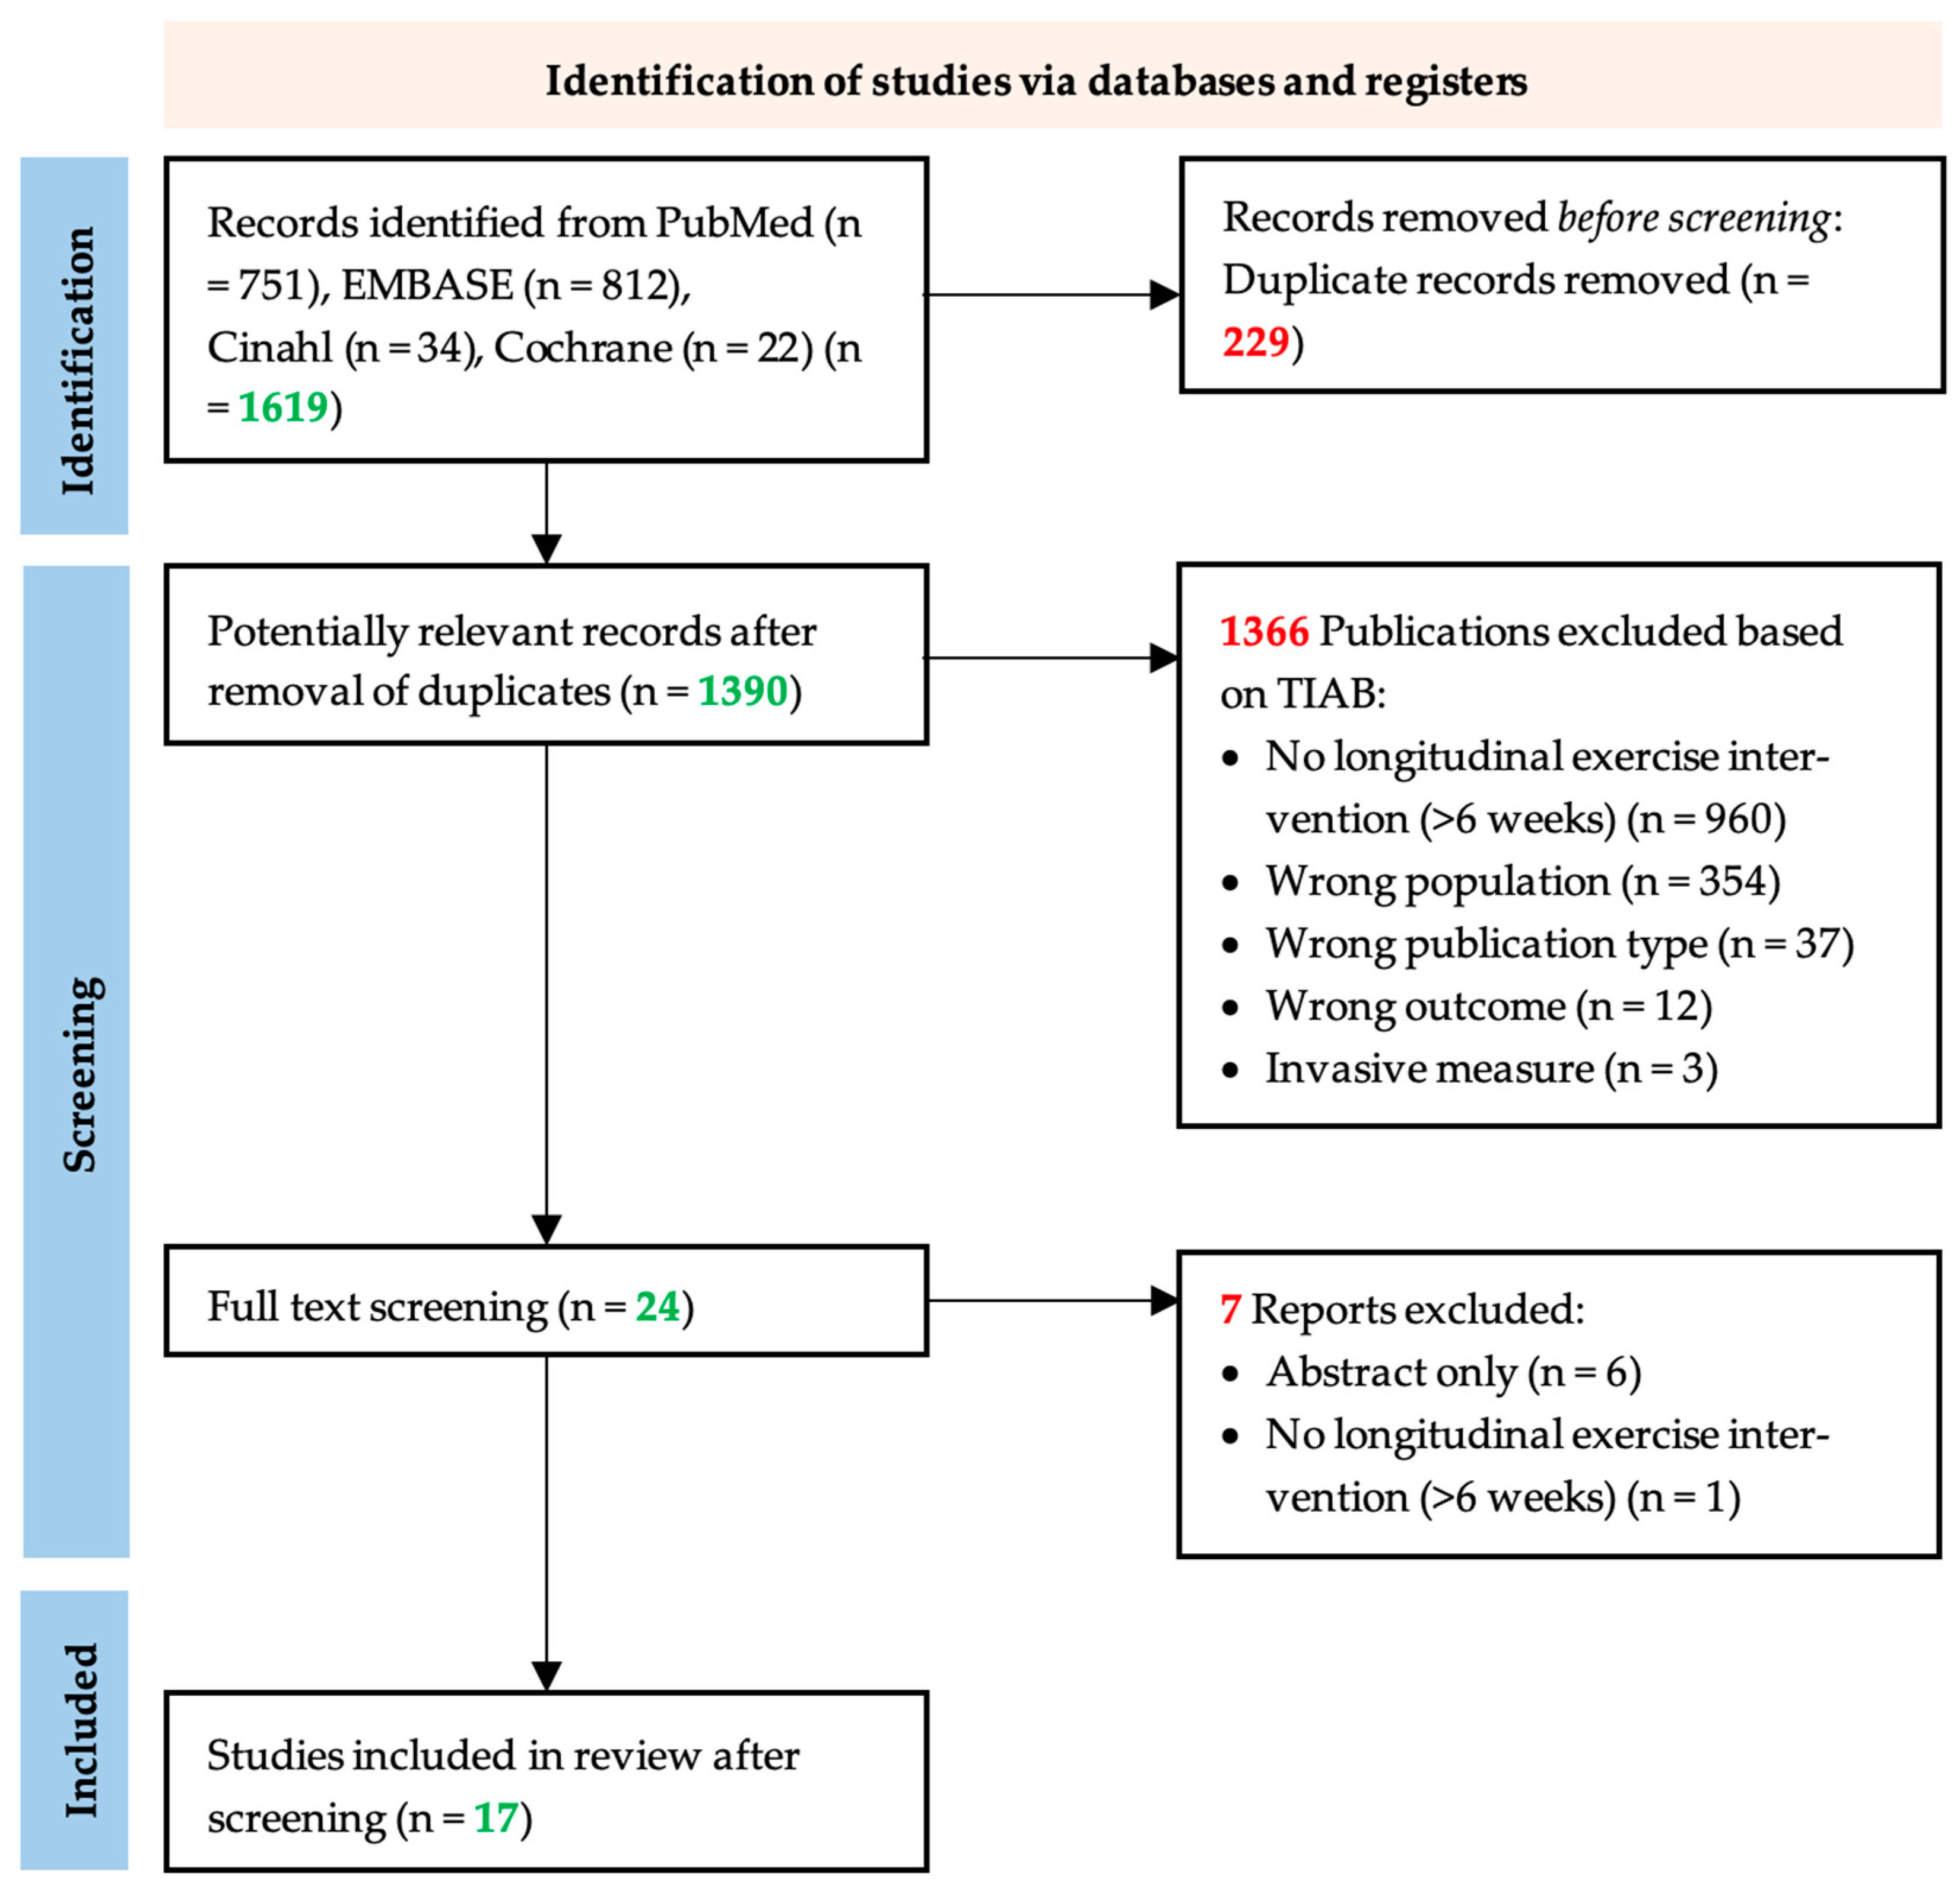
3.1. Study Selection

The bibliographic search strategy retrieved a total of 1619 articles, including 812 from EMBASE, 751 from PubMed, 34 from CINAHL, and 22 from Cochrane (Figure 1). After the removal of duplicates, we screened 1390 unique articles based on titles and abstracts. During this title and abstract screening, we excluded 1366 studies, leaving 24 articles for full-text screening. After full-text screening, we excluded seven more articles because the article appeared to be abstract only (n = 6) or the intervention appeared to have been shorter than 6 weeks (n = 1). Finally, we included 17 studies in this systematic review.

3.2. Study Characteristics and Quality Assessment

The 17 included studies featured a wide variety of study designs, neuromuscular diseases, intervention characteristics, and outcome biomarkers. The results of the quality assessment of the 17 included records are summarized in Table 1. We included five RCTs, one non-randomized controlled study, and eleven pre–post studies with no control. According to the ROB-2 quality assessment tool for RCTs, we rated three studies [26,32,33] as having a high risk of bias, one record [34] as having some concerns with the risk of bias, and one record [35] as a low risk of bias. We rated one study [36] as having a serious risk of bias according to the ROBIN-1 quality assessment tool. Furthermore, according to the NIH Pre–post quality assessment for non-controlled studies, we rated two studies [37,38] as poor study quality, and nine records [39,40,41,42,43,44,45,46,47] as fair study quality.
To elaborate on the factors causing a risk of bias, none of the studies reported whether the sample size was sufficiently large to provide statistical power in the findings and all studies lacked or did not report blinding of both their patients and assessors. Furthermore, the studies lacked an interrupted time-series design of the outcome measures. For the RCTs, the risk of bias was determined mainly due to deviations from the intended interventions. Another identified risk of bias was non-adherence and the lack of appropriate analysis to estimate the effect of the non-adherence in four studies. For more detail, we refer to the full report of the quality assessment in Supplementary Materials—Tables S5–S7.
Table 1 summarizes the main patient characteristics of the studies. Overall, the 17 studies included 212 patients representing 11 different NMDs. Population cohorts consisted of 50 patients with mitochondrial myopathy (MM), 38 patients with Charcot–Marie–Tooth disease (CMT), 26 patients with myasthenia gravis (MG), 24 patients with Polymyositis (PM), 18 patients with Duchenne muscular dystrophy (DMD), 15 patients with dermatomyositis (DM), 10 patients with chronic unspecified non-metabolic myopathies (NMM), 9 patients with facioscapulohumeral muscular dystrophy type 1 (FSHD1), 9 patients with myotonic dystrophy (MD), 7 patients with McArdle disease (McA), and 6 patients with Post Polio Syndrome (PPS). The age range was between 8 and 80 years.

3.3. Exercise Intervention Characteristics

Table 2 presents the exercise characteristics of the studies regarding the FITT factors. The range of the intervention duration was between 8 weeks and 6 months, with the number of sessions varying between 20 and 130 sessions. The exercise interventions were performed at moderate and high intensity with, e.g., maximal heart rate at 80%. The studies also varied regarding the type of exercise; most studies focused on endurance exercise (n = 8), some on both resistance (or strength) exercise and endurance exercise (n = 5), and a few on resistance exercise alone (n = 5).

3.4. Best Evidence Synthesis

3.4.1. Biomarkers Measured by MRI

Eight records used MRI-derived biomarkers to investigate the effect of exercise training as can be seen in Table 3.
From the studies with the best evidence (some concerns and low risk of bias), the MRI biomarkers measured were muscle volume or area [35,39,41,43], fat infiltration [35,37,38,41], inflammatory changes [37,38,41], and muscle damage [47].
Trenell et al. (2005) performed endurance training for 12 weeks in patients with MM and observed significant effects on endurance-based functional measures, as shown in Supplementary Materials—Table S8 [43]. MRI showed significant gains of muscle volume and muscle maximum area after the training program.
Burns et al. (2017) performed resistance training for 6 months in patients with CMT and observed a significant effect on strength dorsiflexion but not on gait nor Charcot–Marie–Tooth disease Pediatric Scale (CMTPedS) score [35]. However, no significant effects were seen on the MRI biomarkers of muscle volume or fat infiltration. Similarly, Spector et al. (1996) executed resistance training for 10 weeks in patients with PPS and observed significant effects of resistance-based functional measures [39]. No endurance-based functional measures were present in this study. Again, no significant effects were seen on the MRI biomarker muscle maximum area. Tollbäck et al. (1999) studied the effect of a resistance training program lasting 12 weeks in patients with MD and observed a significant effect on resistance-based functional measures as well [41]. No significant effects were seen on muscle maximum area or fat infiltration. In addition, the safety of training was supported by the lack of an increase in inflammatory changes. Lott et al. (2021) used only MRI to measure the muscle damage biomarker as a safety measure. After a resistance training program of 12 weeks in patients with DMD, they detected no significant detrimental effect on muscle morphology [47].

3.4.2. Biomarkers Measured by MRS

Five studies evaluated metabolic biomarkers measured with MRS as presented in Table 3. The best evidence metabolic biomarkers were resting phosphocreatine (PCr) [43], resting adenosine diphosphate (ADP) [43], resting pH [43], PCr hydrolysis during exercise [43], pH fall during exercise [43], end exercise ADP [43], initial PCr recovery rate (V) [42,43], mitochondrial capacity (Qmax) [42,43], pH recovery rate [43], capacity of the proton efflux system (dE/d(pH fall) rate) [43], muscle oxidative capacity (ADP t1/2) [36,40], and PCr/beta-nucleoside triphosphate (β-NTP) ratio [34].
After the 8-week endurance training program in MM patients (1998), significant effects were seen on endurance-based functional measures (Supplementary Materials—Table S8). Furthermore, this study showed that endurance exercise training improved muscle oxidative capacity (ADP t1/2) significantly. Similarly, Taivassalo et al. (2001) performed endurance training in patients with MM for 14 weeks and observed significant effects on endurance-based functional measures, such as work capacity. This study showed significant changes in the MRS biomarkers V and Qmax [42]. Trenell et al. (2005) performed endurance training for 12 weeks in patients with MM and again observed significant V and Qmax effects, but not other MRS biomarkers [43]. Chung et al. (2007) showed significant effects in endurance-based functional measures, but not in resistance-based functional measures after a combined endurance and resistance exercise intervention of 6 months in PM and DM patients [34].

3.4.3. Biomarkers Measured by EMG

sEMG was used to measure electrophysiological biomarkers (fatigue indices, root mean square, coactivation percentage, mean frequency, and compound muscle action potential (CMAP)), as can be seen in Table 3.
Mhandi et al. (2007) [44] performed interval endurance training for 24 weeks in patients with CMT and observed significant effects on both endurance-based and resistance-based functional measures, as can be seen in Supplementary Materials—Table S8. However, no significant effects were seen on the sEMG biomarkers fatigue indices, root mean square, coactivation percentage, or mean frequency.
Westerberg et al. (2018) demonstrated significant effects on endurance-based and resistance-based functional measures, such as isometric muscle force in the quadriceps but not in the biceps brachii, after 12 weeks of combined endurance and resistance training in patients with MG [46]. The CMAP of the quadriceps, but not biceps, changed significantly after the training program.

3.4.4. Biomarkers Measured by Ultrasound

The thickness of the muscle [33,46], the pennation angle [33], and the fascicle length [33] were measured by ultrasound in the best-evidenced studies.
Westerberg et al. (2018) [46] demonstrated a significant increase in the thickness of the rectus femoris and vastus intermedius, but not the biceps brachii, after a combined endurance and resistance training lasting 12 weeks in patients with MG. Endurance-based and resistance-based functional measures, such as the 30 s chair stand test, improved significantly as well.

3.4.5. Biomarkers Measured by NIRS

NIRS was only used in one study to detect training effects. The biomarker measured with NIRS in the study by Porcelli et al. (2016) was the micromolar change in deoxygenated hemoglobin and myoglobin concentrations (Δ[deoxy(Hb + Mb)]) [45]. After an endurance training program of 12 weeks in patients with MM and McA, significant effects were seen on endurance-based and resistance-based functional measures for both diseases. Significant effects on Δ[deoxy(Hb + Mb)] were also seen in patients with MM and McA.

3.5. Quality of Evidence

As we considered the studies in this systematic review to be heterogeneous with regard to the study population, methodological quality, FITT factors, and assessment of functional outcomes, we refrained from statistically pooling the data.

4. Discussion

This review includes 17 studies regarding the effect of exercise training on imaging and electrophysiological biomarkers in 242 people with NMDs [26,32,33,34,35,36,37,38,39,40,41,42,43,44,45,46,47]. Exercise duration ranged from 8 to 26 weeks, using endurance, resistance, or both types of training. The studies included 28 different biomarkers that were measured by five techniques, MRI, MRS, sEMG, ultrasound, and NIRS, with MRI being applied most often (n = 8 records). The risk of bias was variable, but mostly with some concerns (n = 10) or high risk (n = 6). This was mainly caused by small sample sizes, lack of blinding of participants and outcome assessors, only two time-point measurements, and no appropriate analysis when deviations from the intended interventions occurred. Although other reviews only consider studies with a low risk of bias [48] due to the fundamental nature of exercise interventional studies in a rare disorder with small sample sizes and inadequate blinding of participants and/or assessors, we included studies with some concerns of bias as well in the best evidence synthesis.
All studies on endurance training or combined training showed a significant increase in endurance-based functional measures. Only Trenell et al. (2005) used MRI to measure the effect of endurance training on muscle volume and muscle maximum area. The result was a significant increase in both biomarkers [43]. However, this was unexpected as endurance training does not induce hypertrophy [49]. It is possible that the intensity of the endurance program also implied the recruitment of type II muscle fibers. Another possibility would be that muscle hypertrophy was caused by mechanical tension, metabolic stress, or muscle damage [50]. MRS biomarkers were investigated mainly after endurance training, as MRS detects changes in muscle energy metabolism. V, Qmax, and ADP t1/2 improved significantly after endurance training, and therefore appear to be sensitive for detecting exercise effects. Mhandi et al. (2007) did not show significant effects in sEMG biomarkers after endurance training [44]. However, trends of improvements in these outcomes were observed in the fatigue indices and coactivation percentage. With NIRS, the effect of endurance training was also observed. Δ[deoxy(Hb + Mb)] was increased significantly in MM and McA, which implies an improvement in skeletal muscle oxidative metabolism. This is in line with our hypothesis, as endurance training causes metabolic and thus oxidative adaptations.
All studies on resistance training or combined training showed a significant increase in resistance-based functional measures, except Chung et al. (2007) [34]. The hypothesis is that resistance training leads to a decrease in body fat, neural adaptations, and skeletal muscle hypertrophy in addition to improved functional outcomes, such as strength gains. However, in the studies by Burns (2017), Spector (1996) and Tollbäck (1999), no significant changes in muscle morphology were seen with MRI after resistance training [35,39,41]. In healthy subjects, muscle hypertrophy can already be detected with MRI after 3 weeks of resistance training [51]. Therefore, it can be stated that muscle maximum area or volume could be sensitive biomarkers for detecting training effects; however, in the NMDs studied, these changes are negligible. Interestingly, Westerberg et al. (2018) did observe a significant increase in muscle thickness after resistance training using ultrasound [46]. This study did not use MRI, and we did not identify other comparative studies. It is, therefore, unclear whether ultrasound is more sensitive than MRI for detecting changes. The CMAP amplitude represents the sum of motor unit action potentials in the muscle, influenced by factors such as muscle fiber number and size, and the synchronization of the muscle fibers depolarization. The CMAP amplitude showed a significant increase in the quadriceps after a combined training program. This is in line with the study by Molin et al. (2016), where CMAP amplitude was higher in the resistance-trained healthy population in comparison to the not-trained healthy population. CMAP amplitude correlated with isometric muscle strength [52].
This systematic review revealed a great number of imaging and electrophysiological biomarkers with little uniformity to assess exercise training. It is important to establish a standardized set of outcomes based on the exercise intervention to enable comparisons of data across studies. This will ensure that key outcomes are consistently measured and reported, facilitating more accurate and meaningful interpretations of exercise research results. Moreover, it is key to investigating the biomarkers complementary to the exercise type for future research.
It is hard to speculate whether the biomarkers would indicate a similar result with a different disease population or a slightly different intervention program. For example, one study showed a significant effect on muscle volume [43] that other records did not [35,39]. Additionally, it was demonstrated that the results could be dependent on specific muscle types. To give an example, in the study by Westerberg et al. (2018), the exercise intervention only had a significant effect on the rectus femoris and vastus intermedius and not on the biceps brachioradialis as far as muscle thickness was concerned, even though the biceps brachioradialis was also trained [46]. Therefore, it is difficult to compare the results of the shared biomarkers between different patient populations, exercise interventions, genders, and ages.
Most studies investigating the effect of training do not use any imaging or electrophysiological biomarkers, but rather, they focus mainly on functional outcomes [11,48]. Significant training effects can be measured by these functional outcomes (Supplementary Materials—Table S8). All 11 best-evidenced studies showed significant improvements in functional measures. Therefore, we can state that the functional tests are a valid method for detecting training effects. However, functional tests do not explain fundamentally how and where these improvements were made. The use of multiple functional tests would allow us to distinguish which muscles or parts of the body improved. Moreover, the great advantage of more fundamental imaging and electrophysiological biomarkers is that they can clarify which part of the motor unit function improved or which part of the motor unit is misfunctioning in a specific disease or person. Moreover, the training intervention can be modified because of these outcomes to offer patients a more specified training intervention. For wider clinical implications, to be able to enhance personalized and supervised exercise training for patients, these significant evidence-based results need to be translated into clinical care.
A striking finding in the study by Janssen et al. (2016) is that the fat fraction increase normalized per year was significantly decelerated after the endurance training intervention compared to usual care [26]. In the functional tests, no significant effect of the training intervention was observed. Although this paper contains a high risk of bias, it presents the potential of the biomarkers, as muscle adaptations after an exercise intervention could be measured earlier than with a functional test. In the other studies of this systematic review, a significant training effect was measured with functional outcomes when a significant effect was measured with imaging or electrophysiological biomarkers.
A limitation of most studies included is that they only compare the results before and after the training intervention or with healthy controls. More measurement time points could provide more knowledge on the development of imaging or electrophysiological biomarkers. In addition, with progressive neuromuscular diseases, a stabilization of the biomarkers could also mean the exercise intervention has a significant effect. The best ways to investigate whether the patients stabilized or improved are to either compare the intervention group with the usual care group or to include additional pre-intervention measurement time points. Therefore, biomarkers which do not show a significant difference could still be clinically relevant for measuring the exercise training effect. Unfortunately, we cannot draw conclusions about which biomarkers would still be clinically relevant due to a lack of information on the natural history of the diseases.
For future studies of endurance training, it is recommended that V, Qmax, ADP t1/2, and/or Δ[deoxy(Hb + Mb)] are used as biomarkers to detect changes in oxidative adaptations. For resistance training, muscle maximum area, thickness, and/or CMAP amplitude are recommended for monitoring training effects. These biomarkers showed a significant change after a training protocol in various NMDs. For monitoring muscle damage or inflammation, the safety biomarkers measured with MRI are recommended, as in certain NMDs, training programs still involve risks.
In the future, imaging and electrophysiological biomarkers can play a significant role in guiding decision-making, informing treatment strategies, and improving patient outcomes in several ways. For instance, imaging and electrophysiological techniques can aid in diagnosing NMDs and assessing their severity. Biomarkers provide objective data on, e.g., the extent of motor neuron loss, muscle atrophy, and neuromuscular dysfunction. Furthermore, the mentioned biomarkers can help clinicians choose the most appropriate treatment for patients with NMDs, for example, in spinal muscle atrophy (SMA). SMA is characterized by the deterioration of the spinal cord α-motor neurons, resulting in severe muscle weakness and wasting [53]. The treatment of SMA has undergone significant changes with the introduction of the first effective disease-modifying treatments. The next phase in the ongoing care of SMA patients involves the development of combined therapies that include SMN replacement treatment and additional approaches aimed at preserving and enhancing the entire motor unit, encompassing motor neurons, neuromuscular junctions, and muscles, throughout various stages of the disease [54,55,56]. Clinicians can use biomarkers to determine the level of muscle wasting, helping to decide whether the patient is a candidate for (innovative) SMN-enhancing drugs and/or supportive care interventions. Not only could these validated sensible biomarkers be used to monitor training effects, but also to measure the effect of medication treatments or combinatorial treatments. Biomarkers can serve as objective endpoints to measure treatment efficacy, allowing for more efficient and informative trials. Biomarkers can clarify where, exactly, the adaptations occur in the motor unit when treatment mechanisms are unknown. Moreover, these biomarkers could detect treatment response in a patient before clinical symptoms become apparent and could help decision-making to continue or to end a treatment intervention, to reduce costs and patient burden. Lastly, biomarkers could help to design personalized treatment interventions. By assessing the unique biomarker profile of each patient, clinicians can tailor treatment strategies to address specific needs and vulnerabilities. This individualized approach can lead to more effective and improved outcomes.

5. Conclusions

This systematic review critically evaluated the use of non-invasive imaging and electrophysiological biomarkers to assess the effect of physical exercise training in patients with NMDs. We identified a variety of biomarkers which were measured with techniques such as MRI, MRS, sEMG, ultrasound, and NIRS. The biomarkers V, Qmax, ADP t1/2, and Δ[deoxy(Hb + Mb)] detect significant adaptations in oxidative metabolism after endurance training when significant effects were observed on endurance-based functional measures. Furthermore, muscle maximum area, thickness, and CMAP amplitude were able to detect significant muscle morphology and neural adaptations after resistance training, when significant effects were observed on resistance-based functional measures as well. Although functional measures are more sensitive than these biomarkers for detecting training effects, the added value of these biomarkers is that they explain the more fundamental adaptations in the muscle that cause the functional effects. Therefore, these biomarkers are recommended for monitoring exercise effects alongside functional measures. The other identified biomarkers cannot be rejected, as they may still be clinically relevant. With the biomarkers, a more specified training program can be designed for the various NMDs.

Supplementary Materials

The following supporting information can be downloaded at: https://www.mdpi.com/article/10.3390/jcm12216834/s1, Table S1: Search string in PubMed; Table S2: Search string in EMBASE; Table S3: Search string in CINAHL; Table S4: Search string in Cochrane; Table S5: NIH Pre–Post Quality Assessment; Table S6: Cochrane ROB-2 Quality Assessment; Table S7: Cochrane ROBINS-1 Quality Assessment; Table S8: Baseline and follow-up measurement functional tests.

Author Contributions

Conceptualization, L.P. and B.B.; methodology, L.P.; validation, B.B.; investigation, L.P.; writing—original draft preparation, L.P.; writing—review and editing, L.P., B.B., J.A.L.J. and W.L.v.d.P.; visualization, L.P.; supervision, B.B., J.A.L.J. and W.L.v.d.P.; project administration, B.B., J.A.L.J. and W.L.v.d.P.; funding acquisition, B.B., J.A.L.J. and W.L.v.d.P. All authors have read and agreed to the published version of the manuscript.

Funding

This research was funded by Stichting Spieren voor Spieren (V0001208) and Piet Poortman Fonds (V0001208).

Institutional Review Board Statement

Not applicable.

Data Availability Statement

No new data were created or analyzed in this study. Data sharing is not applicable to this article.

Conflicts of Interest

L.P. declares no conflict of interest. B.B. and J.A.L.J. receive research grants from Prinses Beatrix Spierfonds, Stichting Spieren voor Spieren, Health Holland and Piet Poortman Fonds all non-profit foundations. B.B.’s employer, UMC Utrecht, receives fees for SMA-related consultancy activities. W.L.P. recives research grants from Prinses Beatrix Spierfonds and Stichting Spieren voor Spieren, both non-profit foundations. His employer receives fees for SMA-related consultancy activities. The funders had no role in the design of the study; in the collection, analyses, or interpretation of data; in the writing of the manuscript; or in the decision to publish the results.

References

  1. Holloszy, J.O.; Coyle, E.F. Adaptations of skeletal muscle to endurance exercise and their metabolic consequences. J. Appl. Physiol. 1984, 56, 831–838. [Google Scholar] [CrossRef] [PubMed]
  2. Saltin, B. Physiological adaptation to physical conditioning: Old problems revisited. Acta Medica Scand. 1986, 220, 11–24. [Google Scholar] [CrossRef]
  3. Cox, M.H. Exercise training programs and cardiorespiratory adaptation. Clin. Sports Med. 1991, 10, 19–32. [Google Scholar] [CrossRef] [PubMed]
  4. Henriksson, J. Effects of physical training on the metabolism of skeletal muscle. Diabetes Care 1992, 15, 1701–1711. [Google Scholar] [CrossRef]
  5. Neufer, P.D. The effect of detraining and reduced training on the physiological adaptations to aerobic exercise training. Sports Med. 1989, 8, 302–320. [Google Scholar] [CrossRef] [PubMed]
  6. Boutcher, S.H. High-intensity intermittent exercise and fat loss. J. Obes. 2011, 2011, 868305. [Google Scholar] [CrossRef]
  7. Rhea, M.R.; Oliverson, J.R.; Marshall, G.; Peterson, M.D.; Kenn, J.G.; Ayllón, F.N. Noncompatibility of Power and Endurance Training Among College Baseball Players. J. Strength Cond. Res. 2008, 22, 230–234. [Google Scholar] [CrossRef]
  8. Folland, J.P.; Williams, A.G. The adaptations to strength training: Morphological and neurological contributions to increased strength. Sports Med. 2007, 37, 145–168. [Google Scholar] [CrossRef]
  9. Gabriel, D.A.; Kamen, G.; Frost, G. Neural adaptations to resistive exercise: Mechanisms and recommendations for training practices. Sports Med. 2006, 36, 133–149. [Google Scholar] [CrossRef] [PubMed]
  10. Legerlotz, K.; Marzilger, R.; Bohm, S.; Arampatzis, A. Physiological Adaptations following Resistance Training in Youth Athletes—A Narrative Review. Pediatr. Exerc. Sci. 2016, 28, 501–520. [Google Scholar] [CrossRef]
  11. Stefanetti, R.J.; Blain, A.; Jimenez-Moreno, C.; Errington, L.; Ng, Y.S.; McFarland, R.; Turnbull, D.M.; Newman, J.; Gorman, G.S. Measuring the effects of exercise in neuromuscular disorders: A systematic review and meta-analyses. Wellcome Open Res. 2020, 5, 84. [Google Scholar] [CrossRef] [PubMed]
  12. Habets, L.E.; Bartels, B.; Asselman, F.-L.; Hooijmans, M.T.; Berg, S.v.D.; Nederveen, A.J.; van der Pol, W.L.; Jeneson, J.A.L. Magnetic resonance reveals mitochondrial dysfunction and muscle remodelling in spinal muscular atrophy. Brain 2022, 145, 1422–1435. [Google Scholar] [CrossRef] [PubMed]
  13. Habets, L.E.; Bartels, B.; Asselman, F.-L.; Hulzebos, E.H.; Stegeman, D.F.; Jeneson, J.A.; van der Pol, W.L. Motor Unit and Capillary Recruitment During Fatiguing Arm-Cycling Exercise in Spinal Muscular Atrophy Types 3 and 4. J. Neuromuscul. Dis. 2022, 9, 397–409. [Google Scholar] [CrossRef] [PubMed]
  14. Beretta-Piccoli, M.; Boccia, G.; Ponti, T.; Clijsen, R.; Barbero, M.; Cescon, C. Relationship between Isometric Muscle Force and Fractal Dimension of Surface Electromyogram. BioMed Res. Int. 2018, 2018, 846. [Google Scholar] [CrossRef]
  15. Beretta-Piccoli, M.; Calanni, L.; Negro, M.; Ricci, G.; Bettio, C.; Barbero, M.; Berardinelli, A.; Siciliano, G.; Tupler, R.; Soldini, E.; et al. Increased resistance towards fatigability in patients with facioscapulohumeral muscular dystrophy. Eur. J. Appl. Physiol. 2021, 121, 1617–1629. [Google Scholar] [CrossRef]
  16. Moreira, A.L.; Mendonça, R.H.; Polido, G.J.; Oliveira, M.C.B.; Silva, A.M.S.; Zanoteli, E. Muscle Ultrasound Changes Correlate With Functional Impairment in Spinal Muscular Atrophy. Ultrasound Med. Biol. 2023, 49, 1569–1574. [Google Scholar] [CrossRef]
  17. Katti, G.; Ara, S.A.; Shireen, A. Magnetic resonance imaging (MRI)–A review. Int. J. Dent. Clin. 2011, 3, 65–70. [Google Scholar]
  18. Cox, I. Development and applications of in vivo clinical magnetic resonance spectroscopy. Prog. Biophys. Mol. Biol. 1996, 65, 45–81. [Google Scholar] [CrossRef]
  19. Argov, Z.; Bank, W.J. Phosphorus magnetic resonance spectroscopy (31P MRS) in neuromuscular disorders. Ann. Neurol. Off. J. Am. Neurol. Assoc. Child Neurol. Soc. 1991, 30, 90–97. [Google Scholar] [CrossRef] [PubMed]
  20. Pilkar, R.; Momeni, K.; Ramanujam, A.; Ravi, M.; Garbarini, E.; Forrest, G.F. Use of Surface EMG in Clinical Rehabilitation of Individuals With SCI: Barriers and Future Considerations. Front. Neurol. 2020, 11, 578559. [Google Scholar] [CrossRef]
  21. Garcia, M.C.; Vieira, T. Surface electromyography: Why, when and how to use it. Rev. Andal. Med. Deporte 2011, 4, 17–28. [Google Scholar]
  22. Boushel, R.; Langberg, H.; Olesen, J.; Gonzales-Alonzo, J.; Bülow, J.; Kjaer, M. Monitoring tissue oxygen availability with near infrared spectroscopy (NIRS) in health and disease. Scand. J. Med. Sci. Sports 2001, 11, 213–222. [Google Scholar] [CrossRef]
  23. Morrison, B.M. Neuromuscular diseases. Semin. Neurol. 2016, 36, 409–418. [Google Scholar] [CrossRef] [PubMed]
  24. McDonald, C.M. Physical Activity, Health Impairments, and Disability in Neuromuscular Disease. Am. J. Phys. Med. Rehabil. 2002, 81, S108–S120. [Google Scholar] [CrossRef] [PubMed]
  25. Voet, N.B. Exercise in neuromuscular disorders: A promising intervention. Acta Myol. 2019, 38, 207. [Google Scholar] [PubMed]
  26. Janssen, B.; Voet, N.; Geurts, A.; van Engelen, B.; Heerschap, A. Quantitative MRI reveals decelerated fatty infiltration in muscles of active FSHD patients. Neurology 2016, 86, 1700–1707. [Google Scholar] [CrossRef]
  27. Pino, M.G.; Rich, K.A.; Kolb, S.J. Update on Biomarkers in Spinal Muscular Atrophy. Biomark. Insights 2021, 16, 643. [Google Scholar] [CrossRef]
  28. Fischmann, A.; Fischer, D. Neuromuscular imaging in muscular dystrophies and other muscle diseases. Imaging Med. 2013, 5, 237. [Google Scholar] [CrossRef]
  29. Higgins, J.P.; Sterne, J.; Savovic, J.; Page, M.J.; Hróbjartsson, A.; Boutron, I.; Reeves, B.; Eldridge, S. A revised tool for assessing risk of bias in randomized trials. Cochrane Database Syst. Rev. 2016, 10, 29–31. [Google Scholar]
  30. SSterne, J.A.C.; Hernán, M.A.; Reeves, B.C.; Savović, J.; Berkman, N.D.; Viswanathan, M.; Henry, D.; Altman, D.G.; Ansari, M.T.; Boutron, I.; et al. ROBINS-I: A tool for assessing risk of bias in non-randomised studies of interventions. BMJ 2016, 355, i4919. [Google Scholar] [CrossRef]
  31. Page, M.J.; Bountron, I.; Hoffman, T.C.; Mulrow, C.D.; Shamseer, L.; Tetzlaff, J.; Akl, E.A.; Brennan, S.E.; Moher, D.; Chou, R.; et al. The PRISMA 2020 statement: An updated guideline for reporting systematic reviews. Syst. Rev. 2021, 10, 372. [Google Scholar] [CrossRef] [PubMed]
  32. Rahbek, M.A.; Mikkelsen, E.E.; Overgaard, K.; Vinge, L.; Andersen, H.; Dalgas, U. Exercise in myasthenia gravis: A feasibility study of aerobic and resistance training. Muscle Nerve 2017, 56, 700–709. [Google Scholar] [CrossRef] [PubMed]
  33. Bulut, N.; Karaduman, A.; Alemdaroğlu-Gürbüz, İ.; Yılmaz, Ö.; Topaloğlu, H.; Özçakar, L. The effect of aerobic training on motor function and muscle architecture in children with Duchenne muscular dystrophy: A randomized controlled study. Clin. Rehabil. 2022, 36, 1062–1071. [Google Scholar] [CrossRef]
  34. Chung, Y.-L.; Alexanderson, H.; Pipitone, N.; Morrison, C.; Dastmalchi, M.; Ståhl-Hallengren, C.; Richards, S.; Thomas, E.L.; Hamilton, G.; Bell, J.D.; et al. Creatine supplements in patients with idiopathic inflammatory myopathies who are clinically weak after conventional pharmacologic treatment: Six-month, double-blind, randomized, placebo-controlled trial. Arthritis Rheum. 2007, 57, 694–702. [Google Scholar] [CrossRef]
  35. Burns, J.; Sman, A.D.; Cornett, K.M.D.; Wojciechowski, E.; Walker, T.; Menezes, M.P.; Mandarakas, M.R.; Rose, K.J.; Bray, P.; Sampaio, H.; et al. Safety and efficacy of progressive resistance exercise for Charcot-Marie-Tooth disease in children: A randomised, double-blind, sham-controlled trial. Lancet Child Adolesc. Heal. 2017, 1, 106–113. [Google Scholar] [CrossRef]
  36. Taivassalo, T.; De Stefano, N.; Chen, J.; Karpati, G.; Arnold, D.; Argov, Z. Short-term aerobic training response in chronic myopathies. Muscle Nerve 1999, 22, 1239–1243. [Google Scholar] [CrossRef]
  37. Alexanderson, H.; Stenström, C.H.; Jenner, G.; Lundberg, I. The safety of a resistive home exercise program in patients with recent onset active polymyositis or dermatomyositis. Scand. J. Rheumatol. 2000, 29, 295–301. [Google Scholar]
  38. Alexanderson, H.; Stenström, C.H.; Lundberg, I. Safety of a home exercise programme in patients with polymyositis and dermatomyositis: A pilot study. Rheumatology 1999, 38, 608–611. [Google Scholar] [CrossRef]
  39. Spector, S.A.; Gordon, P.L.; Feuerstein, I.M.; Sivakumar, K.; Hurley, B.F.; Dalakas, M.C. Strength gains without muscle injury after strength training in patients with postpolio muscular atrophy. Muscle Nerve 1996, 19, 1282–1290. [Google Scholar] [CrossRef]
  40. Taivassalo, T.; De Stefano, N.; Argov, Z.; Matthews, P.M.; Chen, J.; Genge, A.; Karpati, G.; Arnold, D.L. Effects of aerobic training in patients with mitochondrial myopathies. Neurology 1998, 50, 1055–1060. [Google Scholar] [CrossRef]
  41. Tollbäck, A.; Eriksson, S.; Wredenberg, A.; Jenner, G.; Vargas, R.; Borg, K.; Ansved, T. Effects of high resistance training in patients with myotonic dystrophy. Scand. J. Rehabil. Med. 1999, 31, 9–16. [Google Scholar]
  42. Taivassalo, T.; Shoubridge, E.A.; Chen, J.; Kennaway, N.G.; DiMauro, S.; Arnold, D.L.; Haller, R.G. Aerobic conditioning in patients with mitochondrial myopathies: Physiological, biochemical, and genetic effects. Ann. Neurol. 2001, 50, 133–141. [Google Scholar] [CrossRef]
  43. Trenell, M.I.; Sue, C.M.; Kemp, G.J.; Sachinwalla, T.; Thompson, C.H. Aerobic exercise and muscle metabolism in patients with mitochondrial myopathy. Muscle Nerve 2006, 33, 524–531. [Google Scholar] [CrossRef]
  44. El Mhandi, L.; Millet, G.Y.; Calmels, P.; Richard, A.; Oullion, R.; Gautheron, V.; Féasson, L. Benefits of interval-training on fatigue and functional capacities in Charcot–Marie–Tooth disease. Muscle Nerve 2008, 37, 601–610. [Google Scholar] [CrossRef] [PubMed]
  45. Porcelli, S.; Marzorati, M.; Morandi, L.; Grassi, B. Home-based aerobic exercise training improves skeletal muscle oxidative metabolism in patients with metabolic myopathies. J. Appl. Physiol. 2016, 121, 699–708. [Google Scholar] [CrossRef] [PubMed]
  46. Westerberg, E.; Molin, C.J.; Ness, S.S.; Widenfalk, J.; Punga, A.R. The impact of physical exercise on neuromuscular function in Myasthenia gravis patients: A single-subject design study. Medicine 2018, 97, e11510. [Google Scholar] [CrossRef] [PubMed]
  47. Lott, D.J.; Taivassalo, T.; Cooke, K.D.; Park, H.; Moslemi, Z.; Batra, A.; Forbes, S.C.; Byrne, B.J.; Walter, G.A.; Vandenborne, K. Safety, feasibility, and efficacy of strengthening exercise in Duchenne muscular dystrophy. Muscle Nerve 2021, 63, 320–326. [Google Scholar] [CrossRef]
  48. Voet, N.B.; van der Kooi, E.L.; van Engelen, B.G.; Geurts, A.C. Strength training and aerobic exercise training for muscle disease. Cochrane Database Syst. Rev. 2019, 12, CD003907. [Google Scholar] [CrossRef]
  49. Hoppeler, H.; Baum, O.; Lurman, G.; Mueller, M. Molecular mechanisms of muscle plasticity with exercise. Compr. Physiol. 2011, 1, 1383–1412. [Google Scholar] [PubMed]
  50. Schoenfeld, B.J. The mechanisms of muscle hypertrophy and their application to resistance training. J. Strength Cond. Res. 2010, 24, 2857–2872. [Google Scholar] [CrossRef]
  51. Seynnes, O.R.; de Boer, M.; Narici, M.V.; Franchi, M.V.; Maffiuletti, N.A.; McGlory, C.; Devries, M.C.; Phillips, S.M.; Łochyński, D.; Kaczmarek, D.; et al. Early skeletal muscle hypertrophy and architectural changes in response to high-intensity resistance training. J. Appl. Physiol. 2007, 102, 368–373. [Google Scholar] [CrossRef] [PubMed]
  52. Molin, C.J.; Punga, A.R. Compound Motor Action Potential: Electrophysiological Marker for Muscle Training. J. Clin. Neurophysiol. 2016, 33, 340–345. [Google Scholar] [CrossRef] [PubMed]
  53. Mercuri, E.; Bertini, E.; Iannaccone, S.T. Childhood spinal muscular atrophy: Controversies and challenges. Lancet Neurol. 2012, 11, 443–452. [Google Scholar] [CrossRef] [PubMed]
  54. Tizzano, E.F.; Finkel, R.S. Spinal muscular atrophy: A changing phenotype beyond the clinical trials. Neuromuscul. Disord. 2017, 27, 883–889. [Google Scholar] [CrossRef]
  55. Zhou, H.; Meng, J.; Malerba, A.; Catapano, F.; Sintusek, P.; Jarmin, S.; Feng, L.; Lu-Nguyen, N.; Sun, L.; Mariot, V.; et al. Myostatin inhibition in combination with antisense oligonucleotide therapy improves outcomes in spinal muscular atrophy. J. Cachexia Sarcopenia Muscle 2020, 11, 768–782. [Google Scholar] [CrossRef]
  56. Bartels, B.; Montes, J.; van der Pol, W.L.; de Groot, J.F. Physical exercise training for type 3 spinal muscular atrophy. Cochrane Database Syst. Rev. 2019, 2019, CD012120. [Google Scholar] [CrossRef]
Figure 1. PRISM flow chart of the study selection process. The systematic search in EMBASE, PubMed, CINAHL, and Cochrane yielded 1390 unique publications. After title and abstract screening, articles were screened by full text, after which, seven articles were excluded based on the exclusion criteria. Following the addition of 0 articles from references of included studies, information from 17 articles was extracted for the systematic review [31].
Jcm 12 06834 g001
Table 1. Overview of literature, results of the quality assessment, and patient characteristics.
First AuthorYearStudy TypeRisk of BiasNMDNumber of ParticipantsGender (M/F)Age (y) 4
Chung [34] 22007RCTSome concernsPM and DMn = 18; 12 PM, 6 DM3/15Mean 50
Janssen [26] 32016RCTHighFSHD1n = 97/456 ± 15
Burns [35] 32017RCTLowCMTn = 3016/1411.5 ± 3.3
Rahbek [32]2017RCTHighMGn = 157/855.6 ± 17.2
Bulut [33] 32022RCTHighDMDn = 1010 M7.9 (7.2–8.7)
Taivassalo [36] 31999N-RCTSeriousMM and NMMn = 24; 14 MM, 10 NMM9/1514–63
Spector [39]1996Pre–postSome concernsPPSn = 65/153 ± 7
Taivassalo [40]1998Pre–postSome concernsMMn = 104/636 ± 9
Alexanderson [38]1999Pre–postHighPM and DMn = 10; 5 PM, 5 DM2/827–60
Tollbäck [41]1999Pre–postSome concernsMD 1n = 92/737 ± 8.6
Alexanderson [37]2000Pre–postHighPM and DMn = 11; 7 PM, 4 DM3/823–80
Taivassalo [42]2001Pre–postSome concernsMMn = 104/639.3 ± 9.5
Trenell [43]2005Pre–postSome concernsMMn = 103/742 ± 14
Mhandi [44]2007Pre–postSome concernsCMTn = 88 M23–45
Porcelli [45]2016Pre–postSome concernsMM and McAn = 13; 6 MM, 7 McA4/2, 3/451 ± 16, 41 ± 13
Westerberg [46]2018Pre–postSome concernsMGn = 115/660 ± 18
Lott [47]2021Pre–postSome concernsDMDn = 88 M9.3 ± 0.8
1 The abbreviation for myotonic dystrophy is usually DM; however here, DM is used for dermatomyositis, therefore MD is used instead. 2 Only the placebo group without creatine supplementation. The placebo group would be given lactose. 3 Only the group with a training intervention is shown. 4 The age range and ±SD below is as given in the study. Abbreviations: NMD = neuromuscular disease; M = male; F = female; y = years; RCT = Randomized controlled pre–post study; N-RCT = Non-randomized controlled pre–post study; Pre–post = Pre–post study with no control; PM = Polymyositis; DM = Dermatomyositis; FSHD1 = Facioscapulohumeral Muscular Dystrophy Type 1; CMT = Charcot–Marie–Tooth disease; MG = Myasthenia Gravis; DMD = Duchenne Muscular Dystrophy; MM = Mitochondrial Myopathy; NMM = Chronic Non-metabolic Myopathies; PPS = Post polio Syndrome; MD = Myotonic Dystrophy; McA = McArdle Disease.
Table 2. Exercise intervention FITT characteristics.
StudyFrequencyIntensityTypeTime (Min)
Chung [34]5 d/w program and 7 d/w walk for 6 mModerateStrength and endurance15 + 15 walk
Janssen [26]3 d/w for 16 w50 to 65% of HR reserveEndurance (cycling)30 + 5–10 walk, increased by 1 min daily
Burns [35]3 d/w for 6 mResistance at 50 to 70% of the repetition max; Sham at <10% of the repetition maxStrength or sham25
Rahbek [32]5 d/2 w for 8 w
(20 sessions)
Moderate to high(1) Endurance (cycling);
(2) Progressive resistance (full-body program)
(1) 3 × 10–12 with 3 min rest;
(2) Various
Bulut [33]3 d/w for 12 w60% of max HREndurance (cycling)40
Taivassalo [36]3–4 d for 8 w70–85% of HRREndurance (treadmill)20–30
Spector [39]3 d/w for 10 w75% of the three-repetition maximumStrengthNR
Taivassalo [40]3–4 d for 8 w60–80% of HRREndurance (treadmill)20–30
Alexanderson [38]5 d/w for 12 wModerateStrength and endurance15 + 15 walk
Tollbäck [41]3 d/w for 12 w80% of one-repetition maximumStrength~10 min (program)
Alexanderson 1 [37]<3 d/w program and 5 d/w walk for 12 wModerateStrength and endurance15 + 15 walk
Taivassalo [42]3–4 d for 14 w
(50 sessions)
70–80% of max HREndurance (cycling)30–40
Trenell [43]3 d/w for 12 w70–80% of their age-predicted max HREndurance (cycling)30
Mhandi [44]3 d/w for 24 wHR at 80% max aerobic powerInterval-endurance (cycling)45 (program)
Porcelli [45]4 d/w for 12 w65–70% of max HRStretching and endurance (cycling)15 stretching + 30–45 endurance
Westerberg [46]2 d/w for 12 wMinimum to 80% max HREndurance, strength and balance90 (program)
Lott [47]3 d/w for 12 wMild-moderate (50% MVC and after 6 w 60% MVC)Strength90
1 In the study by Alexanderson et al. (2000), corticosteroids were used together with the exercise intervention [37]. Abbreviations: d = days; w = weeks; min = minutes; m = months; HR = heart rate; HRR = heart rate reserve; NR = not reported; MVC = maximal voluntary contraction.
Table 3. Biomarkers and their baseline and end intervention results.
First AuthorMeasurement DayBaselineEnd Intervention
MRI biomarkers
Muscle volumeBurns [35]0, 1821.2 ± 0.3 (scaled score)/control: 1.2 ± 0.41.1 ± 0.3 (scaled score)/control: 1.1 ± 0.3 (p = 0.24)
Trenell [43]0, 8411.8 ± 1.5 dm312.8 ± 1.6 dm3 (p < 0.05)
Muscle maximum area Trenell [43]0, 84464 ± 65 cm2497 ± 70 cm2 (p < 0.05)
Tollbäck [41]0, 844090 ± 591 mm2 4154 ± 585 mm2
Spector [39]0, 70 n.a.Not significantly changed
Fat infiltration Burns [35]0, 1820.1 ± 0.1 (scaled score)/control: 0.1 ± 0.10.1 ± 0.1 (scaled score)/control: 0.1 ± 0.1 (p = 0.25)
Alexanderson [38]0, 84n.a.Increased amount of fat in n = 1
Alexanderson [37]0, 84No fat infiltrationNo change
Tollbäck [41]0, 84Fatty replacement in n = 4n.a.
Fat fraction Janssen [26]0, 11232 ± 36%Increase in fat fraction normalized per year: 2.9% (p = 0.03) (Significantly decelerated compared with UC (6.7%))
Inflammation Alexanderson [38]0, 84n.a.No increased muscle inflammation
Alexanderson [37]0, 84Inflammation in n = 3Inflammation in n = 2, no signs of inflammation in n = 5
Tollbäck [41]0, 84n.a.No increased muscle inflammation
Muscle damageLott [47]0, 84KE = 47 ± 5 ms and KF = 44.5 ± 3 msKE = +2.3% (SD 3.6) and KF = +0.4% (SD 4.6)
31P MRS biomarkers
Resting PCr Trenell [43]0, 8429 ± 1 mmol.L−127 ± 1 mmol.L−1
Resting ADPTrenell [43]0, 8428 ± 5 μmol.L−134 ± 5 μmol.L−1
Resting pHTrenell [43]0, 847.04 ± 0.017.06 ± 0.01
PCr hydrolysis during exerciseTrenell [43]0, 8413 ± 1 mmol.L−112 ±1 mmol.L−1
pH fall during exerciseTrenell [43]0, 84−0.3 ± −0.1−0.3 ± −0.1
End exercise ADPTrenell [43]0, 8457 ± 5 μmol.L−159 ± 10 μmol.L−1
VTrenell [43]0, 840.4 ± 0.1 mmol.L−1.min−10.7 ± 0.1 mmol.L−1.min−1 (p < 0.05)
Taivassalo [42]0, 9810.0 ± 4.7 mmol.L−1.min−114.1 ± 5.5 mM/min (p < 0.05)
QmaxTrenell [43]0, 8420 ± 3 mmol.L−1.min−126 ± 2 mmol.L−1.min−1 (p < 0.05)
Taivassalo [42]0, 9812.6 ± 6.0 mmol.L−1.min−117.2 ± 6.5 mM/min (p < 0.05)
Initial pH recovery rateTrenell [43]0, 845 ± 2 mmol.L−1.min−15 ± 2 mmol.L−1.min−1
dE/d(pH fall) rateTrenell [43]0, 8420 ± 3 mmol.L−1.min−1(pH unit)−119 ± 1 mmol.L−1.min−1(pH unit)−1
ADP t1/2Taivassalo [40]0, 56* 3.50 ± 0.56 min/** 0.68 ± 0.48 min* 0.59 ± 0.18 min/** 0.40 ± 0.22 min (p < 0.04)
Taivassalo [36]0, 56MM: 1.27 ± 1.30 min/NMM: 0.35 ± 0.23 minMM: 0.48 ± 0.33 min (p < 0.01)/NMM: 0.28 ± 0.15 min
PCr/β-NTP ratioChung [34]0, 91, 1824.03 ± 0.294.05 ± 0.31
sEMG biomarkers
Fatigue indicesMhandi [44]0, 84, 168−8.9 ± 7.2% −6.9 ± 5.5%
Root mean square Mhandi [44]0, 84, 16858%58%
Coactivation Mhandi [44]0, 84, 16811%6.5%
Mean frequency Mhandi [44]0, 84, 16868 Hz63 Hz
Integrated EMGRahbek [32]0, 56PRT: 10.9 ± 4.2 μV/ET: 8.5 ± 2.4 μVPRT: 13.0 ± 7.0 μV (p = 0.31)/ET: 7.0 ± 3.4 μV (p = 0.52)
CMAP amplitudeWesterberg [46]0, 84Quadriceps: 4.5 ± 2.6 mV/BB: 5.5 ± 2.1 mVQuadriceps: 5.3 ± 2.8 mV (p = 0.016)/BB: 4.6 ± 1.3 mV (p = 0.63)
Ultrasound biomarkers
ThicknessWesterberg [46]0, 84Rectus femoris: 19.6 ± 5.6 mm/vastus intermedius: 18.0 ± 5.8 mm/BB: 33.3 ± 6.5 mmRectus femoris: 23.0 ± 3.9 mm (p = 0.0098)/vastus intermedius: 22.0 ± 6.2 mm (p = 0.034)/BB: 32.1 ± 6.2 mm (p = 0.11)
Bulut [33]0, 84Vastus lateralis: D—2.1 ± 0.5 cm/ND—2.2 ± 0.4 cm (control: D—2.1 ± 0.2 cm/ND—2.2 ± 0.2 cm)Vastus lateralis: D—2.3 ± 0.6 cm/ND—2.3 ± 0.4 cm (control: D—2.4 ± 0.5 cm (p *** = 0.6)/ND—2.5 ± 0.5 cm (p *** = 0.5))
Pennation angleBulut [33]0, 84Vastus lateralis: D—18.9 ± 3.7°/ND—19.6 ± 3.4° (control: D—17.7 ± 3.3°/ND—18.4 ± 2.8°)Vastus lateralis: D—19.7 ± 5.3°/ND—18.5 ± 6.3° (control: D—18.8 ± 2.3° (p *** = 0.9)/ND—20.4 ± 2.6° (p *** = 0.3))
Fascicle LengthBulut [33]0, 84Vastus lateralis: D—7.0 ± 1.5 cm/ND—6.7 ± 1.5 cm (control: D—7.5 ± 1.6 cm/ND—6.8 ± 1.7 cm)Vastus lateralis: D—7.0 ± 1.3 cm/ND—7.5 ± 1.7 cm (control: D—7.6 ± 0.9 cm (p *** = 0.8)/ND—7.3 ± 0.6 cm (p *** = 0.6))
NIRS biomarkers
Δ[deoxy(Hb + Mb)]Porcelli [45]0, 84MM: 22.0 ± 6.7% of ischemia/McA: 23.4 ± 6.2% of ischemiaMM: 34.2 ± 5.9% of ischemia (p < 0.05)/McA: 40.6 ± 7.2% of ischemia (p < 0.05)
* results of two patients with a putative nuclear DNA mutation. ** results of the remaining eight patients. *** between group comparison p-value (p < 0.05 is significant). Bold indicates a significant difference between baseline and end intervention. Abbreviations: d = days; MRI = magnetic resonance imaging; 31P MRS = phosphor magnetic resonance spectroscopy; sEMG = surface electromyography; NIRS = near-infrared spectroscopy; PCr = phosphocreatine; ADP = adenosine phosphate; pH = potential of hydrogen; V = initial PCr recovery rate; Qmax = mitochondrial capacity; E = rate of net proton efflux; ADP t1/2 = adenosine phosphate recovery half-time; β-NTP = beta-nucleoside triphosphate; CMAP = compound muscle action potential; Δ[deoxy(Hb + Mb)] = micromolar changes in deoxygenated hemoglobin and myoglobin concentrations; KE = knee extensors; KF = knee flexors; MM = Mitochondrial Myopathy; NMM = Chronic Non-metabolic Myopathies; PRT = progressive resistance training; ET = endurance training; BB = biceps brachii; D = dominant leg; ND = non-dominant leg; McA = McArdle disease. n.a. = Not applicable.
Disclaimer/Publisher’s Note: The statements, opinions and data contained in all publications are solely those of the individual author(s) and contributor(s) and not of MDPI and/or the editor(s). MDPI and/or the editor(s) disclaim responsibility for any injury to people or property resulting from any ideas, methods, instructions or products referred to in the content.

