
Correlation of Renal Profiles with Choroidal Vascularity Index in Eyes with Diabetic Retinopathy


Abstract
:1. Introduction
2. Methods
2.1. Ethics
2.2. Inclusion and Exclusion Criteria
2.3. DR Grading
2.4. OCT
2.5. CVI
2.6. Statistical Analyses
3. Results
3.1. Baseline Characteristics
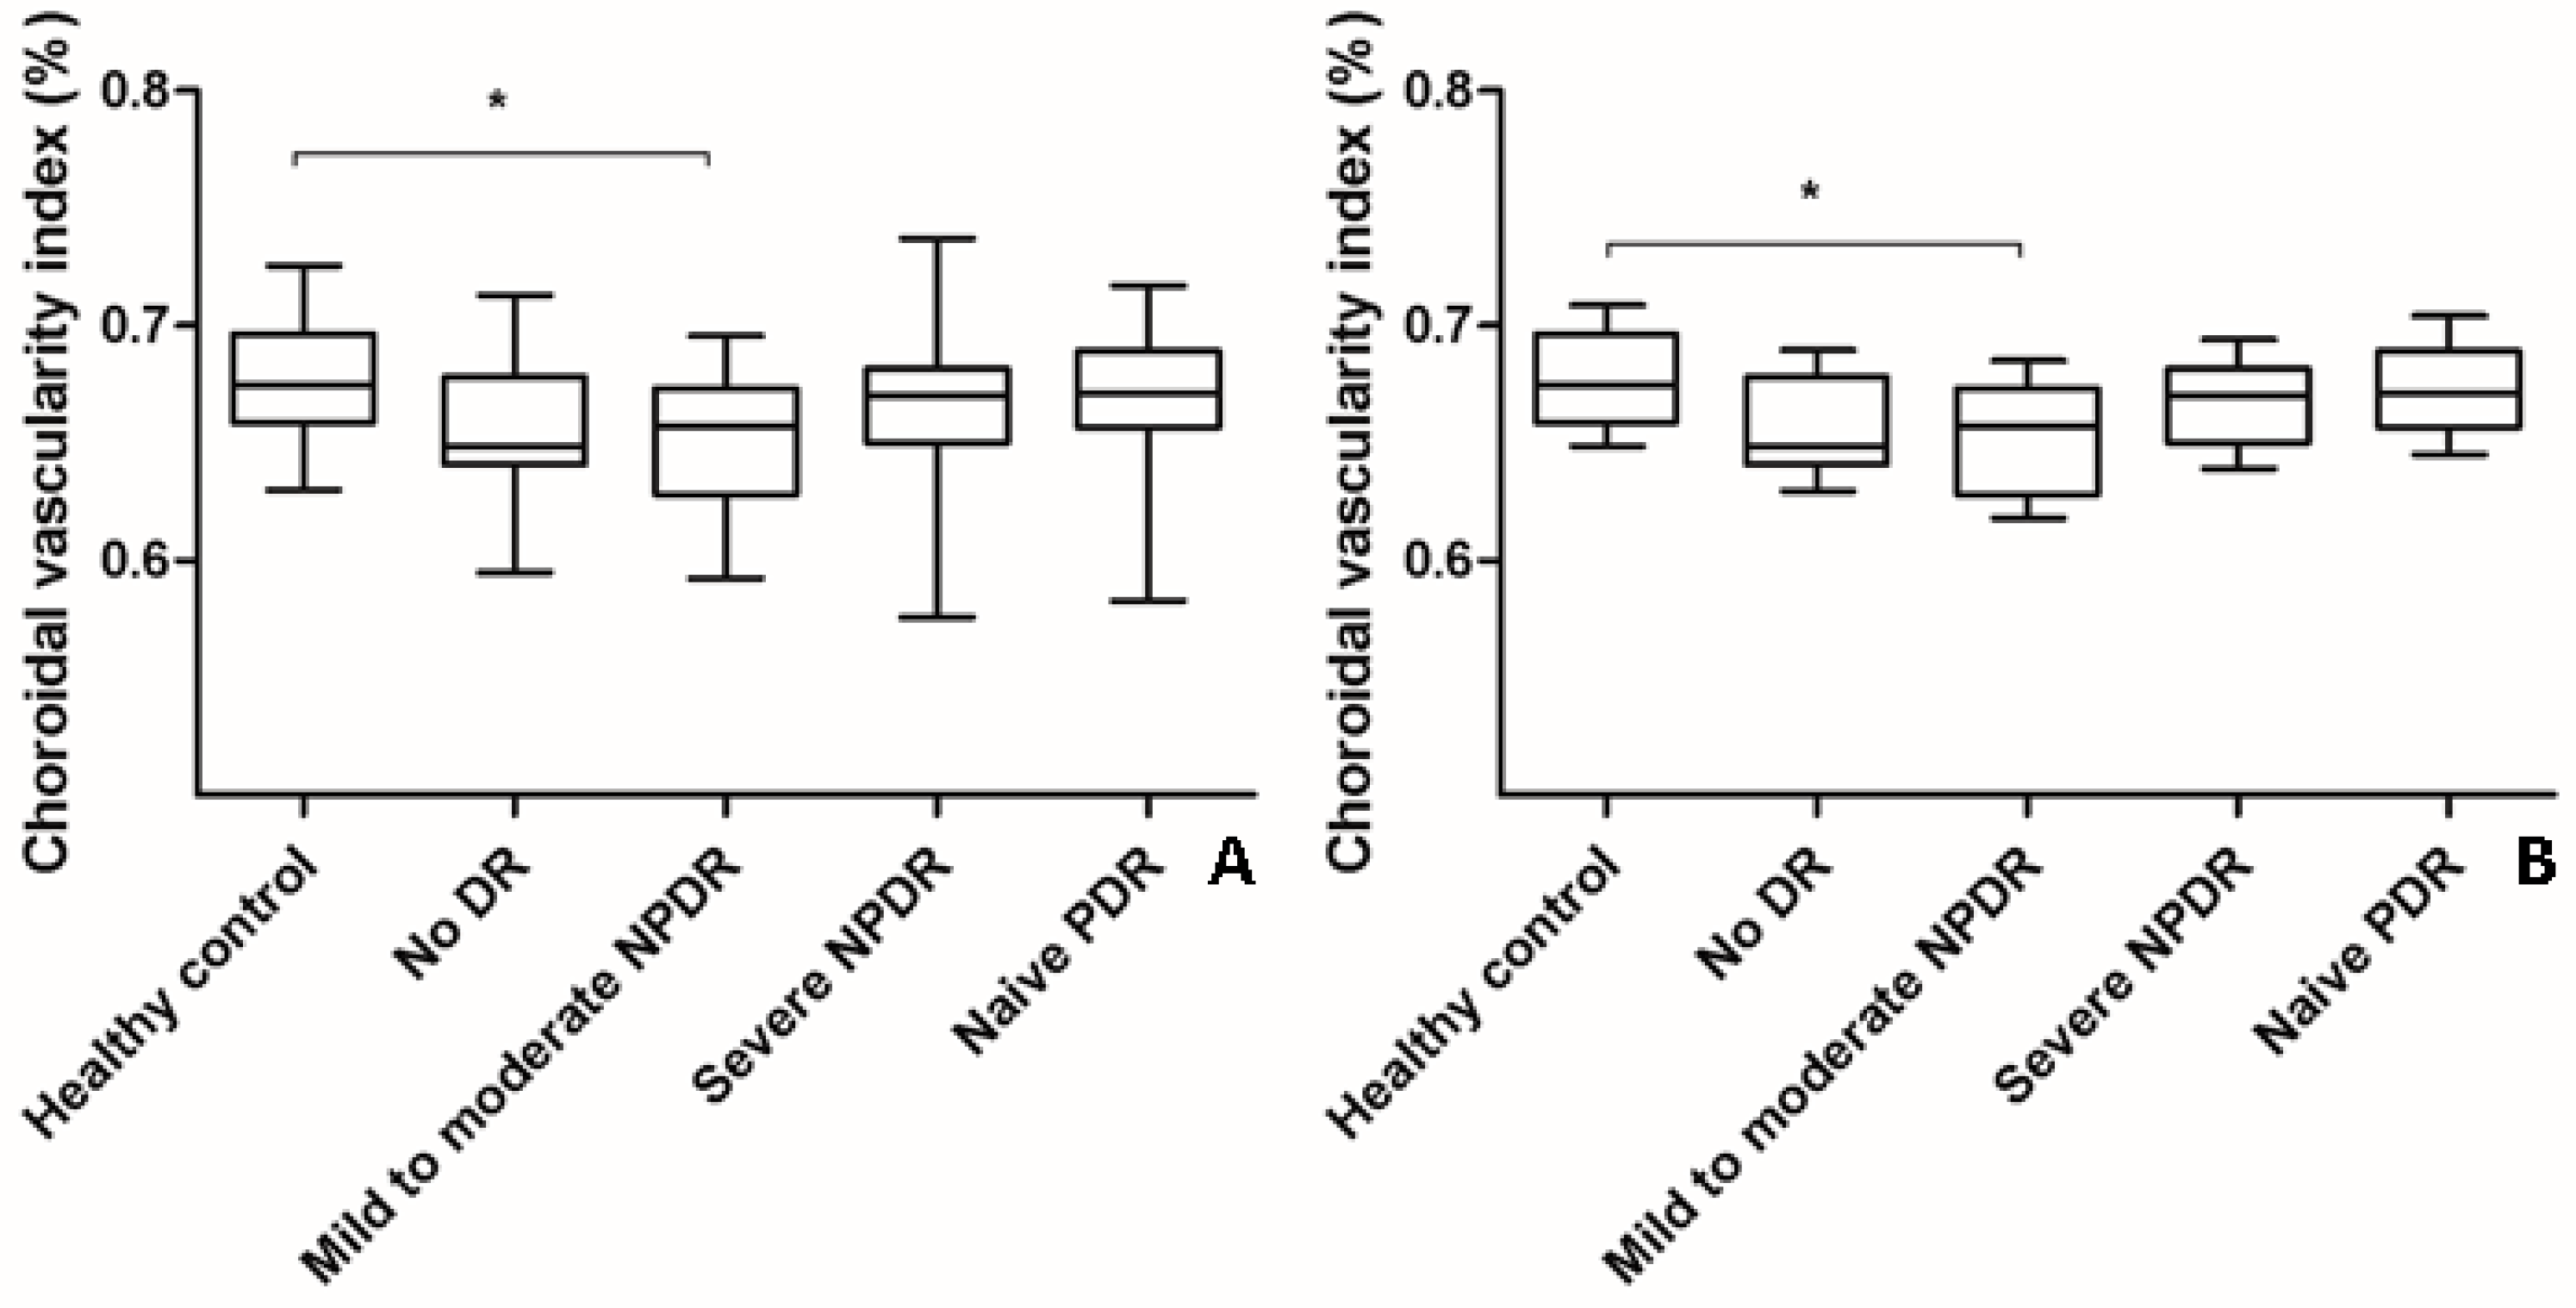
3.2. Changes in CVI and SFChT in Eyes with DR
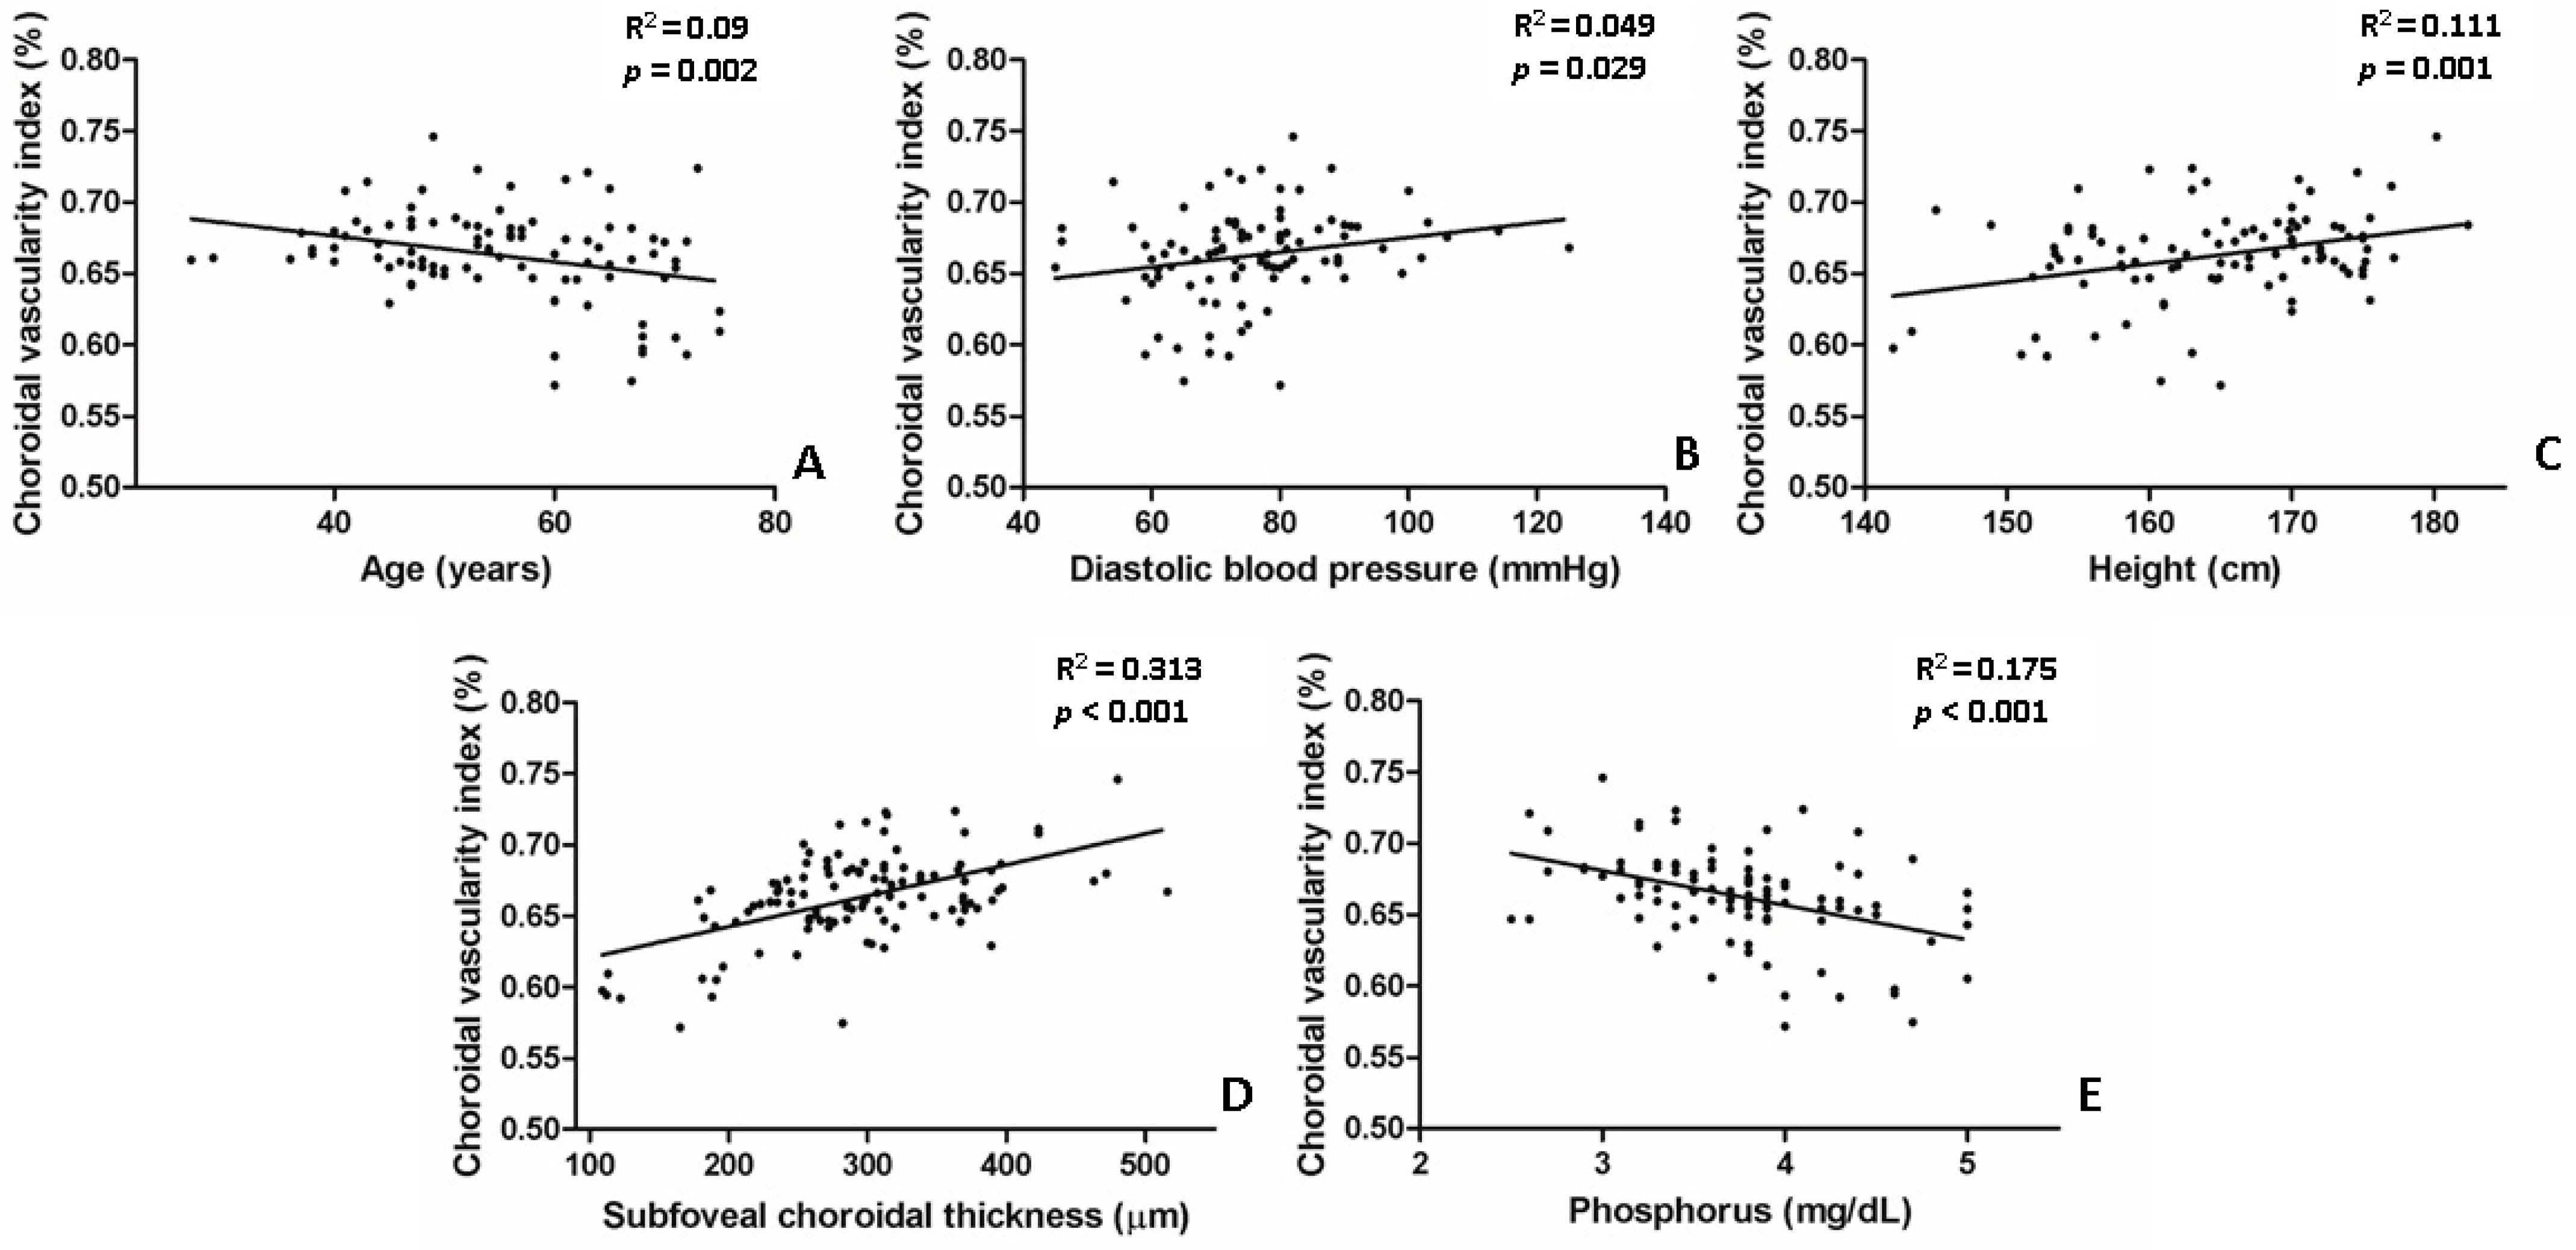
3.3. Association between CVI and Ocular and Systemic Factors Related with Diabetes
4. Discussion
Author Contributions
Funding
Institutional Review Board Statement
Informed Consent Statement
Data Availability Statement
Conflicts of Interest
References
- Nickla, D.L.; Wallman, J. The multifunctional choroid. Prog. Retin. Eye Res. 2010, 29, 144–168. [Google Scholar] [CrossRef] [Green Version]
- Zheng, Y.; He, M.; Congdon, N. The worldwide epidemic of diabetic retinopathy. Indian J. Ophthalmol. 2012, 60, 428–431. [Google Scholar] [CrossRef] [PubMed]
- Lee, R.; Wong, T.Y.; Sabanayagam, C. Epidemiology of diabetic retinopathy, diabetic macular edema and related vision loss. Eye Vis. 2015, 2, 17. [Google Scholar] [CrossRef] [Green Version]
- Hidayat, A.A.; Fine, B.S. Diabetic choroidopathy. Light and electron microscopic observations of seven cases. Ophthalmology 1985, 92, 512–522. [Google Scholar] [CrossRef]
- Cao, J.; McLeod, S.; Merges, C.A.; Lutty, G.A. Choriocapillaris degeneration and related pathologic changes in human diabetic eyes. Arch. Ophthalmol. 1998, 116, 589–597. [Google Scholar] [CrossRef] [PubMed] [Green Version]
- Weinberger, D.; Kramer, M.; Priel, E.; Gaton, D.D.; Axer-Siegel, R.; Yassur, Y. Indocyanine green angiographic findings in nonproliferative diabetic retinopathy. Am. J. Ophthalmol. 1998, 126, 238–247. [Google Scholar] [CrossRef]
- Savage, H.I.; Hendrix, J.W.; Peterson, D.C.; Young, H.; Wilkinson, C.P. Differences in pulsatile ocular blood flow among three classifications of diabetic retinopathy. Investig. Ophthalmol. Vis. Sci. 2004, 45, 4504–4509. [Google Scholar] [CrossRef] [PubMed] [Green Version]
- Ting, D.S.; Cheung, G.C.; Lim, L.S.; Yeo, I.Y. Comparison of swept source optical coherence tomography and spectral domain optical coherence tomography in polypoidal choroidal vasculopathy. Clin. Exp. Ophthalmol. 2015, 43, 815–819. [Google Scholar] [CrossRef] [PubMed]
- Wang, J.C.; Lains, I.; Silverman, R.F.; Sobrin, L.; Vavvas, D.G.; Miller, J.W.; Miller, J.B. Visualization of Choriocapillaris and Choroidal Vasculature in Healthy Eyes with En Face Swept-Source Optical Coherence Tomography Versus Angiography. Transl. Vis. Sci. Technol. 2018, 7, 25. [Google Scholar] [CrossRef] [Green Version]
- Tan, K.A.; Laude, A.; Yip, V.; Loo, E.; Wong, E.P.; Agrawal, R. Choroidal vascularity index—A novel optical coherence tomography parameter for disease monitoring in diabetes mellitus? Acta Ophthalmol. 2016, 94, e612–e616. [Google Scholar] [CrossRef] [PubMed]
- Agrawal, R.; Chhablani, J.; Tan, K.A.; Shah, S.; Sarvaiya, C.; Banker, A. Choroidal vascularity index in central serous chorioretinopathy. Retina 2016, 36, 1646–1651. [Google Scholar] [CrossRef] [PubMed]
- Wei, X.; Ting, D.S.W.; Ng, W.Y.; Khandelwal, N.; Agrawal, R.; Cheung, C.M.G. Choroidal Vascularity Index: A Novel Optical Coherence Tomography Based Parameter in Patients with Exudative Age-Related Macular Degeneration. Retina 2017, 37, 1120–1125. [Google Scholar] [CrossRef] [PubMed]
- Sacconi, R.; Battista, M.; Borrelli, E.; Senni, C.; Tombolini, B.; Grosso, D.; Querques, L.; Bandello, F.; Querques, G. Choroidal vascularity index is associated with geographic atrophy progression. Retina 2021, 41, 1799–1808. [Google Scholar] [CrossRef]
- Gupta, C.; Tan, R.; Mishra, C.; Khandelwal, N.; Raman, R.; Kim, R.; Agrawal, R.; Sen, P. Choroidal structural analysis in eyes with diabetic retinopathy and diabetic macular edema-A novel OCT based imaging biomarker. PLoS ONE 2018, 13, e0207435. [Google Scholar] [CrossRef] [PubMed] [Green Version]
- Kim, M.; Ha, M.J.; Choi, S.Y.; Park, Y.H. Choroidal vascularity index in type-2 diabetes analyzed by swept-source optical coherence tomography. Sci. Rep. 2018, 8, 70. [Google Scholar] [CrossRef]
- Gartner, V.; Eigentler, T.K. Pathogenesis of diabetic macro- and microangiopathy. Clin. Nephrol. 2008, 70, 1–9. [Google Scholar] [CrossRef]
- Lutty, G.A. Diabetic choroidopathy. Vis. Res. 2017, 139, 161–167. [Google Scholar] [CrossRef]
- Branch, M.; German, C.; Bertoni, A.; Yeboah, J. Incremental risk of cardiovascular disease and/or chronic kidney disease for future ASCVD and mortality in patients with type 2 diabetes mellitus: ACCORD trial. J. Diabetes Complicat. 2019, 33, 468–472. [Google Scholar] [CrossRef]
- Selvin, E.; Marinopoulos, S.; Berkenblit, G.; Rami, T.; Brancati, F.L.; Powe, N.R.; Golden, S.H. Meta-analysis: Glycosylated hemoglobin and cardiovascular disease in diabetes mellitus. Ann. Intern. Med. 2004, 141, 421–431. [Google Scholar] [CrossRef] [PubMed]
- Alicic, R.Z.; Rooney, M.T.; Tuttle, K.R. Diabetic Kidney Disease: Challenges, Progress, and Possibilities. Clin. J. Am. Soc. Nephrol. 2017, 12, 2032–2045. [Google Scholar] [CrossRef]
- Choi, M.G.; Chung, H.; Yoon, Y.H.; Kim, J.T. Effects of Systemic Profiles on Choroidal Thickness in Treatment-Naïve Eyes with Diabetic Retinopathy. Investig. Ophthalmol. Vis. Sci. 2020, 61, 12. [Google Scholar] [CrossRef] [PubMed]
- Choi, M.G.; Kim, J.T. Strong Correlation of Renal Function with Choroidal Thickness in Patients with Type 2 Diabetes: Retrospective Cross-Sectional Study. J. Clin. Med. 2020, 9, 2171. [Google Scholar] [CrossRef]
- Agrawal, R.; Gupta, P.; Tan, K.A.; Cheung, C.M.; Wong, T.Y.; Cheng, C.Y. Choroidal vascularity index as a measure of vascular status of the choroid: Measurements in healthy eyes from a population-based study. Sci. Rep. 2016, 6, 21090. [Google Scholar] [CrossRef]
- Sonoda, S.; Sakamoto, T.; Yamashita, T.; Shirasawa, M.; Uchino, E.; Terasaki, H.; Tomita, M. Choroidal structure in normal eyes and after photodynamic therapy determined by binarization of optical coherence tomographic images. Investig. Ophthalmol. Vis. Sci. 2014, 55, 3893–3899. [Google Scholar] [CrossRef]
- Agrawal, R.; Li, L.K.; Nakhate, V.; Khandelwal, N.; Mahendradas, P. Choroidal Vascularity Index in Vogt-Koyanagi-Harada Disease: An EDI-OCT Derived Tool for Monitoring Disease Progression. Transl. Vis. Sci. Technol. 2016, 5, 7. [Google Scholar] [CrossRef] [PubMed]
- Koh, L.H.L.; Agrawal, R.; Khandelwal, N.; Sai Charan, L.; Chhablani, J. Choroidal vascular changes in age-related macular degeneration. Acta Ophthalmol. 2017, 95, e597–e601. [Google Scholar] [CrossRef]
- Berndt, T.; Kumar, R. Novel mechanisms in the regulation of phosphorus homeostasis. Physiology 2009, 24, 17–25. [Google Scholar] [CrossRef]
- Thompson, D.D. Renal excretion of calcium and phosphorus. AMA Arch. Intern. Med. 1959, 103, 832–838. [Google Scholar] [CrossRef]
- Martin, A.; David, V.; Quarles, L.D. Regulation and function of the FGF23/klotho endocrine pathways. Physiol. Rev. 2012, 92, 131–155. [Google Scholar] [CrossRef]
- Slatopolsky, E.; Delmez, J.A. Pathogenesis of secondary hyperparathyroidism. Am. J. Kidney Dis. 1994, 23, 229–236. [Google Scholar] [CrossRef]
- Moe, S.; Drueke, T.; Cunningham, J.; Goodman, W.; Martin, K.; Olgaard, K.; Ott, S.; Sprague, S.; Lameire, N.; Eknoyan, G. Definition, evaluation, and classification of renal osteodystrophy: A position statement from Kidney Disease: Improving Global Outcomes (KDIGO). Kidney Int. 2006, 69, 1945–1953. [Google Scholar] [CrossRef] [Green Version]
- Gupta, D.; Brietzke, S.; Hayden, M.R.; Kurukulasuriya, L.R.; Sowers, J.R. Phosphate Metabolism in Cardiorenal Metabolic Disease. Cardiorenal. Med. 2011, 1, 261–270. [Google Scholar] [CrossRef] [Green Version]
- Silva, A.P.; Fragoso, A.; Pinho, A.; Tavares, N.; Camacho, A.; Faisca, M.; Leao Neves, P. Phosphorus as an early marker of morbidity and mortality in type 2 chronic kidney disease diabetic patients. J. Diabetes Complicat. 2013, 27, 328–332. [Google Scholar] [CrossRef] [PubMed]
- Tonelli, M.; Sacks, F.; Pfeffer, M.; Gao, Z.; Curhan, G. Relation between serum phosphate level and cardiovascular event rate in people with coronary disease. Circulation 2005, 112, 2627–2633. [Google Scholar] [CrossRef] [PubMed] [Green Version]
- Yiu, G.; Chiu, S.J.; Petrou, P.A.; Stinnett, S.; Sarin, N.; Farsiu, S.; Chew, E.Y.; Wong, W.T.; Toth, C.A. Relationship of central choroidal thickness with age-related macular degeneration status. Am. J. Ophthalmol. 2015, 159, 617–626. [Google Scholar] [CrossRef]
- Wakatsuki, Y.; Shinojima, A.; Kawamura, A.; Yuzawa, M. Correlation of Aging and Segmental Choroidal Thickness Measurement using Swept Source Optical Coherence Tomography in Healthy Eyes. PLoS ONE 2015, 10, e0144156. [Google Scholar] [CrossRef] [PubMed] [Green Version]
- Endo, H.; Kase, S.; Saito, M.; Yokoi, M.; Takahashi, M.; Ishida, S.; Kase, M. Choroidal Thickness in Diabetic Patients without Diabetic Retinopathy: A Meta-analysis. Am. J. Ophthalmol. 2020, 218, 68–77. [Google Scholar] [CrossRef] [PubMed]
- Kim, J.T.; Lee, D.H.; Joe, S.G.; Kim, J.G.; Yoon, Y.H. Changes in choroidal thickness in relation to the severity of retinopathy and macular edema in type 2 diabetic patients. Investig. Ophthalmol. Vis. Sci. 2013, 54, 3378–3384. [Google Scholar] [CrossRef] [Green Version]
- Rewbury, R.; Want, A.; Varughese, R.; Chong, V. Subfoveal choroidal thickness in patients with diabetic retinopathy and diabetic macular oedema. Eye 2016, 30, 1568–1572. [Google Scholar] [CrossRef] [Green Version]
- Endo, H.; Kase, S.; Takahashi, M.; Yokoi, M.; Isozaki, C.; Katsuta, S.; Kase, M. Alteration of layer thickness in the choroid of diabetic patients. Clin. Exp. Ophthalmol. 2018, 46, 926–933. [Google Scholar] [CrossRef]
- Regatieri, C.V.; Branchini, L.; Carmody, J.; Fujimoto, J.G.; Duker, J.S. Choroidal thickness in patients with diabetic retinopathy analyzed by spectral-domain optical coherence tomography. Retina 2012, 32, 563–568. [Google Scholar] [CrossRef] [PubMed] [Green Version]
- Adhi, M.; Brewer, E.; Waheed, N.K.; Duker, J.S. Analysis of morphological features and vascular layers of choroid in diabetic retinopathy using spectral-domain optical coherence tomography. JAMA Ophthalmol. 2013, 131, 1267–1274. [Google Scholar] [CrossRef] [Green Version]
- Sheth, J.U.; Giridhar, A.; Rajesh, B.; Gopalakrishnan, M. Characterization of macular choroidal thickness in ischemic and nonischemic diabetic maculopathy. Retina 2017, 37, 522–528. [Google Scholar] [CrossRef] [PubMed]
- Vujosevic, S.; Martini, F.; Cavarzeran, F.; Pilotto, E.; Midena, E. Macular and peripapillary choroidal thickness in diabetic patients. Retina 2012, 32, 1781–1790. [Google Scholar] [CrossRef] [PubMed]
- Wang, W.; Liu, S.; Qiu, Z.; He, M.; Wang, L.; Li, Y.; Huang, W. Choroidal Thickness in Diabetes and Diabetic Retinopathy: A Swept Source OCT Study. Investig. Ophthalmol. Vis. Sci. 2020, 61, 29. [Google Scholar] [CrossRef] [Green Version]
- Choi, S.U.; Oh, J.Y.; Kim, J.T. Correlations between choroidal thickness and renal function in patients with retinal vein occlusion. Sci. Rep. 2020, 10, 16865. [Google Scholar] [CrossRef] [PubMed]
- Lains, I.; Figueira, J.; Santos, A.R.; Baltar, A.; Costa, M.; Nunes, S.; Farinha, C.; Pinto, R.; Henriques, J.; Silva, R. Choroidal thickness in diabetic retinopathy: The influence of antiangiogenic therapy. Retina 2014, 34, 1199–1207. [Google Scholar] [CrossRef] [PubMed]
- Nourinia, R.; Ahmadieh, H.; Nekoei, E.; Malekifar, P.; Tofighi, Z. Changes in Central Choroidal Thickness after Treatment of Diabetic Macular Edema with Intravitreal Bevacizumab Correlation with Central Macular Thickness and Best-Corrected Visual Acuity. Retina 2018, 38, 970–975. [Google Scholar] [CrossRef]
- Kang, H.M.; Lee, N.E.; Choi, J.H.; Koh, H.J.; Lee, S.C. Significant Reduction of Both Peripapillary and Subfoveal Choroidal Thickness after Panretinal Photocoagulation in Patients with Type 2 Diabetes. Retina 2018, 38, 1905–1912. [Google Scholar] [CrossRef]
- Agrawal, R.; Wei, X.; Goud, A.; Vupparaboina, K.K.; Jana, S.; Chhablani, J. Influence of scanning area on choroidal vascularity index measurement using optical coherence tomography. Acta Ophthalmol. 2017, 95, e770–e775. [Google Scholar] [CrossRef] [Green Version]


| Variable | Healthy Controls | No DR | Mild/Moderate NPDR | Severe NPDR | Treatment-Naïve PDR | p-Value † |
|---|---|---|---|---|---|---|
| Number of patients | 30 | 32 | 33 | 34 | 32 | - |
| Number of eyes | 30 | 32 | 33 | 34 | 32 | - |
| Age (years) | 59.1 ± 13.9 | 58.2 ± 16.5 | 58.7 ± 11.0 | 55.9 ± 9.3 | 49.6 ± 9.9 | 0.058 |
| DM Duration (years) | - | 8.5 ± 5.2 | 14.0 ± 9.3 | 18.9 ± 26.1 | 12.0 ± 7.5 | 0.11 |
| Hemoglobin A1c, % | - | 9.1 ± 2.1 | 7.9 ± 0.6 | 7.7 ± 1.4 | 8.8 ± 2.3 | 0.032 |
| Number of Patients with Hypertension, n (%) | - | 20 (62.5%) | 25 (86.2%) | 27 (79.4%) | 24 (82.7%) | - |
| Systolic BP (mmHg) | - | 123.2 ± 13.5 | 126.3 ± 13.5 | 131.2 ± 20.1 | 132.3 ± 19.1 | 0.194 |
| Diastolic BP (mmHg) | - | 70.2 ± 7.2 | 71.2 ± 8.5 | 75.7 ± 12.0 | 82.4 ± 18.1 | 0.006 |
| BMI (kg/m2) | 25.2 ± 2.8 | 24.8 ± 4.5 | 26.1 ± 3.9 | 25.2 ± 3.8 | 25.8 ± 4.6 | 0.347 |
| Height | 1.60 ± 0.07 | 1.62 ± 0.08 | 1.63 ± 0.08 | 1.65 ± 0.08 | 1.67 ± 0.08 | 0.09 |
| Weight | 64.6 ± 9.1 | 64.1 ± 10.8 | 68.9 ± 10.1 | 68.1 ± 13.5 | 74.2 ± 15.6 | 0.191 |
| BCVA (LogMAR) | 0.06 ± 0.08 | 0.1 ± 0.07 | 0.06 ± 0.08 | 0.12 ± 0.27 | 0.24 ± 0.32 | 0.027 |
| IOP (mmHg) | 15.9 ± 3.0 | 15.6 ± 5.2 | 16.7 ± 3.6 | 16.2 ± 3.2 | 16.1 ± 2.8 | 0.888 |
| SE (diopter) | −0.42 ± 1.82 | 0.51 ± 0.41 | −0.56 ± 1.61 | −0.62 ± 1.83 | −1.38 ± 1.98 | 0.042 |
| CRT (µm) | 221.0 ± 22.3 | 231.4 23.6 | 245.6 26.9 | 244.8 62.4 | 252.7 ± 51.5 | 0.043 |
| SFChT (µm) | 274.3 ± 31.9 | 256.8 ± 16.1 | 269.1 ± 80.8 | 305.4 ± 72.2 | 319.7 ± 88.5 | 0.002 |
| SFChT (µm), age adjusted * | 272.6 ± 11.4 | 250.2 ± 15.7 | 263.5 ± 12.4 | 299.9 ± 10.5 | 299.5 ± 9.7 | 0.002 |
| CVI | 0.677 ± 0.023 | 0.658 ± 0.031 | 0.652 ± 0.032 | 0.666 ± 0.032 | 0.668 ± 0.029 | 0.034 |
| CVI, age adjusted * | 0.678 ± 0.007 | 0.658 ± 0.007 | 0.654 ± 0.005 | 0.667 ± 0.005 | 0.666 ± 0.004 | 0.045 |
| Variable | No DR | Mild/Moderate NPDR | Severe NPDR | Treatment-Naïve PDR | p-Value † |
|---|---|---|---|---|---|
| BUN (mg/dL) | 13.88 ± 5.33 | 17.29 ± 5.18 | 18.10 ± 9.17 | 22.26 ± 13.26 | 0.012 |
| Creatinine (mg/dL) | 0.76 ± 0.21 | 0.80 ± 0.24 | 0.96 ± 0.49 | 1.72 ± 20.5 | 0.003 |
| BUN/Cr ratio | 18.69 ± 7.01 | 21.99 ± 6.09 | 19.93 ± 7.52 | 17.81 ± 7.09 | 0.072 |
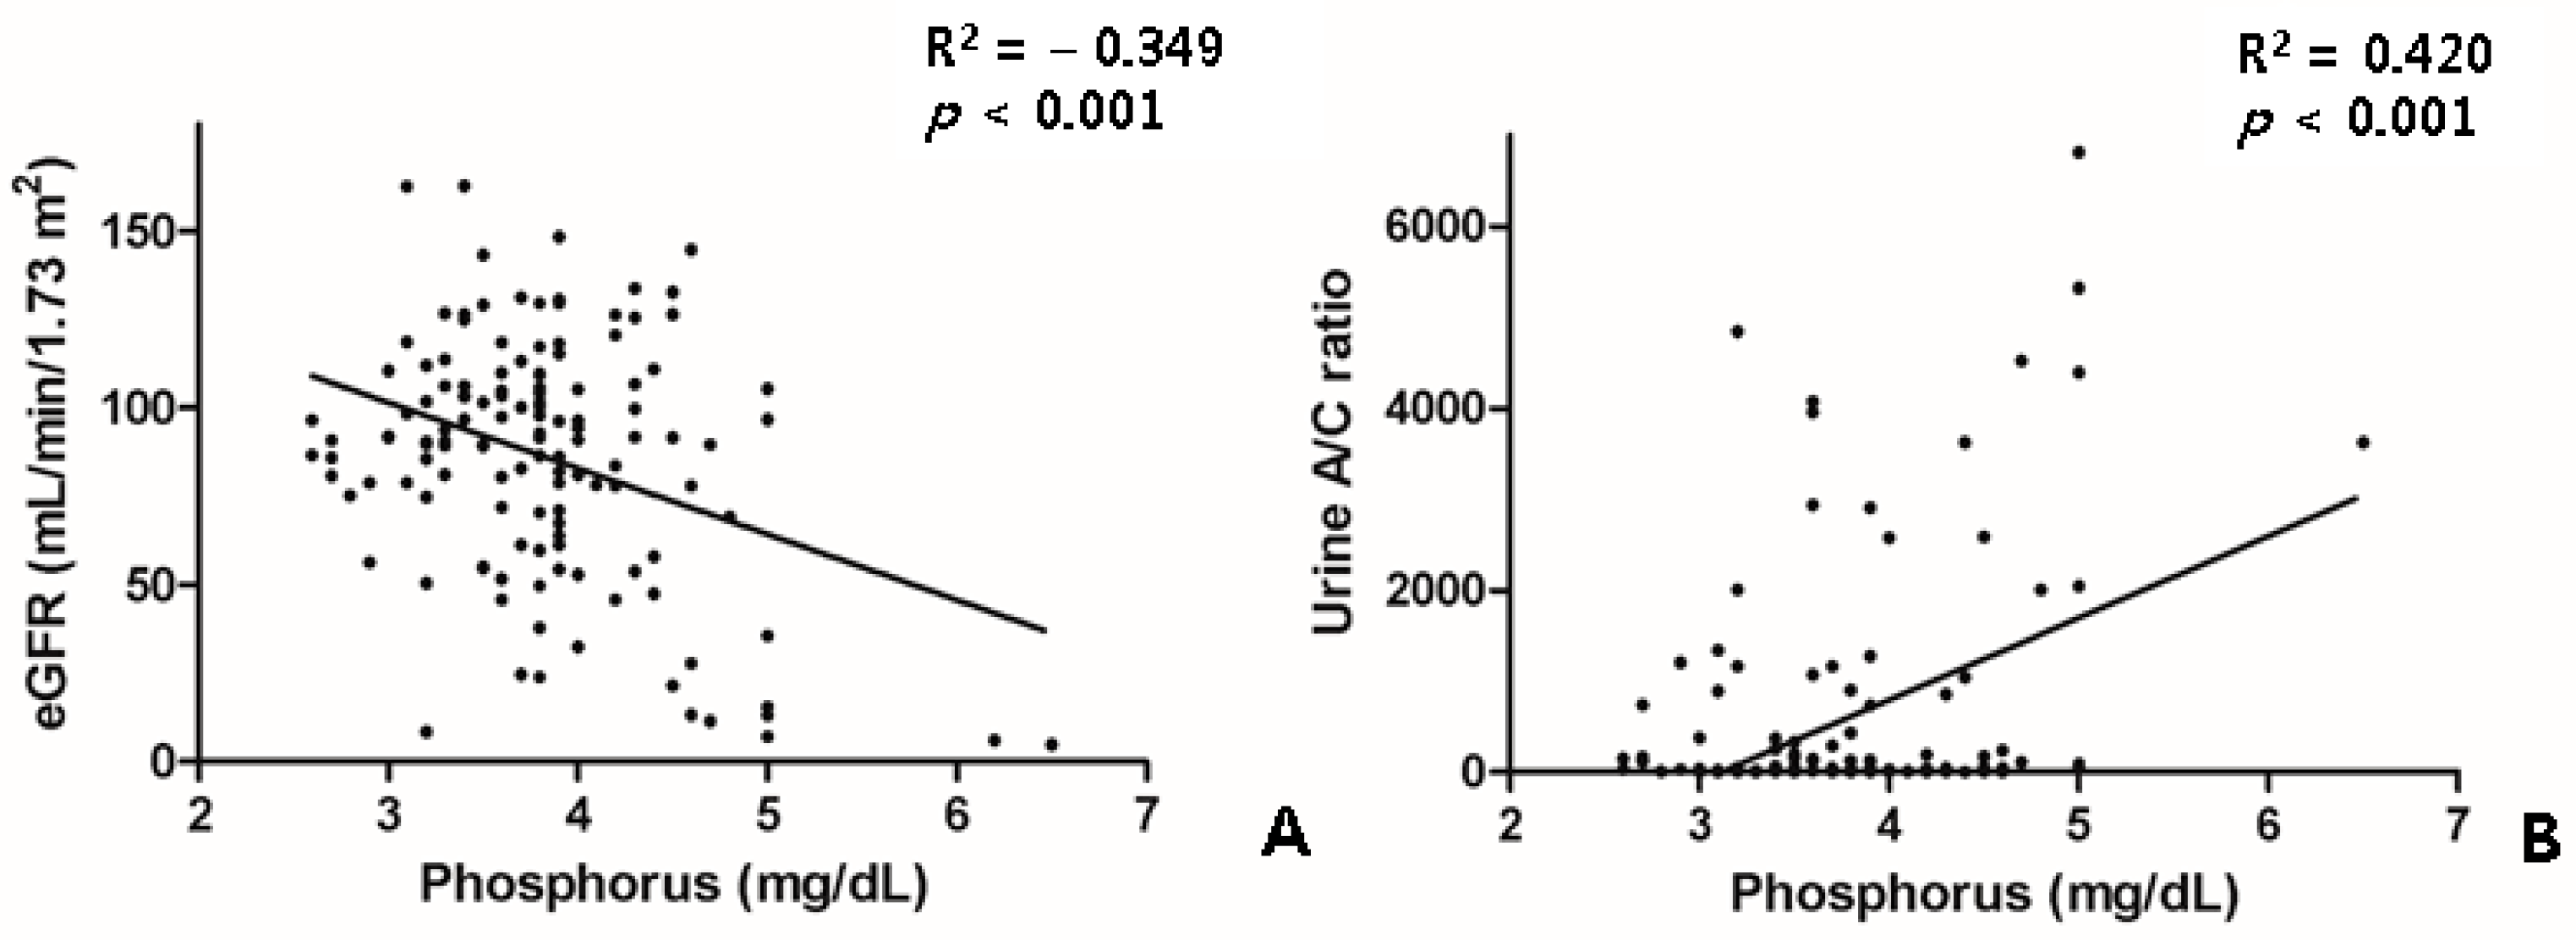
| eGFR (mL/min/1.73 m2) | 99.14 ± 22.23 | 97.11 ± 21.82 | 88.52 ± 30.22 | 73.73 ± 41.51 | 0.004 |
| Phosphorus (mg/dL) | 3.67 ± 0.47 | 3.76 ± 0.65 | 3.72 ± 0.47 | 3.94 ± 0.76 | 0.286 |
| Calcium (mg/dL) | 9.19 ± 0.38 | 9.03 ± 0.35 | 9.05 ± 0.36 | 8.94 ± 0.51 | 0.197 |
| Urine albumin (mg/L) | 41.86 ± 105.43 | 146.16 ± 319.31 | 540.54 ± 1911.99 | 1399.0 ± 2299.73 | 0.004 |
| Urine A/C ratio | 26.23 ± 67.08 | 163.06 ± 482.49 | 291.88 ± 658.22 | 1387.98 ± 1958.73 | <0.001 |
| Variables | Univariate Linear Regression | Multivariate (Stepwise) Linear Regression | |||
|---|---|---|---|---|---|
| Standardized β | R2 | p-Value | Standardized β | p-Value | |
| Age (years) | −0.312 | 0.09 | 0.002 * | −0.207 | 0.013 * |
| Systolic BP (mmHg) | 0.115 | 0.013 | 0.263 | ||
| Diastolic BP (mmHg) | 0.222 | 0.049 | 0.029 * | 0.058 | 0.454 |
| BMI (kg/m2) | −0.013 | 0.000 | 0.897 | ||
| Height (m) | 0.333 | 0.111 | 0.001 * | ||
| Weight (kg) | 0.031 | 0.031 | 0.086 | ||
| BCVA(LogMAR) | −0.086 | 0.007 | 0.404 | ||
| SFChT (µm) | 0.560 | 0.313 | <0.001 * | 0.473 | <0.001 * |
| CRT (µm) | −0.064 | 0.004 | 0.534 | ||
| Spherical equivalent (diopter) | −0.051 | 0.003 | 0.621 | ||
| BUN (mg/dL) | −0.053 | 0.003 | 0.606 | ||
| Cr (mg/dL) | −0.024 | 0.001 | 0.819 | ||
| BUN/Cr | −0.031 | 0.001 | 0.766 | ||
| eGFR (mL/min/1.73 m2) | 0.105 | 0.011 | 0.305 | ||
| Phosphorus (mg/dL) | −0.422 | 0.175 | <0.001 * | −0.269 | 0.002 * |
| Calcium (mg/dL) | −0.053 | 0.002 | 0.467 | ||
| Urine albumin (mg/L) | 0.108 | 0.006 | 0.137 | ||
| Urine A/C ratio | 0.068 | 0.005 | 0.354 | ||
Publisher’s Note: MDPI stays neutral with regard to jurisdictional claims in published maps and institutional affiliations. |
© 2021 by the authors. Licensee MDPI, Basel, Switzerland. This article is an open access article distributed under the terms and conditions of the Creative Commons Attribution (CC BY) license (https://creativecommons.org/licenses/by/4.0/).
Share and Cite
Kim, J.T.; Lee, I.G. Correlation of Renal Profiles with Choroidal Vascularity Index in Eyes with Diabetic Retinopathy. J. Clin. Med. 2021, 10, 5155. https://doi.org/10.3390/jcm10215155
Kim JT, Lee IG. Correlation of Renal Profiles with Choroidal Vascularity Index in Eyes with Diabetic Retinopathy. Journal of Clinical Medicine. 2021; 10(21):5155. https://doi.org/10.3390/jcm10215155
Chicago/Turabian StyleKim, Jee Taek, and In Gul Lee. 2021. "Correlation of Renal Profiles with Choroidal Vascularity Index in Eyes with Diabetic Retinopathy" Journal of Clinical Medicine 10, no. 21: 5155. https://doi.org/10.3390/jcm10215155
APA StyleKim, J. T., & Lee, I. G. (2021). Correlation of Renal Profiles with Choroidal Vascularity Index in Eyes with Diabetic Retinopathy. Journal of Clinical Medicine, 10(21), 5155. https://doi.org/10.3390/jcm10215155