Abstract
The use of recycled ultrafiltration (r-UF) membranes, originating from end-of-life reverse osmosis membranes, as submerged flat-sheet membranes in an aerobic membrane bioreactor (aMBR) system is described herein for the first time. A feasibility study of this new approach was performed in a laboratory-scale aMBR system. The r-UF membrane performance was evaluated in terms of permeability, fouling behavior, and permeate quality using a widely used commercial flat sheet microfiltration membrane (c-MF) as a reference. Tests were conducted under steady-flux operation (at 12 and 14 L·m−2·h−1) and a variable trans-membrane pressure. Synthetic wastewater simulating urban wastewater characteristics with approx. 0.4–0.5 g/L COD concentration was used as the feed. The obtained results showed that the rejection performance of the r-UF membrane was similar to the performance of the commercial flat sheet microfiltration membrane (c-MF) under comparable operating conditions. Moreover, concerning fouling behavior, the r-UF membrane exhibited higher fouling resistance compared with the c-MF membrane, although the permeability decline rate was lower. Both membranes had comparable fouling mechanisms behavior, with cake layer fouling resistance accounting for approx. 60% of the total fouling resistance. Finally, a preliminary economic assessment pointed out the potential competitiveness of using r-UF membranes for aMBRs (5.9–10.9 EUR·m−2) and the scaling-up challenges toward industrial applications.
1. Introduction
During the last few decades, membrane bioreactors (MBRs) for wastewater treatment have gained increasing significance. The installed capacity in 2019 was estimated at over 2 × 10⁷ m3 per day, including medium- and high-capacity treatment plants [1]. The trend is also positive when economic data are considered. The global market of MBR reached EUR 2.5 billion in 2019 and it is expected to reach EUR 3.5 billion by 2024 [2]. The main reason for this economic growth is the notable advantages of MBRs compared with the conventional activated sludge (CAS) process. The use of membranes for treated effluent separation allows for the MBR to operate at higher volumetric loading rates than CAS systems, leading also to smaller space requirements for the facilities. In addition, an MBR provides higher removal efficiency regarding pollutants, nutrients, microorganisms, and suspended solids due to the use of membranes.
Despite these advantages, MBR processes still face some difficulties that need to be overcome. Specifically, increased energy consumption and membrane fouling, which leads to significant chemicals consumption and early membrane replacement, substantially increase MBR operating expenses (OPEX) [3]. According to Iglesias et al., the replacement cost of the membranes can contribute between 0.02 and 0.04 EUR per m3 of produced effluent (assuming a membrane lifespan of 8–10 years), which accounts for approximately 10–12% of the OPEX [4]. This membrane-related cost is even higher if energy consumption for aeration and chemicals used during membrane cleaning are considered. Moreover, the service life of MBR membranes is affected by the frequency of the cleaning cycles, ultimately resulting in membrane replacement with the consequent additional costs. This is one of the reasons that there is a significant amount of ongoing research focused on the assessment of novel low-cost membranes and membrane surface modification methods for fouling prevention and mitigation (e.g., [5,6]).
Senán-Salinas et al. reported that it would be possible to obtain recycled modules with a price range of 45–100 EUR per module, depending on the recycling strategy [7]. Even though the unitary cost for a commercial UF membrane module could be affected by the peculiarities of every acquisition’s transaction, it could be considered that the pristine commercial module prices are between 400–800 EUR per module [7,8]. Therefore, in view of the above data, the use of recycled membranes could offer a competitive alternative to reduce the membrane replacement cost in the MBR process.
Currently, waste-related legislation in most countries still follows the traditional concept of a linear economy. Consequently, most end-of-life (EoL) membranes are disposed of in landfills without considering other management alternatives, in contrast with the circular economy principles set by the European Commission [9]. In this context, research studies are reported on implementing novel reverse osmosis (RO) membrane recycling/reuse strategies, following the circular economy approach [10,11,12,13,14]. Until now, the research and development of such recycled membranes have focused on verifying their feasibility and suitability for diverse processes, such as (i) direct reuse as RO membranes [10], (ii) direct recycling of EoL RO membranes as nanofiltration (NF) and ultrafiltration (UF) membranes [11], (iii) use as a support for biofilm-membrane reactors [12], and (iv) indirect recycling as membrane support for ion exchange electrodialysis membranes [13]. Recycling processes have also been tested at a pilot scale and validated in water treatment facilities [14]. However, to the authors’ best knowledge, the recycling of RO membranes and their application on MBR systems have never been tested.
The present work is a proof-of-concept study that aimed to evaluate the feasibility of using recycled ultrafiltration (r-UF) membranes obtained from EoL RO membranes as submerged flat-sheet membranes in an aerobic MBR (aMBR) system. The process performance of the r-UF membranes was evaluated in terms of the (i) membrane permeability, (ii) resulting permeate quality, and (iii) membrane fouling behavior. Furthermore, a preliminary cost analysis of the use of r-UF membranes is discussed to provide insight into the economic feasibility of the proposed application.
2. Materials and Methods
2.1. Chemicals
The chemicals used for the preparation of synthetic urban wastewater were glucose (C6H12O6) D(+) glucose anhydrous, extra pure, Ph Eur, BP, USP (Sigma-Aldrich; Baden-Württemberg, Germany); meat peptone (Sigma-Aldrich; Baden-Württemberg, Germany); urea (Urea, ACS reagent grade, Sigma-Aldrich; Baden-Württemberg, Germany); sodium chloride (NaCl reagent grade, ACS, ISO, Reag. Ph Eur, Sigma-Aldrich; Baden-Württemberg, Germany); sodium bicarbonate (NaHCO3, extra pure, Pharmpure®, Ph Eur, BP, USP, Sigma-Aldrich; Baden-Württemberg, Germany); di-potassium hydrogen phosphate anhydrous (K2HPO4 for analysis, ExpertQ®, ACS, Reag. Ph Eur, Sigma-Aldrich; Baden-Württemberg, Germany); calcium chloride dihydrate (CaCl2·2H2O powder, for analysis, ExpertQ®, ACS, Sigma-Aldrich; Baden-Württemberg, Germany); magnesium sulfate heptahydrate (MgSO4·7H2O for analysis, ExpertQ®, ACS, Reag. Ph Eur Sigma-Aldrich, Baden-Württemberg, Germany); and iron (III) chloride hexahydrate, (FeCl3·6H2O ACS reagent 97%, Sigma Aldrich, Baden-Württemberg, Germany). The chemicals used for the membrane recycling process and membrane cleaning were sodium hypochlorite (NaOCl 10% w/v, Scharlab; Barcelona, Spain) and ethanol (96% EPR Ph.Eur. Sigma-Aldrich; Baden-Württemberg, Germany). Samples and solutions were prepared using Milli-Q water.
2.2. Membranes: Description and Characterization
The performance of an r-UF membrane was evaluated in terms of the (i) membrane permeability, (ii) permeate quality, and (iii) membrane fouling behavior. A c-MF membrane (Table 1), widely used in MBR systems, was also employed as a reference membrane to set the performance benchmarks for the evaluation of the r-UF membrane performance. The c-MF was selected for its wide-ranging application in MBR plants in Spain [4].

Table 1.
Commercial microfiltration (c-MF) and recycled ultrafiltration (r-UF) membranes’ technical data.
As Figure 1 shows, the r-UF membranes were obtained by eliminating the polyamide (PA) layer of EoL RO membranes by means of exposure to a NaOCl dose of 800,000 ppm·h, according to the procedure proposed by García-Pacheco et al. [15]. Membrane transformation was conducted on the whole module at a pilot scale [14]. The recycling process was performed by conducting a passive transformation by immersing the entire modules into the NaOCl solution to chemical attack the membrane surface to eliminate the polyamide layer. Then, the module was disassembled to obtain the membrane samples used in the present study. Coupons (0.06 m2 area) of the r-UF membrane (12 nm nominal pore size) were used in this study
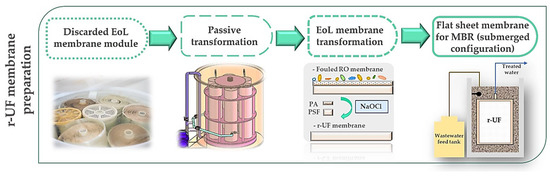
Figure 1.
r-UF membrane preparation flow chart.
2.3. Experimental Set-Up
The experiments were performed in a lab-scale aerobic MBR system that allowed for continuous operation. The MBR tank volume was approx. 18 L and a flat sheet membrane module with an effective membrane area of 0.11 m2 in a submerged configuration were employed. A piston pump (Fluid Metering Inc.; Syosset, NY, USA) was used for constant flux operation, whereas a pressure transducer recorded the temporal evolution of the TMP. A pH meter with an integrated temperature sensor (713-type pH meter, Metrohm Ltd.; Herisau, Switzerland) was used to monitor the pH and temperature of the bioreactor. The laboratory-scale aMBR was built and set in operation at the Natural Resources and Renewable Energies Laboratory (NRRE) of the Chemical Processes and Energy Resources Institute (CPERI/CERTH; Thessaloniki, Greece). Details of the construction and characteristics of the aMBR unit can be found elsewhere [18].
The membranes were tested in the aMBR unit using synthetic wastewater (SWW) simulating urban wastewater, with an approximate COD concentration of 0.4–0.5 g/L. The synthetic wastewater feed was selected, instead of real municipal wastewater, to minimize the fluctuations in the parameters of the feed and render the operating conditions of the aMBR steady and reproducible regarding its feed characteristics. The feed stream was made by diluting a 50-times-concentrated cSWW with tap water. To avoid early contamination and spoilage, concentrated SWW was pasteurized by placing it in an oven at 50–60 °C for 5–6 h. The concentrated SWW composition was as follows: 300 mg/L C6H12O6, 100 mg/L peptone, 30 g/L CH4N2, 28 mg/L K2HPO4, 7 mg/L NaCl, 4 g/L CaCl2, 2 mg/L MgSO4, 2 mg/L FeCl3·6H2O, and 150 mg/L NaHCO3. Initial sludge inoculum was obtained from the Municipal Wastewater Treatment Plant of Thessaloniki. To assess the MBR performance, the trans-membrane pressure (TMP), pH, and temperature data were monitored and stored daily. The MBR feed and permeate were analyzed twice a week, together with the characterization of the mixed liquor properties. The mixed liquor suspended solids (MLSS), dissolved oxygen (DO), biochemical oxygen demand (BOD5), and chemical oxygen demand (COD) were determined based on APHA Standard Methods procedures [19]. TP and TN were determined colorimetrically (UV-1700 Spectrophotometer, Shimadzu Co.; Kyoto, Japan) based on DIN 38405 D9 (N-NO3) and DIN EN ISO 6878 (P-PO4) methods, respectively, after sample digestion using sulfuric acid/peroxydisulfate and alkaline potassium persulfate. TOC was measured using a TOC analyzer (TOC-5000A, Shimadzu Co.; Kyoto, Japan). DO concentration in the bioreactor was measured by an oxygen probe (Z921, Consort). MLSS were measured via filtration on a Whatman GF/A microfiber glass filter (1.6 μm nominal pore size).
A steady-flux (J, L·m−2·h−1) operation and variable TMP were selected to evaluate the membrane filtration performance. The steady-flux operation was achieved by employing a positive displacement (piston) pump (FMI—piston metering pumps), which can retain a steady volumetric flow rate, regardless of the pumping pressure (i.e., TMP). Two different flux values were employed for each membrane, i.e., 12 and 14 L·m−2·h−1, to evaluate the performance of the r-UF membrane under at least two different filtration conditions to increase the validity of the drawn conclusions. These flux values were lower compared with the flux values of commercial MBR systems (i.e., 20–30 L·m−2·h−1) to avoid operation close to the critical flux values. The critical flux value is defined as the highest initial flux where the TMP values remain rather stable [20], and it is suggested that submerged membranes of MBR systems should operate in the subcritical flux region [21]. Membrane operation was set on cycles of 8 min of suction followed by 2 min of relaxation. The laboratory-scale aMBR unit was operated at a hydraulic retention time (HRT) of 7 h. Except for the samples necessary for analyses and monitoring, no biomass was wasted from the reactor during the operation for days 1–25 (resulting in a sludge retention time SRT = ∞), whereas for days 26–41, 60 mL/d of mixed liquor (SRT = 233 days) were wasted. Regular measurements of pH, EC, and DO and MLSS concentrations were performed during the whole 41-day experiment to ascertain that the MBR operated under the same operating conditions, achieving pseudo-steady-state conditions. The average values and the SD of the aforementioned measurements were as follows: pH = 7.83 ± 0.18, EC = 942.5 ± 42.4 µS/cm, DO = 1.29 ± 0.24 mg/L, and MLSS = 5.06 ± 0.96 g/L. The low SD of the measurements denoted that the MBR operated under pseudo-steady-state conditions. The permeability decline rate (k) was estimated for different periods with linear regression models. The basic package of R software v.4 was used for the static assessment [22].
The initial experimental goal for each operating stage was to operate under the selected operating parameters for at least a week (7 days). However, after the first operating stage Ia, the duration of the following stages was increased to gather more data (e.g., for stage Ib) and/or to further study the sudden TMP increase between days 5 and 6 during stage IIb). Therefore, after a start-up period of 20 days, when the biomass was acclimatized to the operating conditions, the laboratory-scale aMBR plant operated for a total period of 41 days. During the first operating period (period I), the c-MF membrane was used, i.e., (Ia) c-MF (7 days, 12 L·m−2·h−1) and (Ib) c-MF (15 days, 14 L·m−2·h−1); whereas, during the second operating period (period II), the r-UF membrane was used, i.e., (IIa) r-UF (10 days, 12 L·m−2·h−1) and (IIb) r-UF (9 days, 14 L·m−2·h−1). The c-MF and the r-UF were meticulously mechanically cleaned between stages Ia and Ib, and between stages IIa and IIb, respectively. For the mechanical cleaning, membranes were first rinsed with tap water. Then, the membranes were, again, rinsed with tap water for one minute on each side. Then, using a wet sponge each side was vertically and horizontally cleaned. Finally, the membranes were immersed in a tank with tap water with aeration for 5 more minutes.
2.4. Membrane Fouling Analysis
Membrane Resistance Analysis
Membrane fouling at the end of each membrane operating period (i.e., after stages Ib and IIb) was analyzed using a resistance-in-series model proposed by Di Bella et al. to assess the relative importance of pore blocking and cake layer formation on both membranes [23]. A schematic representation of the different resistances to permeation affecting the membrane performance can be seen in Figure 2.
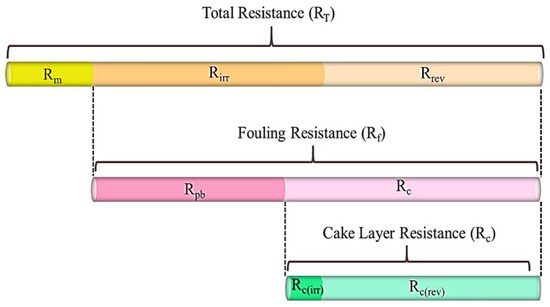
Figure 2.
The role of fouling mechanisms in a membrane bioreactor. Modified from Di Bella et al. by specifying the two types of cake layer resistances [24].
The various filtration resistances during MBR operation can be described using Darcy’s law (Equation (1)), as follows:
Here, R is the resistance to permeation (m−1), TMP is the trans-membrane pressure (Pa), µ (Pa·s) is the permeate dynamic viscosity (water viscosity at 20 °C), and J is the permeate flux (m3·m−2·s−1). Further, the membrane resistance Rm (m−1) is the original resistance that a pristine membrane presents during clean water filtration (Equation (2)):
The total resistance, RT (m−1), is defined as the sum of three different resistances at the end of each membrane operating period Ib and IIb (Equation (3)):
where Rc (rev) (m−1) represents the reversible fraction of the cake layer resistance that is removable during relaxation or backwashing. Rc(ir) (m−1) corresponds to the irreversible fraction of the cake layer resistance that cannot be removed during relaxation or backwashing. Rpb indicates the fraction of the fouling affecting the membrane pores. Fouling resistance (Rf (m−1)) is defined as the total resistance due to fouling, excluding the membrane resistance Rm (Equation (4)):
2.5. Preliminary Economic Assessment
To evaluate the economic potential of recycling EoL RO membranes to MBR submerged flat-sheet UF membranes, the cost of producing r-UF MBR membranes (EUR·m2) was analyzed. Figure 3 shows the processes considered (i.e., the system boundaries) when conducting the cost analysis of the EoL RO recycling into r-UF MBR membranes.
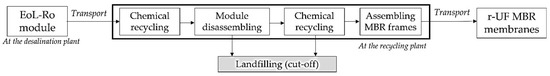
Figure 3.
System boundaries of the economic analysis of r-UF membrane production process.
The costs of EoL-RO collection and the transformation into UF were adopted from Senán-Salinas et al. [7]. The module disassembling was analyzed in Lawler et al. [25]. Finally, the adaptation of EoL-RO membrane sheets into MBR flat sheets frames was conducted by considering five different commercial and standardized MBR frames [26].
3. Results and Discussions
3.1. Characterization of the Studied Membranes: Permeability and Pore Size
Membrane permeability and pore size are two of the main membrane properties that affect membrane performance and the technological niche of a UF membrane for an aMBR. To illustrate the state of the art of commercial membranes and identify the technological position of the studied r-UF membranes, Figure 4 summarizes the values of the clean water permeability versus the nominal pore size of the commercial membranes and the recycled ones.
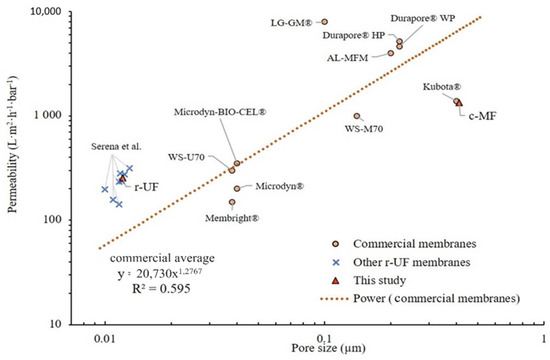
Figure 4.
Membrane permeability for clean water according to pore size for commercial membranes and the membrane used in the present study according to Judd et al. and Molina et al. [15,26].
The obtained permeability (L; L·m−2·h−1·bar−1) for the r-UF membrane was 255 ± 4 L·m−2·h−1·bar−1. This permeability value is in accordance with the average permeability range of various UF commercial membranes (i.e., 200−300 L·m−2·h−1·bar−1) (Figure 3). Furthermore, the results summarized in Figure 4 provide evidence of the strong non-linear relationship (R2 = 0.595) between the pore size and the permeability of UF and MF commercial flat sheet aMBR membranes. Even though the r-UF membrane presents a pore size that is much smaller than the pore size usually found among the commercial ones, the permeability values are in the same range as the UF commercial membranes (i.e., 200–300 L·m−2·h−1·bar−1).
3.2. Performance Efficiency of the Lab-Scale aMBR Unit
3.2.1. Permeate Quality
Regarding the permeate quality, Table 2 shows the obtained results for the analyzed parameters of the permeate.
Table 2.
Permeate quality and removal efficiency average values of the four different operating stages (Ia, Ib, IIa, and IIb). The p-values marked as * indicate the ANOVA results between permeate quality of the two membranes for every stage that were statistically significant with a confidence level over 95%.
TOC, COD, and BOD5 average removal values for the r-UF MBR were higher than 98.9 ± 0.3% and up to 99.7 ± 0.1%. The organic matter removal efficiency of the c-MF MBR was equally high, i.e., higher than 98.2 ± 0.2%, during the whole operation. Moreover, turbidity values obtained with the r-UF membrane were very low, i.e., 0.04 ± 0.02 NTU during stage IIa and 0.01 ± 0.05 NTU during stage IIb. Taking Spanish legislation into consideration, the turbidity values obtained were consistent with the stricter requirements for treated wastewater reuse [27]. The turbidity values of the c-MF permeate were also quite low (i.e., 0.14 ± 0.01 NTU during stage Ia and 0.29 ± 0.32 NTU during stage Ib). However, the average values of the c-MF turbidity were statistically higher than the values of the r-UF. Another statistically significant difference in the average values concerning the permeate quality was the TOC concentration. Although the TOC concentration of the effluent was very low during all operating stages, the average values of the r-UF MBR permeate were slightly lower compared with the respective values of the c-MF. Overall, the permeate quality obtained using the r-UF membrane was slightly better than that obtained with the c-MF membrane. With regard to the membrane retention capacity, intrinsic properties of UF membrane (especially the lower molecular weight cut-off (MWCO)) seemed to make a difference in the retention efficiency of, e.g., dissolved solids (mainly organic macromolecules) [28]. For the r-UF membrane, the MWCO was estimated in previous studies and is considered to be around 20 kDa [29].
3.2.2. Membrane Permeability Stability and Preliminary Fouling Assessment
Figure 5 shows the transmembrane pressure evolution of both membranes (r-UF and c-MF) performing at 12 and 14 L·m−2·h−1. It was observed that the c-MF membrane barely exhibited a TMP increase when operated at 12 L·m−2·h−1 (stage Ia). Even when the flux increased to 14 L·m−2·h−1, a constant yet mild TMP increase was observed. Concerning the r-UF membrane, it was observed that its behavior changed depending on the flux value. At 12 L·m−2·h−1, the r-UF membrane presented a small TMP increase that lasted up to seven days, followed by a rather stable TMP profile for the next three days. On the other hand, the r-UF working at 14 L·m−2·h−1 showed a sharp TMP increase between days 5 and 6 that could not be attributed to a specific reason. However, after this sharp increase, the TMP seemed to stabilize.
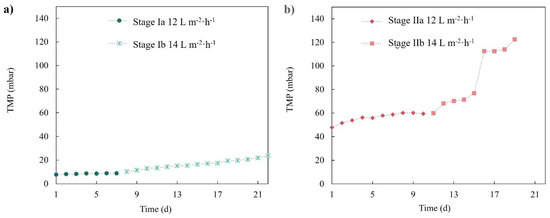
Figure 5.
TMP temporal profile for (a) the c-MF membrane in stages Ia and Ib and (b) the r-UF membrane in stages IIa and IIb.
To further assess the membrane filtration performances, the evolution of the membranes’ permeabilities was calculated. Figure 6 presents the permeability temporal profile for both membranes, together with the calculated linear permeability decline rate. The c-MF membranes presented an evident permeability decline during both experimental periods when performing at 12 and 14 L·m−2·h−1 (stages Ia and Ib). At the same time, the r-UF membrane clearly presented a milder permeability decline, especially when performing at 12 L·m−2·h−1 (stage Ia).
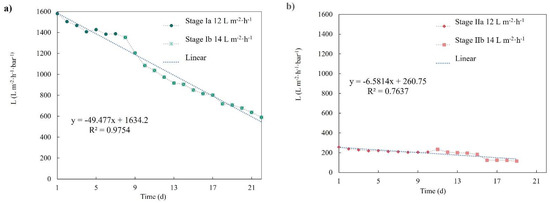
Figure 6.
(a) Permeability evolution for the c-MF membrane in stages Ia and Ib and (b) the r-UF membrane in stages IIa and IIb.
The permeability decline rates were also calculated for the different operating stages and are summarized in Table 3. The permeability decline values of the r-UF membrane were quite low when operating at both 12 and 14 L·m−2·h−1. The permeability decline range obtained with the r-UF membranes was similar to the commercial membrane range reported in Adham et al. for membranes with similar mean permeability (140–200 L·m−2·h−1·bar−1), operating in an MLSS concentration of 8–12 g·L−1 [30]. Therefore, upon a first look, it seems that the performance feature of the r-UF was comparable to commercial membranes, although long-term tests should be performed in future studies to confirm these results. The permeability decline rate was also slightly better than the permeability decline of the c-MF membrane under rather similar operating conditions.
Table 3.
Summary of membrane permeability decline values for the different operating stages.
A major factor affecting permeability is the fouling phenomenon, comprising the adsorption and deposition of solutes. Among other factors and membrane properties, the membrane MWCO has an important effect on the fouling phenomena. Moreover, Li et al. reported that flux decline would be more pronounced in membranes with a larger MWCO due to membranes with larger pores being more prone to pore blocking [31]. In the present work, the r-UF membrane showed a rather steady permeability decline, which, after the sixth day, appeared to be reduced or even stabilized. Due to the complex and highly variable nature of the biological sludge, the filtration performance would also depend on the particular characteristics of the sludge. This makes it necessary to take into consideration other membrane characteristics to explain the whole phenomenon. Besides the MWCO, another important factor that affects membrane behavior is surface roughness [32]. The r-UF membrane’s roughness was published by Rodríguez-Sáez et al. [17]. The r-UF membrane exhibited a roughness value (Ra = 4.7 ± 0.6 nm, Rq = 6.3 ± 1.2 nm) two orders of magnitude lower than the roughness value of the c-MF membrane. Furthermore, the obtained roughness values for the r-UF membrane were similar to the values obtained measuring commercial polysulfone UF membranes [33]. Long-term flux decline was additionally associated with the cake layer formation, where membranes with greater roughness are more prone to fouling [34]. Furthermore, it is assumed that membranes with higher hydrophilicity are less susceptible to present fouling issues [32]. The wettability of the membrane would be determined by the material that membranes are made of. According to Molina et al., the measured contact angle (CA) for r-UF membranes is over 66–68° [15]. The more hydrophilic character of the r-UF membrane, together with its lower MWCO and the lower surface roughness, probably contributed to the lower permeability decline rate compared with the c-MF membrane.
3.2.3. Evaluation of Fouling Mechanisms
Results obtained regarding membrane fouling mechanisms are presented in Figure 7 using the resistance in series (RIS) analysis after the end of the operating period of each membrane. The presented Rc values include both reversible and irreversible cake layer resistance, whereas Rir values comprise the resistances of the irreversible cake layer and the pore-blocking mechanism.
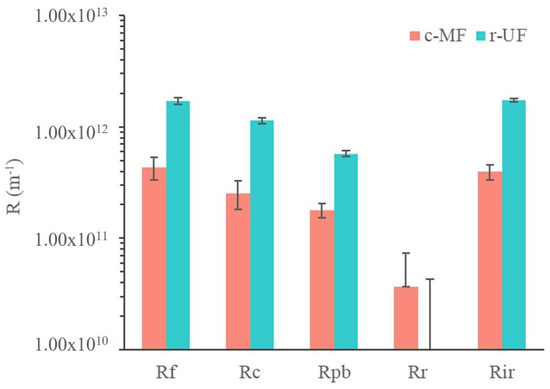
Figure 7.
Estimated filtration resistances for the c-MF and r-UF membranes after stages Ib and IIb.
It is important to note that Rm of the r-UF membrane was, as expected, higher than that of the c-MF membrane; the Rm for the r-UF membrane was 1.57 ± 0.01 × 10¹² m−1, and for the c-MF membrane, it was 0.27 ± 0.01 × 10¹² m−1. This was due to the smaller pore size of the r-UF membrane that led to a higher resistance to water permeation. Moreover, Rm values for the r-UF membrane were in accordance with the Rm obtained for commercial polysulfone UF membranes with a similar MWCO to the r-UF one [35]. This resistance is characteristic of the intrinsic properties of the membranes.
The overall resistance to fouling was higher in the case of the r-UF membrane compared with the c-MF membrane (i.e., 1.71 ± 0.11 × 10¹² m−1 compared with 0.43 ± 0.10 × 10¹² m−1). The main difference was due to the resistance of the cake layer that developed on the r-UF membrane (1.13 ± 0.08 × 10¹² m−1), compared with the c-MF membrane (0.25 ± 0.07 × 10¹² m−1). This could be explained by the fact that the smaller pores of the r-UF membrane led to higher rejection rates, thus probably increasing the deposition of cake material. Moreover, the intrinsic higher membrane resistance resulted in higher TMP operation (even for clean membranes), thus promoting compaction of the forming cake layer. It was proposed that the cake layer in MBR is highly compressible [36], and that compaction of the (cake) fouling layer further increases the fouling resistance and renders the cake layer removal through backwashing or relaxation less effective [37].
Resistance values for Rpb were estimated as being rather similar for both the c-MF and r-UF membranes (i.e., 0.57 ± 0.03 × 10¹² m−1 compared with 0.18 ± 0.03 × 10¹² m−1, respectively), although the Rpb of the r-UF was still higher. Considering the pore sizes of the membranes used in the present study (0.4 µm for the c-MF membrane and 12 nm for the r-UF membrane), it was expected that the r-UF membrane would have presented a lower Rpb. One possible explanation could be that the cake layer deposition that occurred quite quickly may provide a barrier (physical membrane/filter) for colloids and macromolecules that were supposed to participate in the pore-blocking process in both membranes. Nonetheless, smaller colloids and molecules could pass more easily through the cake layer and then participate in the blockage of smaller pores than the ones existing on UF membranes, as mentioned by Le-Clech et al., who observed that this tendency changes for long-term experiments [38]. Concerning, the reversibility of the membrane fouling layer, both membranes exhibited irreversible fouling mechanisms that accounted almost exclusively for the overall observed membrane fouling. Table 4 summarizes the contribution of the different fouling mechanisms to the observed fouling resistance. It was obvious that the irreversible fouling mechanisms were mainly responsible for the observed fouling phenomenon, thus making maintenance cleaning (mechanical and/or chemical) of both membranes necessary to restore their initial filtration performance.
Table 4.
Relative contribution (%) of different membrane fouling mechanisms for the c-MF and r-UF membranes after stages Ib and IIb.
Overall, it was observed that the relative contribution of each fouling mechanism was quite similar for c-MF and r-UF membranes. The resistance due to the irreversible fraction Rir was the main resistance affecting Rf in both cases. Furthermore, the r-UF membrane showed a lower relative Rpb contribution but higher relative Rc. However, in both membranes, the cake layer remained the main fouling mechanism, accounting for approx. 60% of the overall fouling resistance.
3.3. Critical Factors Affecting Economic Sustainability
The sustainability of emerging technologies must be analyzed in the very early stages of their development. Ex-ante studies are more frequent and allow for the identification of trends and critical aspects to be resolved during the posterior research stages [39]. This section presents an analysis of the potential economic feasibility of the r-UF membranes. The analysis was performed in terms of two main units: (i) the cost of the production of 1 m2 of the r-UF membrane and (ii) the recycling cost of one module. Table 5 describes the results of the adaptation of the r-UF spiral wound module (originally a Toray TM-720 EoL-RO module) into five different commercial MBR flat sheet frames [26].
Table 5.
Cost of the production of the r-UF for use in an aMBR depending on the targeted membrane frame size.
The different MBR frames were analyzed to allow for a membrane area recovery between 39% and 70%. The smaller frames allowed for a higher surface recovery due to the adaptation of the shape to the membrane sheet dimensions. However, the largest frames that are more common in the MBR membrane industry (with dimensions of 490 mm × 1000 mm) have a membrane area recovery above 60%. In all the cases, the cost is between 5.91–10.56 EUR·m−2, thus lower compared with commercial MBR prices (12.38–20.63 EUR·m−2) [40]. This lower cost could open the technological niche where the membrane replacement frequency is high or relatively higher, i.e., the treatment of harsh wastewaters or very intense processes where membranes are frequently damaged and replaced, such as for landfill leachate treatment. In this process, the membranes have a shorter expected lifespan (3–5 years), thus a high replacement ratio, representing 17% of the overall cost [41,42]. Data obtained in the present work showed that the permeability decline of the r-UF membrane would be slightly better under similar operating conditions (Table 3). Moreover, fouling analysis (Figure 7) showed that the r-UF membrane presented similar characteristics to the c-MF membrane. Therefore, the use of r-UF membranes could reduce the replacement cost. In the contrast, the r-UF is expected to have a higher energy cost due to the lower permeability. Membrane stability and low replacement cost could lead to an overall cost reduction of the process. Nonetheless, long-term tests should be performed to verify this hypothesis.
Besides the overall cost, the contribution analysis could identify crucial process steps (Table 6). The most expensive step in the process is the transformation of the whole module into the r-UF membrane and the logistics processes. These processes include, as shown in Figure 3, the transport processes (collection and distribution) and the chemical attack (with NaOCl) that transforms surface properties into an ultrafiltration membrane, as well as other downstream processes (washing and wastewater treatment). These costs were analyzed in detail in Senán-Salinas et al. [43]. However, within the new process steps, the main contributor was the manual disassembling, compromising 34% of the total cost of the treatment of one module (EUR 154 per module). This process needs to be done manually and its automatization through mechatronics engineering is challenging, although indispensable to reduce the cost of recycling. The same is true for the assembling and gluing of the sheets into new frames, which contributed approx. 7.4% to the overall cost. However, the sensitivity analysis, summarized in Table 7, identified the influence of changes in the main parameters on the overall cost. The sensitivity analysis pointed out the influence of the area recovered. Therefore, the development of a new frame with different sizes for the optimization of the area recovery could be useful for the scaling up.
Table 6.
Cost contribution analysis of the different processes for r-UF membrane preparation.
Table 7.
Sensitivity analysis results of the principal parameters affecting the r-UF membrane production cost.
One more factor that should be discussed concerning the potential implementation of r-UF membranes in MBR applications is the specific energy consumption (SEC) during the operation. SEC has been widely discussed and, for commercial MBRs, varies from 0.3 to 2.3 kWh·m−3 [45,46]. The most important factors affecting the SEC are the plant scale, the required permeate quality, and the blowers, as well as the operating conditions, including the net flow. As mentioned before, the permeability range is similar to other aMBR membranes with larger pore sizes (Figure 4) [47]. Therefore, the expected SEC can be similar. Furthermore, according to the literature, the contribution of permeate pumping is normally low compared with the overall aMBR processes (below 15%). Another critical factor is the permeability decline rate, ultimately leading to membrane chemical cleaning. As discussed in Section 3.2.2, the r-UF membrane presented a lower permeability decline rate over the whole experimentation period, during both 12 and 14 L·m−2·h−1 operation. It was reported in other studies that smaller membrane pore sizes are usually related to a slower TMP increase rate, thus resulting in longer membrane operation before chemical cleaning compared with larger pore membranes [48]. Even though the reported results in this study are preliminary and long-term test data are required to evaluate other main issues, such as the optimization of cleaning cycles and fouling dynamics, it seems that the r-UF membrane can perform comparably with the c-MF.
4. Conclusions
In the present work, a first reported proof-of-concept study to evaluate the feasibility of the use of recycled r-UF membranes as aMBR submerged membranes is provided. Overall, this study showed that the use of r-UF membranes in a flat sheet configuration in an aMBR system led to promising results. The TMP temporal evolution revealed that r-UF membranes exhibited a lower permeability decline rate, which may be beneficial for long-term working periods, whereas the fouling resistance analysis showed that the r-UF exhibited comparable characteristics to the widely employed c-MF membrane. However, the r-UF membrane permeability was much lower than MF membranes, which may negatively affect the cake layer fouling resistance due to the compaction of the cake. In terms of permeate quality, using the r-UF membrane, the laboratory-scale aMBR system exhibited excellent results regarding all studied parameters.
These encouraging results point to a very interesting alternative use of recycled EoL RO membranes in MBR systems and other UF processes where membrane replacement costs represent one of the main OPEX of the plant due to the elevated membrane replacement rate and/or important fouling issues. Although promising results were obtained, long-term experiments should be planned, including multiple experimental runs (replicates), especially to assess membrane fouling behavior in prolonged conditions. Moreover, planning new experimentation procedures at a larger scale should be considered. The collected data would be used for the performance of a detailed environmental sustainability assessment through life cycle analysis.
Author Contributions
Conceptualization, L.R.-S., S.I.P., J.S.-S., J.L.-A. and S.M.; Data curation, L.R.-S., S.I.P. and J.S.-S.; Formal analysis, L.R.-S. and S.I.P.; Funding acquisition, E.G.-C.; Investigation, L.R.-S.; Methodology, S.I.P.; Supervision, E.G.-C.; Writing—original draft, L.R.-S. and J.S.-S.; Writing—review and editing, S.I.P., J.L.-A. and S.M. All authors have read and agreed to the published version of the manuscript.
Funding
This research is part of the national projects: INREMEM (Innovation and recycling of membranes for water treatment, MCIN/AEI/10.13039/501100011033/y FEDER Una manera de hacer Europa: CTM2015-65348-C2-1-R; INREMEM 2.0 (Hybrid wastewater treatments based on recycled membranes with the objective of zero liquid discharge (ZLD)), MCIN/AEI/10.13039/501100011033/y FEDER Una manera de hacer Europa: RTI2018-096042-B-C21 and nanoCLEAN (Quantification, treatment and environmental impact of micronanoplastics in WWTPs), MCIN/AEI/10.13039/501100011033: PID2019-111519RA-I00.
Institutional Review Board Statement
Not applicable.
Informed Consent Statement
Not applicable.
Data Availability Statement
Not applicable.
Conflicts of Interest
The authors declare no conflict of interest.
Abbreviations
| aMBR | Aerobic membrane bioreactor | MWCO | Molecular weight cut-off |
| BOD5 | Biological oxygen demand | NF | Nanofiltration |
| CAPEX | Capital expenditure | OPEX | Operational expenditure |
| CAS | Conventional activated sludge | PA | Polyamide |
| c−MF | Commercial microfiltration | PES | Polyethersulfone |
| COD | Chemical oxygen demand | PSF | Polysulfone |
| cSWW | Concentrated synthetic wastewater | RO | Reverse osmosis |
| DO | Dissolved oxygen | r-UF | Recycled ultrafiltration |
| EoL | End of life | SEC | Specific energy consumption |
| HRT | Hydraulic retention time | SRT | Solid retention time |
| MBR | Membrane bioreactor | TN | Total nitrogen |
| MF | Microfiltration | TOC | Total organic carbon |
| MLSS | Mixed liquor suspended solids | TP | Total phosphorous |
| L | Membrane permeability at (L·m− 2·h−1·bar−1) | Rm | Membrane resistance (m−1) |
| LS | Membrane permeability at a certain time (L·m−2·h−1·bar−1) | Rpb | Pore blocking resistance (m−1) |
| J | Flux (L·m−2·h−1) | Rq | Root mean square average of height deviation (nm) |
| R | Resistance (m−1) | Rrev | Reversible resistance (m−1) |
| Ra | Arithmetic average of absolute values of surface height deviations (nm) | RT | Total resistance (m−1) |
| Rc | Cake layer resistance (m−1) | t | Time (h) |
| Rc(ir) | Cake layer irreversible resistance (m−1) | T | Temperature (°C) |
| Rc(rev) | Cake layer reversible resistance (m−1) | TMP | Transmembrane pressure (Pa) |
| Rf | Fouling resistance (m−1) | µ | Dynamic viscosity (Pa·s) |
| Rir | Irreversible resistance (m−1) |
References
- MBR Global Capacity. Available online: https://www.thembrsite.com/membrane-bioreactor-global-capacity/ (accessed on 8 November 2021).
- Membrane Bioreactor Market by Membrane Type (Hollow Fiber, Flat Sheet, Multi-tubular), System Configuration (Submerged, External), Application (Municipal Wastewater Treatment and Industrial Wastewater Treatment), Region-Global Forecast to 2024; Markets and Markets Research Private Ltd.: Chicago, IL, USA, 2020; Available online: https://www.marketsandmarkets.com/Market-Reports/membrane-bioreactor-market-484.html?gclid=EAIaIQobChMI5eTZ4aD-9QIVFeJ3Ch33BwiJEAAYASAAEgIL1vD_BwE (accessed on 8 November 2021).
- Krzeminski, P.; Leverette, L.; Malamis, S.; Katsou, E. Membrane bioreactors—A review on recent developments in energy reduction, fouling control, novel configurations, LCA and market prospects. J. Memb. Sci. 2017, 527, 207–227. [Google Scholar] [CrossRef] [Green Version]
- Iglesias, R.; Simón, P.; Moragas, L.; Arce, A.; Rodriguez-Roda, I. Cost comparison of full-scale water reclamation technologies with an emphasis on membrane bioreactors. Water Sci. Technol. 2017, 75, 2562–2570. [Google Scholar] [CrossRef] [PubMed]
- Rahimi, Z.; Zinatizadeh, A.A.; Zinadini, S. Milk processing wastewater treatment in an MBR: A comparative study on the use of two synthetic anti-fouling PES-UF membranes. J. Environ. Chem. Eng. 2019, 7, 103369. [Google Scholar] [CrossRef]
- Maneewan, P.; Sajomsang, W.; Singto, S.; Lohwacharin, J.; Suwannasilp, B.B. Fouling mitigation in an anaerobic membrane bioreactor via membrane surface modification with tannic acid and copper. Environ. Pollut. 2021, 291, 118205. [Google Scholar] [CrossRef]
- Senán-Salinas, J.; Blanco, A.; García-Pacheco, R.; Landaburu-Aguirre, J.; García-Calvo, E. Prospective Life Cycle Assessment and economic analysis of direct recycling of end-of-life reverse osmosis membranes based on Geographic Information Systems. J. Clean. Prod. 2020, 282, 124400. [Google Scholar] [CrossRef]
- García-Pacheco, R.; Lawler, W.; Landaburu-Aguirre, J.; García-Calvo, E.; Le-clech, P. End-of-Life membranes: Challenges and opportunities. In Comprehensive Membrane Science and Engineering, 2nd ed.; Elsevier: Amsterdam, The Netherlands, 2017. [Google Scholar]
- European Comission First Circular Economy Action Plan. Available online: https://ec.europa.eu/environment/circular-economy/ (accessed on 7 June 2021).
- García-Pacheco, R.; Gabarro, J.; Suquet, J.; Galizia, A.; Godo-Pla, L.; Molina, F.; Campos, E.; Landaburu, J.; Monclús, H.; Comas, J. Landfill leachate treatment using second-hand membranes. In 7th MSA ECR Membrane Symposium; University of Technology Sydney: Sydney, Australia, 2020; pp. 1–4. [Google Scholar]
- García-Pacheco, R.; Landaburu-Aguirre, J.; Molina, S.; Rodríguez-Sáez, L.; Teli, S.B.; García-Calvo, E. Transformation of end-of-life RO membranes into NF and UF membranes: Evaluation of membrane performance. J. Memb. Sci. 2015, 495, 305–315. [Google Scholar] [CrossRef]
- Morón-López, J.; Nieto-Reyes, L.; Senán-Salinas, J.; Molina, S.; El-Shehawy, R. Recycled desalination membranes as a support material for biofilm development: A new approach for microcystin removal during water treatment. Sci. Total Environ. 2019, 647, 785–793. [Google Scholar] [CrossRef]
- Lejarazu-Larrañaga, A.; Molina, S.; Ortiz, J.M.; Navarro, R.; García-Calvo, E. Circular economy in membrane technology: Using end-of-life reverse osmosis modules for preparation of recycled anion exchange membranes and validation in electrodialysis. J. Memb. Sci. 2020, 593, 117423. [Google Scholar] [CrossRef]
- García-Pacheco, R.; Landaburu-Aguirre, J.; Terrero-Rodríguez, P.; Campos, E.; Molina-Serrano, F.; Rabadán, J.; Zarzo, D.; García-Calvo, E. Validation of recycled membranes for treating brackish water at pilot scale. Desalination 2018, 433, 199–208. [Google Scholar] [CrossRef]
- Molina, S.; García Pacheco, R.; Rodríguez Sáez, L.; García-Calvo, E.; Campos Pozuelo, E.; Zarco Martínez, D.; González de la Campa, J.; De Abajo González, J. Transformation of end-of-life RO membrane into recycled NF and UF membranes, surface characterization. In Proceedings of the International Desalination Association World Congress on Desalination and Water Reuse, San Diego, CA, USA, 30 August–4 September 2015. [Google Scholar]
- Da Costa, P.R.; Alkmin, A.R.; Amaral, M.C.S.; de França Neta, L.S.; Cerqueira, A.C.; Santiago, V.M.J. Ageing effect on chlorinated polyethylene membrane of an MBR caused by chemical cleaning procedures. Desalin. Water Treat. 2015, 53, 1460–1470. [Google Scholar] [CrossRef]
- Rodríguez-Sáez, L.; Landaburu-Aguirre, J.; Molina, S.; García-Payo, M.C.; García-Calvo, E. Study of surface modification of recycled ultrafiltration membranes using statistical design of experiments. Surf. Interfaces 2021, 23, 100978. [Google Scholar] [CrossRef]
- Patsios, S.I.; Karabelas, A.J. An investigation of the long-term filtration performance of a membrane bioreactor (MBR): The role of specific organic fractions. J. Memb. Sci. 2011, 372, 102–115. [Google Scholar] [CrossRef]
- Baird, R.B.; Eaton, A.D. Standard Methods for the Examination of Water and Wastewater, 19th ed.; American Public, Health Association: Washington, DC, USA, 1995. [Google Scholar]
- Field, R.W.; Wu, D.; Howell, J.A.; Gupta, B.B. Critical flux concept for microfiltration fouling. J. Memb. Sci. 1995, 100, 259–272. [Google Scholar] [CrossRef]
- Wang, Z.; Wu, Z.; Yin, X.; Tian, L. Membrane fouling in a submerged membrane bioreactor (MBR) under sub-critical flux operation: Membrane foulant and gel layer characterization. J. Memb. Sci. 2008, 325, 238–244. [Google Scholar] [CrossRef]
- R Core Team. R: A Language and Environment for Statistical Computing; R Foundation for Statistical Computing: Vienna, Austria, 2018; Available online: www.R-project.org/ (accessed on 8 November 2021).
- Di Bella, G.; Di Trapani, D.; Judd, S. Fouling mechanism elucidation in membrane bioreactors by bespoke physical cleaning. Sep. Purif. Technol. 2018, 199, 124–133. [Google Scholar] [CrossRef] [Green Version]
- Di Bella, G.; Durante, F.; Torregrossa, M.; Viviani, G.; Mercurio, P.; Cicala, A. The role of fouling mechanisms in a membrane bioreactor. Water Sci. Technol. 2007, 55, 455–464. [Google Scholar] [CrossRef] [Green Version]
- Lawler, W.; Bradford-Hartke, Z.; Cran, M.J.; Duke, M.; Leslie, G.; Ladewig, B.P.; Le-Clech, P. Towards new opportunities for reuse, recycling and disposal of used reverse osmosis membranes. Desalination 2012, 299, 103–112. [Google Scholar] [CrossRef]
- Judd, S. The MBR Book: Principles and Applications of Membrane Bioreactors for Water and Wastewater Treatment; Elsevier: Amsterdam, The Netherlands, 2006; ISBN 9780080465104. [Google Scholar]
- BOE MARM BOE. Spanish Water Reuse Royal Decree 1620/2007; Ministry of the Presidence: Madrid, Spain, 2007; pp. 50639–50661.
- Van der Bruggen, B. Microfiltration, ultrafiltration, nanofiltration, reverse osmosis, and forward osmosis. In Fundamental Modeling of Membrane Systems: Membrane and Process Performance; Elsevier: Amsterdam, The Netherlands, 2018; pp. 25–70. ISBN 9780128134849. [Google Scholar]
- Molina, S.; García-Pacheco, R.; Rodríguez-Sáez, L.; García-Calvo, E.; Campos-Pozuelo, E.; Zarzo-Martínez, D.; de la Campa, J.G.; de Abajo, J. Transformation of end-of-life RO membranes into recycled NF and UF. In Proceedings of the IDA World Congress, San Diego, CA, USA, 4 September 2015. [Google Scholar]
- Adham, S.; DeCarolis, J.F. Optimization of Various MBR Systems for Water Reclamation: Phase III; U.S. Department of the Interior Bureau of Reclamation Technical Service Center: Denver, CO, USA, 2004. [Google Scholar]
- Li, S.; Chen, H.; Zhao, X.; Lucia, L.A.; Liang, C.; Liu, Y. Impact factors for flux decline in ultrafiltration of lignocellulosic hydrolysis liquor. Sep. Purif. Technol. 2020, 240, 116597. [Google Scholar] [CrossRef]
- Ahmad, N.A.; Goh, P.S.; Zulhairun, A.K.; Ismail, A.F. Antifouling property of oppositely charged titania nanosheet assembled on thin film composite reverse osmosis membrane for highly concentrated oily saline water treatment. Membranes 2020, 10, 237. [Google Scholar] [CrossRef]
- Molina, S.; Landaburu-Aguirre, J.; Rodríguez-Sáez, L.; García-Pacheco, R.; de la Campa, J.G.; García-Calvo, E. Effect of sodium hypochlorite exposure on polysulfone recycled UF membranes and their surface characterization. Polym. Degrad. Stab. 2018, 150, 46–56. [Google Scholar] [CrossRef]
- Woo, S.H.; Min, B.R.; Lee, J.S. Change of surface morphology, permeate flux, surface roughness and water contact angle for membranes with similar physicochemical characteristics (except surface roughness) during microfiltration. Sep. Purif. Technol. 2017, 187, 274–284. [Google Scholar] [CrossRef]
- Rai, P.; Rai, C.; Majumdar, G.C.; DasGupta, S.; De, S. Resistance in series model for ultrafiltration of mosambi (Citrus sinensis (L.) Osbeck) juice in a stirred continuous mode. J. Memb. Sci. 2006, 283, 116–122. [Google Scholar] [CrossRef]
- Bugge, T.V.; Jørgensen, M.K.; Christensen, M.L.; Keiding, K. Modeling cake buildup under TMP-step filtration in a membrane bioreactor: Cake compressibility is significant. Water Res. 2012, 46, 4330–4338. [Google Scholar] [CrossRef]
- Jørgensen, M.K.; Bugge, T.V.; Christensen, M.L.; Keiding, K. Modeling approach to determine cake buildup and compression in a high-shear membrane bioreactor. J. Memb. Sci. 2012, 409, 335–345. [Google Scholar] [CrossRef]
- Le-clech, P.; Chen, V.; Fane, T.A.G. Fouling in membrane bioreactors used in wastewater treatment. J. Membr. Sci. 2006, 284, 17–53. [Google Scholar] [CrossRef]
- Cucurachi, S.; Van Der Giesen, C.; Guinée, J. Ex-ante LCA of Emerging Technologies. Procedia CIRP 2018, 69, 463–468. [Google Scholar] [CrossRef]
- Lo, C.H.; McAdam, E.; Judd, S. The cost of a small membrane bioreactor. Water Sci. Technol. 2015, 72, 1739–1746. [Google Scholar] [CrossRef] [Green Version]
- Hashisho, J.; El-Fadel, M.; Al-Hindi, M.; Salam, D.; Alameddine, I. Hollow fiber vs. flat sheet MBR for the treatment of high strength stabilized landfill leachate. Waste Manag. 2016, 55, 249–256. [Google Scholar] [CrossRef]
- Fudala-Ksiazek, S.; Pierpaoli, M.; Luczkiewicz, A. Efficiency of landfill leachate treatment in a MBR/UF system combined with NF, with a special focus on phthalates and bisphenol A removal. Waste Manag. 2018, 78, 94–103. [Google Scholar] [CrossRef]
- Senán-Salinas, J.; Landaburu-Aguirre, J.; Contreras-Martinez, J.; García-Calvo, E. Life Cycle Assessment application for emerging membrane recycling technologies: From reverse osmosis into forward osmosis. Resour. Conserv. Recycl. 2021, 179, 106075. [Google Scholar] [CrossRef]
- Lawler, W.; Antony, A.; Cran, M.; Duke, M.; Leslie, G.; Le-Clech, P. Production and characterisation of UF membranes by chemical conversion of used RO membranes. J. Memb. Sci. 2013, 447, 203–211. [Google Scholar] [CrossRef] [Green Version]
- Skouteris, G.; Arnot, T.C.; Jraou, M.; Feki, F.; Sayadi, S. Modeling Energy Consumption in Membrane Bioreactors for Wastewater Treatment in North Africa. Water Environ. Res. 2014, 86, 232–244. [Google Scholar] [CrossRef] [PubMed] [Green Version]
- Gil, J.A.; Túa, L.; Rueda, A.; Montaño, B.; Rodríguez, M.; Prats, D. Monitoring and analysis of the energy cost of an MBR. Desalination 2010, 250, 997–1001. [Google Scholar] [CrossRef]
- Fenu, A.; Roels, J.; Wambecq, T.; De Gussem, K.; Thoeye, C.; De Gueldre, G.; Van De Steene, B. Energy audit of a full scale MBR system. Desalination 2010, 262, 121–128. [Google Scholar] [CrossRef]
- Du, X.; Shi, Y.; Jegatheesan, V.; Ul Haq, I. A review on the mechanism, impacts and control methods of membrane fouling in MBR system. Membranes 2020, 10, 24. [Google Scholar] [CrossRef] [Green Version]
Publisher’s Note: MDPI stays neutral with regard to jurisdictional claims in published maps and institutional affiliations. |
© 2022 by the authors. Licensee MDPI, Basel, Switzerland. This article is an open access article distributed under the terms and conditions of the Creative Commons Attribution (CC BY) license (https://creativecommons.org/licenses/by/4.0/).