Abstract
Background and Objectives: Influenza is a significant global healthcare problem. Despite the availability of influenza vaccines, vaccination rates remain low, particularly among rural populations. This study aims to investigate the impact of trust and demographic factors on influenza vaccination status among rural populations. Methods: Cross-sectional data were collected as a subgroup analysis of rural populations within a parent study assessing Coronavirus Disease 2019 (COVID-19) vaccination uptake among residents in the state of Alabama, U.S.A. Participants were at least 18 years old and recruited from a Qualtrics panel. Rurality (non-metro) was determined using the United States Rural–urban Commuting Area (RUCA) Codes of 4-10. Data were analyzed using a weighted sample to adjust for differences in sex and race distributions. Results: A little over one-third (37.8%) of the participants reported having received influenza vaccine in the 2023–2024 flu season. Less than half (48.4%) reported they previously received COVID-19 vaccines, and a greater percentage (54.5%) of them had a high understanding of health information. The multivariable logistic regression analysis indicated that prior COVID-19 vaccination, political affiliation, household income and trust in doctors’ communication competency were significantly associated (p < 0.05) with greater influenza vaccine uptake. Conclusions: Improving influenza vaccine uptake in underserved rural communities requires strengthening trust in healthcare providers, addressing access barriers and enhancing communication strategies that reflect sociopolitical influences on vaccination behavior.
1. Introduction
Influenza remains a major global health issue, causing significant illness and death annually. During the 2023–2024 influenza season, the United States reported approximately 40 million influenza cases, 18 million healthcare visits, 470,000 hospitalizations, and 28,000 deaths [1]. Worldwide, seasonal influenza has led to an estimated 290,000–650,000 deaths annually [2].
Although vaccines have been available for over 60 years and have shown consistent safety and effectiveness [3] Influenza vaccine uptake in the United States remains suboptimal. During the 2023–2024 season, only 69.7% of older adults (aged 65 and above) and 55.4% of children (aged 6 months to 17 years) received the vaccine [4,5]. In Alabama, adult vaccination coverage was notably lower at 42.9%, placing the state among those with the lowest rates nationally [6]. Alabama’s persistently low vaccination rates, coupled with its large rural population and documented healthcare access challenges, make it a critical setting for investigating barriers to influenza vaccine uptake. The state’s unique combination of low coverage, racial disparities, and rural infrastructure gaps provides a compelling rationale for this study [7,8]. Additionally, there are ongoing racial and ethnic disparities; during the 2021–2022 season, vaccination rates among white adults were 53.9%, compared to only 42.0% of Black adults, 37.9% of Hispanic adults, and 40.9% of American Indian and Alaska Native adults [9].
Rural residents, including both adults and children, are 8 to 13 percent less likely to receive the influenza vaccine than their urban counterparts, reflecting consistent rural–urban disparities across age groups and sexes [10]. Contributing factors include disparities in trust toward the health system [11,12], time constraints, and limited access to vaccination services. However, trust in the health system among our study population in Alabama had not been previously assessed prior to this investigation. Rural communities face multiple barriers that complicate access to influenza vaccines. Geographic distance is a significant factor influencing vaccination rates; children whose parents live more than 10 miles from a healthcare provider are less likely to be vaccinated [10]. Rural health facilities frequently contend with staffing shortages, inadequate vaccine storage, and limited supply, which often force patients to seek vaccinations from government clinics or larger towns [12]. Additional challenges include lack of insurance or providers who do not accept it, transportation difficulties, work-related constraints, language barriers, and privacy concerns [13,14,15]. The shortage of healthcare workers, coupled with limited public transportation and internet access, exacerbates these issues and contributes to persistently lower vaccination rates in rural areas [12,16]. Further, the need for this research becomes evident with the decline in national influenza vaccination rates after the COVID-19 pandemic, which shows a troubling reversal of the progress made before the pandemic [17,18,19]. This decline in the vaccination rates requires prompt action and evidence-based strategies to prevent the loss of population immunity and avoid severe seasonal outbreaks that could overwhelm rural healthcare systems [20].
The trust placed in healthcare authorities and government health organizations directly impacts vaccine uptake [11,12]. As influenza vaccination rates continue to drop across all age groups, particularly in rural areas, there is an urgent need to increase vaccination coverage in these populations. Therefore, this research examines the influence of trust and demographic factors in the rural population regarding receipt of the influenza vaccine. This study aims to investigate the impact of trust and demographic factors on influenza vaccination status among rural populations in a southeastern U.S. state. By analyzing variables such as age, education, income, and perceived trust in healthcare providers, the study seeks to identify key determinants influencing vaccine uptake. These insights may inform targeted public health interventions to improve vaccination coverage in underserved rural communities.
2. Materials and Methods
2.1. Study Design, Sample and Setting
This cross-sectional study is an exploratory secondary analysis of data originally collected as part of the parent study assessing COVID-19 vaccination uptake among residents of the state of Alabama, U.S.A. [21]. The present analysis focused exclusively on participants residing in rural areas. Participants were at least 18 years old and recruited from a Qualtrics panel. Quota sampling was used to ensure diversity in ethnicity, race, COVID-19 vaccination status and residence in the original study. Rurality status (non-metro) was determined using the United States Rural–urban Commuting Area (RUCA) Codes of 4-10. This study was approved by the Institutional Review Board of the authors’ institution.
2.2. Data Collection and Measures
Data were collected from February to March 2024 using an online structured questionnaire. The survey sampling company, Qualtrics, was hired to handle the data collection process. A total of 424 participants out of the 1020 participants in the parent study who lived in rural areas were included. The flowchart for participant recruitment and inclusion is shown in Figure 1. The primary outcome was influenza vaccine uptake. Participants were asked if they received influenza shots during the 2023–2024 influenza season, with the response options being Yes, No, or Unsure. Only three participants selected Unsure and were excluded from the analysis.
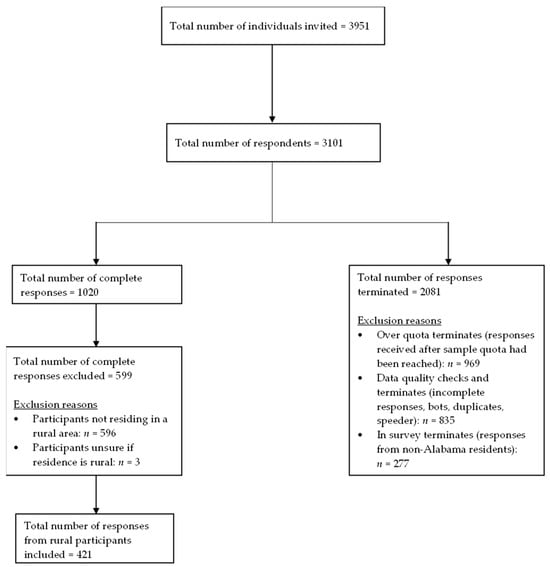
Figure 1.
Flow diagram of participant recruitment and inclusion.
The independent variables included participant characteristics and their trust in medical doctors, pharmacists and public health authorities. The characteristics assessed were sex, age, race, ethnicity, employment status, socio-economic status (household income and education), political affiliation, presence of co-morbidities or risk factors, confidence in understanding health information, and prior receipt of COVID-19 vaccination. Information on these variables was gathered through multiple-choice questions in the questionnaire (Supplementary File S1).
Trust was measured using validated scales: Trust in Doctors in General (T-DiG), Trust in Community Pharmacists (TRUST-Ph), and Trust in Public Health Authorities (TiPHA). The T-DiG scale includes 29 items with seven factors: Communication Competency, Fidelity, Systems Trust, Confidentiality, Fairness, Stigma-Based Discrimination, and Global Trust. The TRUST-Ph scale consists of 30 items with three factors: Benevolence, Technical Competence, and Communication. TiPHA is a 14-item scale with two factors: Beneficence and Competence. All trust scales were evaluated using Likert scale ranging from ‘strongly disagree’ to ‘strongly agree.’ The TiPHA scale used a 4-point scale with no midpoint, while the T-DiG and TRUST-Ph scales used 5-point scales. The components within the three scales showed a Cronbach’s alpha greater than 0.70 using our dataset (Appendix A Table A1). All factors were retained and included in the final analysis.
2.3. Statistical Analysis
Primary data analysis was conducted using a weighted sample to adjust for differences between the sample and population sex and race distributions. Weighting was conducted by calculating the rural population proportions of four race–sex strata based on the 2023 Alabama population estimates provided by the U.S. Census Bureau (white/Male, Black and Other/Male, white/Female, Black and Other/Female) [22]. Each population proportion was then divided by the corresponding race–sex stratum sample proportion (Appendix A Table A2). The resulting weights were then assigned to participants based on their race–sex combinations. The weight distribution summary can be found in Appendix A Table A3.
Balance diagnostics were assessed by comparing the population versus unweighted sample, population versus weighted sample, and the weighted versus unweighted sample using absolute standardized mean differences (ASMDs) for sex and race. ASMDs were calculated using the following formula [23]:
where and represent the proportions in the reference and comparison groups, respectively. An ASMD of 0.1 was considered indicative of meaning imbalance [24]. The ASMDs (Appendix A Table A4) demonstrate that weighting improved balance between the sample and the population. Before weighting, sex distribution was strongly imbalanced (ASMD: population vs. unweighted = 0.48), with females overrepresented relative to the population (73.6% vs. 51.0%). However, after applying weights, the ASMD for population vs. weighted sample was 0.002, showing that the sample proportions closely match that of the population. Race distribution was relatively balanced in the unweighted sample (ASMD: population vs. unweighted = 0.031) and weighting further improved balance (ASMD: population vs. weighted sample = 0.017).
Frequencies and percentages were used to summarize participant characteristics and influenza vaccine uptake, while means and standard deviations were used to summarize the trust scales. Bivariate associations between the dependent and independent variables were assessed using Chi-square and binary logistic regression. Multicollinearity among the predictors that were significant in the bivariate analyses were assessed using linear regression. Appendix A Table A5 shows no significant multicollinearity was found (variance inflation factors > 5 were considered indicative of high multicollinearity) [25]. Multivariable logistic regression was then used to identify the most significant variables, out of those identified by the bivariate analysis, that were associated with influenza vaccine uptake. The model’s performance was assessed using several diagnostic checks. The area under the receiver operating characteristic curve (AUC) was calculated to assess how well the model discriminated between the binary outcome of influenza uptake (Yes vs. No). Internal validation was conducted using 1000 bootstrap resamples to provide a more robust estimate of performance. Additionally, the Box–Tidwell test was used to check the assumption of a linear relationship between the continuous predictors and the log odds of the outcome. All other data analyses conducted using the weighted sample were re-run with the unweighted data to assess the robustness of the study findings. The final model included all predictors in the multivariable analysis, regardless of statistical significance. No further modifications to model specifications, weighting procedures, or covariate selections were made after the analysis was finalized. Data analyses were performed using IBM SPSS Statistics, version 30.0.0.0, and R statistical software, version 4.2.1.
3. Results
3.1. Characteristics of the Study Participants
Weighted analyses were based on the total survey weights (n = 426). Table 1 shows that female and male participants were almost equally represented (50.9% vs. 49.1%). The majority were white (77.1%), and not Hispanic or Latino (94.6%). Most participants were aged between 35 and 64 years (55.3%), and 43.5% identified as Republicans. The most common educational attainment was a high school diploma or equivalent (54.2%). About 39% reported a household income of $30,000 or less, and 57.2% of the participants were retired, disabled or not employed. A large proportion (67.8%) reported having at least one chronic condition. Less than half (48.4%) of participants had previously received a COVID-19 vaccine. Lastly, over half (54.5%) reported high confidence in understanding health information.

Table 1.
Participant characteristics (n = 426).
3.2. Influenza Vaccine Uptake
When asked about the primary outcome of influenza vaccine uptake in 2023–2024, less than half (37.8%) reported receiving the influenza vaccine, as shown in Figure 2.
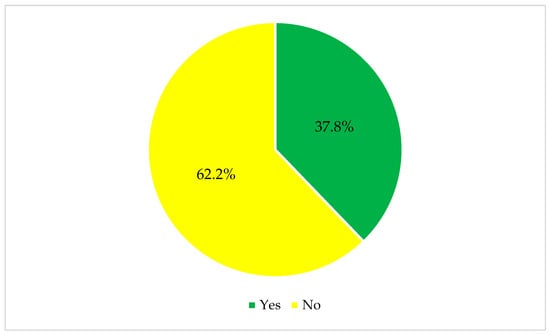
Figure 2.
Influenza vaccine uptake (n = 426).
3.3. Associations Between Participant Characteristics and Influenza Vaccine Uptake in 2023–2024 Influenza Season
Table 2 presents the associations between participants’ sociodemographic factors and influenza vaccine uptake. Significant associations with influenza vaccine uptake (p < 0.05) were observed for sex, age, political affiliation, education, household income, employment status, presence of chronic conditions, and prior COVID-19 vaccination.
Table 2.
Bivariate associations between participant characteristics and influenza vaccine uptake in 2023–2024 influenza season (n = 426).
3.4. A Binary Logistic Regression Analysis of Participants’ Trust in Medical Doctors, Pharmacists, and Public Health Authorities on Influenza Vaccine Uptake
The binary logistic regression analyses (Table 3) revealed that all components of the trust in public health authority, medical doctor, and community pharmacist scales were significantly associated with increased odds of influenza vaccine uptake. Supplementary File S2 shows the results of the unweighted analysis. Bivariate results were largely consistent with the weighted analysis, with income not emerging as a significant factor (Supplementary File S2 Tables S3 and S4). No evidence of multicollinearity was detected (Supplementary File S2 Table S5).
Table 3.
A binary logistic regression analysis of participants’ trust in medical doctors, pharmacists, and public health authorities on influenza vaccine uptake (n = 426).
3.5. A Multivariable Logistic Regression of Factors Associated with Flu Vaccine Uptake
In the weighted multivariable logistic regression analysis (Table 4 and Figure 3), several factors remained significantly associated with the influenza vaccine uptake. First, previous COVID-19 vaccination status was the strongest predictor of influenza vaccine uptake. Participants who had previously received a COVID-19 vaccine were nearly 10 times more likely to receive the influenza vaccine than those who had not (adjusted OR = 9.79, 95% CI: 4.92–19.47, p < 0.001) Next, democrats had 2.5 times higher odds of vaccination than republicans (adjusted OR = 2.50, 95% CI: 1.02–6.16, p = 0.046). Participants with an income ≥ $120,000 had about 6.2 times higher odds of receiving the influenza vaccine compared to those with income ≤ $30,000 (adjusted OR = 6.17, 95% CI: 1.54–24.77, p = 0.010). Lastly, higher trust in doctors’ communication competency was significantly associated with greater influenza vaccine uptake (adjusted OR = 3.09, 95% CI: 1.56–6.12, p = 0.001). For each one-point increase in trust in doctors’ communication skills, participants’ odds of vaccination increased by 3.1 times.
Table 4.
A multivariable logistic regression of factors associated with flu vaccine uptake (n = 426).
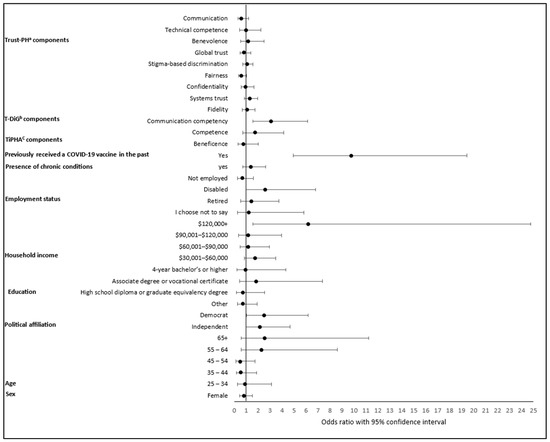
Figure 3.
A multivariable logistic regression of factors associated with flu vaccine uptake (n = 426). a Trust in Community Pharmacists scale; b Trust in Doctors in General scale; c Trust in Public Health Authorities scale. Reference categories: Sex (male), age (18–24 years), political affiliation (republican), education (less than high school), income ($0–$30,000), employment status (employed), presence of chronic conditions (no), Previously received a COVID-19 vaccine in the past (no).
For the unweighted analysis (Supplementary File S2 Table S6 and Figure S2), only previous COVID-19 vaccination, political affiliation and trust in doctors’ communication competency remained significantly associated with influenza vaccine uptake. Participants who had previously received a COVID-19 vaccine were over seven times more likely to receive the influenza vaccine compared to those who had not (adjusted OR = 7.09, 95% CI: 3.88–12.95, p < 0.001). Next, compared to republicans, Independents had significantly higher odds of influenza vaccination (adjusted OR = 2.17, 95% CI: 1.02–4.61, p = 0.043). Lastly, higher trust in doctors’ communication competency was significantly associated with greater influenza vaccine uptake (adjusted OR = 2.65, 95% CI: 1.40–5.02, p = 0.003).
Marginal effects were estimated to examine the relationship between the Communication Competency component of the Trust in Doctors in General Scale and influenza vaccine uptake. Predicted probabilities were calculated across the full range of the communication competency scale (strongly disagree (1) to strongly agree (5)) and visualized using a marginal effects plot (Figure 4). The figure shows a positive association between Communication Competency and predicted probability of influenza vaccine uptake. As perceived communication competency score increased, predicted uptake also increased. This pattern was consistent in the unweighted analysis plot (Supplementary File S2 Figure S3).
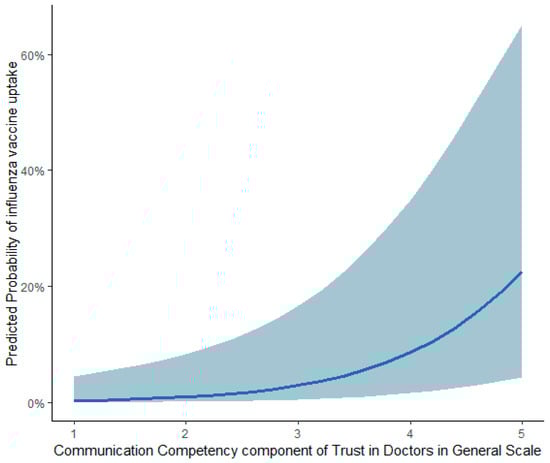
Figure 4.
Marginal effects plot of communication competency on influenza vaccine uptake (n = 426).
3.6. Model Diagnostics
The ROC curve (Appendix A Figure A1) with an area under the curve (AUC) of 0.8713 showed that the weighted model effectively distinguished between individuals who received the vaccine and those who did not. The ROC curve from the unweighted analysis also demonstrated good model discrimination, with an area under the curve (AUC) of 0.8710 (Supplementary File S2 Figure S4). Internal validation of both models using nonparametric bootstrapping demonstrated strong stability. The weighted model correctly classified 83.4% of participants, with a minimal bias of 0.009 and a low standard error of 0.022. This finding is consistent with the unweighted analysis result in Supplementary File S2 Table S7. Linearity checks for the weighted model (Appendix A Table A6) and the unweighted model (Supplementary File S2, Table S8) showed that all continuous predictors had non-significant interactions with their log transformations (p > 0.05), satisfying the linearity assumption, except for Beneficence in the weighted model.
4. Discussion
This study focused on the factors revolving around the uptake of influenza vaccination among adults living in rural areas in Alabama during the 2023–2024 influenza season. Rural areas were studied because they have a comparatively lower vaccination uptake than urban centers [26] and have access to fewer healthcare facilities. Because of the low vaccination rates and limited availability of healthcare facilities, rural residents are vulnerable to influenza complications and fatalities if not treated promptly [27].
Trust in healthcare professionals emerged as one of the key factors in influenza vaccine uptake in our study, aligning with existing evidence that trust in providers and the healthcare system is a major determinant of vaccine acceptance and one of the strongest predictors of vaccination intent [11,28,29,30]. Similar patterns have been observed in other studies. For instance, Freimuth and colleagues [31] found that trust in the influenza vaccine significantly influenced uptake among African American and white adults, with lower trust contributing to disparities in immunization rates. Likewise, Viskupič and colleagues [32] demonstrated that trust in physicians was a statistically significant predictor of COVID-19 vaccine uptake among rural populations, reinforcing the role of provider trust across different vaccine contexts. These findings support our conclusion that trust in healthcare professionals, particularly in their communication competency, is a critical factor in vaccine acceptance, especially in underserved communities. Our study highlights a single component of trust in doctors in the communication competency domain. The importance of physicians’ communication skills extends beyond simply conveying information; it also encompasses delivering messages with empathy and cultural sensitivity. When providers communicate effectively, they are more likely to earn patients’ trust and address individual concerns. This trust, combined with strong and personalized recommendations [33,34], can significantly contribute to improving vaccination coverage. Provider-patient relationship is even more important in rural communities; evidence from rural populations shows that 86% of residents trust their personal healthcare providers for vaccine-related information, demonstrating the vital role of providers in these areas [35].
Prior COVID-19 vaccine uptake was the strongest independent predictor of influenza vaccine uptake in our study, which suggests that people who are open to one vaccine are more likely to accept others. This may be because of the general trust in vaccines or greater involvement in preventive health behaviors [36]. This trend aligns with recent studies indicating the COVID-19 pandemic has shaped attitudes toward other vaccines, both positively and negatively, based on individual experiences and trust in health authorities [12]. Therefore, we recommend that providers co-administer other needed vaccine(s) when patients present for a different vaccine [37]. It is recommended that healthcare providers should evaluate all vaccine needs during patient visits and offer appropriate vaccines at the same time when clinically appropriate. This method maximizes vaccination opportunities and helps ensure thorough immunization coverage. This is especially important among patients who may not be returning for follow-up visits [37].
Another finding from our study was the significant link between political affiliation and influenza vaccine uptake in the bivariate and multivariable logistic regression results. Compared with Republicans, Democrats (in the primary analysis) and Independents (in the unweighted analysis) had higher odds of being vaccinated against influenza. This finding aligns with recent studies showing that political partisanship is one of the strongest predictors of vaccine acceptance [38]. This divide appears to be extending beyond COVID-19 to include other vaccines, including the influenza vaccine [38,39]. The studies suggest that political identity shapes both vaccine attitudes and interpersonal influence, reinforcing the need for tailored messaging strategies. Pairwise contrasts between all political affiliation groups in both the primary (Table A7) and unweighted analyses (Supplementary File S2 Table S9) showed no statistically significant differences. This may be due to reduced power and adjustments for multiple comparisons. Given the inconsistencies in the results, the political affiliation findings should be interpreted with caution. Future research is recommended to further clarify the role of political affiliation in influenza vaccine uptake.
The primary analysis also identified income as a significant factor associated with influenza vaccine uptake. Specifically, individuals with high income (≥$120,000) had about 6.2 times higher odds of receiving the influenza vaccine compared to those with low income (≤$30,000). These results are consistent with prior research using National Health Interview Survey data from 2014–2018, which reported that adults with annual incomes of $100,000 or more were more likely to receive the influenza vaccine than those with family incomes below $35,000 [40]. Similarly, two additional studies examining income in relation to the federal poverty level found that individuals with higher income levels had increased odds of influenza vaccine uptake [41,42].
Although the influenza vaccine is widely available and safe, uptake in our study sample did not meet established public health goals, including the Healthy People 2030 target of 70% seasonal influenza vaccination coverage [43]. The findings highlight several important factors, suggesting that effective interventions will need a multi-pronged approach. This includes working with rural healthcare providers to improve communication between providers and patients. Strong vaccine recommendations should be delivered consistently, vaccines should be co-administered when clinically appropriate, and individual patient concerns should be addressed. Additionally, using trusted messengers within communities, such as local clinicians, religious leaders, and community influencers, may further improve outreach and engagement.
Limitations
The cross-sectional design prevents causal inferences, and self-reported data may be affected by recall or social desirability bias. Although the sample is diverse, it may not fully represent all U.S. adults or those residing in urban areas. Also, the sociopolitical and demographic characteristics unique to Alabama, such as its partisan landscape and racial distribution, may not reflect those of other rural states. Additionally, because participants were recruited from a nonprobability online panel, external validity is limited even after weighting. Combining all non-white participants (including Black, Asian, American Indian or Alaskan Native, Multiracial and other) into a single category limited the ability to detect meaningful differences between specific racial groups. These subgroups were combined because the individual sample sizes were too small to allow reliable analysis. Next, our sample had a higher proportion of female participants compared to the target population, which further limits generalizability. However, the weighted analysis, which adjusted for both sex and race, showed that our findings were largely consistent with the unweighted and supports the robustness of the results. The measures of trust, while dependable, may not cover all aspects that are important to vaccine decision-making.
5. Conclusions
This study examined determinants of influenza vaccine uptake among rural populations in a southeastern U.S. state during the 2023–2024 influenza season. With only 37.8% of rural participants receiving the influenza vaccine, uptake remained well below public health targets. Four key factors emerged as significant predictors of vaccination: prior COVID-19 vaccination status, political affiliation, household income and trust in doctors’ communication competency.
These findings highlight the critical importance of trust-building between healthcare providers and rural patients, particularly through enhanced communication skills and routine vaccine recommendations. The strong association between COVID-19 and influenza vaccine uptake highlights opportunities for co-administration strategies to maximize vaccination coverage. Given the persistent rural–urban vaccination gap and declining post-pandemic influenza immunization rates, targeted interventions addressing trust, communication, and access barriers are urgently needed to improve influenza vaccine uptake in rural communities and protect population health.
Supplementary Materials
The following supporting information can be downloaded at: https://www.mdpi.com/article/10.3390/vaccines13121208/s1, Supplementary File S1: Study questionnaire; Supplementary File S2: Unweighted analysis result.
Author Contributions
Conceptualization: S.C.W. and S.H.D.; Methodology: S.C.W.; Investigation: O.M.E. and S.C.W.; Formal analysis: J.Q., H.H. and O.M.E.; Validation: J.Q., H.H. and O.M.E.; Writing—original draft preparation: H.H. and O.M.E.; Writing—review and editing: S.C.W., O.M.E., S.H.D., H.H. and J.Q.; Visualization: O.M.E. and H.H.; Supervision: J.Q. and S.C.W.; Project administration: S.C.W.; Funding acquisition: S.H.D. and S.C.W. All authors have read and agreed to the published version of the manuscript.
Funding
This research was, in part, funded by the National Institutes of Health (NIH) Agreement OT2HL158287. The views and conclusions contained in this document are those of the authors and should not be interpreted as representing the official policies, either expressed or implied, of the NIH. The APC was funded by the Department of Health Outcomes Research and Policy, Auburn University.
Institutional Review Board Statement
The study was conducted in accordance with the Declaration of Helsinki, and approved by the Institutional Review Board of Auburn University and determined to be exempt (protocol code: 23-594 EX 2311, approved on 22 January 2024).
Informed Consent Statement
The study used a waiver of documentation of consent.
Data Availability Statement
The study data is available upon reasonable request from the corresponding author.
Conflicts of Interest
The authors declare no conflicts of interest. The funders had no role in the design of the study; in the collection, analyses, or interpretation of data; in the writing of the manuscript; or in the decision to publish the results.
Abbreviations
The following abbreviations are used in this manuscript:
| USA | United States of America |
| US | United States |
| COVID-19 | Coronavirus Disease 2019 |
| RUCA | Rural–urban Commuting Area |
| (T-DiG) | Trust in Doctors in General |
| (TRUST-Ph) | Trust in Community Pharmacists |
| (TiPHA) | Trust in Public Health Authorities |
Appendix A
Table A1.
Reliability of Trust Scales (n = 426).
Table A1.
Reliability of Trust Scales (n = 426).
| Trust Scale | Components | Number of Items | Means (±SD) | Cronbach’s Alpha |
|---|---|---|---|---|
| Trust in public health authorities a | Beneficence | 8 | 2.55 (0.55) | 0.813 |
| Competence | 6 | 2.55 (0.60) | 0.797 | |
| Trust in doctors in general b | Communication competency | 5 | 3.57 (0.74) | 0.857 |
| Fidelity | 5 | 2.93 (0.84) | 0.859 | |
| Systems trust | 3 | 3.29 (0.95) | 0.885 | |
| Confidentiality | 3 | 3.71 (0.83) | 0.831 | |
| Fairness | 7 | 3.40 (0.83) | 0.925 | |
| Stigma-based discrimination | 3 | 3.17 (0.84) | 0.759 | |
| Global trust | 3 | 3.52 (0.92) | 0.949 | |
| Trust in community pharmacists (Trust-Ph) b | Benevolence | 12 | 3.32 (0.70) | 0.926 |
| Technical competence | 10 | 3.46 (0.63) | 0.874 | |
| Communication | 8 | 3.77 (0.68) | 0.918 |
a 4-point Likert Scale ranging from strongly disagree to strongly agree; b 5-point Likert scale ranging from strongly disagree to strongly agree.
Table A2.
Post-Stratification Weight Calculation by Sex and Race.
Table A2.
Post-Stratification Weight Calculation by Sex and Race.
| Variable | Population Count | Population Proportion (a) | Sample Count (Unweighted) | Sample Proportion (b) (Unweighted) | Assigned Weight (a/b) |
|---|---|---|---|---|---|
| White male | 826,519 | 0.38 | 86 | 0.20 | 1.9 |
| Black and other male | 248,156 | 0.11 | 25 | 0.06 | 1.83 |
| White female | 848,935 | 0.39 | 241 | 0.57 | 0.68 |
| Black and other female | 269,076 | 0.12 | 69 | 0.16 | 0.75 |
| Total | 2,192,686 | 421 |
Table A3.
Weight Distribution Summary.
Table A3.
Weight Distribution Summary.
| Variable | n | Minimum | Maximum | Mean | Std. Deviation |
|---|---|---|---|---|---|
| Weight | 426 | 0.68 | 1.90 | 1.282 | 0.594 |
Table A4.
Balance Diagnostics for Sex and Race in Population vs. Unweighted and Weighted Samples.
Table A4.
Balance Diagnostics for Sex and Race in Population vs. Unweighted and Weighted Samples.
| Variable | Population n = 2,192,686 n (%) | Unweighted Sample n = 421 n (%) | Weighted Sample n = 426 n (%) | ASMD (Population vs. Unweighted Sample) | ASMD (Population vs. Weighted Sample) | ASMD (Unweighted vs. Weighted Sample) |
|---|---|---|---|---|---|---|
| Sex | ||||||
| Female | 1,118,011 (51.0) | 310 (73.6) | 217 (50.9) | 0.48 | 0.002 | 0.482 |
| Male | 1,074,675 (49.0) | 111 (26.4) | 209 (49.1) | 0.48 | 0.002 | 0.482 |
| Race | ||||||
| White | 1,675,454 (76.4) | 327 (77.7) | 328 (77.1) | 0.031 | 0.017 | 0.014 |
| Non-white * | 517,232 (23.6) | 94 (22.3) | 98 (22.9) | 0.031 | 0.017 | 0.014 |
* Same as Black and other; ASMD = Absolute standardized mean difference.
Table A5.
Multicollinearity results for significant predictors identified in the bivariate analyses (n = 426).
Table A5.
Multicollinearity results for significant predictors identified in the bivariate analyses (n = 426).
| Variable | Tolerance | Variance Inflation Factor (VIF) |
|---|---|---|
| Sex | 0.891 | 1.122 |
| Age | 0.555 | 1.801 |
| Political affiliation | 0.871 | 1.148 |
| Education | 0.810 | 1.235 |
| Household income | 0.907 | 1.103 |
| Employment | 0.728 | 1.374 |
| Presence of chronic conditions | 0.885 | 1.130 |
| Previously received a COVID-19 vaccine in the past | 0.658 | 1.521 |
| Trust in Public Health | ||
| Beneficence | 0.279 | 3.583 |
| Competence | 0.279 | 3.590 |
| Trust in doctors in general | ||
| Communication competency | 0.407 | 2.454 |
| Fidelity | 0.585 | 1.708 |
| Systems trust | 0.488 | 2.049 |
| Confidentiality | 0.478 | 2.093 |
| Fairness | 0.403 | 2.482 |
| Stigma-based discrimination | 0.724 | 1.380 |
| Global trust | 0.400 | 2.500 |
| Trust in Community Pharmacists | ||
| Benevolence | 0.282 | 3.546 |
| Technical competence | 0.301 | 3.324 |
| Communication | 0.360 | 2.779 |

Figure A1.
Receiver operating characteristic (ROC) curve for influenza vaccine uptake model (n = 426).
Figure A1.
Receiver operating characteristic (ROC) curve for influenza vaccine uptake model (n = 426).

Table A6.
Linearity diagnostics for continuous predictors in the multivariable logistic regression model using Box–Tidwell test (n = 426).
Table A6.
Linearity diagnostics for continuous predictors in the multivariable logistic regression model using Box–Tidwell test (n = 426).
| Factor and Their Interactions | Estimate | Standard Error | p Value |
|---|---|---|---|
| Trust in Public Health Authorities | |||
| Beneficence | −7.784 | 2.994 | 0.009 |
| Beneficence × log (Beneficence) | 4.087 | 1.578 | 0.010 |
| Competence | 4.476 | 3.117 | 0.151 |
| Competence × log (Competence) | −2.018 | 1.630 | 0.216 |
| Trust in doctors in general | |||
| Communication competency | 2.108 | 3.448 | 0.541 |
| Communication competency × log (Communication competency) | −0.481 | 1.528 | 0.753 |
| Fidelity | 2.163 | 1.984 | 0.276 |
| Fidelity × log (Fidelity) | −1.019 | 0.940 | 0.278 |
| Systems trust | 1.452 | 1.729 | 0.401 |
| Systems trust × log (Systems trust) | −0.698 | 0.808 | 0.388 |
| Confidentiality | 1.265 | 2.553 | 0.620 |
| Confidentiality × log (Confidentiality) | −0.676 | 1.119 | 0.546 |
| Fairness | 1.870 | 2.455 | 0.446 |
| Fairness × log (Fairness) | −1.044 | 1.118 | 0.351 |
| Stigma-based discrimination | −1.840 | 1.933 | 0.341 |
| Stigma-based discrimination × log (Stigma-based discrimination) | 1.049 | 0.921 | 0.255 |
| Global trust | 0.139 | 1.899 | 0.941 |
| Global trust × log (Global trust) | 0.095 | 0.876 | 0.916 |
| Trust in Community Pharmacists | |||
| Benevolence | 5.265 | 3.158 | 0.096 |
| Benevolence × log (Benevolence) | −2.392 | 1.457 | 0.101 |
| Technical competence | −3.173 | 3.729 | 0.395 |
| Technical competence × log (Technical competence) | 1.223 | 1.702 | 0.472 |
| Communication | −5.208 | 3.151 | 0.098 |
| Communication × log (Communication) | 2.253 | 1.401 | 0.108 |
Table A7.
Post hoc pairwise contrasts of political affiliation effects adjusted for multiple comparisons in the multivariable logistic regression model (n = 426).
Table A7.
Post hoc pairwise contrasts of political affiliation effects adjusted for multiple comparisons in the multivariable logistic regression model (n = 426).
| Contrast | Estimate | Standard Error | Odds Ratio | Lower 95% CI | Upper 95% CI | p-Value |
|---|---|---|---|---|---|---|
| Republican—Democrat | −0.918 | 0.460 | 0.399 | 0.119 | 1.343 | 0.275 |
| Republican—Independent | −0.762 | 0.397 | 0.467 | 0.164 | 1.330 | 0.330 |
| Republican—Other | 0.369 | 0.517 | 1.446 | 0.369 | 5.660 | 1.000 |
| Democrat—Independent | 0.156 | 0.473 | 1.169 | 0.336 | 4.068 | 1.000 |
| Democrat—Other | 1.287 | 0.586 | 3.621 | 0.772 | 16.978 | 0.168 |
| Independent—Other | 1.131 | 0.542 | 3.098 | 0.742 | 12.938 | 0.222 |
p-values were adjusted using the Bonferroni method to control the family-wise error rate across six pairwise comparisons of political affiliation groups. The adjusted significance threshold was set at α = 0.05/6 = 0.0083.
References
- Borchering, R.K.; Biggerstaff, M.; Brammer, L.; Budd, A.; Garg, S.; Fry, A.M.; Iuliano, A.D.; Reed, C. Responding to the return of influenza in the united states by applying centers for disease control and prevention surveillance, analysis, and modeling to inform understanding of seasonal influenza. JMIR Public Health Surveill. 2024, 10, e54340. [Google Scholar] [CrossRef]
- Iuliano, A.D.; Roguski, K.M.; Chang, H.H.; Muscatello, D.J.; Palekar, R.; Tempia, S.; Cohen, C.; Gran, J.M.; Schanzer, D.; Cowling, B.J. Estimates of global seasonal influenza-associated respiratory mortality: A modelling study. Lancet 2018, 391, 1285–1300. [Google Scholar] [CrossRef]
- Grohskopf, L.A. Prevention and control of seasonal influenza with vaccines: Recommendations of the Advisory Committee on Immunization Practices—United States, 2023–2024 influenza season. MMWR Recomm. Rep. 2023, 72, 1–25. [Google Scholar] [CrossRef]
- Melchinger, H.; Belgaumi, S.M.; Ahmed, N.; Omer, S.B.; Malik, A.A. Change in influenza vaccine uptake among adults in the United States from May 2020 to October 2024. PLoS Global Public Health 2025, 5, e0004756. [Google Scholar] [CrossRef]
- The Centers for Disease Control and Prevention. Flu Vaccination Coverage, United States, 2023–2024 Influenza Season. Available online: https://www.cdc.gov/fluvaxview/coverage-by-season/2023-2024.html (accessed on 13 September 2025).
- Rankings, A.s.H. Explore Flu Vaccination in Alabama. Available online: https://www.americashealthrankings.org/explore/measures/flu_vaccine/AL (accessed on 13 September 2025).
- Brewer, L.I.; Ommerborn, M.J.; Nguyen, A.L.; Clark, C.R. Structural inequities in seasonal influenza vaccination rates. BMC Public Health 2021, 21, 1166. [Google Scholar] [CrossRef]
- Parekh, T.; Javed, Z.; Khan, S.U.; Xue, H.; Nasir, K. Disparities in influenza vaccination coverage and associated factors among adults with cardiovascular disease, United States, 2011–2020. Prev. Chronic Dis. 2022, 19, E67. [Google Scholar] [CrossRef]
- Black, C.L. Vital signs: Influenza hospitalizations and vaccination coverage by race and ethnicity—United States, 2009–2010 through 2021–2022 influenza seasons. MMWR Morb. Mortal. Wkly. Rep. 2022, 71, 1366–1373. [Google Scholar] [CrossRef]
- Matthews, K.A. Health-related behaviors by urban-rural county classification—United States, 2013. MMWR Surveill. Summ. 2017, 66, 1–8. [Google Scholar] [CrossRef]
- Larson, H.J.; Jarrett, C.; Schulz, W.S.; Chaudhuri, M.; Zhou, Y.; Dube, E.; Schuster, M.; MacDonald, N.E.; Wilson, R. Measuring vaccine hesitancy: The development of a survey tool. Vaccine 2015, 33, 4165–4175. [Google Scholar] [CrossRef]
- Soveri, A.; Karlsson, L.C.; Antfolk, J.; Mäki, O.; Karlsson, L.; Karlsson, H.; Nolvi, S.; Karukivi, M.; Lindfelt, M.; Lewandowsky, S. Spillover effects of the COVID-19 pandemic on attitudes to influenza and childhood vaccines. BMC Public Health 2023, 23, 764. [Google Scholar] [CrossRef]
- Moore, R.; Rojo, M.O.; Purvis, R.S.; Marin, L.P.; Yáñez, J.; Reece, S.; Wells, C.; Vaughn, B.; McElfish, P.A. Overcoming barriers and enhancing facilitators to COVID-19 vaccination in the Hispanic community. BMC Public Health 2022, 22, 2393. [Google Scholar] [CrossRef]
- Syed, S.T.; Gerber, B.S.; Sharp, L.K. Traveling towards disease: Transportation barriers to health care access. J. Community Health 2013, 38, 976–993. [Google Scholar] [CrossRef]
- Wolfe, M.K.; McDonald, N.C.; Holmes, G.M. Transportation barriers to health care in the United States: Findings from the national health interview survey, 1997–2017. Am. J. Public Health 2020, 110, 815–822. [Google Scholar] [CrossRef]
- National Rural Health Association. Rural Workforce Recruitment and Retention Factors. Policy Brief. 2025. Available online: https://www.ruralhealth.us/nationalruralhealth/media/documents/advocacy/nrha-policy-brief-workforce-retention-factors-final-3-7-25.pdf (accessed on 4 October 2025).
- Nofzinger, T.B.; Huang, T.T.; Lingat, C.E.R.; Amonkar, G.M.; Edwards, E.E.; Yu, A.; Smith, A.D.; Gayed, N.; Gaddey, H.L. Vaccine fatigue and influenza vaccination trends across Pre-, Peri-, and Post-COVID-19 periods in the United States using epic’s cosmos database. PLoS ONE 2025, 20, e0326098. [Google Scholar] [CrossRef]
- Singleton, B.A.; Al-Dahir, S.; Gillard, C.; Earls, M.; Bommarito, J.; Duhe, M.; Phi, K. Perceived role, identity and experiences of pharmacists and the potential impact on COVID-19 vaccine uptake per Louisiana region: A prospective cohort study. Int. J. Environ. Res. Public Health 2023, 20, 6459. [Google Scholar] [CrossRef] [PubMed]
- Zhang, S. An optimal vaccine allocation model considering vaccine hesitancy and efficacy rates among populations. IEEE Access 2023, 11, 27693–27701. [Google Scholar] [CrossRef]
- Henning-Smith, C.E.; Hernandez, A.M.; Hardeman, R.R.; Ramirez, M.R.; Kozhimannil, K.B. Rural counties with majority black or indigenous populations suffer the highest rates of premature death in the US. Health Aff. 2019, 38, 2019–2026. [Google Scholar] [CrossRef]
- Yue, Z.; McCormick, N.P.; Ezeala, O.M.; Durham, S.H.; Westrick, S.C. EMSIG: Uncovering Factors Influencing COVID-19 Vaccination Across Different Subgroups Characterized by Embedding-Based Spatial Information Gain. Vaccines 2024, 12, 1253. [Google Scholar] [CrossRef]
- Alabama Department of Public Health. Estimated Population by Agegroup, Race and Sex Alabama. 2023. Available online: https://www.alabamapublichealth.gov/healthstats/assets/estimated-population-2023.pdf (accessed on 4 October 2025).
- Yang, D.; Dalton, J.E. A unified approach to measuring the effect size between two groups using SAS. In SAS Global Forum; SAS: Cary, NC, USA, 2025; pp. 1–6. [Google Scholar]
- Austin, P.C. Balance diagnostics for comparing the distribution of baseline covariates between treatment groups in propensity-score matched samples. Stat. Med. 2009, 28, 3083–3107. [Google Scholar] [CrossRef]
- Kim, J.H. Multicollinearity and misleading statistical results. Korean J. Anesthesiol. 2019, 72, 558–569. [Google Scholar] [CrossRef]
- Jain, B.; Paguio, J.A.; Yao, J.S.; Jain, U.; Dee, E.C.; Celi, L.A.; Ojikutu, B. Rural–urban differences in influenza vaccination among adults in the United States, 2018–2019. Am. J. Public Health 2022, 112, 304–307. [Google Scholar] [CrossRef]
- Meit, M.; Knudson, A.; Gilbert, T.; Yu, A.T.-C.; Tanenbaum, E.; Ormson, E.; Popat, S. The 2014 Update of the Rural-Urban Chartbook; Rural Health Reform Policy Research Center: Bethesda, MD, USA, 2014; Volume 10. [Google Scholar]
- Schmid, P.; Rauber, D.; Betsch, C.; Lidolt, G.; Denker, M.-L. Barriers of influenza vaccination intention and behavior–a systematic review of influenza vaccine hesitancy, 2005–2016. PLoS ONE 2017, 12, e0170550. [Google Scholar] [CrossRef]
- Zhang, X.; Li, L.; Zhang, Q.; Le, L.H.; Wu, Y. Physician empathy in doctor-patient communication: A systematic review. Health Commun. 2024, 39, 1027–1037. [Google Scholar] [CrossRef]
- Liu, X.; Zeng, J.; Li, L.; Wang, Q.; Chen, J.; Ding, L. The influence of Doctor-Patient communication on patients’ trust: The role of Patient-Physician consistency and perceived threat of disease. Psychol. Res. Behav. Manag. 2024, 17, 2727–2737. [Google Scholar] [CrossRef]
- Freimuth, V.S.; Jamison, A.M.; An, J.; Hancock, G.R.; Quinn, S.C. Determinants of trust in the flu vaccine for African Americans and Whites. Soc. Sci. Med. 2017, 193, 70–79. [Google Scholar] [CrossRef]
- Viskupič, F.; Wiltse, D.L.; Meyer, B.A. Trust in physicians and trust in government predict COVID-19 vaccine uptake. Social Science Quarterly 2022, 103, 509–520. [Google Scholar] [CrossRef]
- Kaoiean, S.; Kittikraisak, W.; Suntarattiwong, P.; Ditsungnoen, D.; Phadungkiatwatana, P.; Srisantiroj, N.; Asavapiriyanont, S.; Chotpitayasunondh, T.; Dawood, F.S.; Lindblade, K.A. Predictors for influenza vaccination among Thai pregnant woman: The role of physicians in increasing vaccine uptake. Influenza Other Respi. Viruses 2019, 13, 582–592. [Google Scholar] [CrossRef]
- Santibanez, T.A.; Mootrey, G.T.; Euler, G.L.; Janssen, A.P. Behavior and beliefs about influenza vaccine among adults aged 5064 years. Am. J. Health Behav. 2010, 34, 77–89. [Google Scholar] [CrossRef]
- Murthy, B.P. Disparities in COVID-19 vaccination coverage between urban and rural counties—United States, December 14, 2020–April 10, 2021. MMWR Morb. Mortal. Wkly. Rep. 2021, 70, 759–764. [Google Scholar] [CrossRef]
- Martinelli, M.; Veltri, G.A. Shared understandings of vaccine hesitancy: How perceived risk and trust in vaccination frame individuals’ vaccine acceptance. PLoS ONE 2022, 17, e0276519. [Google Scholar] [CrossRef]
- Janssen, C.; Mosnier, A.; Gavazzi, G.; Combadière, B.; Crepey, P.; Gaillat, J.; Launay, O.; Botelho-Nevers, E. Coadministration of seasonal influenza and COVID-19 vaccines: A systematic review of clinical studies. Hum. Vaccin. Immunother. 2022, 18, 2131166. [Google Scholar] [CrossRef]
- Sandlin, E.W. The politicization of influenza: Partisan changes in flu vaccination before and after COVID-19. J. Public Health 2025, 47, 317–325. [Google Scholar] [CrossRef]
- Bolsen, T.; Palm, R. Politicization and COVID-19 vaccine resistance in the US. Prog. Mol. Biol. Transl. Sci. 2022, 188, 81–100. [Google Scholar] [PubMed]
- Gaskin, C.M.; Woods, D.R.; Ghosh, S.; Watson, S.; Huber, L.R. The Effect of Income Disparities on Influenza Vaccination Coverage in the United States. Public Health Rep. 2023, 138, 85–90. [Google Scholar] [CrossRef] [PubMed]
- Fox, J.B.; Shaw, F.E. Relationship of income and health care coverage to receipt of recommended clinical preventive services by adults—United States, 2011–2012. MMWR Morb. Mortal. Wkly. Rep. 2014, 63, 666–670. [Google Scholar] [PubMed]
- Lau, J.S.; Adams, S.H.; Irwin, C.E.; Ozer, E.M. Receipt of Preventive Health Services in Young Adults. J. Adolesc. Health 2013, 52, 42–49. [Google Scholar] [CrossRef]
- U.S. Department of Health and Human Services, Office of Disease Prevention and Health Promotion. Healthy People 2020: Increase the Proportion of People Who Get the Flu Vaccine Every Year (IID-90). Available online: https://health.gov/healthypeople/objectives-and-data/browse-objectives/vaccination/increase-proportion-people-who-get-flu-vaccine-every-year-iid-09 (accessed on 13 September 2025).


Disclaimer/Publisher’s Note: The statements, opinions and data contained in all publications are solely those of the individual author(s) and contributor(s) and not of MDPI and/or the editor(s). MDPI and/or the editor(s) disclaim responsibility for any injury to people or property resulting from any ideas, methods, instructions or products referred to in the content. |
© 2025 by the authors. Licensee MDPI, Basel, Switzerland. This article is an open access article distributed under the terms and conditions of the Creative Commons Attribution (CC BY) license (https://creativecommons.org/licenses/by/4.0/).