
Antiproliferation Effects of Marine-Sponge-Derived Methanol Extract of Theonella swinhoei in Oral Cancer Cells In Vitro

 , ,
, , 
 and
and 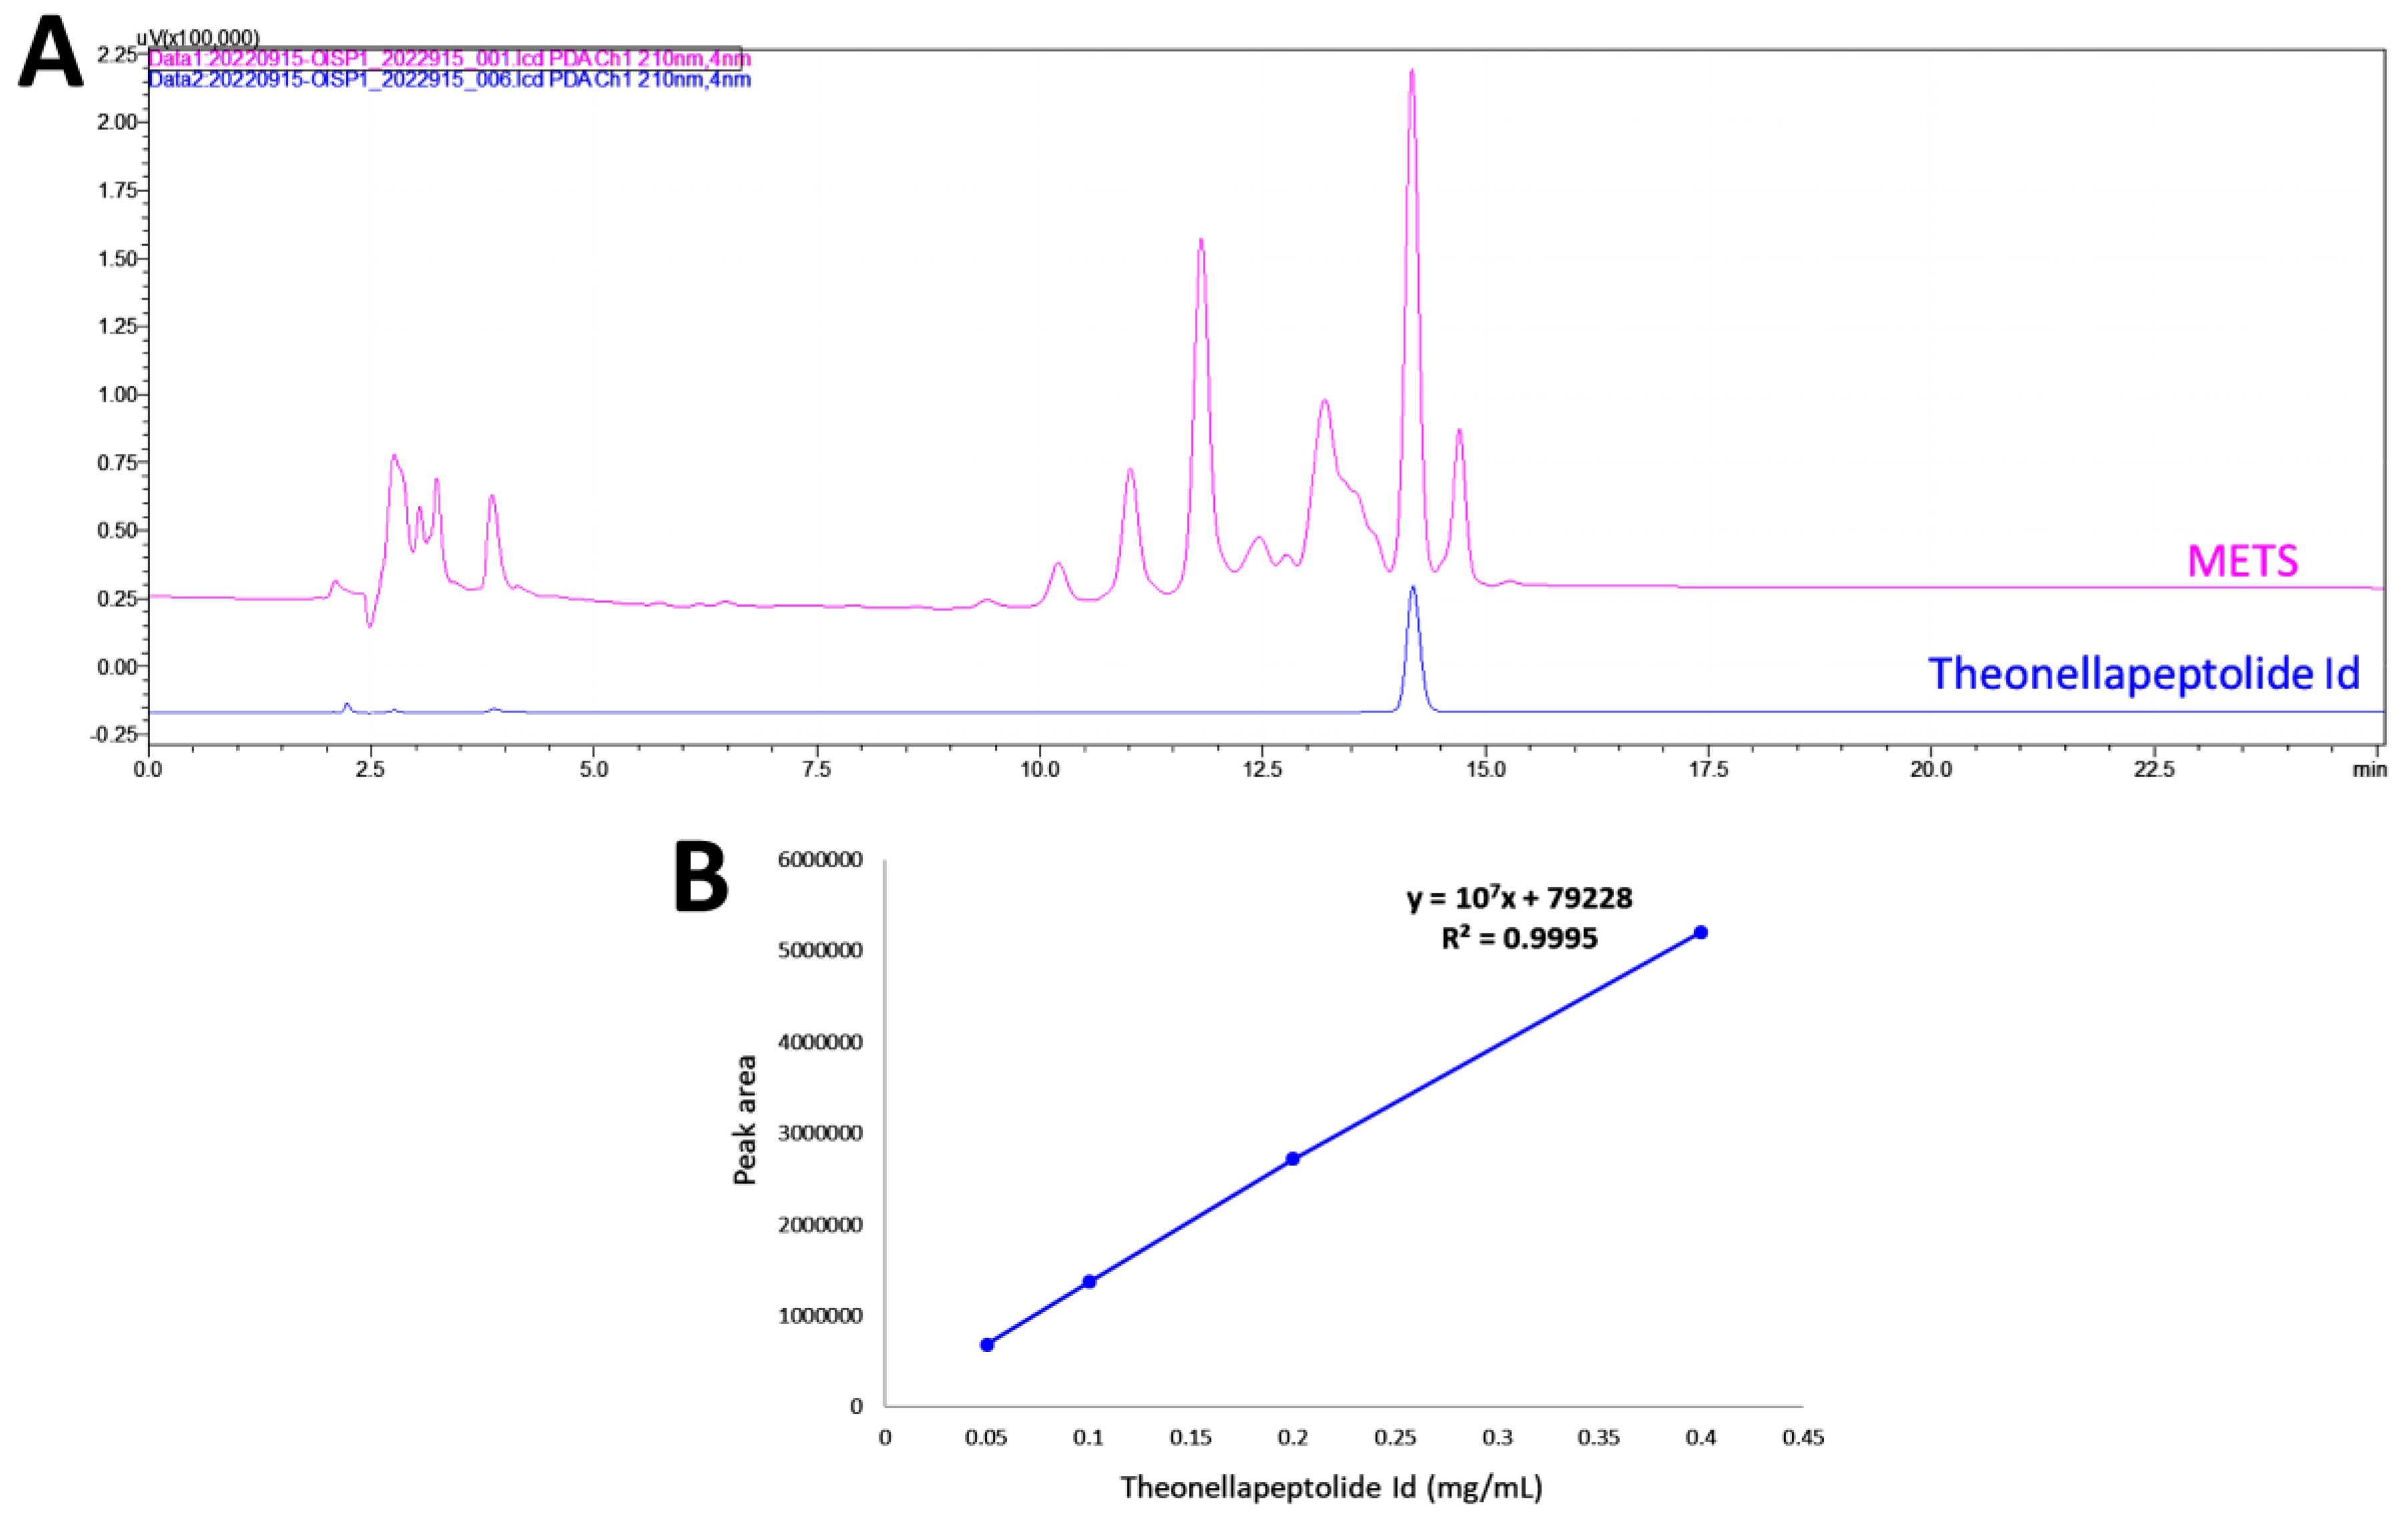
Abstract
1. Introduction
2. Materials and Methods
2.1. METS Preparation
2.2. HPLC Analysis of METS
2.3. Cell Cultures and Reagents
2.4. Cell Viability Assay
2.5. Cytometric Cell Cycle Assay
2.6. Cytometric Apoptosis Assay (Annexin V/7AAD)
2.7. Peptide-Based Apoptosis Assay (Caspase 3/7)
2.8. Cytometric Apoptosis Assay (Caspases 3, 8, and 9)
2.9. Cytometric Reactive Oxygen Species (ROS), Mitochondrial Superoxide (MitoSOX), and Glutathione (GSH) Assays
2.10. Cytometric γH2AX/7AAD and 8-Hydroxy-2-deoxyguanosine (8-OHdG) Assays
2.11. Statistical Analysis
3. Results
3.1. HPLC Analysis of METS
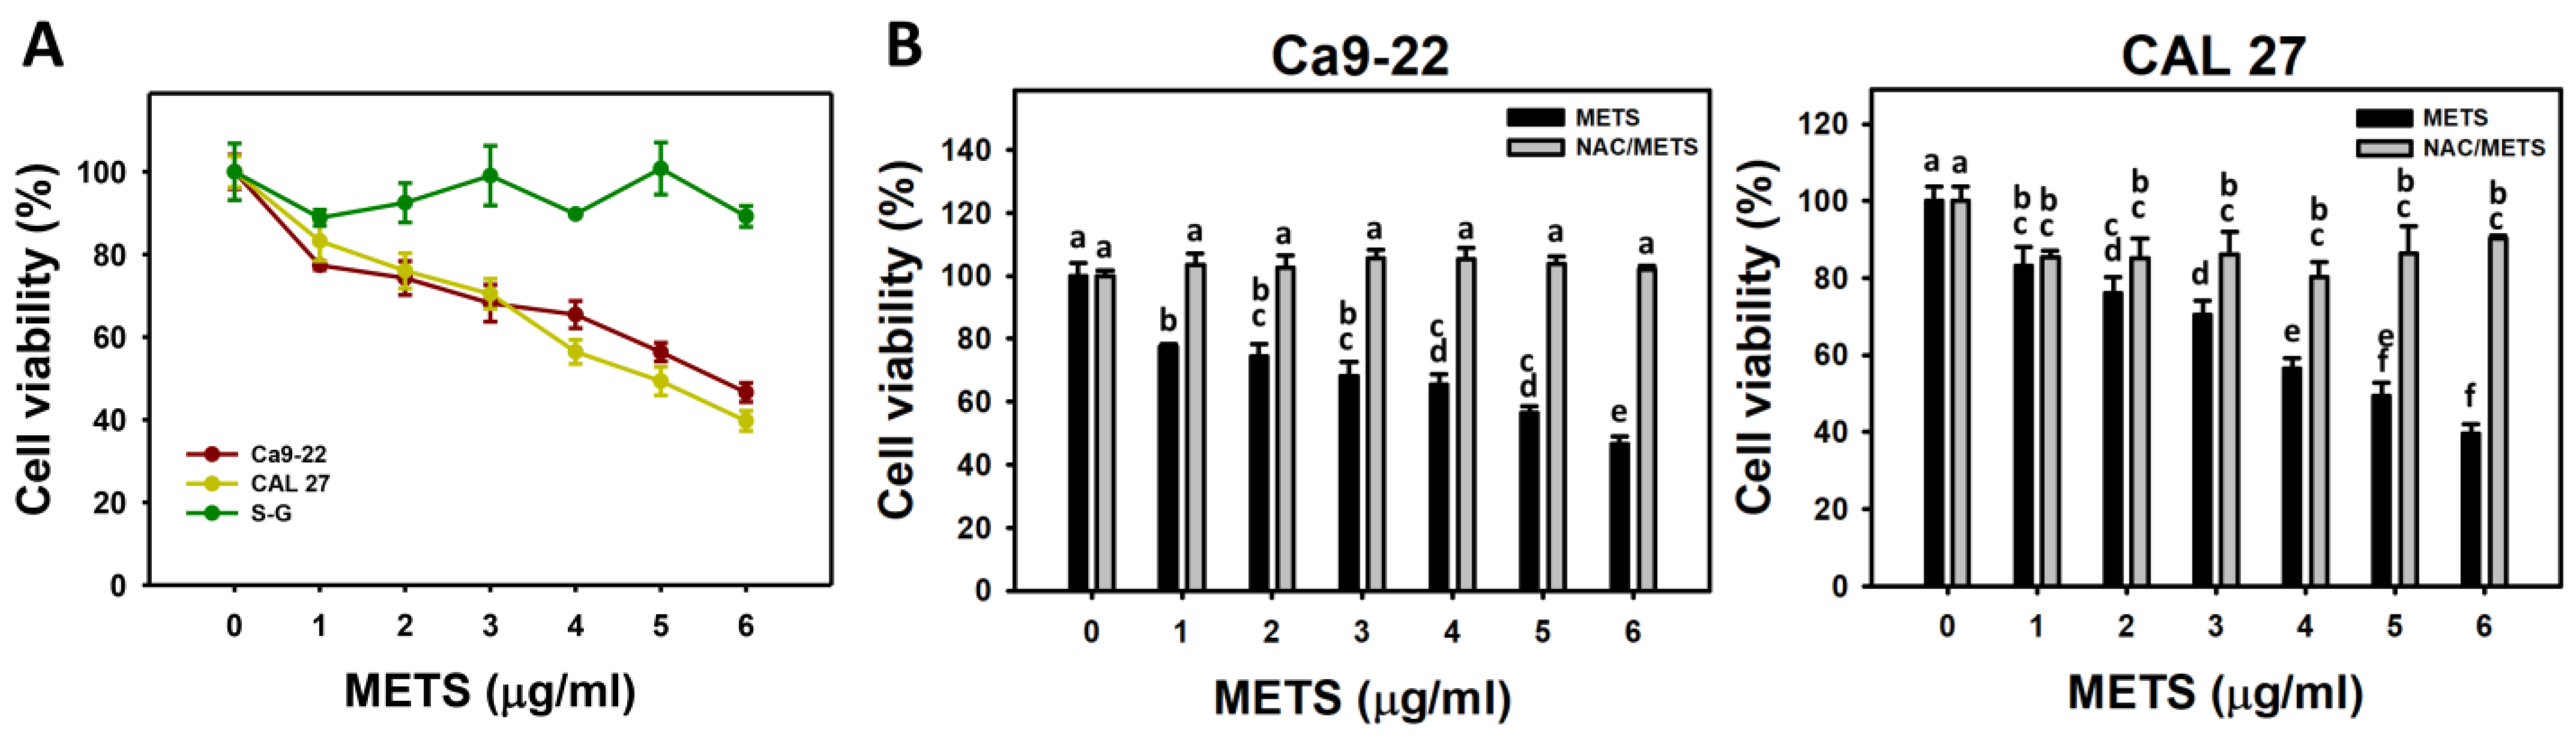
3.2. METS Causes More Antiproliferation to Oral Cancer Cells than Normal Cells
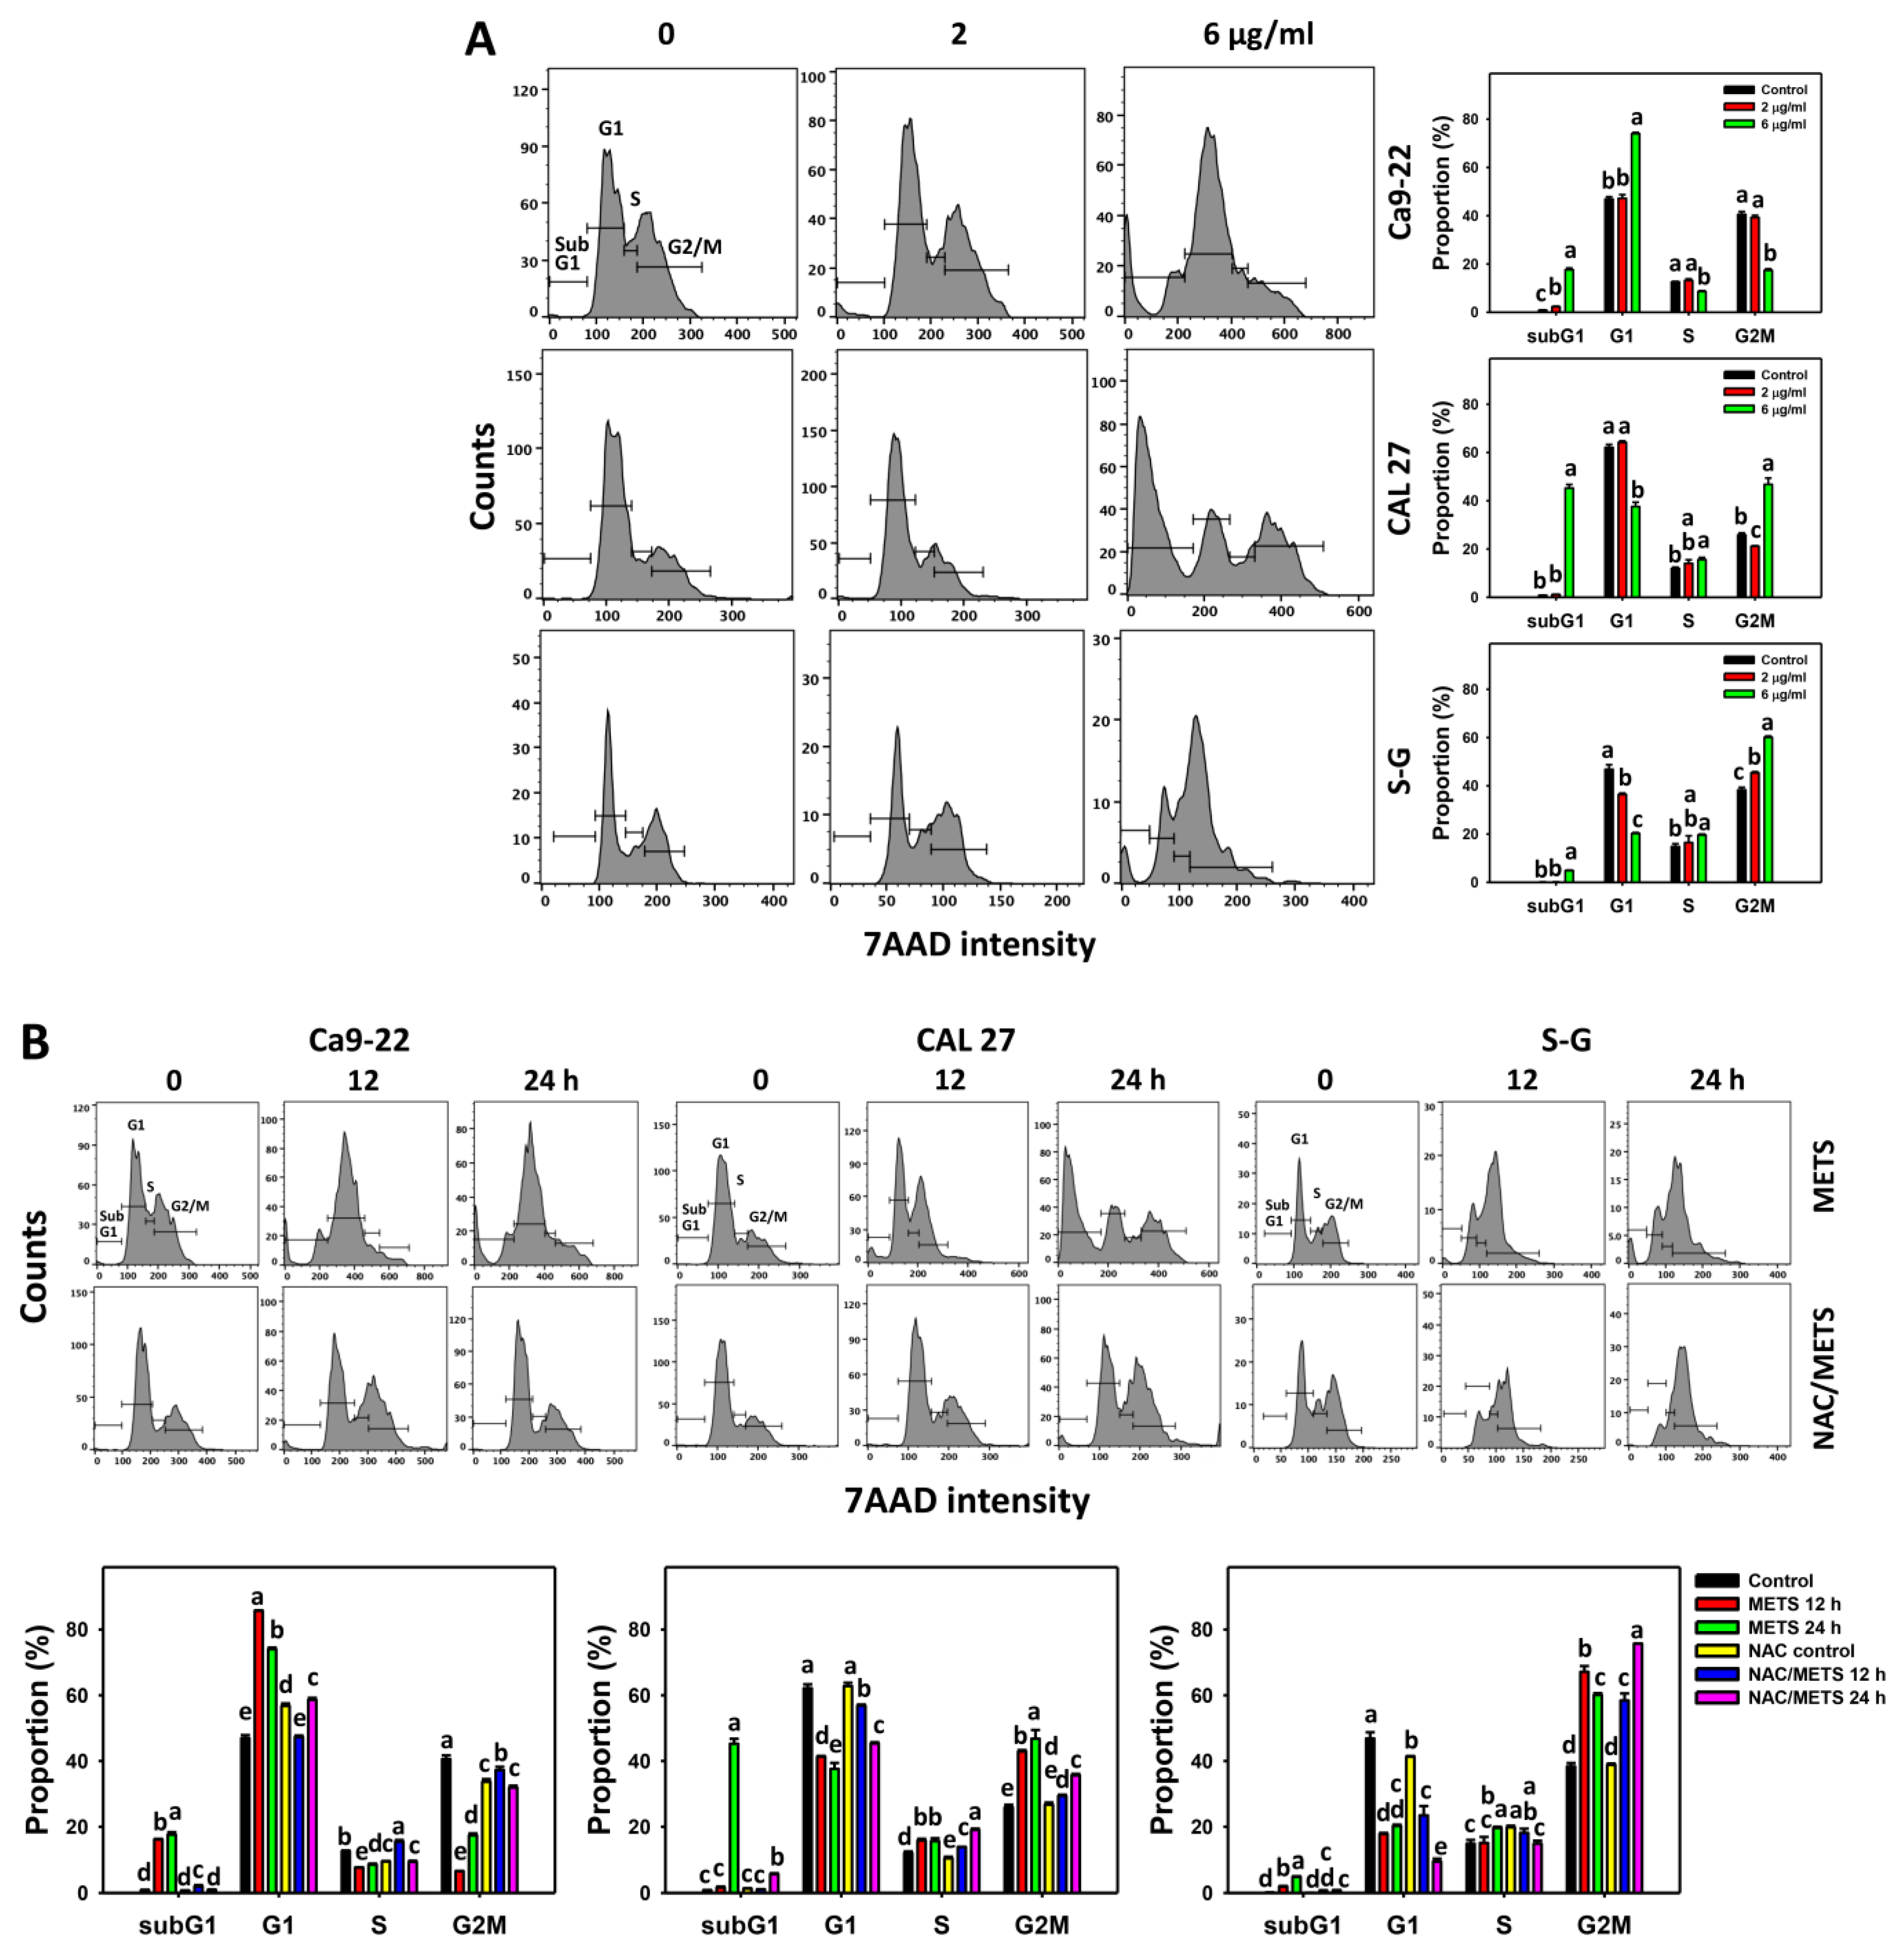
3.3. METS Causes More subG1 Accumulation to Oral Cancer Cells than Normal Cells
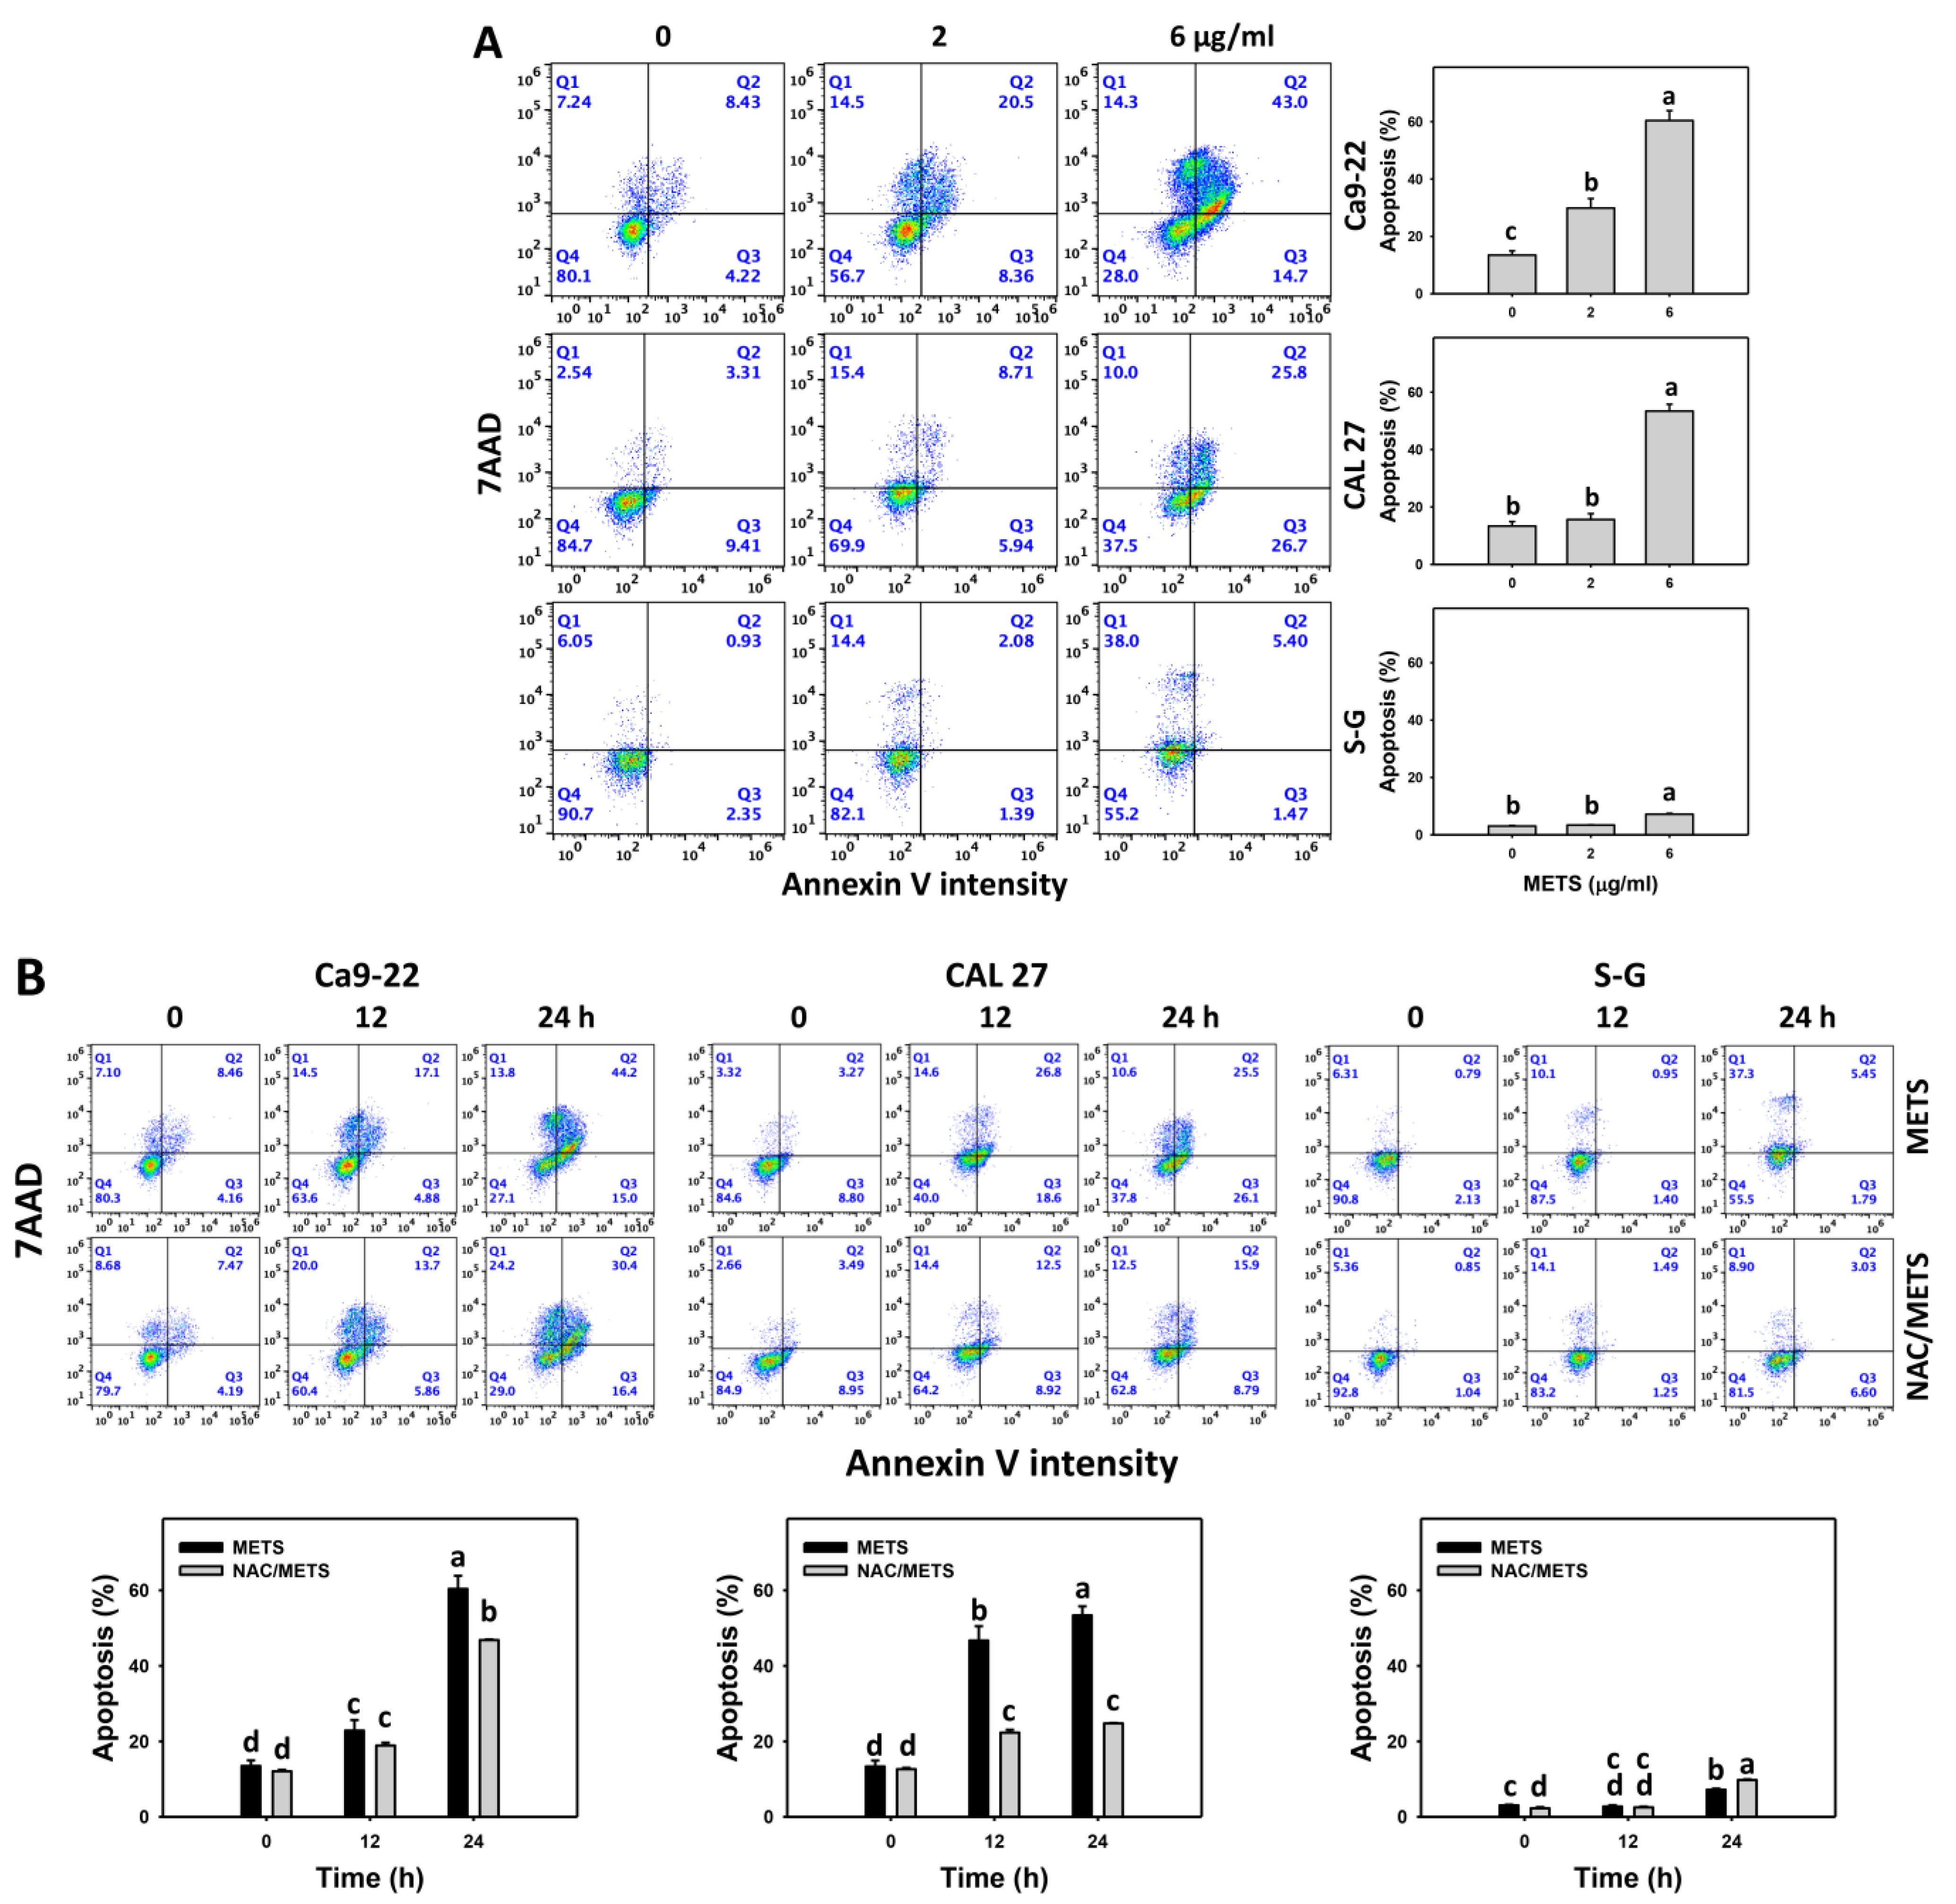
3.4. METS Causes More Annexin V-Based Apoptosis to Oral Cancer Cells than Normal Cells
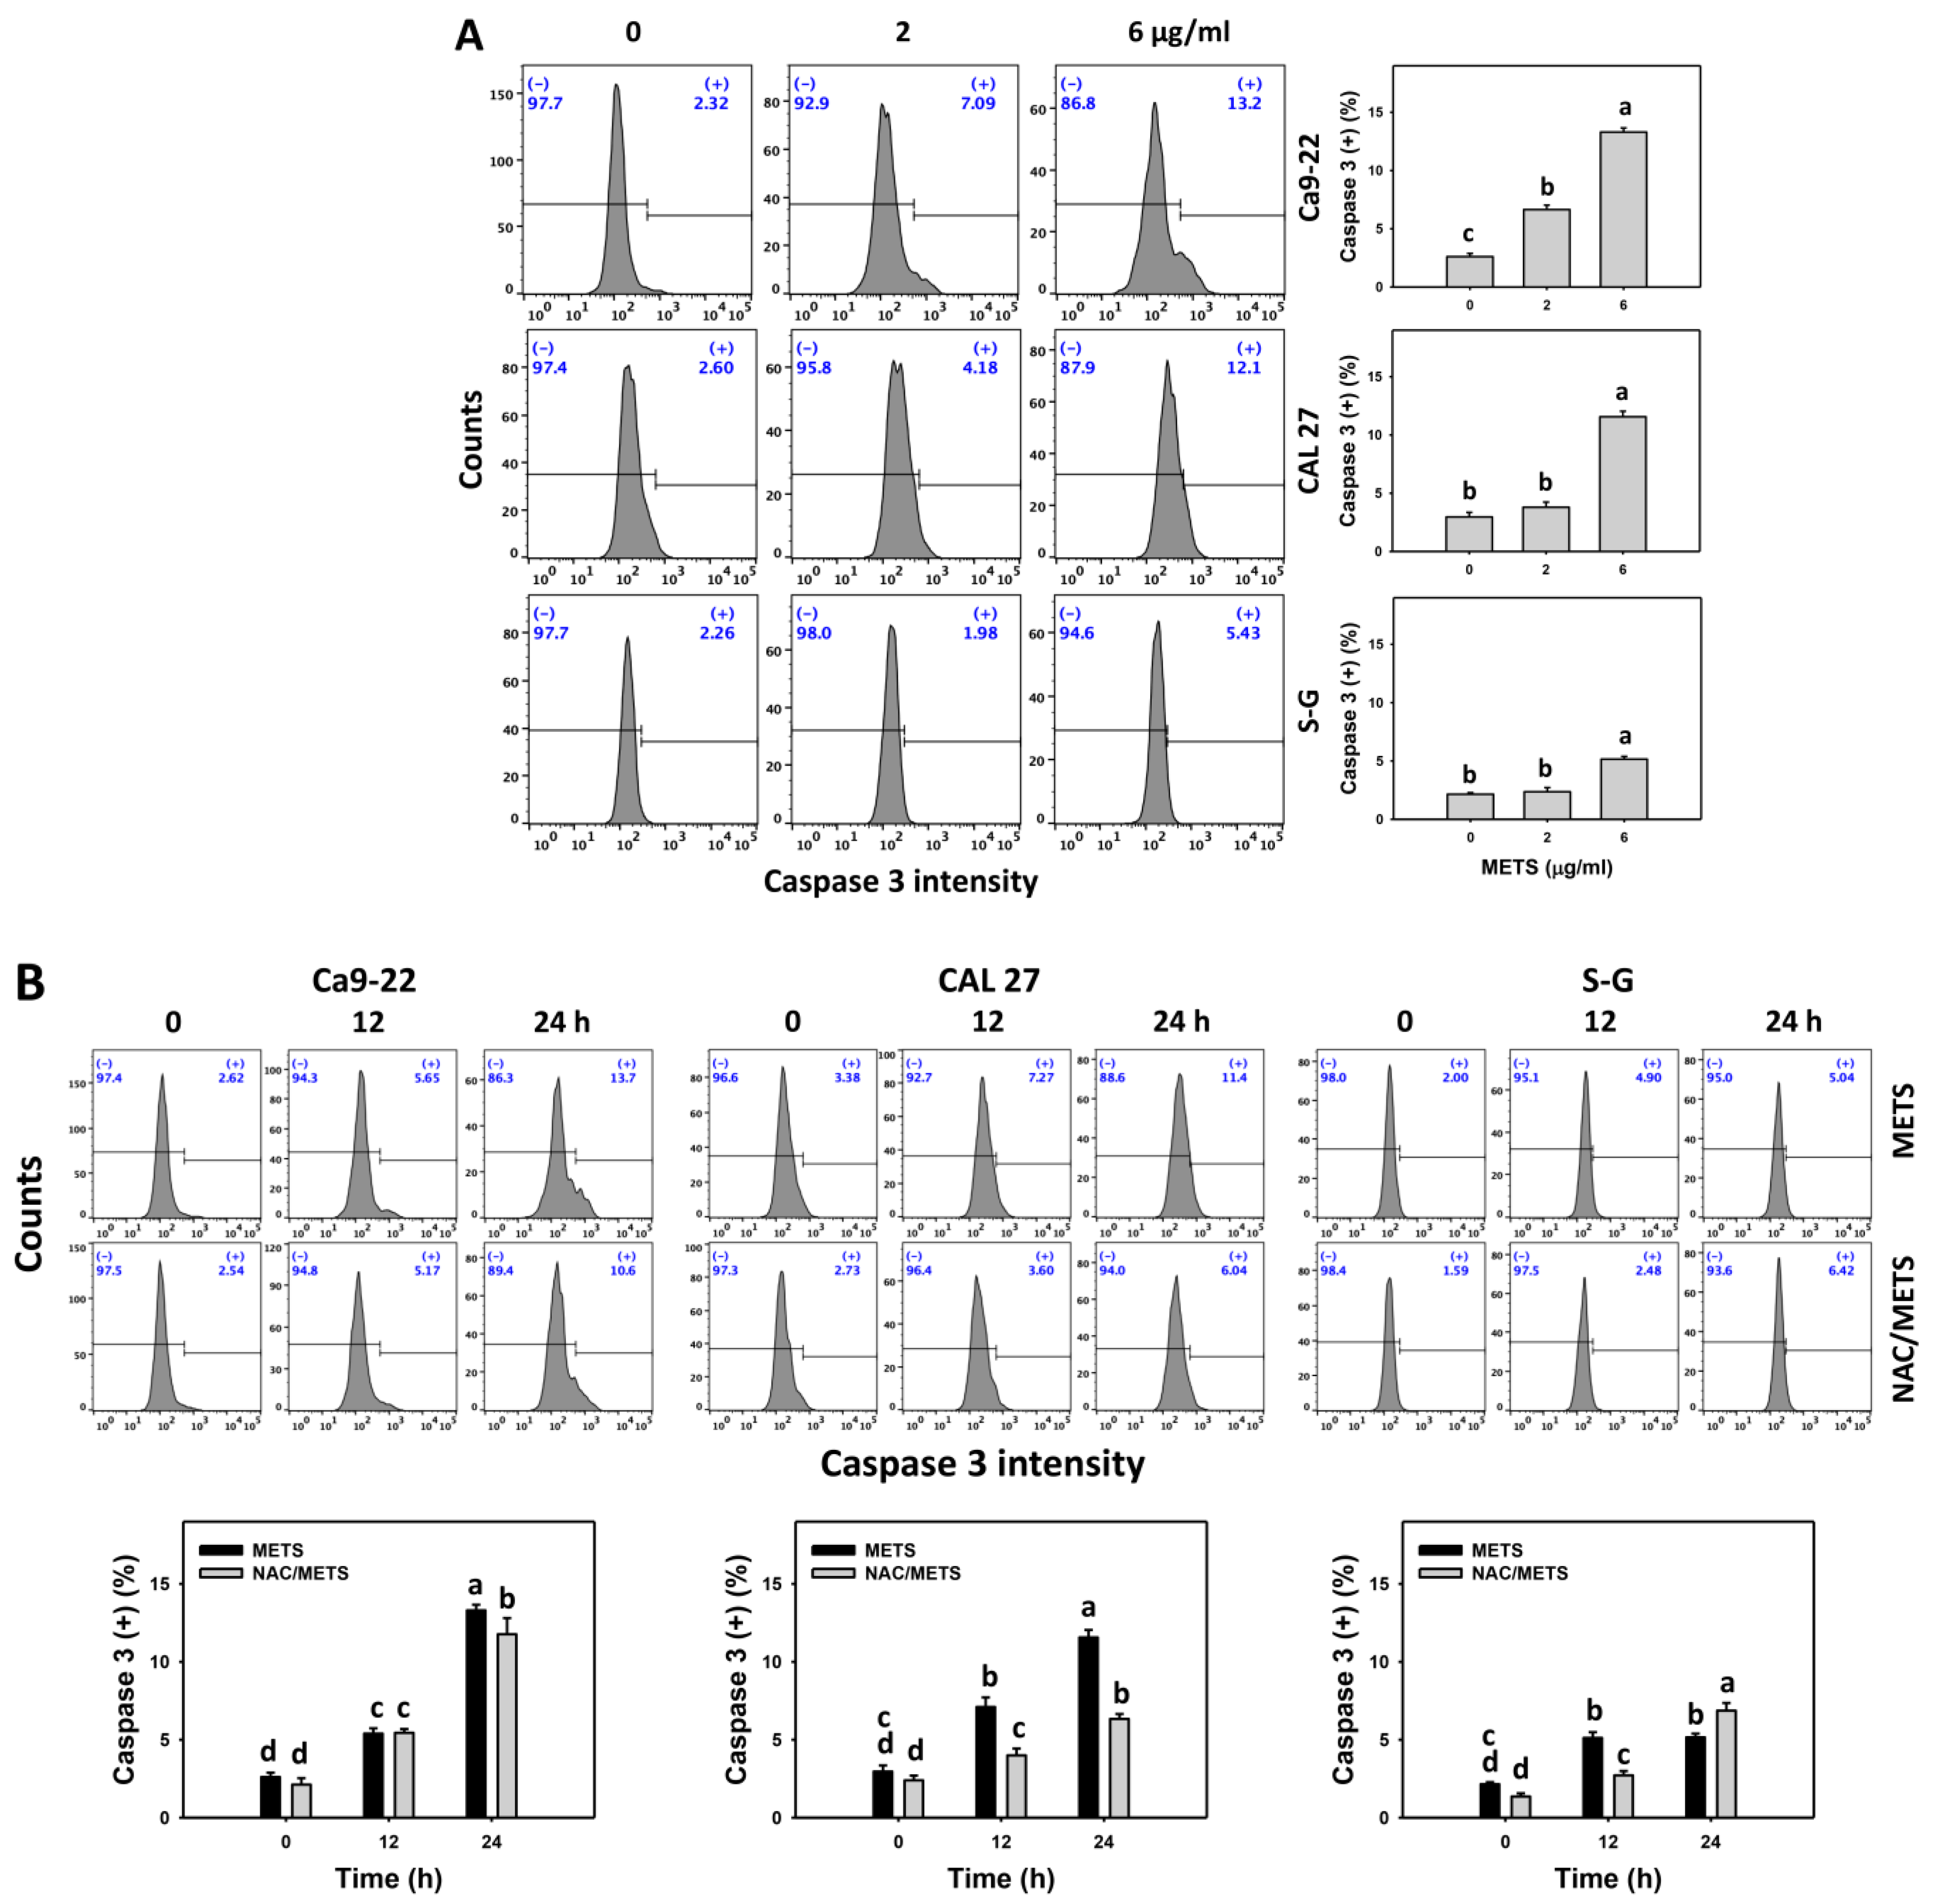
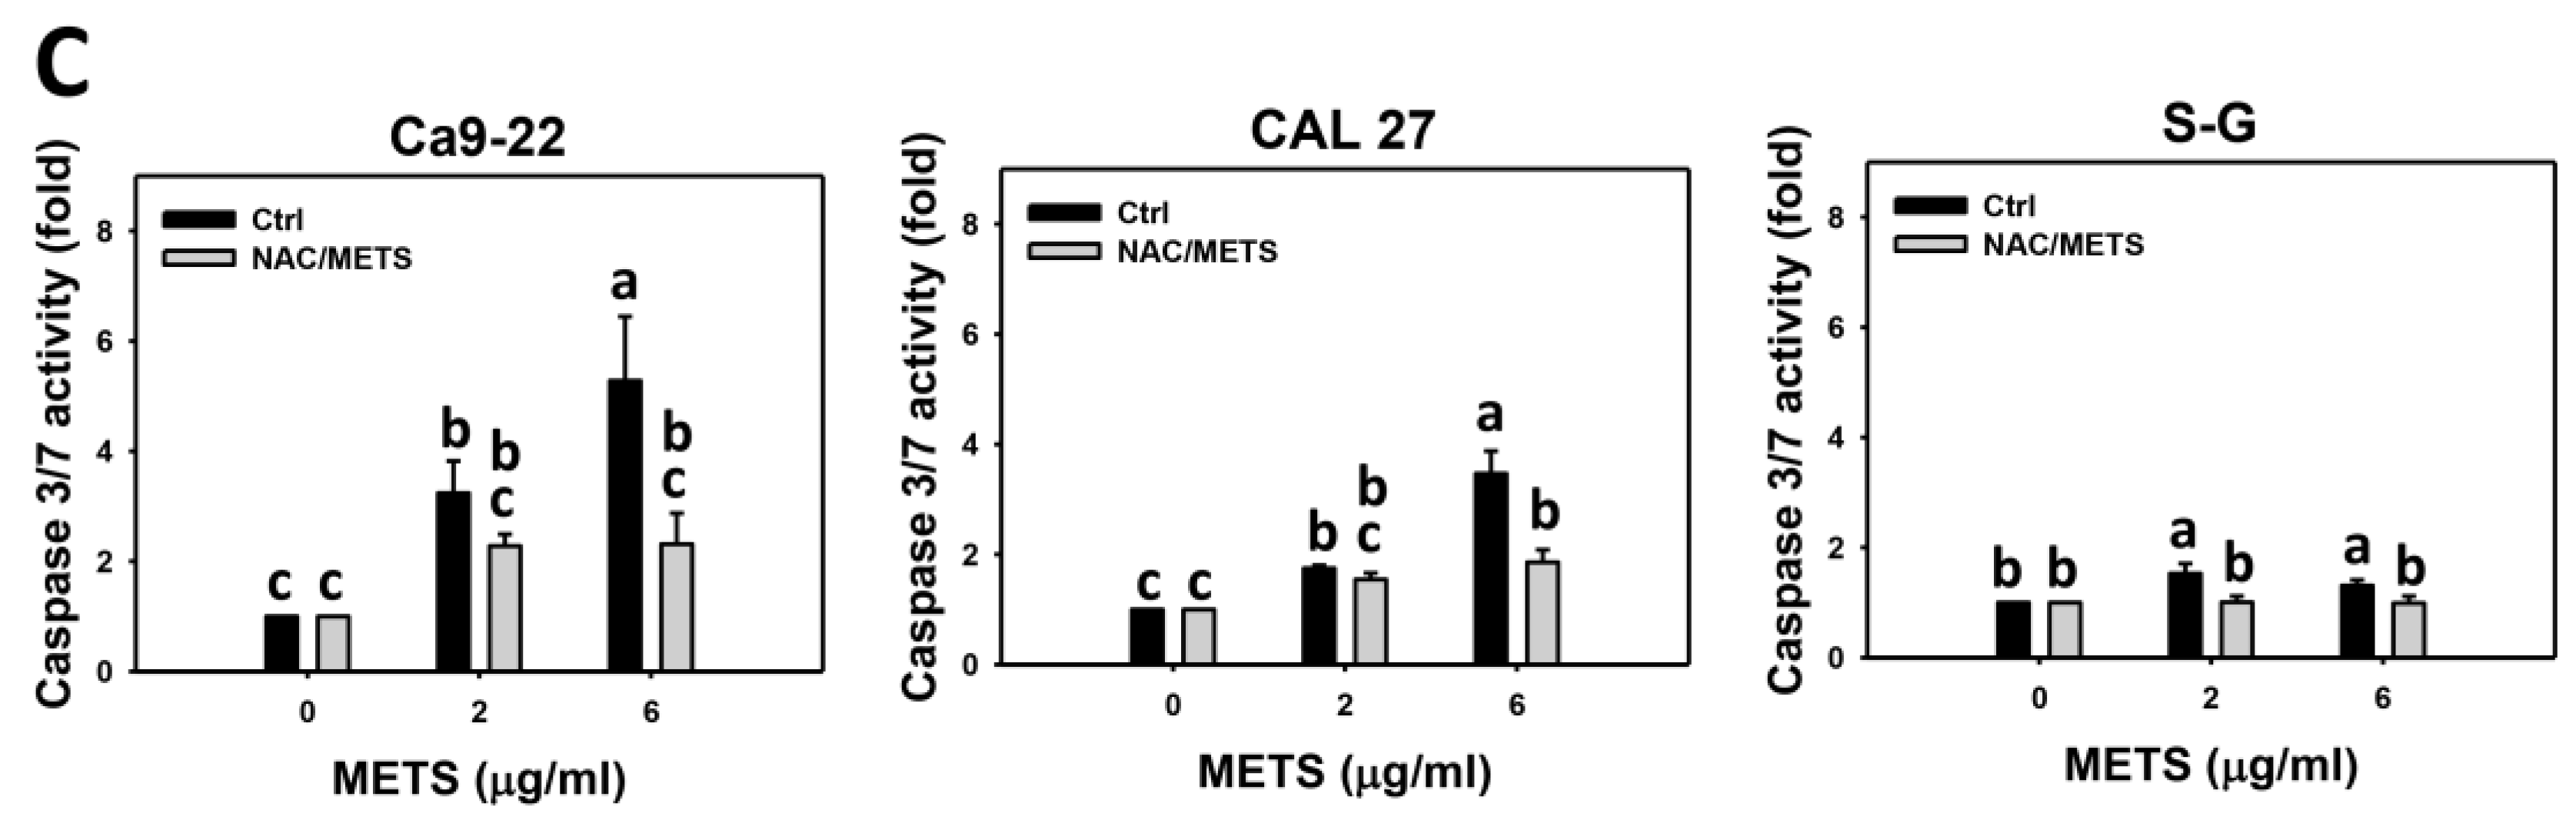
3.5. METS Causes More Caspase 3 and 3/7 Activations to Oral Cancer Cells than Normal Cells
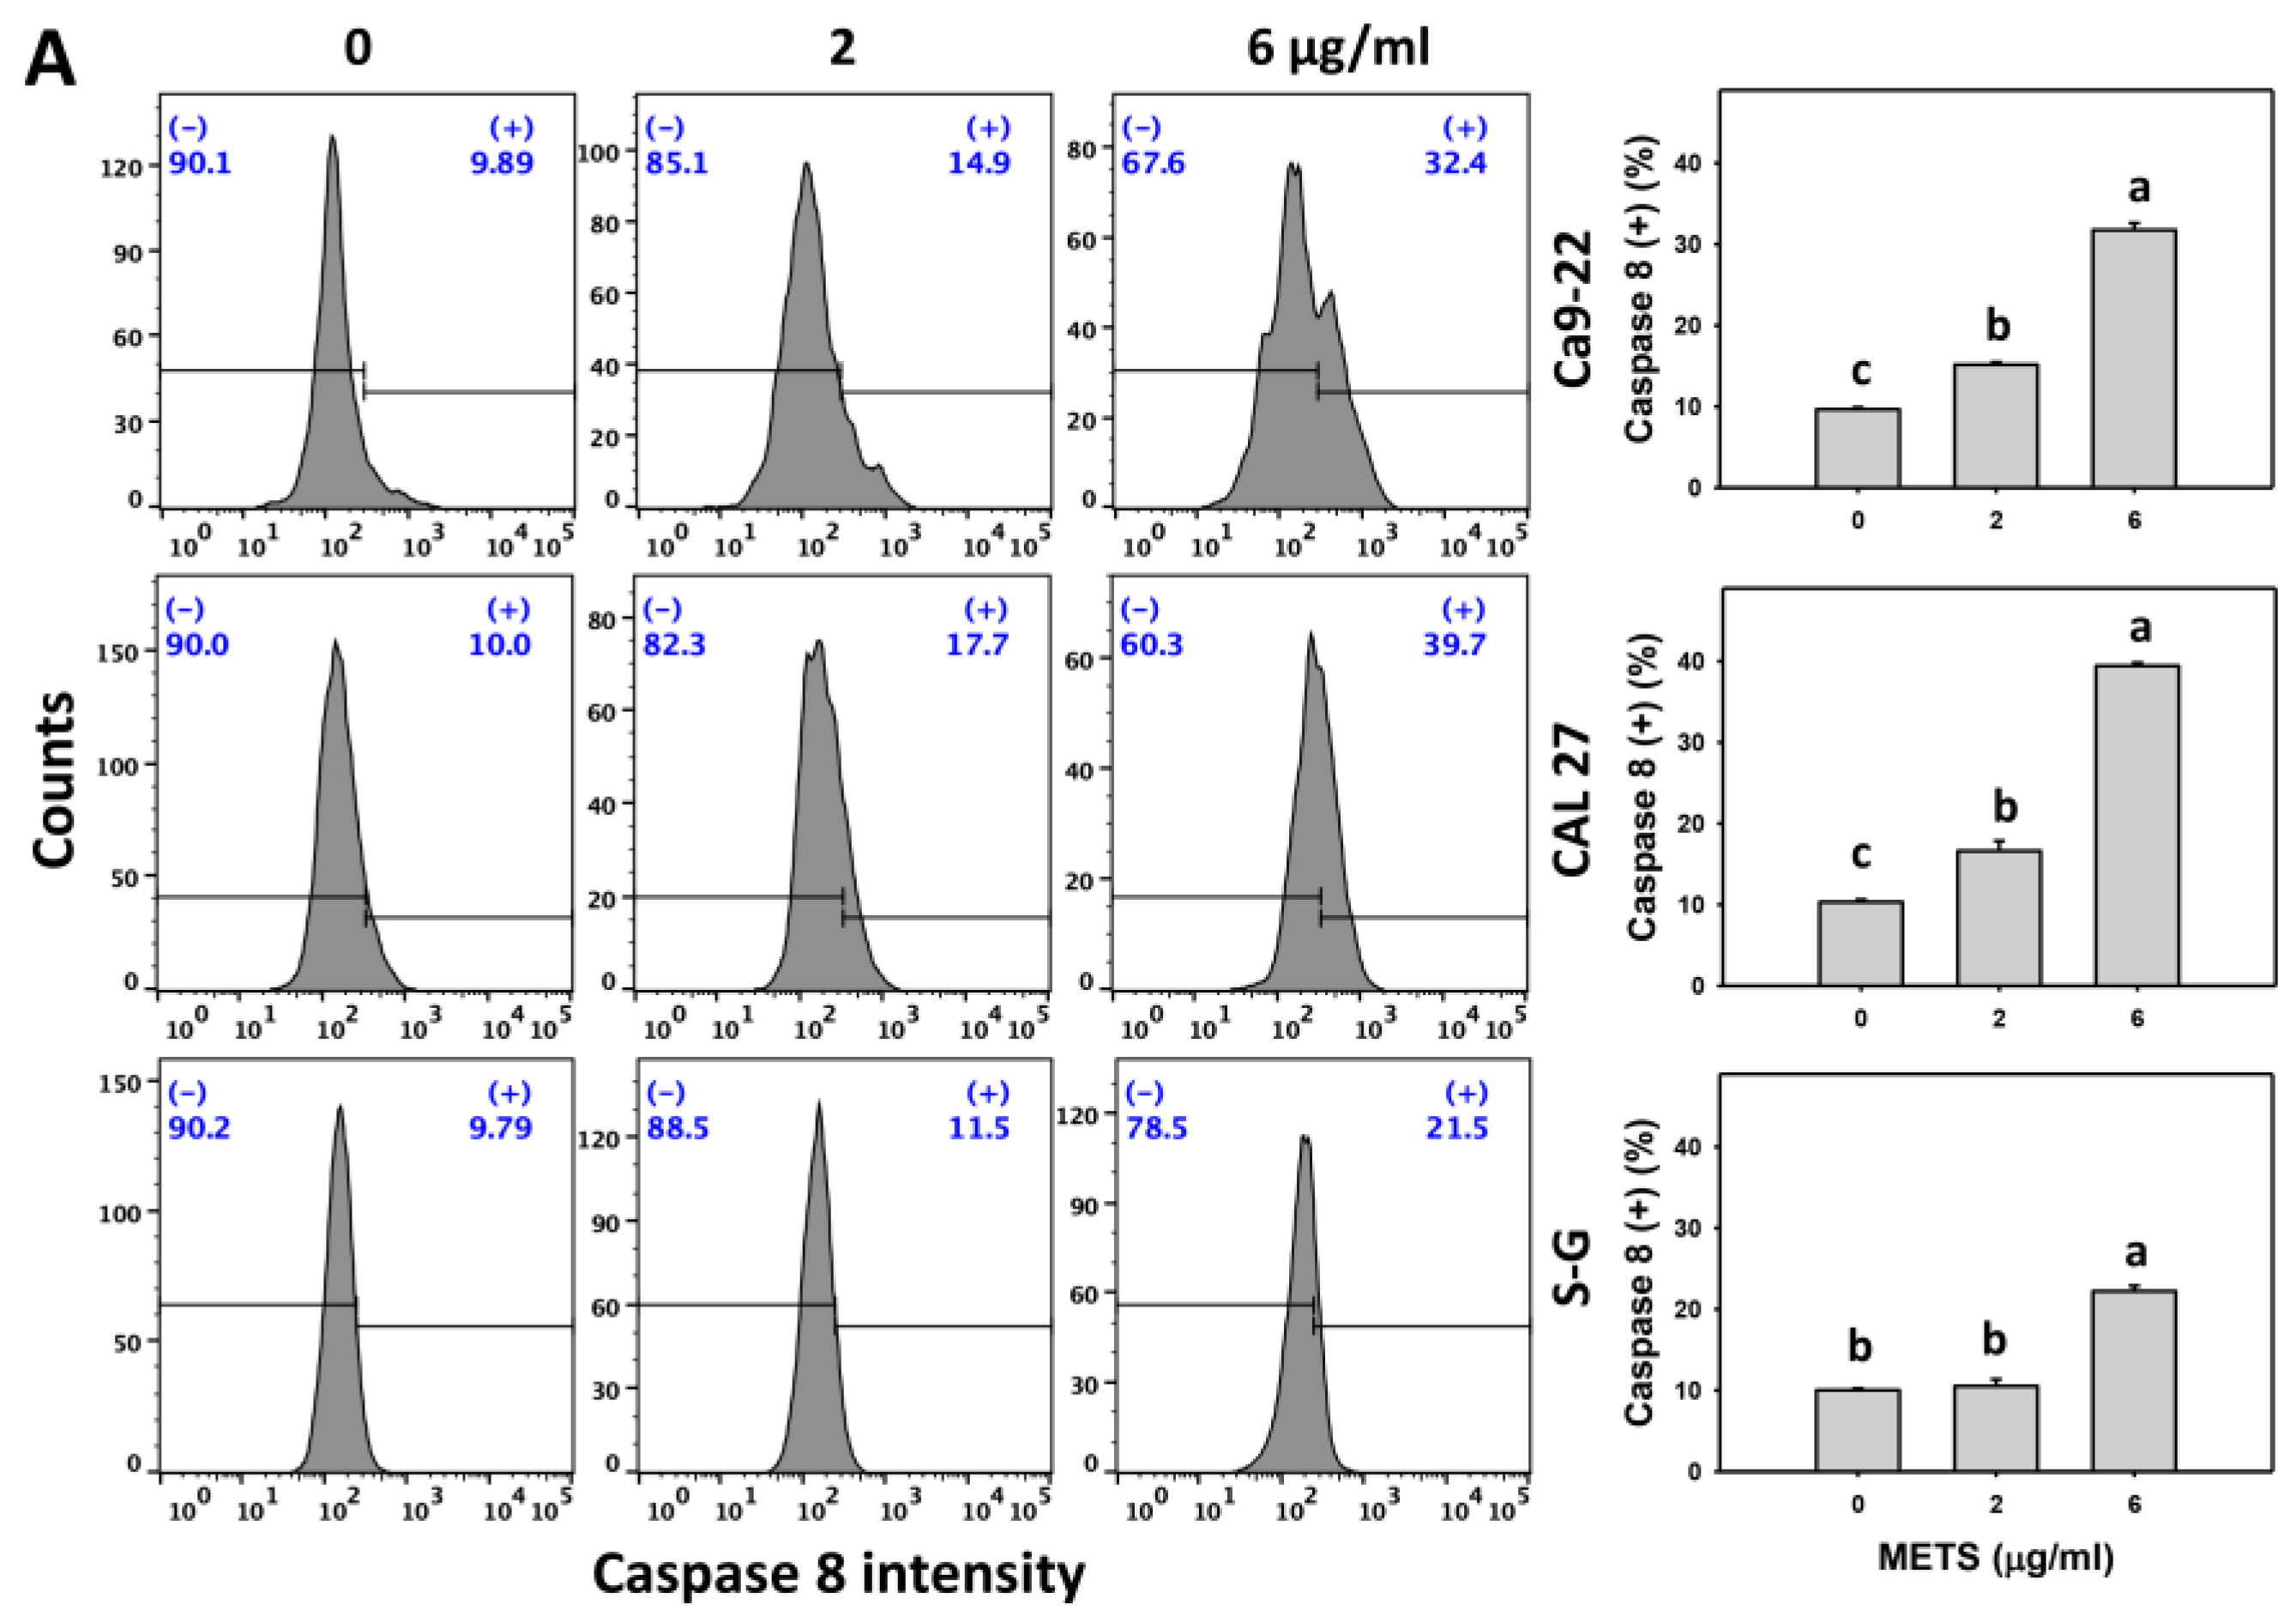
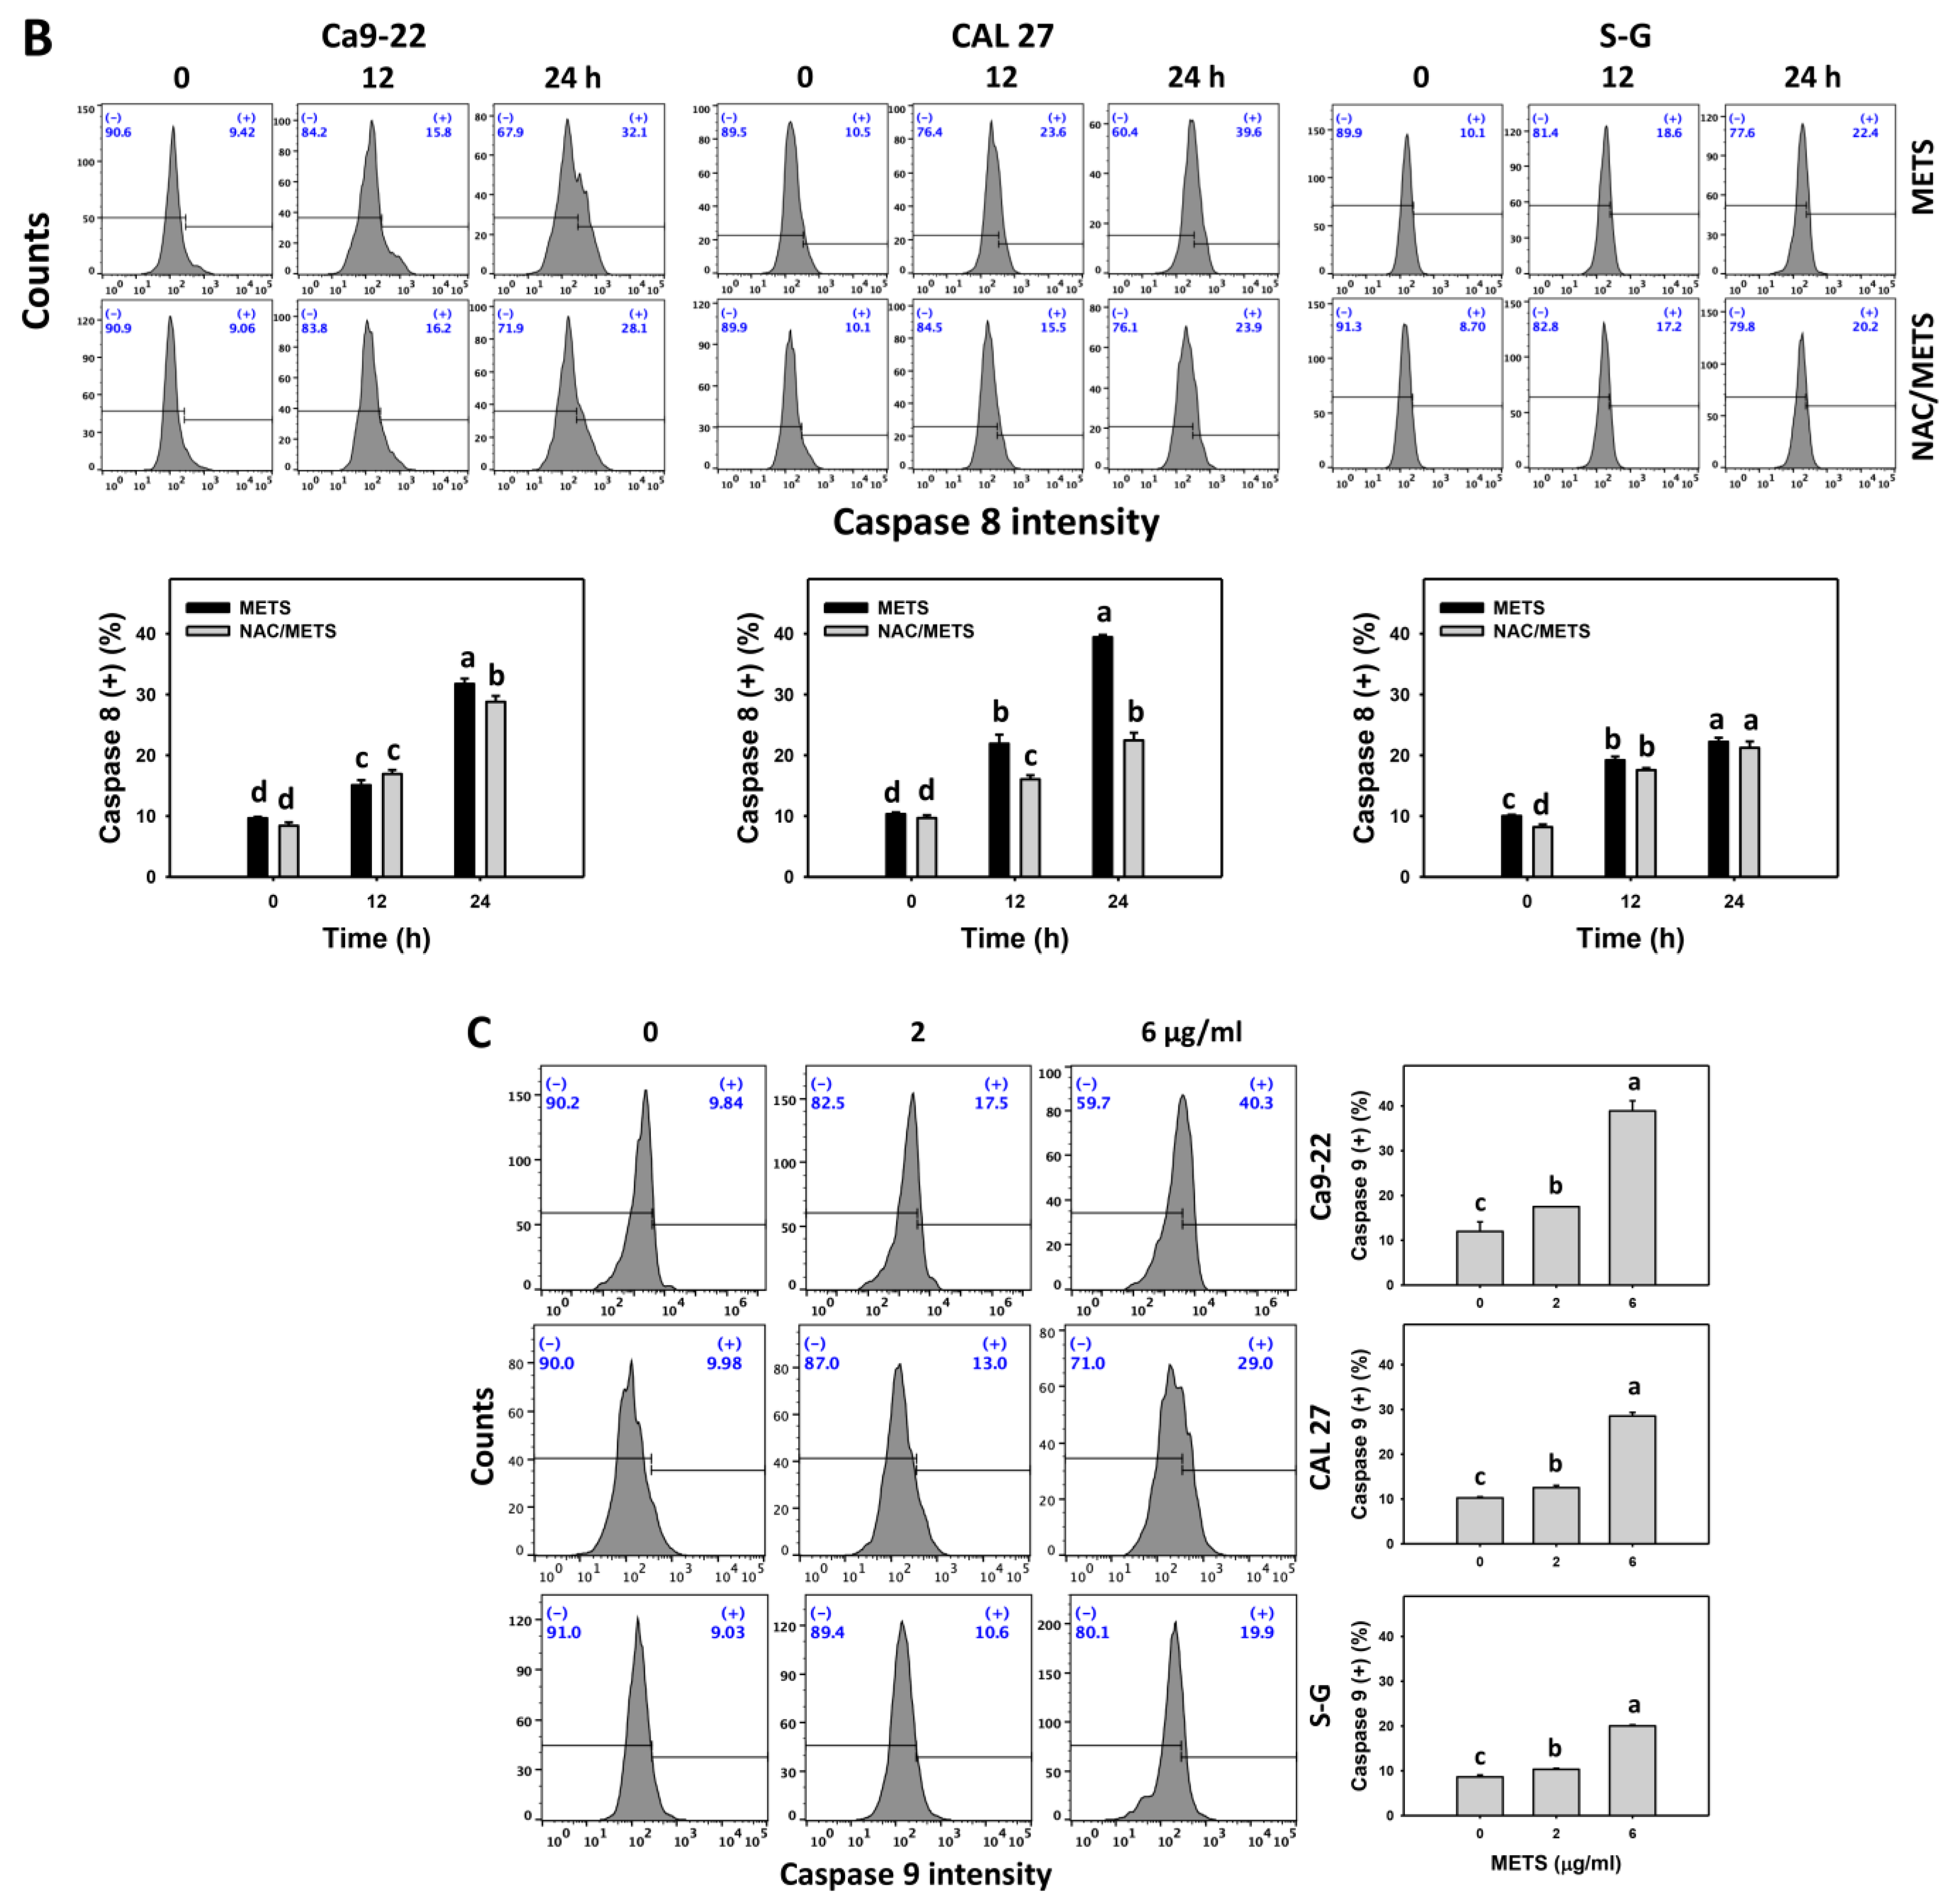
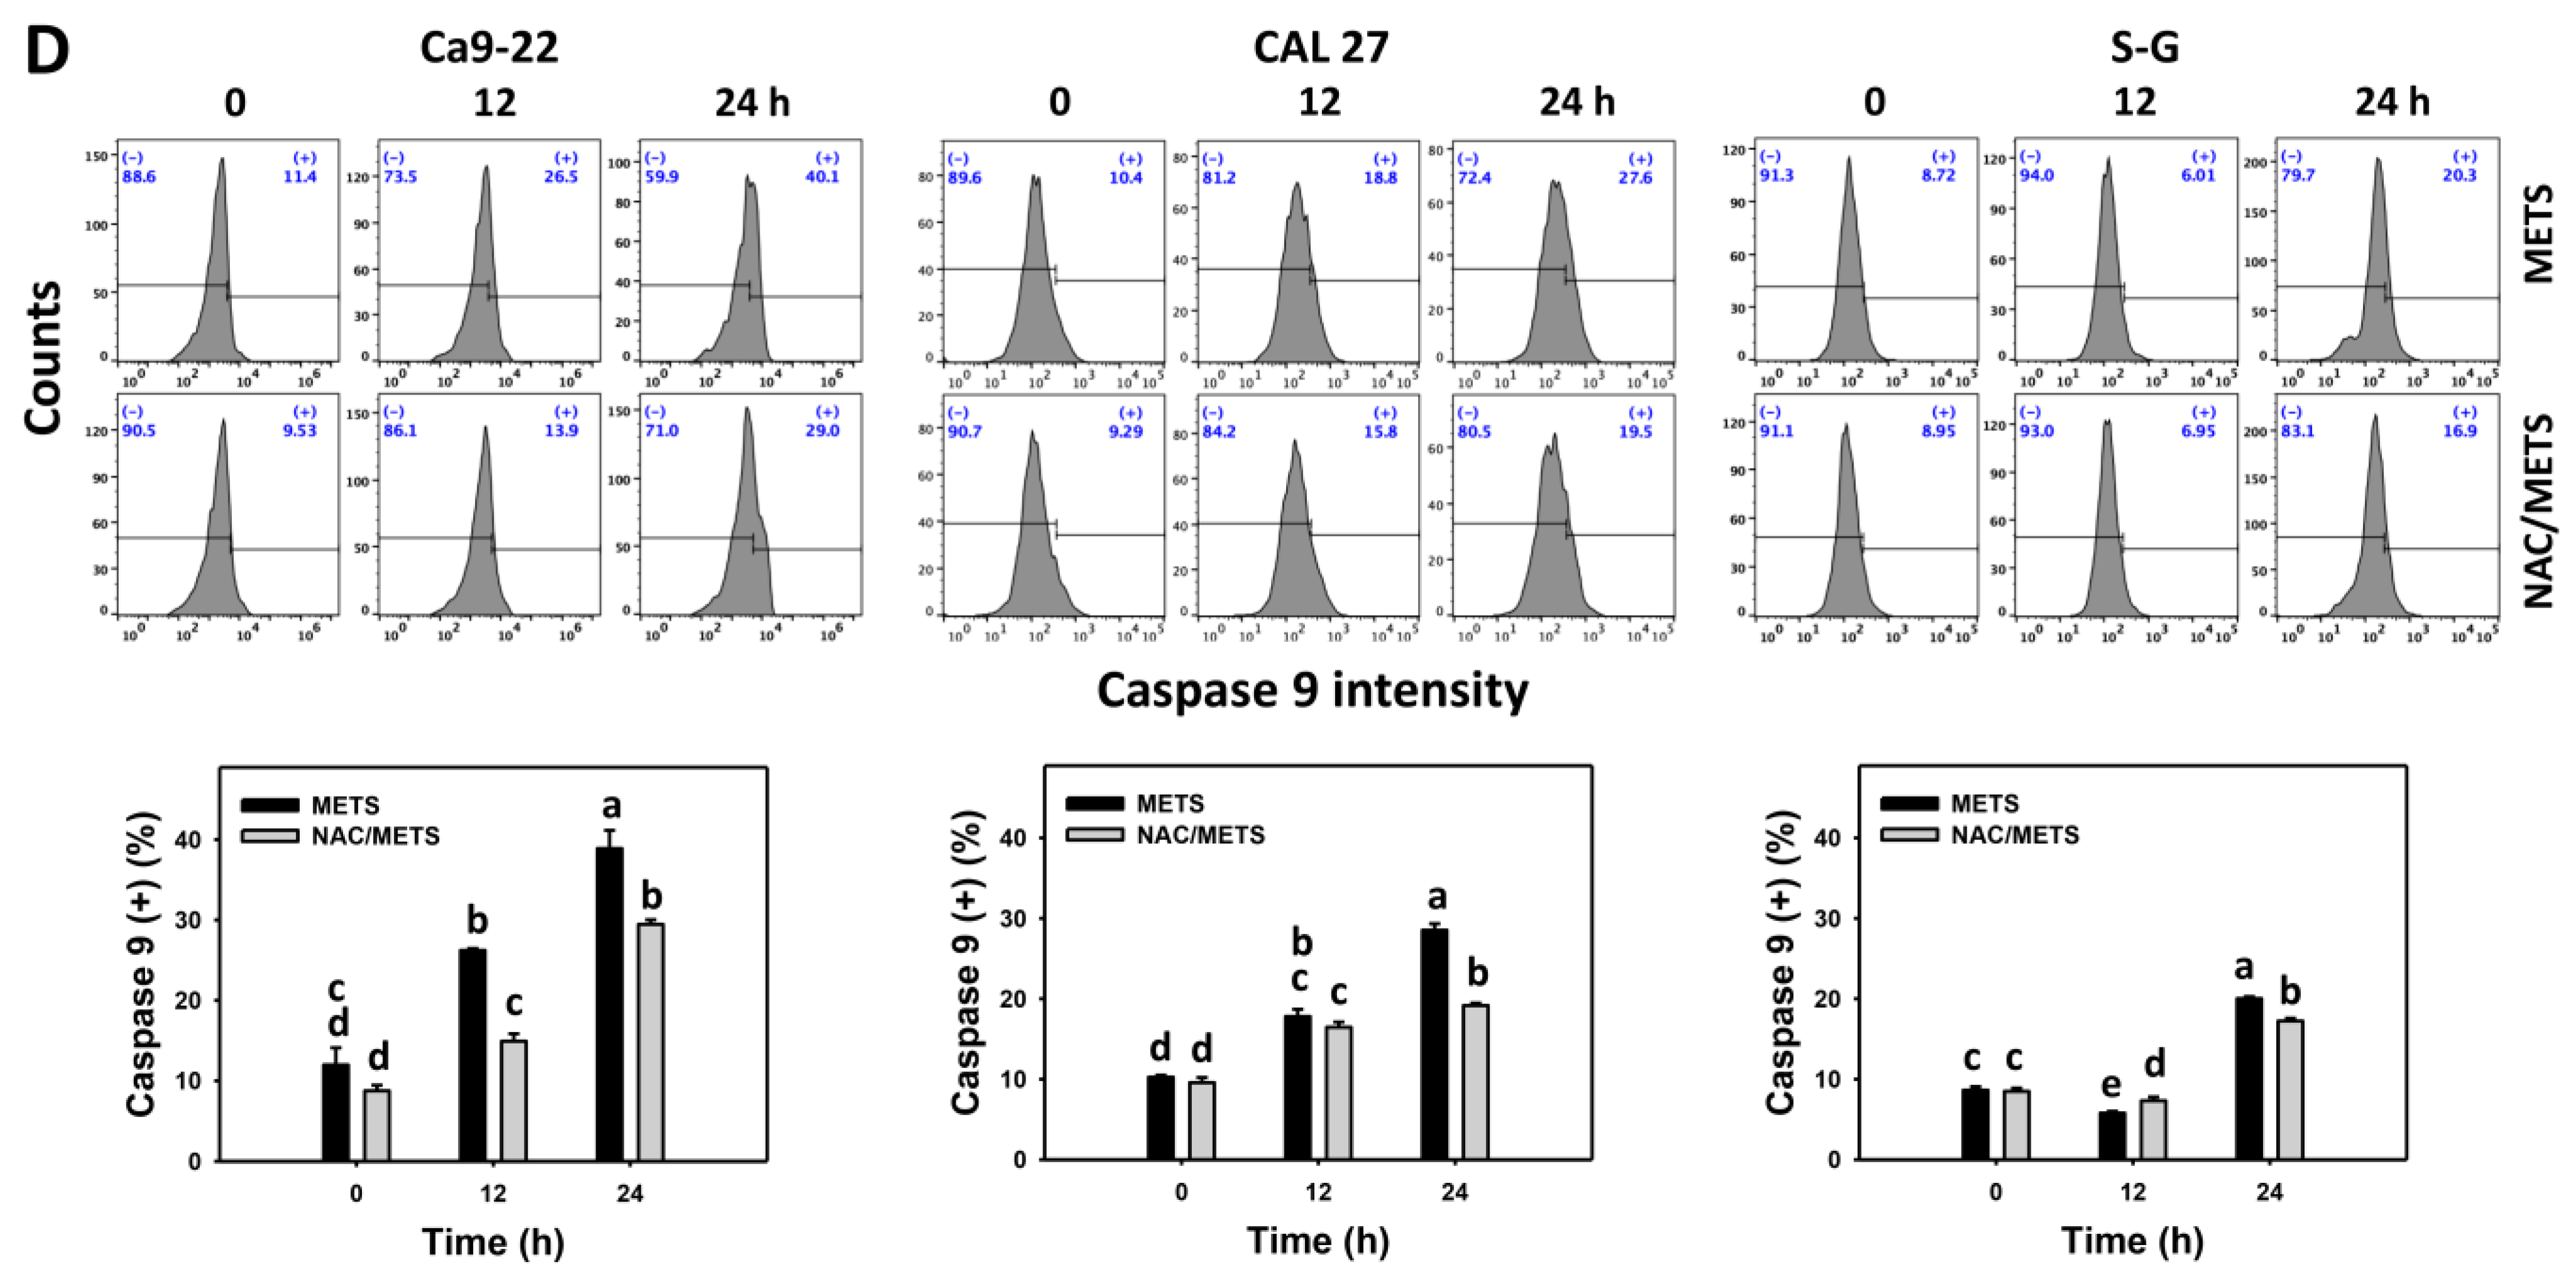
3.6. METS Causes More Caspases 8 and 9 Activations to Oral Cancer Cells than Normal Cells
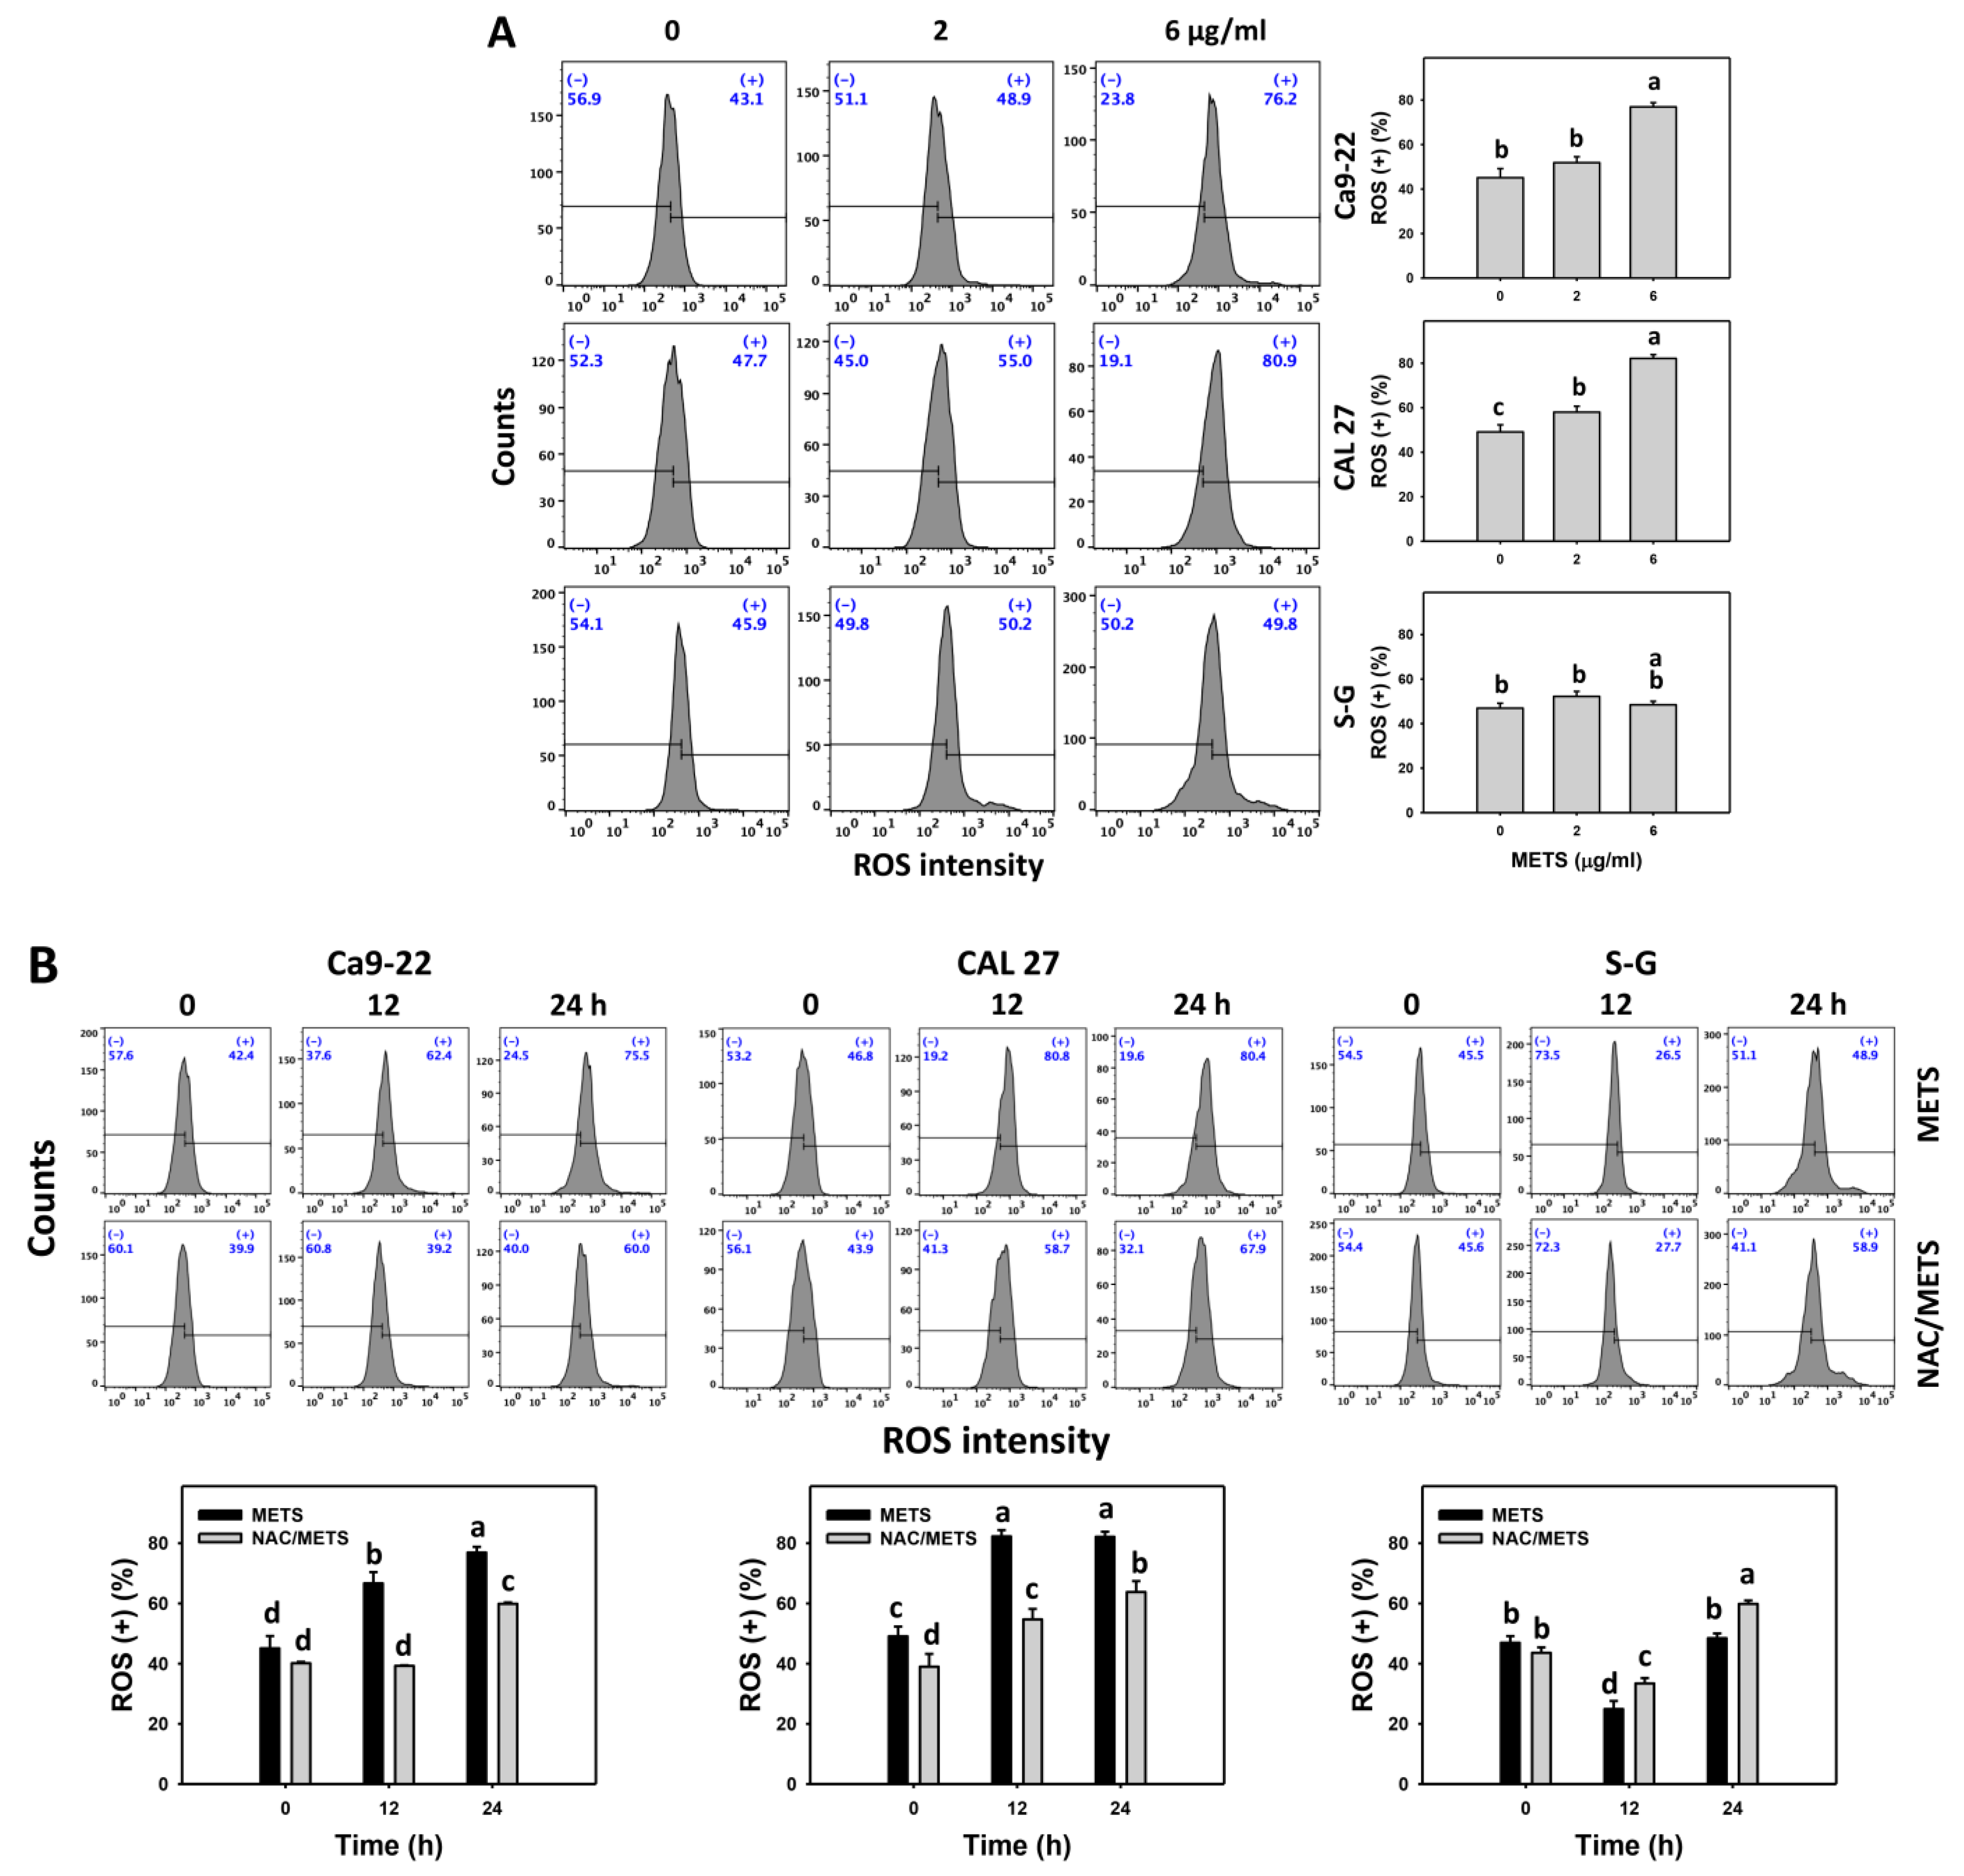
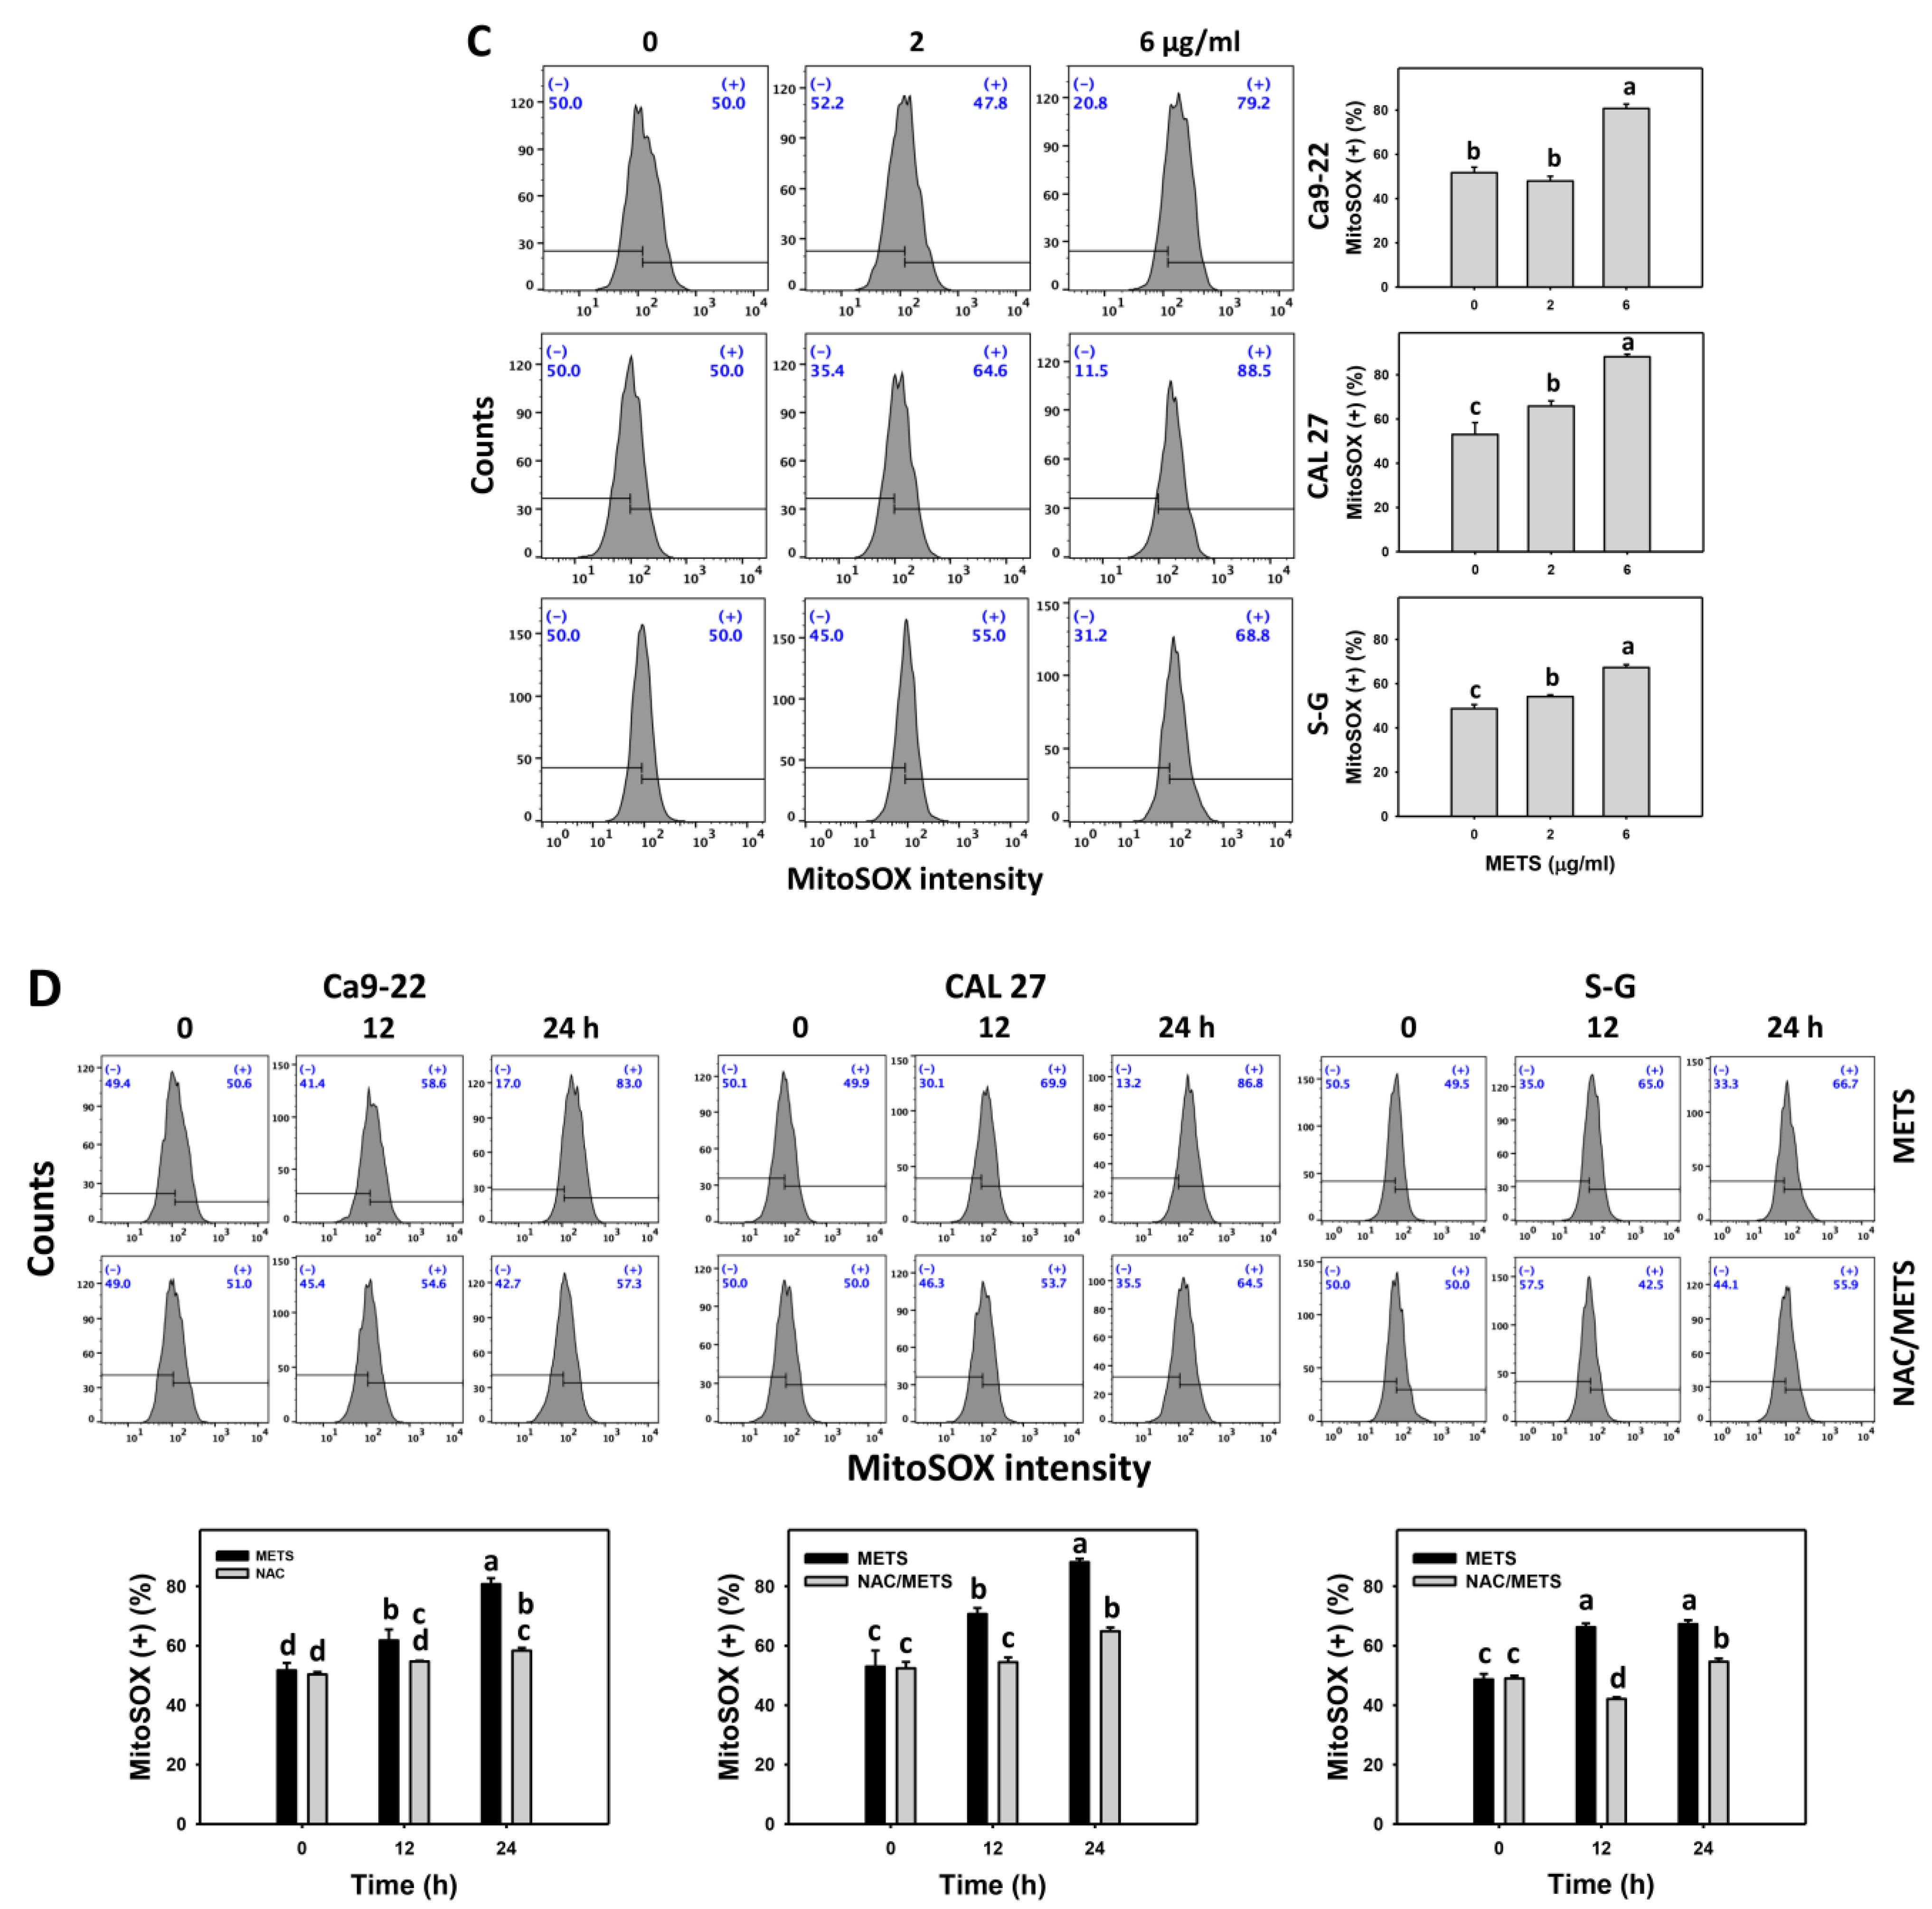
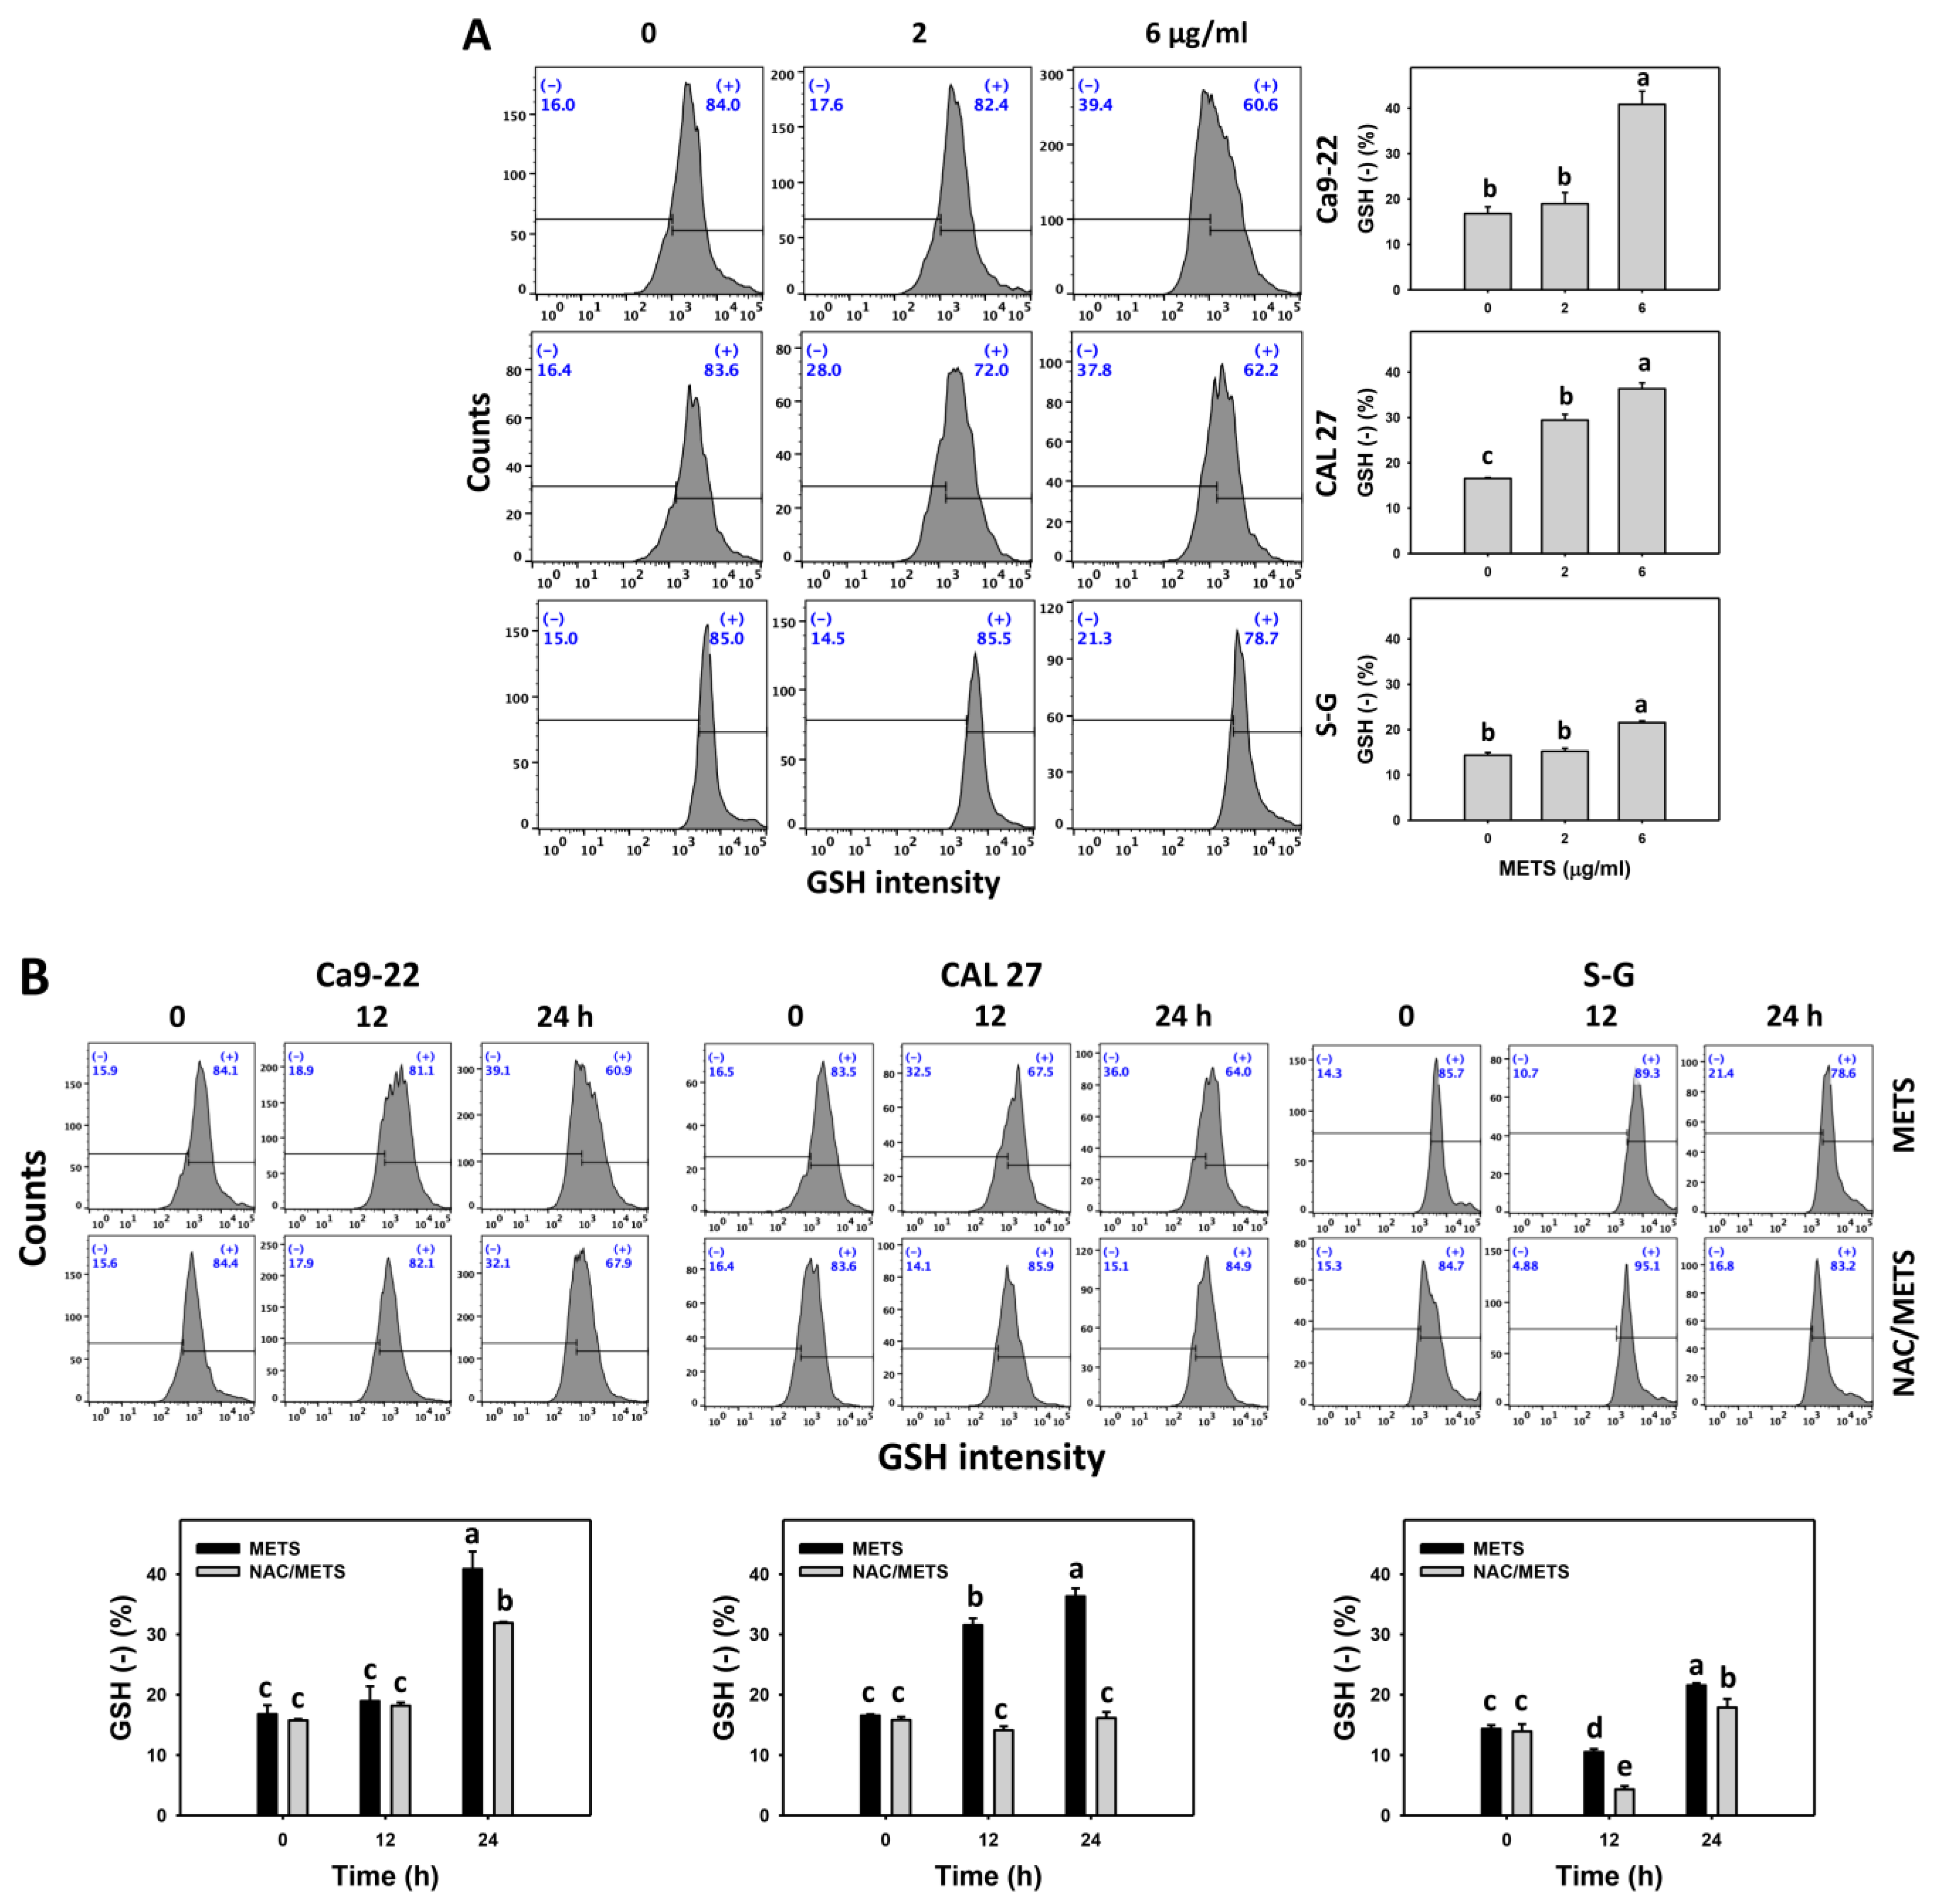
3.7. METS Causes More ROS and MitoSOX but Less GSH Generations to Oral Cancer Cells than Normal Cells
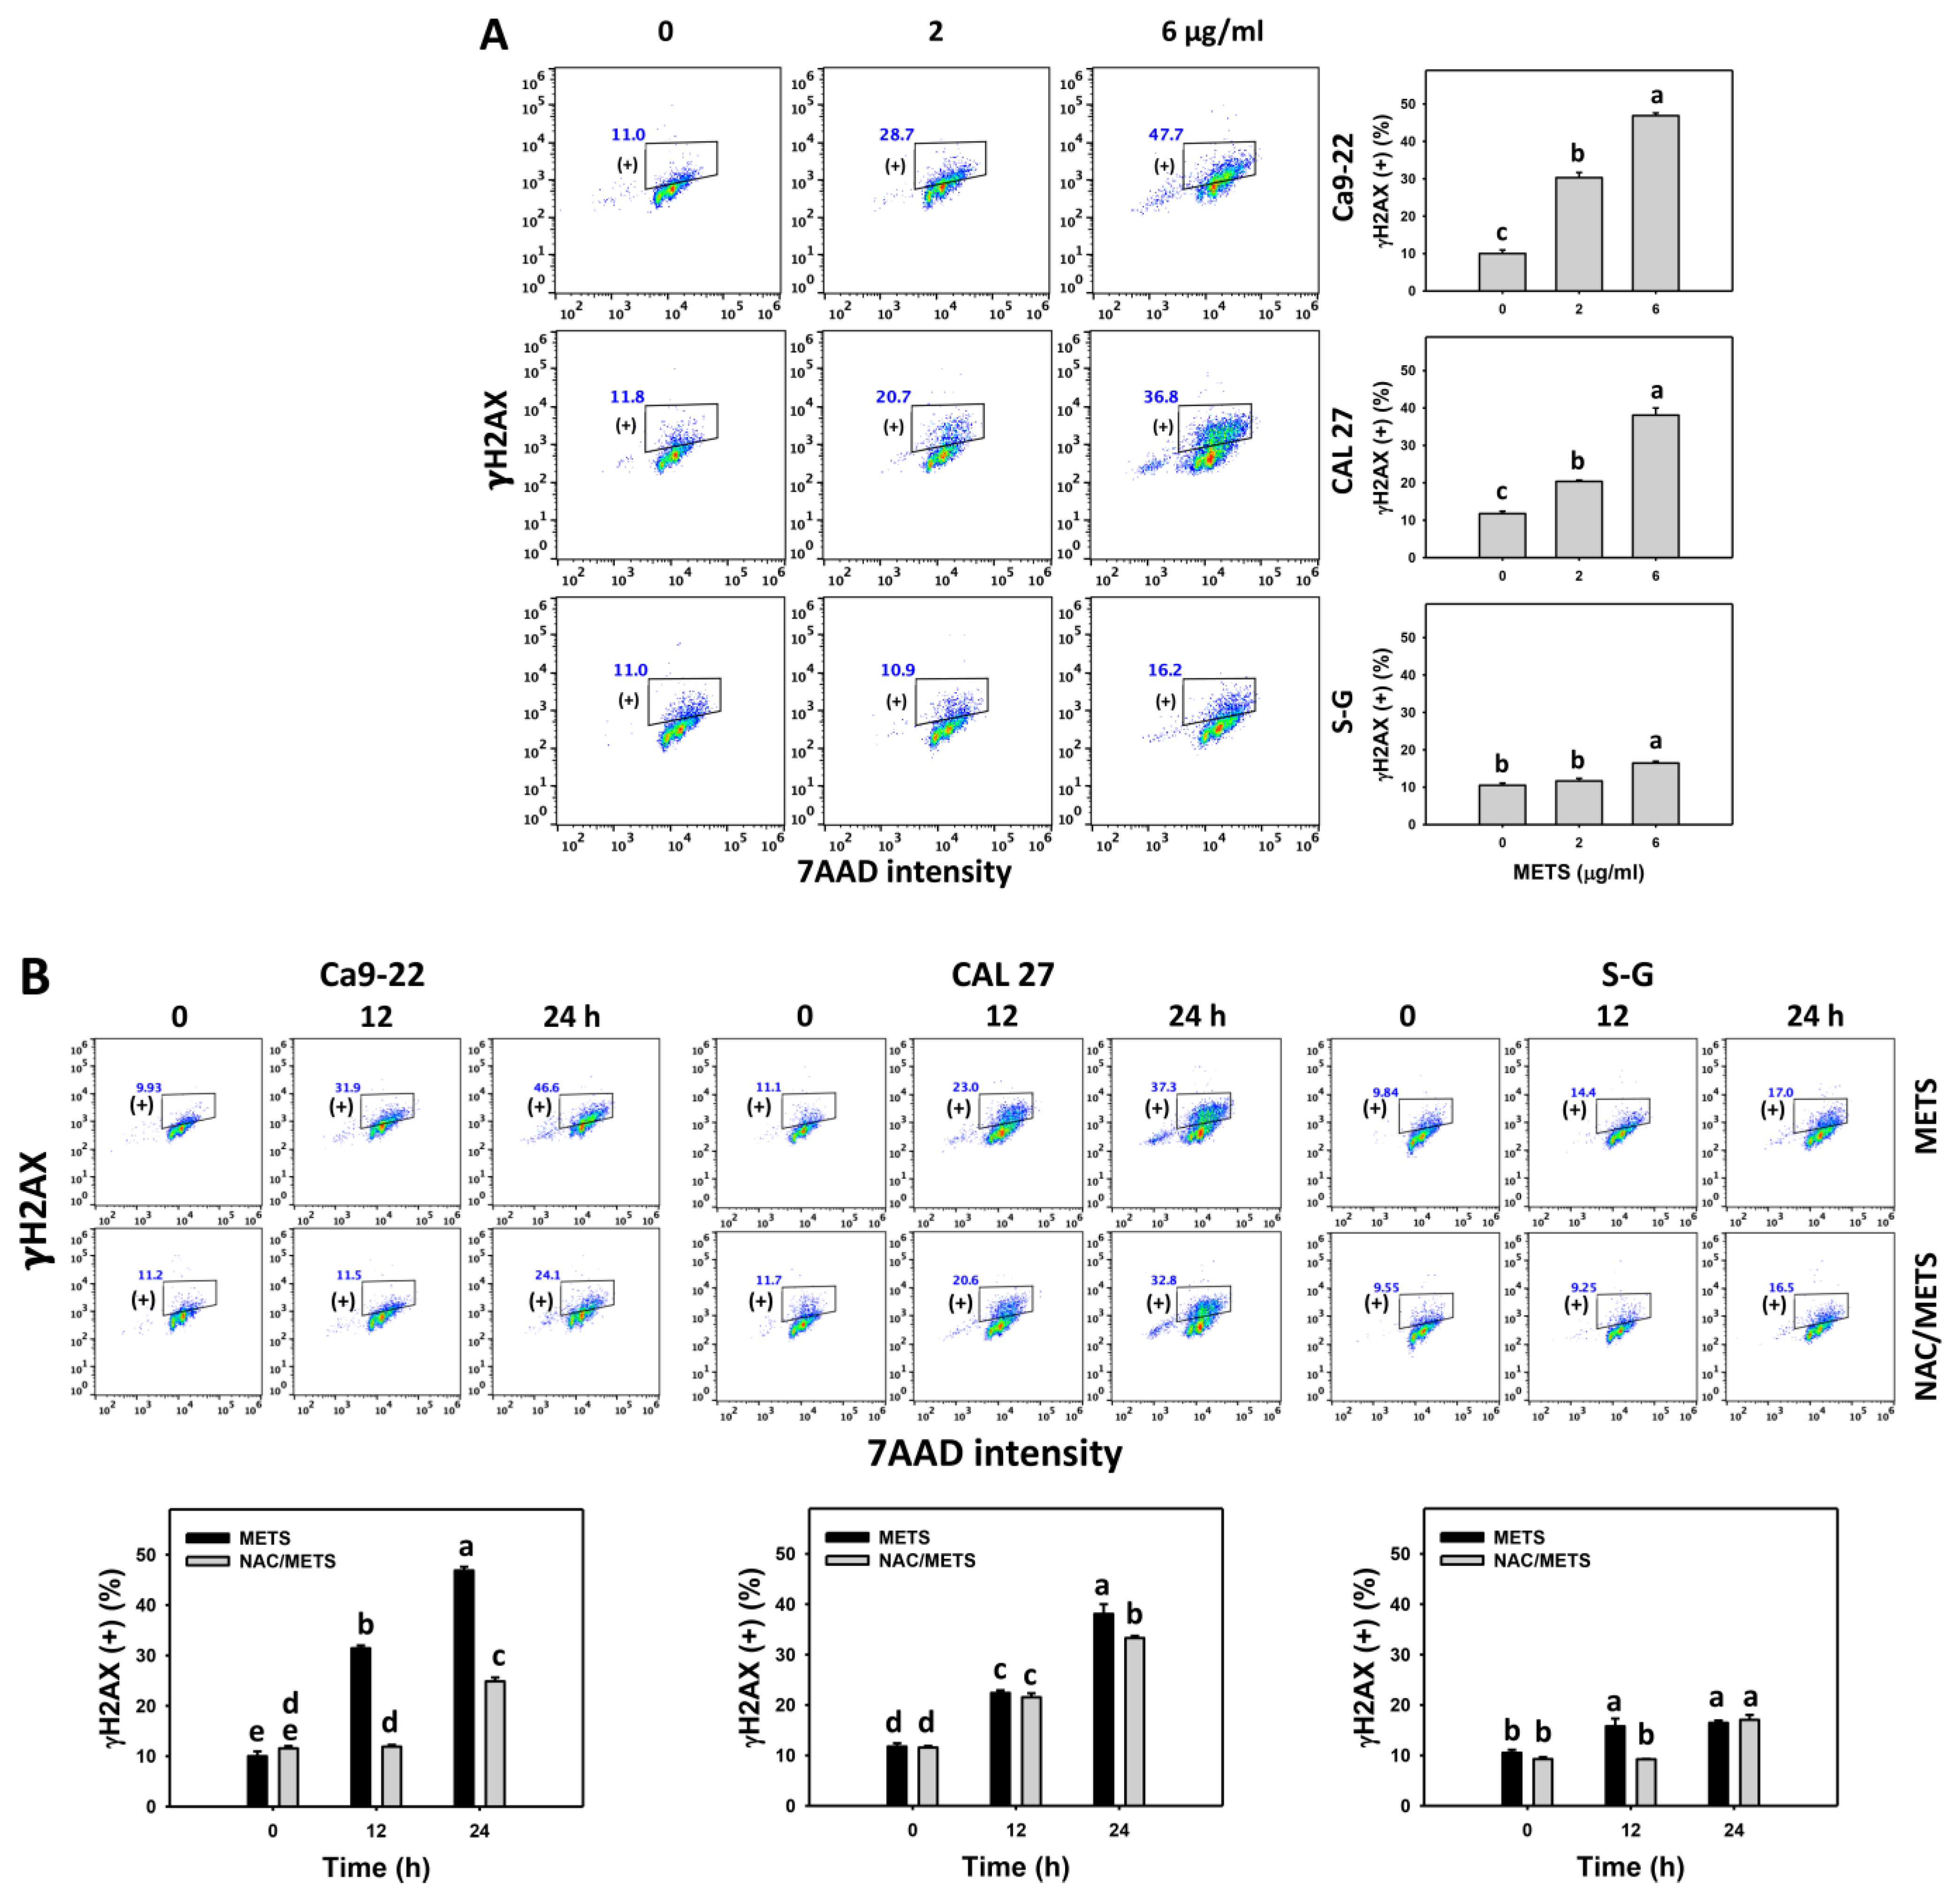
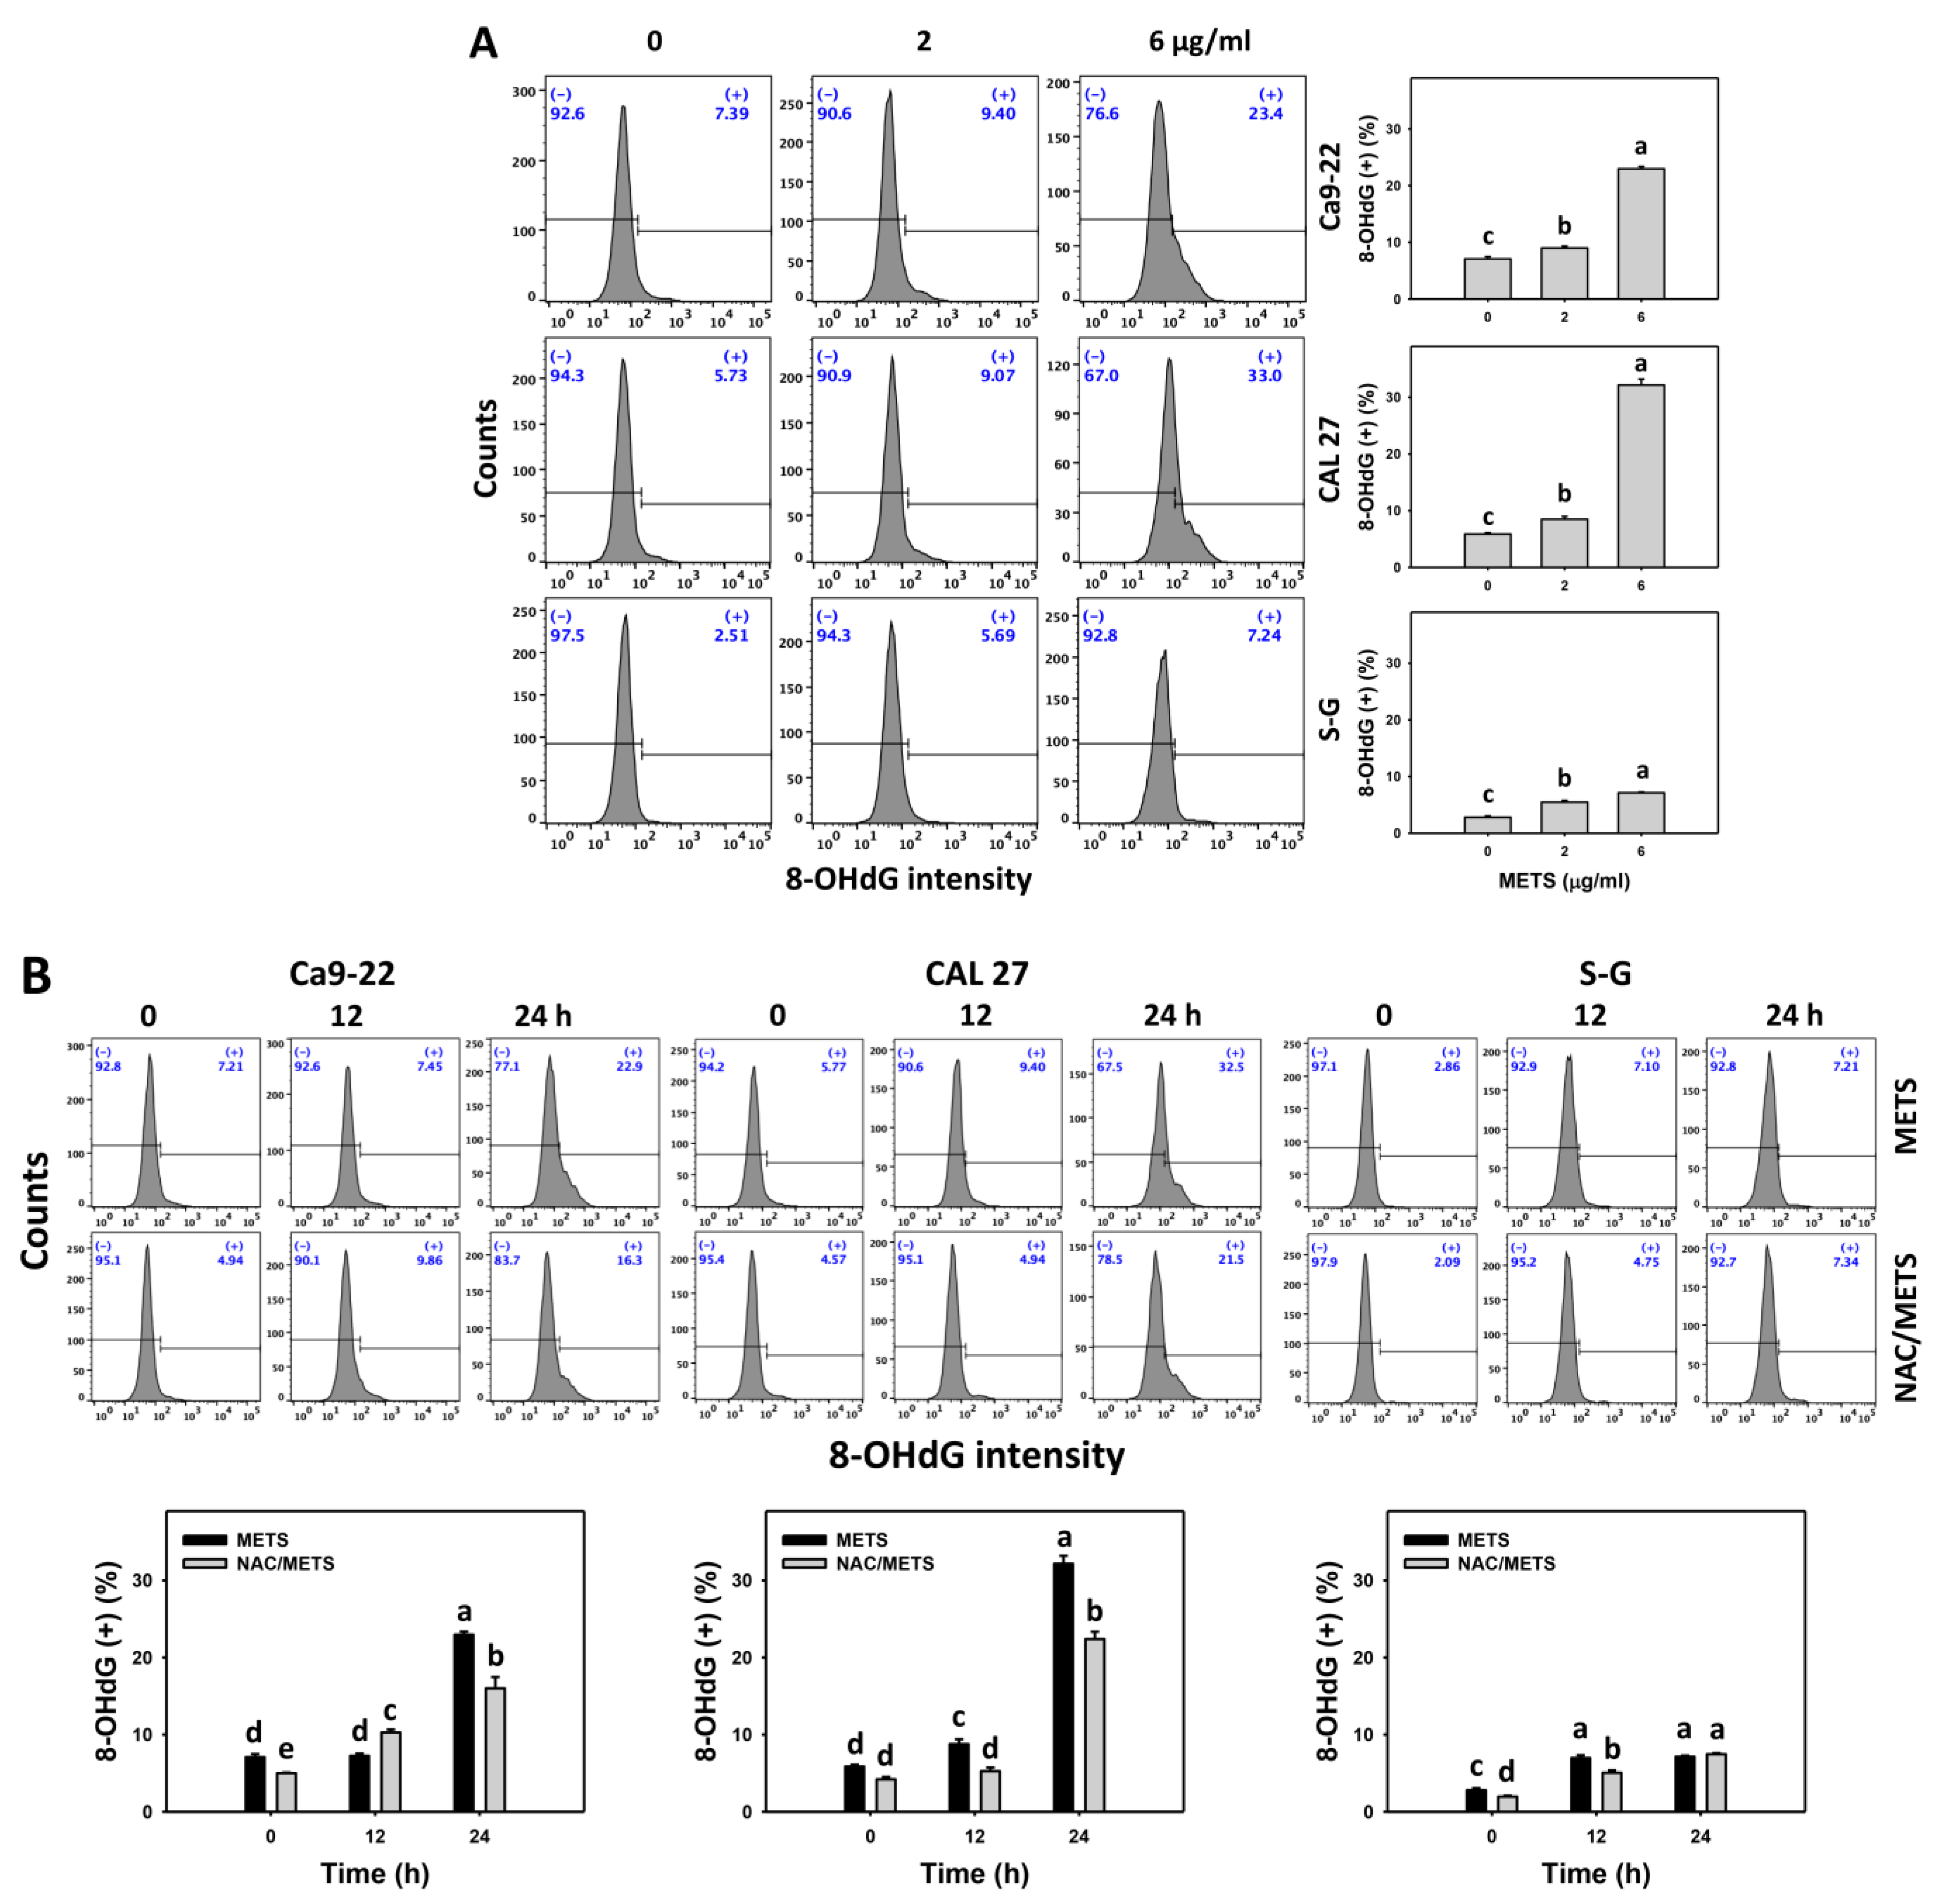
3.8. METS Causes More DNA Damage to Oral Cancer Cells than Normal Cells
4. Discussion
4.1. Comparison of Antiproliferation Effects of Several Marine Sponge Extracts on Cancer Cells
4.2. METS Exhibits Preferential Generation of Oxidative Stress to Oral Cancer Cells
4.3. METS Preferentially Provokes Apoptosis in Oral Cancer Cells
4.4. METS Preferentially Provokes DNA Damage to Oral Cancer Cells
4.5. METS Preferentially Arrests the Cell Cycle in Oral Cancer Cells
5. Conclusions
Author Contributions
Funding
Institutional Review Board Statement
Informed Consent Statement
Data Availability Statement
Acknowledgments
Conflicts of Interest
References
- Petersen, P.E. Oral cancer prevention and control--the approach of the World Health Organization. Oral Oncol. 2009, 45, 454–460. [Google Scholar] [CrossRef] [PubMed]
- Montero, P.H.; Patel, S.G. Cancer of the oral cavity. Surg. Oncol. Clin. North Am. 2015, 24, 491–508. [Google Scholar] [CrossRef]
- Silverman, S., Jr. Oral cancer: Complications of therapy. Oral Surg. Oral Med. Oral Pathol. Oral Radiol. Endod. 1999, 88, 122–126. [Google Scholar] [CrossRef]
- Singh, R.; Sharma, M.; Joshi, P.; Rawat, D.S. Clinical status of anti-cancer agents derived from marine sources. Anticancer. Agents Med. Chem. 2008, 8, 603–617. [Google Scholar] [CrossRef] [PubMed]
- Sithranga Boopathy, N.; Kathiresan, K. Anticancer drugs from marine flora: An overview. J. Oncol. 2010, 2010, 214186. [Google Scholar] [CrossRef] [PubMed]
- Farooqi, A.A.; Fayyaz, S.; Hou, M.F.; Li, K.T.; Tang, J.Y.; Chang, H.W. Reactive oxygen species and autophagy modulation in non-marine drugs and marine drugs. Mar. Drugs 2014, 12, 5408–5424. [Google Scholar] [CrossRef]
- Lee, M.G.; Liu, Y.C.; Lee, Y.L.; El-Shazly, M.; Lai, K.H.; Shih, S.P.; Ke, S.C.; Hong, M.C.; Du, Y.C.; Yang, J.C.; et al. Heteronemin, a marine sesterterpenoid-type metabolite, induces apoptosis in prostate LNcap cells via oxidative and ER stress combined with the inhibition of topoisomerase II and Hsp90. Mar. Drugs 2018, 16, 204. [Google Scholar] [CrossRef] [PubMed]
- Mehbub, M.F.; Lei, J.; Franco, C.; Zhang, W. Marine sponge derived natural products between 2001 and 2010: Trends and opportunities for discovery of bioactives. Mar. Drugs 2014, 12, 4539–4577. [Google Scholar] [CrossRef]
- Mehbub, M.F.; Perkins, M.V.; Zhang, W.; Franco, C.M.M. New marine natural products from sponges (Porifera) of the order Dictyoceratida (2001 to 2012); a promising source for drug discovery, exploration and future prospects. Biotechnol. Adv. 2016, 34, 473–491. [Google Scholar] [CrossRef] [PubMed]
- Calcabrini, C.; Catanzaro, E.; Bishayee, A.; Turrini, E.; Fimognari, C. Marine sponge natural products with anticancer potential: An updated review. Mar. Drugs 2017, 15, 310. [Google Scholar] [CrossRef] [PubMed]
- Varijakzhan, D.; Loh, J.Y.; Yap, W.S.; Yusoff, K.; Seboussi, R.; Lim, S.E.; Lai, K.S.; Chong, C.M. Bioactive compounds from marine sponges: Fundamentals and applications. Mar. Drugs 2021, 19, 246. [Google Scholar] [CrossRef]
- Perdicaris, S.; Vlachogianni, T.; Valavanidis, A. Bioactive natural substances from marine sponges: New developments and prospects for future pharmaceuticals. Nat. Prod. Chem. Res. 2013, 1, 114. [Google Scholar] [CrossRef]
- Warsidah, M.; Sofiana, M.S.J.; Safitri, I.; Sapar, A.; Aritonang, A.B.; Muttalib, Y.; Fadly, D. Protein isolation from sponge Niphates sp. as an antibacterial and antioxidant. Syst. Rev. Pharm. 2020, 11, 518–521. [Google Scholar]
- Kumar, M.S.; Vijayalaxmi, K.; Pal, A. Antiinflamatuvar and antioxidant properties of Spongosorites halichondriodes, a marine sponge. Turk. J. Pharm. Sci. 2014, 11, 285–294. [Google Scholar]
- De Marino, S.; Ummarino, R.; D’Auria, M.V.; Chini, M.G.; Bifulco, G.; Renga, B.; D’Amore, C.; Fiorucci, S.; Debitus, C.; Zampella, A. Theonellasterols and conicasterols from Theonella swinhoei. Novel marine natural ligands for human nuclear receptors. J. Med. Chem. 2011, 54, 3065–3075. [Google Scholar] [CrossRef] [PubMed]
- Oiki, S.; Muramatsu, I.; Matsunaga, S.; Fusetani, N. A channel-forming peptide toxin: Polytheonamide from marine sponge (Theonella swinhoei). Nihon Yakurigaku Zasshi 1997, 110 (Suppl. 1), 195P–198P. [Google Scholar] [CrossRef]
- De Marino, S.; Festa, C.; D’Auria, M.V.; Cresteil, T.; Debitus, C.; Zampella, A. Swinholide J, a potent cytotoxin from the marine sponge Theonella swinhoei. Mar. Drugs 2011, 9, 1133–1141. [Google Scholar] [CrossRef]
- Sinisi, A.; Calcinai, B.; Cerrano, C.; Dien, H.A.; Zampella, A.; D’Amore, C.; Renga, B.; Fiorucci, S.; Taglialatela-Scafati, O. New tridecapeptides of the theonellapeptolide family from the Indonesian sponge Theonella swinhoei. Beilstein J. Org. Chem. 2013, 9, 1643–1651. [Google Scholar] [CrossRef]
- Youssef, D.T.; Shaala, L.A.; Mohamed, G.A.; Badr, J.M.; Bamanie, F.H.; Ibrahim, S.R. Theonellamide G, a potent antifungal and cytotoxic bicyclic glycopeptide from the Red Sea marine sponge Theonella swinhoei. Mar. Drugs 2014, 12, 1911–1923. [Google Scholar] [CrossRef] [PubMed]
- Fukuhara, K.; Takada, K.; Okada, S.; Matsunaga, S. Nazumazoles A-C, cyclic pentapeptides dimerized through a disulfide bond from the marine sponge Theonella swinhoei. Org. Lett. 2015, 17, 2646–2648. [Google Scholar] [CrossRef] [PubMed]
- Issac, M.; Aknin, M.; Gauvin-Bialecki, A.; De Voogd, N.; Ledoux, A.; Frederich, M.; Kashman, Y.; Carmeli, S. Cyclotheonellazoles A-C, potent protease inhibitors from the marine sponge Theonella aff. swinhoei. J. Nat. Prod. 2017, 80, 1110–1116. [Google Scholar] [CrossRef] [PubMed]
- Yang, F.; Li, Y.Y.; Tang, J.; Sun, F.; Lin, H.W. New 4-methylidene sterols from the marine sponge Theonella swinhoei. Fitoterapia 2018, 127, 279–285. [Google Scholar] [CrossRef] [PubMed]
- Lai, K.H.; Peng, B.R.; Su, C.H.; El-Shazly, M.; Sun, Y.L.; Shih, M.C.; Huang, Y.T.; Yen, P.T.; Wang, L.S.; Su, J.H. Anti-proliferative potential of secondary metabolites from the marine sponge Theonella sp.: Moving from correlation toward causation. Metabolites 2021, 11, 532. [Google Scholar] [CrossRef] [PubMed]
- Kumar, M.S.; Adki, K.M. Marine natural products for multi-targeted cancer treatment: A future insight. Biomed. Pharmacother. 2018, 105, 233–245. [Google Scholar] [CrossRef] [PubMed]
- Koeberle, A.; Werz, O. Multi-target approach for natural products in inflammation. Drug Discov. Today 2014, 19, 1871–1882. [Google Scholar] [CrossRef]
- Chamberlin, S.R.; Blucher, A.; Wu, G.; Shinto, L.; Choonoo, G.; Kulesz-Martin, M.; McWeeney, S. Natural product target network reveals potential for cancer combination therapies. Front. Pharmacol. 2019, 10, 557. [Google Scholar] [CrossRef]
- Mioso, R.; Marante, F.J.; Bezerra, R.S.; Borges, F.V.; Santos, B.V.; Laguna, I.H. Cytotoxic compounds derived from marine sponges. A review (2010–2012). Molecules 2017, 22, 208. [Google Scholar] [CrossRef] [PubMed]
- Kasten, F.H.; Pineda, L.F.; Schneider, P.E.; Rawls, H.R.; Foster, T.A. Biocompatibility testing of an experimental fluoride releasing resin using human gingival epithelial cells in vitro. Vitro Cell Dev. Biol. 1989, 25, 57–62. [Google Scholar] [CrossRef]
- Kasten, F.H.; Soileau, K.; Meffert, R.M. Quantitative evaluation of human gingival epithelial cell attachment to implant surfaces in vitro. Int. J. Periodontics Restor. Dent. 1990, 10, 68–79. [Google Scholar]
- Hsieh, P.L.; Liao, Y.W.; Hsieh, C.W.; Chen, P.N.; Yu, C.C. Soy isoflavone genistein impedes cancer stemness and mesenchymal transition in head and neck cancer through activating miR-34a/RTCB axis. Nutrients 2020, 12, 1924. [Google Scholar] [CrossRef] [PubMed]
- Wang, H.R.; Tang, J.Y.; Wang, Y.Y.; Farooqi, A.A.; Yen, C.Y.; Yuan, S.F.; Huang, H.W.; Chang, H.W. Manoalide preferentially provides antiproliferation of oral cancer cells by oxidative stress-mediated apoptosis and DNA damage. Cancers 2019, 11, 1303. [Google Scholar] [CrossRef]
- Hung, J.H.; Chen, C.Y.; Omar, H.A.; Huang, K.Y.; Tsao, C.C.; Chiu, C.C.; Chen, Y.L.; Chen, P.H.; Teng, Y.N. Reactive oxygen species mediate Terbufos-induced apoptosis in mouse testicular cell lines via the modulation of cell cycle and pro-apoptotic proteins. Environ. Toxicol. 2016, 31, 1888–1898. [Google Scholar] [CrossRef]
- Huang, C.H.; Yeh, J.M.; Chan, W.H. Hazardous impacts of silver nanoparticles on mouse oocyte maturation and fertilization and fetal development through induction of apoptotic processes. Environ. Toxicol. 2018, 33, 1039–1049. [Google Scholar] [CrossRef] [PubMed]
- Wu, C.F.; Lee, M.G.; El-Shazly, M.; Lai, K.H.; Ke, S.C.; Su, C.W.; Shih, S.P.; Sung, P.J.; Hong, M.C.; Wen, Z.H.; et al. Isoaaptamine induces T-47D cells apoptosis and autophagy via oxidative stress. Mar. Drugs 2018, 16, 18. [Google Scholar] [CrossRef] [PubMed]
- Yeh, C.C.; Tseng, C.N.; Yang, J.I.; Huang, H.W.; Fang, Y.; Tang, J.Y.; Chang, F.R.; Chang, H.W. Antiproliferation and induction of apoptosis in Ca9-22 oral cancer cells by ethanolic extract of Gracilaria tenuistipitata. Molecules 2012, 17, 10916–10927. [Google Scholar] [CrossRef] [PubMed]
- Vignon, C.; Debeissat, C.; Georget, M.T.; Bouscary, D.; Gyan, E.; Rosset, P.; Herault, O. Flow cytometric quantification of all phases of the cell cycle and apoptosis in a two-color fluorescence plot. PLoS ONE 2013, 8, e68425. [Google Scholar] [CrossRef]
- Fan, H.C.; Hsieh, Y.C.; Li, L.H.; Chang, C.C.; Janouskova, K.; Ramani, M.V.; Subbaraju, G.V.; Cheng, K.T.; Chang, C.C. Dehydroxyhispolon methyl ether, a hispolon derivative, inhibits WNT/beta-catenin signaling to elicit human colorectal carcinoma cell apoptosis. Int. J. Mol. Sci. 2020, 21, 8839. [Google Scholar] [CrossRef]
- Liu, W.; Lin, L.C.; Wang, P.J.; Chen, Y.N.; Wang, S.C.; Chuang, Y.T.; Tsai, I.H.; Yu, S.Y.; Chang, F.R.; Cheng, Y.B.; et al. Nepenthes ethyl acetate extract provides oxidative stress-dependent anti-leukemia effects. Antioxidants 2021, 10, 1410. [Google Scholar] [CrossRef]
- Lin, C.H.; Chan, H.S.; Tsay, H.S.; Funayama, S.; Kuo, C.L.; Chung, J.G. Ethyl acetate fraction from methanol extraction of Vitis thunbergii var. taiwaniana induced G0/G1 phase arrest via inhibition of cyclins D and E and induction of apoptosis through caspase-dependent and -independent pathways in human prostate carcinoma DU145 cells. Environ. Toxicol. 2018, 33, 41–51. [Google Scholar]
- Liu, S.L.; Yang, K.H.; Yang, C.W.; Lee, M.Y.; Chuang, Y.T.; Chen, Y.N.; Chang, F.R.; Chen, C.Y.; Chang, H.W. Burmannic acid inhibits proliferation and induces oxidative stress response of oral cancer cells. Antioxidants 2021, 10, 1588. [Google Scholar] [CrossRef]
- Shiau, J.P.; Chuang, Y.T.; Yang, K.H.; Chang, F.R.; Sheu, J.H.; Hou, M.F.; Jeng, J.H.; Tang, J.Y.; Chang, H.W. Brown algae-derived fucoidan exerts oxidative stress-dependent antiproliferation on oral cancer cells. Antioxidants 2022, 11, 841. [Google Scholar] [CrossRef] [PubMed]
- Chiu, C.C.; Huang, J.W.; Chang, F.R.; Huang, K.J.; Huang, H.M.; Huang, H.W.; Chou, C.K.; Wu, Y.C.; Chang, H.W. Golden berry-derived 4beta-hydroxywithanolide E for selectively killing oral cancer cells by generating ROS, DNA damage, and apoptotic pathways. PLoS ONE 2013, 8, e64739. [Google Scholar] [CrossRef] [PubMed]
- El-Damhougy, K.; El-Naggar, H.A.; Ibrahim, H.; Bashar, M.A.; Abou-Senna, F.M. Biological activities of some marine sponge extracts from Aqaba Gulf, Red Sea, Egypt. Int. J. Fish. Aquat. Stud. 2017, 5, 652–659. [Google Scholar]
- Choi, C.; Son, A.; Lee, H.S.; Lee, Y.J.; Park, H.C. Radiosensitization by marine sponge Agelas sp. extracts in hepatocellular carcinoma cells with autophagy induction. Sci. Rep. 2018, 8, 6317. [Google Scholar] [CrossRef] [PubMed]
- Ciftci, H.I.; Can, M.; Ellakwa, D.E.; Suner, S.C.; Ibrahim, M.A.; Oral, A.; Sekeroglu, N.; Ozalp, B.; Otsuka, M.; Fujita, M.; et al. Anticancer activity of Turkish marine extracts: A purple sponge extract induces apoptosis with multitarget kinase inhibition activity. Invest New Drugs 2020, 38, 1326–1333. [Google Scholar] [CrossRef]
- Lin, A. Radiation therapy for oral cavity and oropharyngeal cancers. Dent. Clin. North Am. 2018, 62, 99–109. [Google Scholar] [CrossRef]
- Hartner, L. Chemotherapy for oral cancer. Dent. Clin. North Am. 2018, 62, 87–97. [Google Scholar] [CrossRef]
- Acharya, A.; Das, I.; Chandhok, D.; Saha, T. Redox regulation in cancer: A double-edged sword with therapeutic potential. Oxid. Med. Cell Longev. 2010, 3, 23–34. [Google Scholar] [CrossRef]
- Tang, J.Y.; Ou-Yang, F.; Hou, M.F.; Huang, H.W.; Wang, H.R.; Li, K.T.; Fayyaz, S.; Shu, C.W.; Chang, H.W. Oxidative stress-modulating drugs have preferential anticancer effects—Involving the regulation of apoptosis, DNA damage, endoplasmic reticulum stress, autophagy, metabolism, and migration. Semin. Cancer Biol. 2019, 58, 109–117. [Google Scholar] [CrossRef]
- Gorrini, C.; Harris, I.S.; Mak, T.W. Modulation of oxidative stress as an anticancer strategy. Nat. Rev. Drug Discov. 2013, 12, 931–947. [Google Scholar] [CrossRef]
- Kim, S.J.; Kim, H.S.; Seo, Y.R. Understanding of ROS-inducing strategy in anticancer therapy. Oxid Med. Cell Longev. 2019, 2019, 5381692. [Google Scholar] [CrossRef] [PubMed]
- Sies, H. Oxidative stress: Eustress and distress in redox homeostasis. In Stress: Physiology, Biochemistry, and Pathology; Elsevier: Amsterdam, The Netherlands, 2019; pp. 153–163. [Google Scholar]
- Ahmad, T.; Suzuki, Y.J. Juglone in oxidative stress and cell signaling. Antioxidants 2019, 8, 91. [Google Scholar] [CrossRef] [PubMed]
- Li, R.; Huang, C.; Ho, J.C.H.; Leung, C.C.T.; Kong, R.Y.C.; Li, Y.; Liang, X.; Lai, K.P.; Tse, W.K.F. The use of glutathione to reduce oxidative stress status and its potential for modifying the extracellular matrix organization in cleft lip. Free Radic. Biol. Med. 2021, 164, 130–138. [Google Scholar] [CrossRef] [PubMed]
- Abboud, M.M.; Al Awaida, W.; Alkhateeb, H.H.; Abu-Ayyad, A.N. Antitumor action of amygdalin on human breast cancer cells by selective sensitization to oxidative stress. Nutr. Cancer 2019, 71, 483–490. [Google Scholar] [CrossRef]
- Zou, Z.; Chang, H.; Li, H.; Wang, S. Induction of reactive oxygen species: An emerging approach for cancer therapy. Apoptosis 2017, 22, 1321–1335. [Google Scholar] [CrossRef]
- Rady, H.M.; Hassan, A.Z.; Salem, S.M.; Mohamed, T.K.; Esmaiel, N.N.; Ez-El-Arab, M.A.; Ibrahim, M.A.; Fouda, F.K. Induction of apoptosis and cell cycle arrest by Negombata magnifica sponge in hepatocellular carcinoma. Med. Chem. Res. 2016, 25, 456–465. [Google Scholar] [CrossRef]
- Annamalai, P.; Thayman, M.; Rajan, S.; Raman, L.S.; Ramasubbu, S.; Perumal, P. Ethyl acetate extract from marine sponge Hyattella cribriformis exhibit potent anticancer activity by promoting tubulin polymerization as evidenced mitotic arrest and induction of apoptosis. Pharmacogn. Mag. 2015, 11, 345. [Google Scholar]
- Van Stuijvenberg, J.; Proksch, P.; Fritz, G. Targeting the DNA damage response (DDR) by natural compounds. Bioorg. Med. Chem. 2020, 28, 115279. [Google Scholar] [CrossRef]
- Arfin, S.; Jha, N.K.; Jha, S.K.; Kesari, K.K.; Ruokolainen, J.; Roychoudhury, S.; Rathi, B.; Kumar, D. Oxidative stress in cancer cell metabolism. Antioxidants 2021, 10, 642. [Google Scholar] [CrossRef]
- Ottinger, S.; Kloppel, A.; Rausch, V.; Liu, L.; Kallifatidis, G.; Gross, W.; Gebhard, M.M.; Brummer, F.; Herr, I. Targeting of pancreatic and prostate cancer stem cell characteristics by Crambe crambe marine sponge extract. Int. J. Cancer 2012, 130, 1671–1681. [Google Scholar] [CrossRef]


Publisher’s Note: MDPI stays neutral with regard to jurisdictional claims in published maps and institutional affiliations. |
© 2022 by the authors. Licensee MDPI, Basel, Switzerland. This article is an open access article distributed under the terms and conditions of the Creative Commons Attribution (CC BY) license (https://creativecommons.org/licenses/by/4.0/).
Share and Cite
Shiau, J.-P.; Chuang, Y.-T.; Tang, J.-Y.; Chen, S.-R.; Hou, M.-F.; Jeng, J.-H.; Cheng, Y.-B.; Chang, H.-W. Antiproliferation Effects of Marine-Sponge-Derived Methanol Extract of Theonella swinhoei in Oral Cancer Cells In Vitro. Antioxidants 2022, 11, 1982. https://doi.org/10.3390/antiox11101982
Shiau J-P, Chuang Y-T, Tang J-Y, Chen S-R, Hou M-F, Jeng J-H, Cheng Y-B, Chang H-W. Antiproliferation Effects of Marine-Sponge-Derived Methanol Extract of Theonella swinhoei in Oral Cancer Cells In Vitro. Antioxidants. 2022; 11(10):1982. https://doi.org/10.3390/antiox11101982
Chicago/Turabian StyleShiau, Jun-Ping, Ya-Ting Chuang, Jen-Yang Tang, Shu-Rong Chen, Ming-Feng Hou, Jiiang-Huei Jeng, Yuan-Bin Cheng, and Hsueh-Wei Chang. 2022. "Antiproliferation Effects of Marine-Sponge-Derived Methanol Extract of Theonella swinhoei in Oral Cancer Cells In Vitro" Antioxidants 11, no. 10: 1982. https://doi.org/10.3390/antiox11101982
APA StyleShiau, J.-P., Chuang, Y.-T., Tang, J.-Y., Chen, S.-R., Hou, M.-F., Jeng, J.-H., Cheng, Y.-B., & Chang, H.-W. (2022). Antiproliferation Effects of Marine-Sponge-Derived Methanol Extract of Theonella swinhoei in Oral Cancer Cells In Vitro. Antioxidants, 11(10), 1982. https://doi.org/10.3390/antiox11101982