

Neurofilament Light Chain in Cerebrospinal Fluid and Blood in Multiple System Atrophy: A Systematic Review and Meta-Analysis

 ,
,  and
and 
Abstract
1. Introduction
1.1. Historical Overview of MSA
1.2. Neuropathology of MSA
1.3. Clinical Manifestations in MSA
1.4. Neurofilament Light Chain
2. Materials and Methods
2.1. Search Methods
2.2. Eligibility Criteria
- Published before December 2024;
- Designed as case-control studies (irrespective of the study design being retrospective or prospective);
- Including at least 2 groups: one group of patients with MSA and one group of HC or patients with PD, LBD, PSP, CDB;
- Measured NfL in CSF and/or blood samples and/or investigating NfL’s diagnostic properties.
- Studies assessing alternative biomarkers, not involving NfL;
- Studies assessing NfL’s prognostic—and not diagnostic—properties;
- Studies assessing alternative disease groups, not involving MSA or any one of the well-defined comparators;
- Other study designs (review, meta-analysis, etc.);
- Studies not involving human subjects;
- Studies not published in English;
- Irrelevant papers;
- Study protocols;
- Retracted publications.
2.3. Data Extraction—Outcome Measures
2.4. Statistical Analysis
3. Results
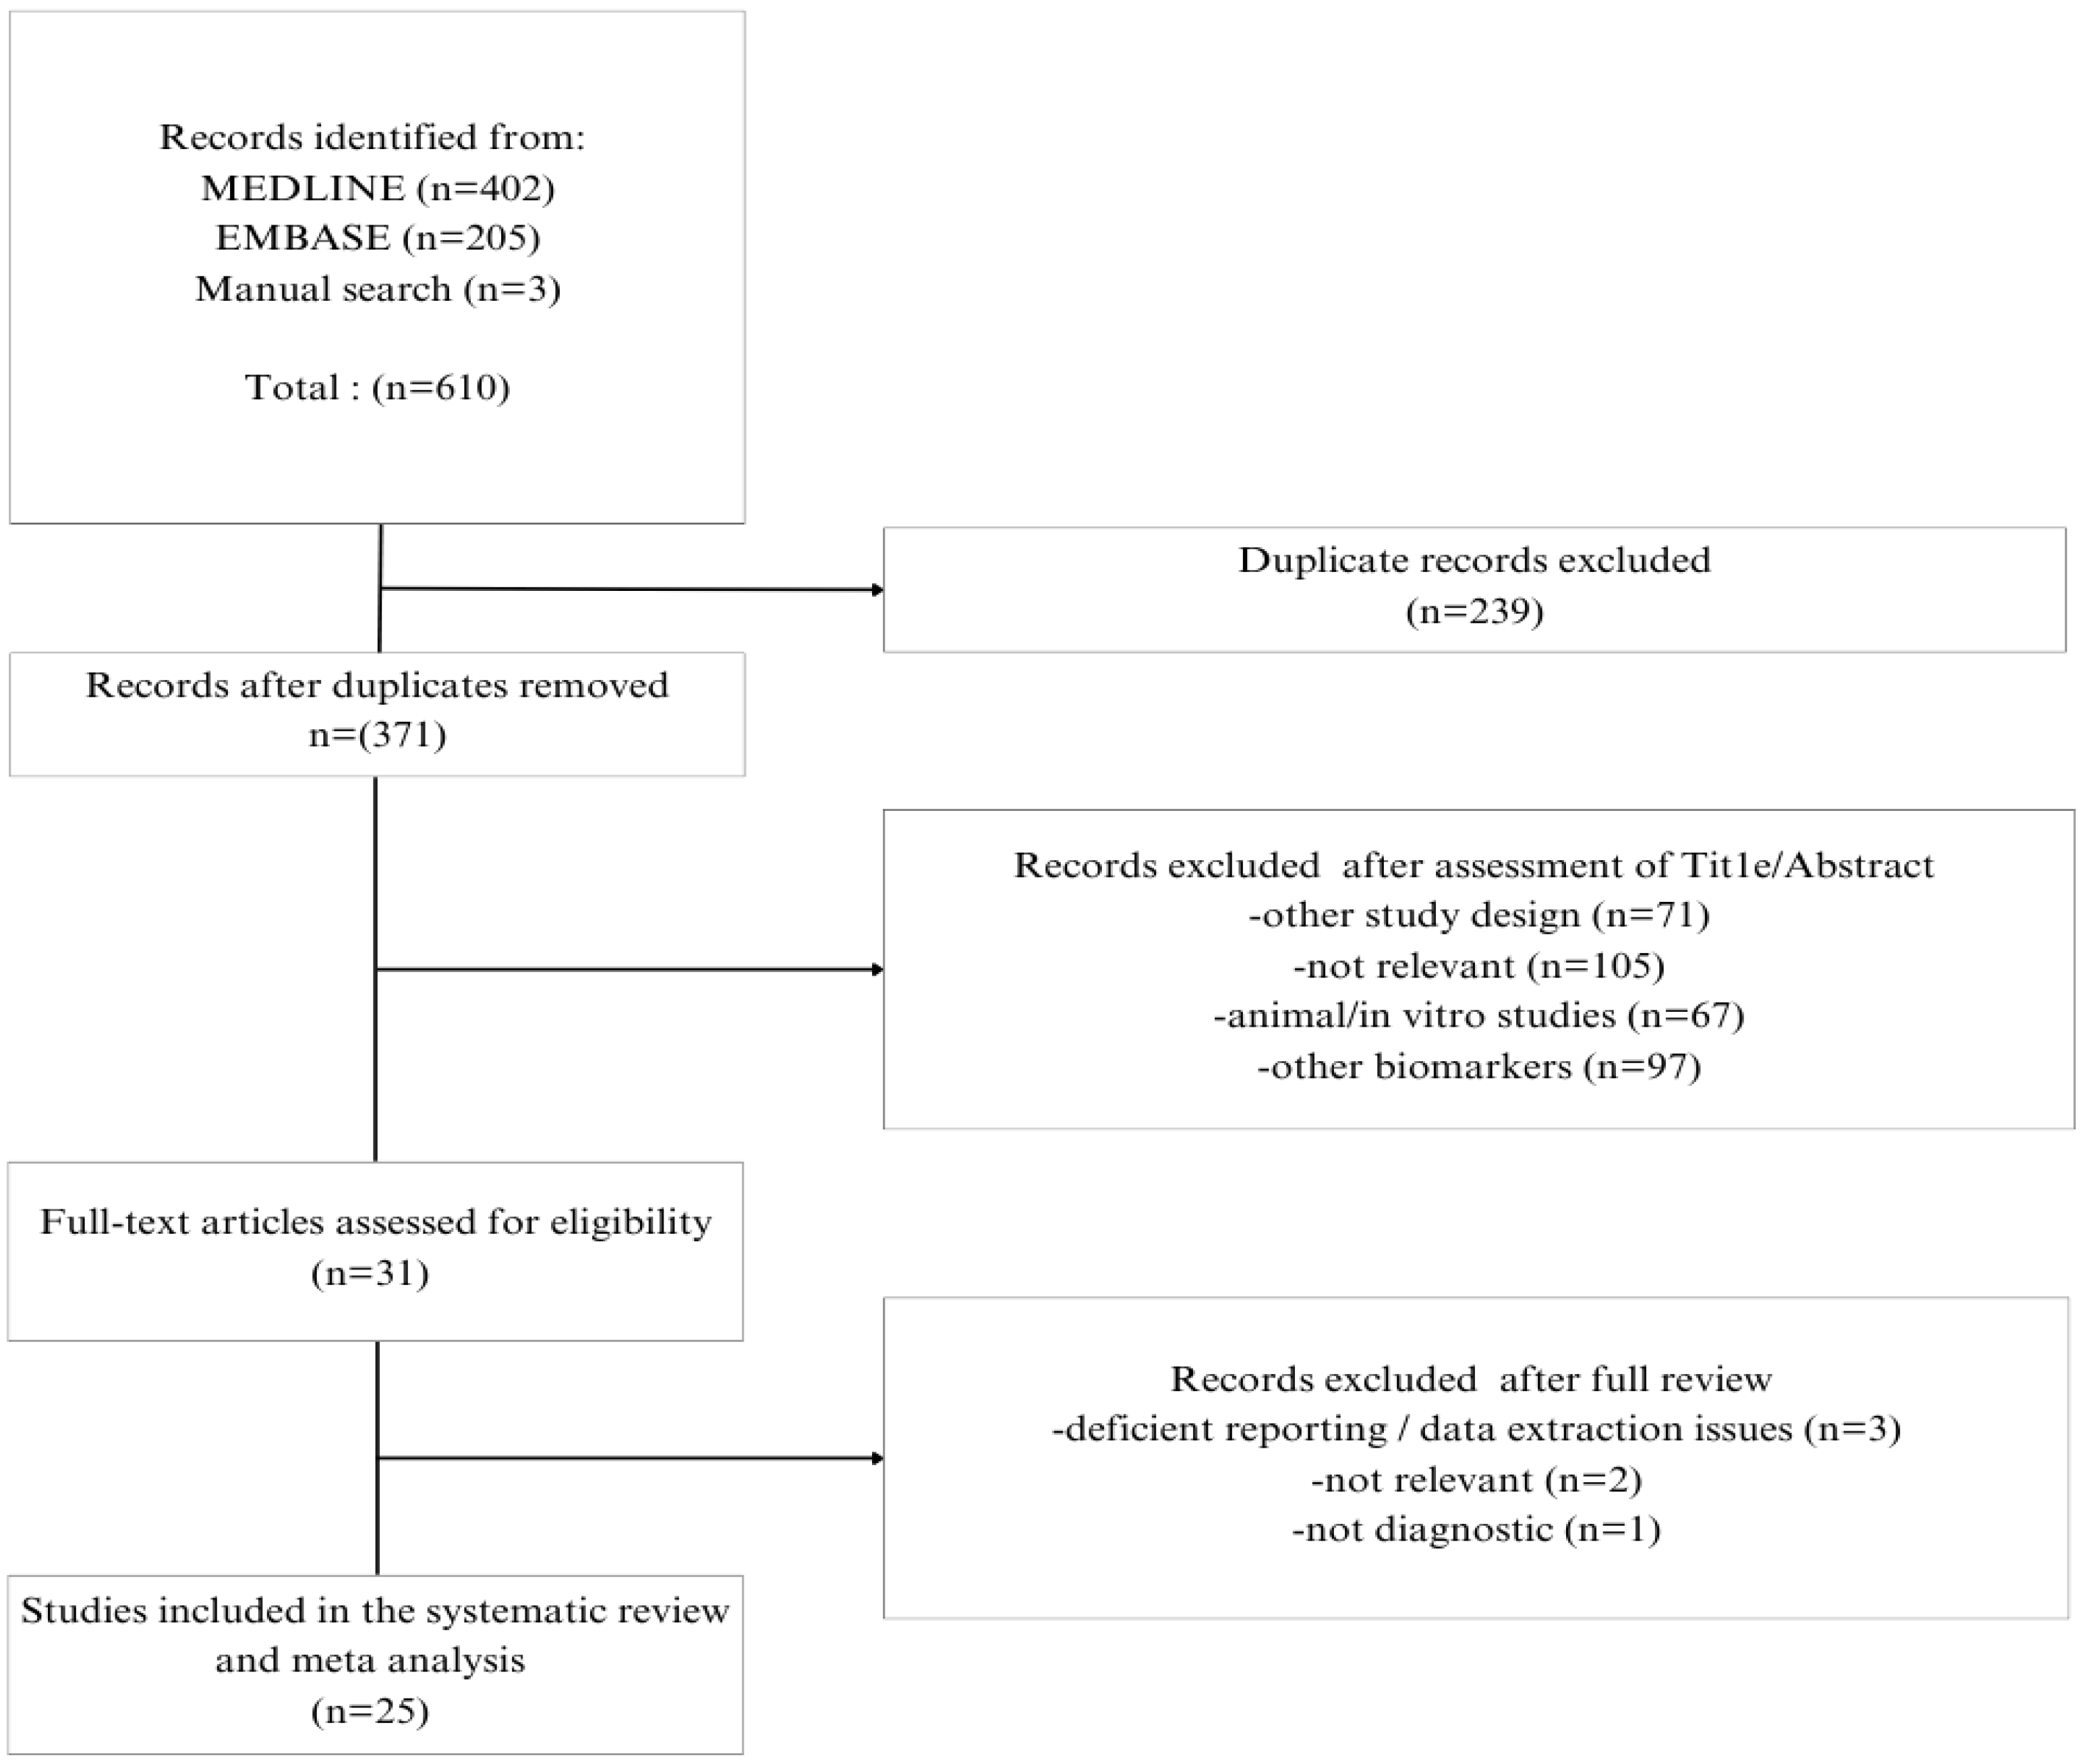
3.1. Literature Search
3.2. Study Characteristics
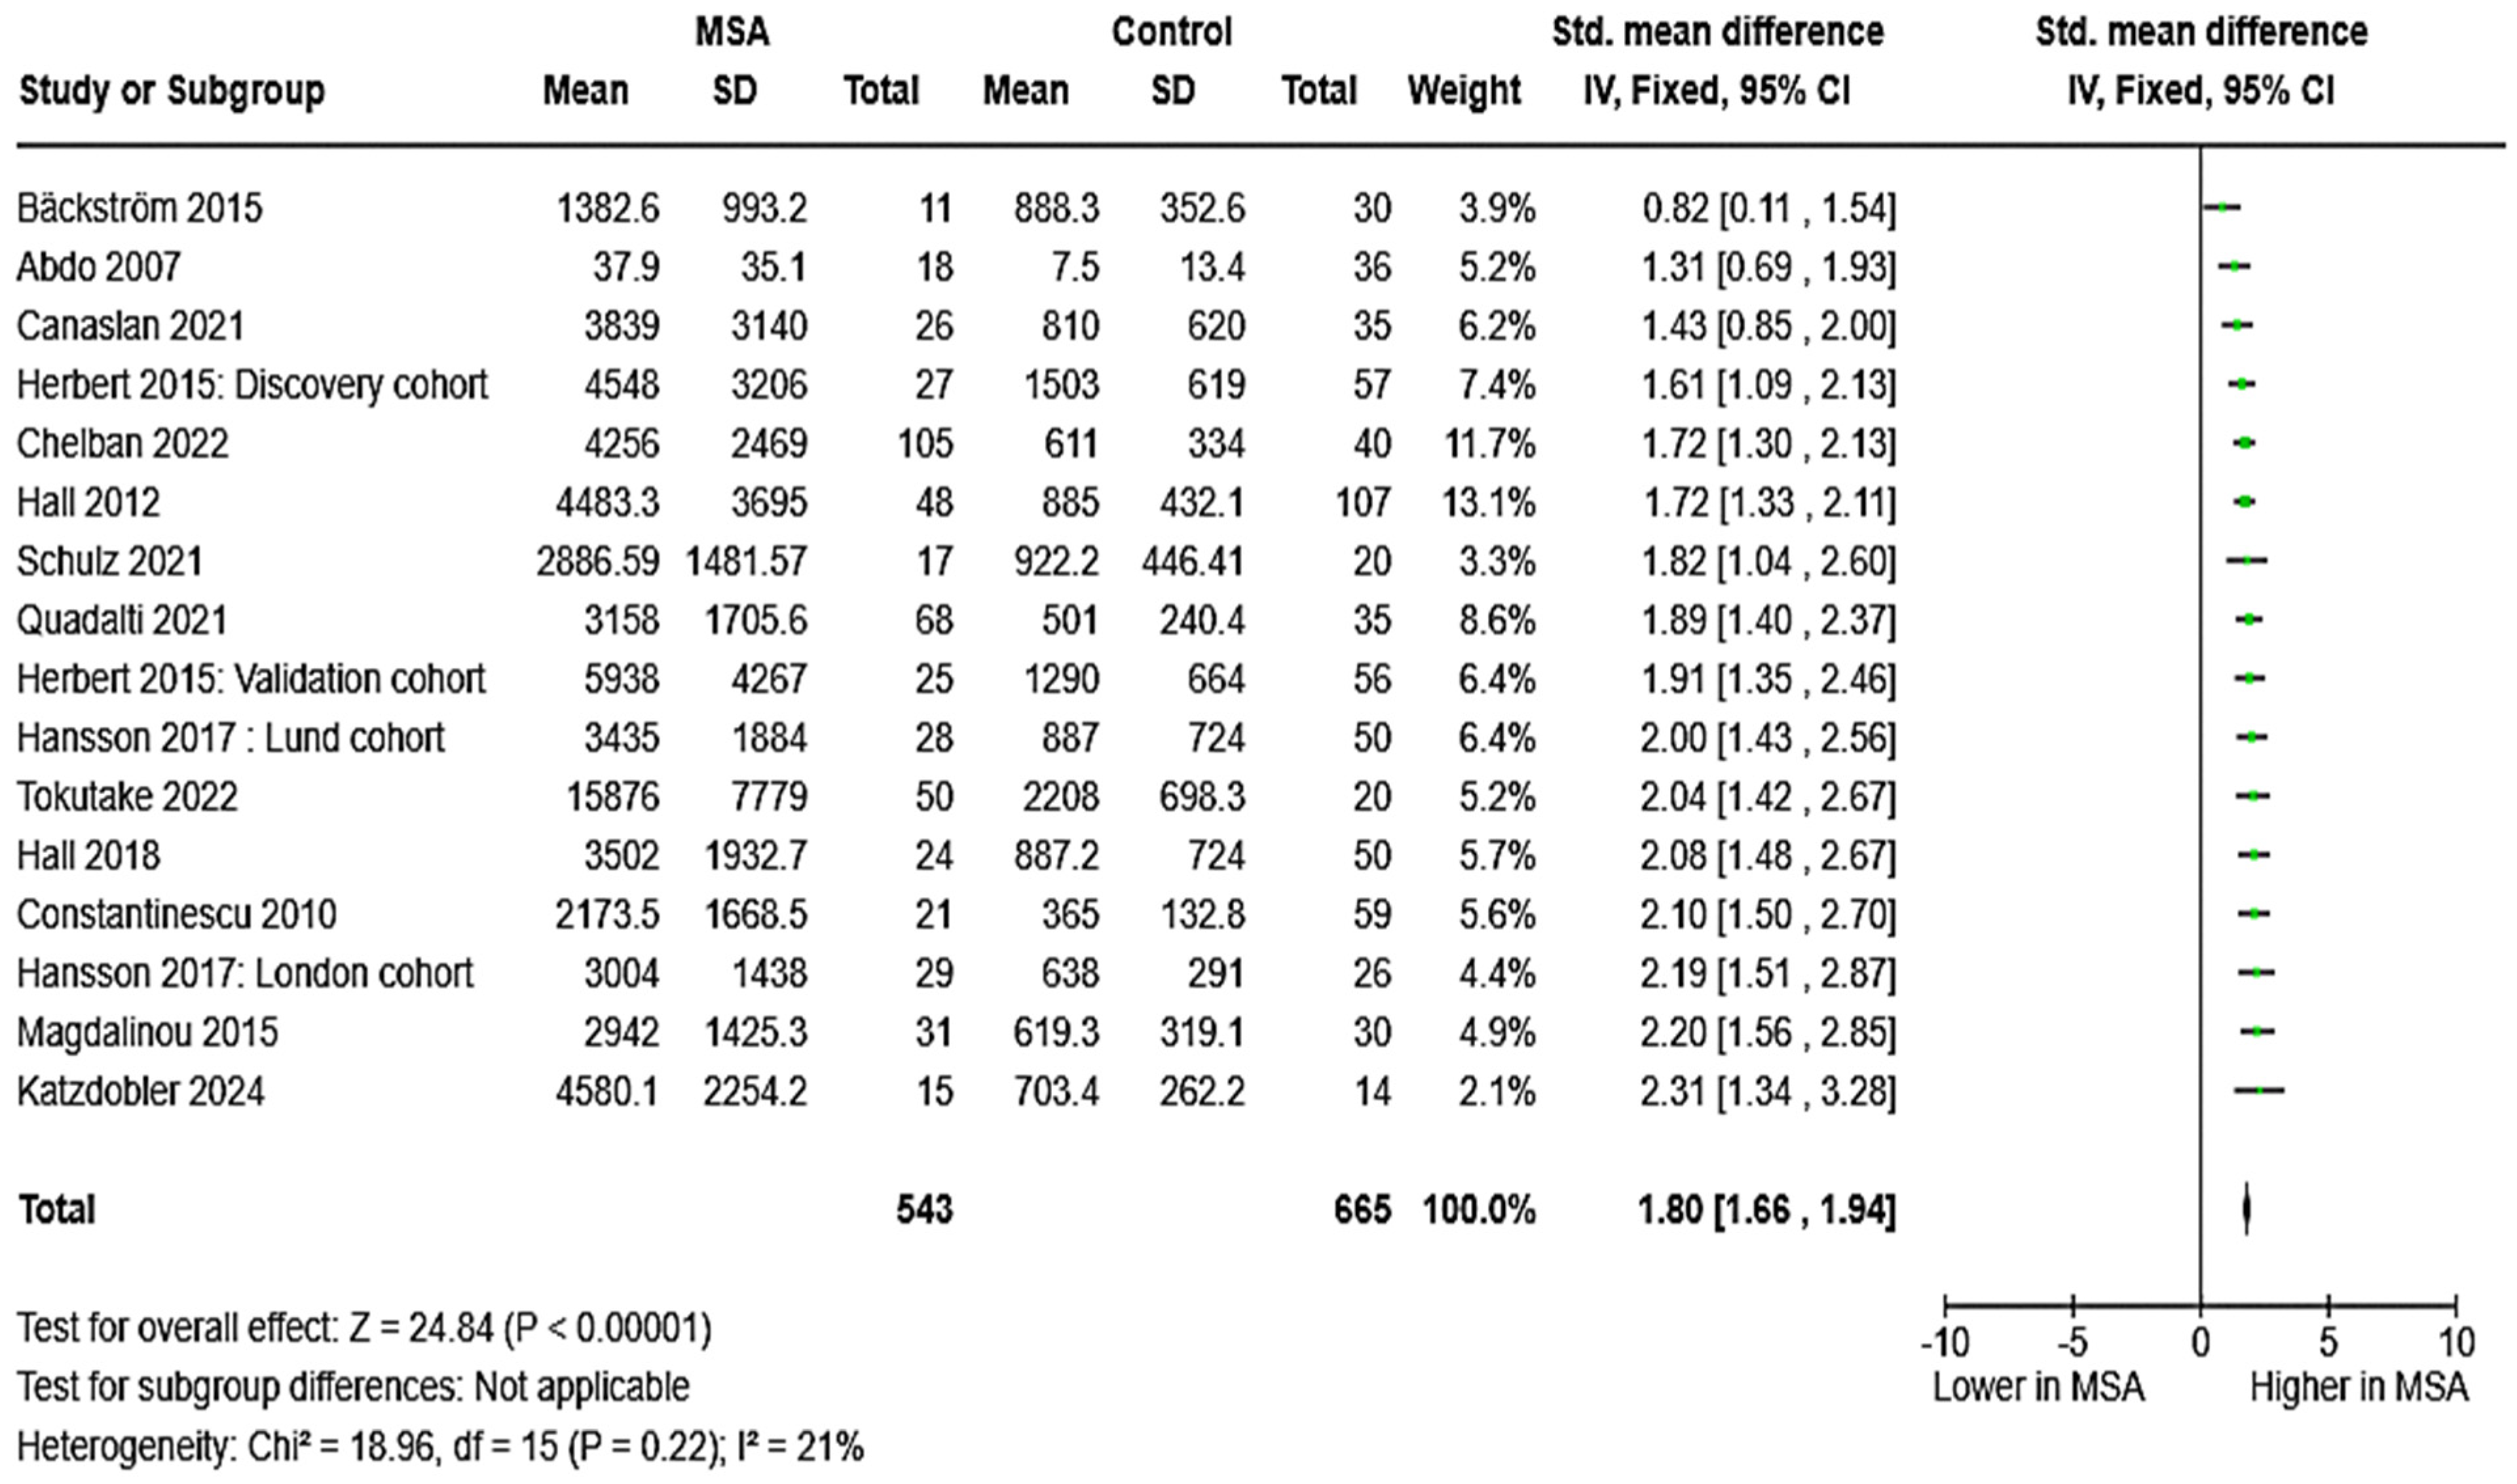
3.2.1. NfL in MSA vs. HC
3.2.2. NfL in MSA vs. PD
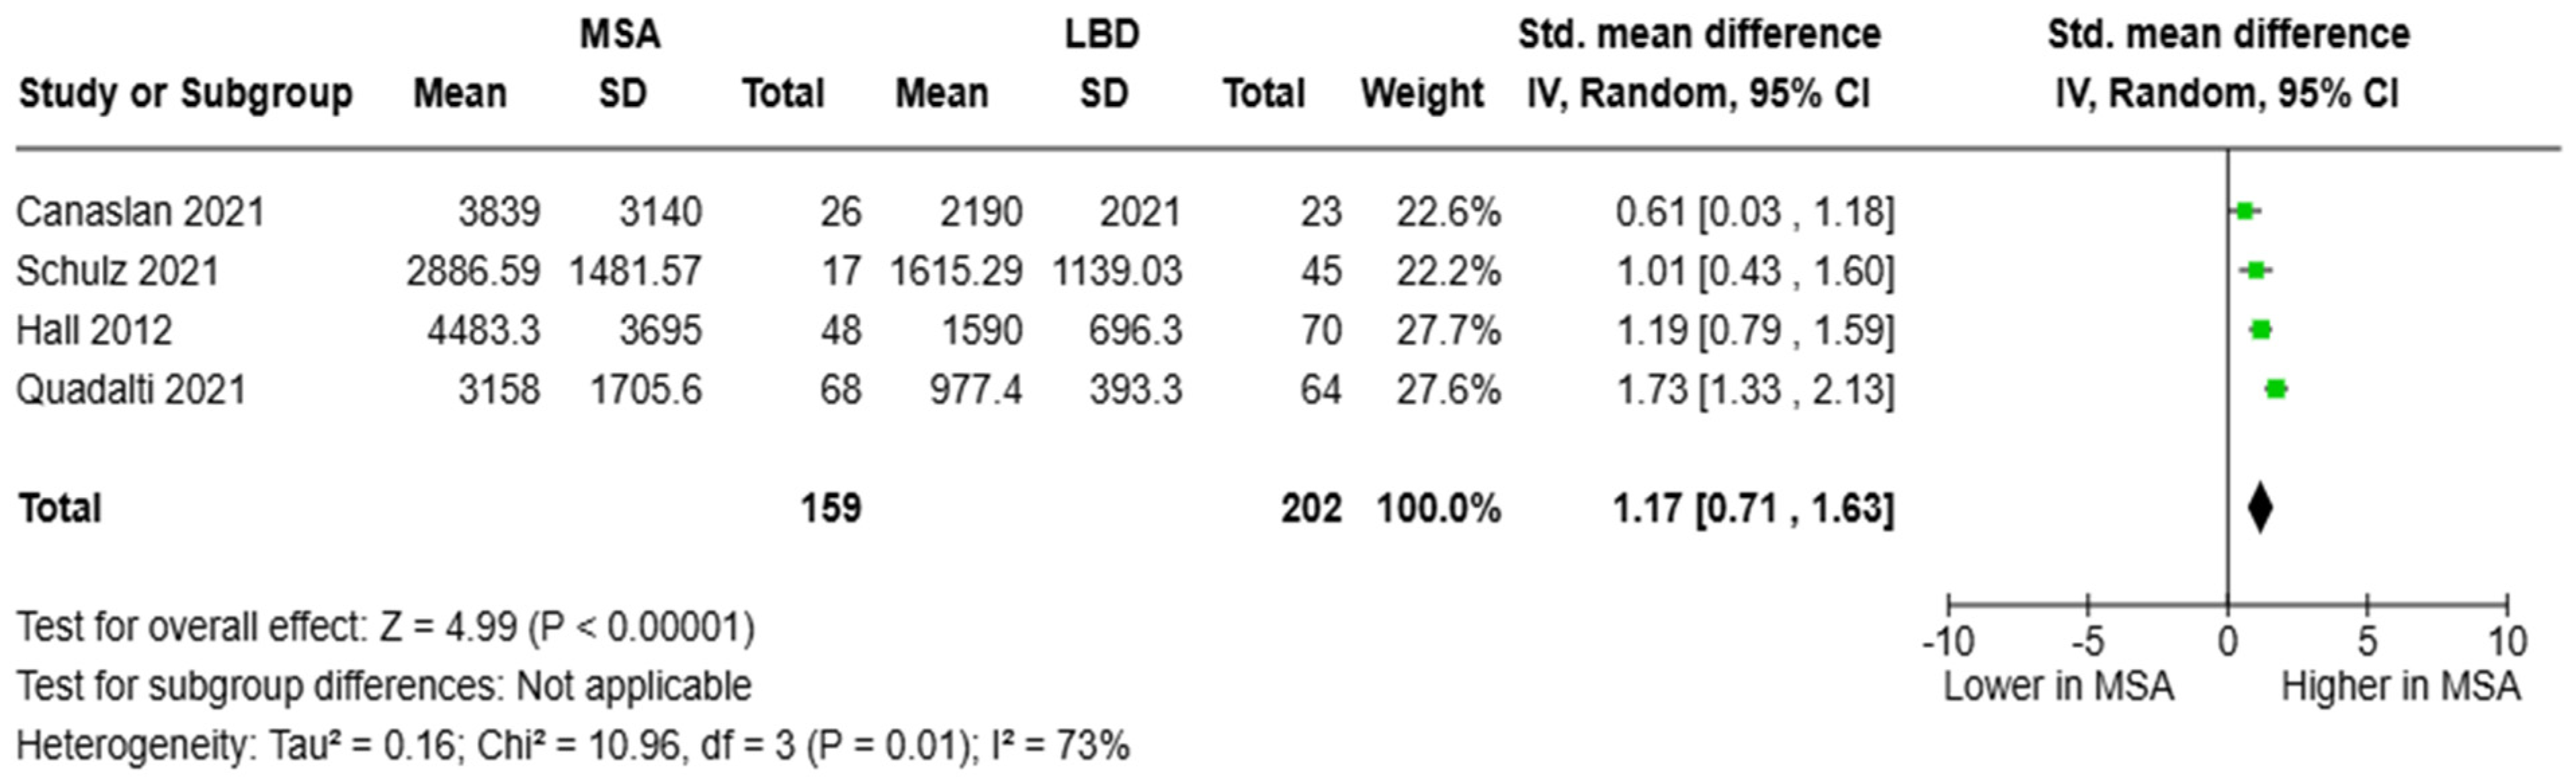
3.2.3. NfL in MSA vs. LBD
3.2.4. NfL in MSA vs. PSP/CBD/S
3.3. Publication Bias
4. Discussion
5. Conclusions
Supplementary Materials
Author Contributions
Funding
Institutional Review Board Statement
Informed Consent Statement
Data Availability Statement
Conflicts of Interest
Abbreviations
| MSA | multiple system atrophy |
| MSA-P | multiple system atrophy parkinsonian type |
| MSA-C | multiple system atrophy cerebellar type |
| CSF | cerebrospinal fluid |
| NfL | neurofilament light chain |
| HC | healthy controls |
| PD | Parkinson’s disease |
| LBD | Lewy body dementia |
| DLB | dementia with Lewy bodies |
| PSP | progressive supranuclear palsy |
| CBD/S | corticobasal degeneration/syndrome |
| GCIs | glial cytoplasmic inclusions |
| SMD | standardized mean difference |
| CI | confidence interval |
| SD | standard deviation |
| IQR | interquartile range |
| RE | random effects |
| FE | fixed effects |
| AUC | area under the curve |
| p-tau | phosphorylated tau |
| GFAP | glial fibrillary acidic protein |
| MS | multiple sclerosis |
| AD | Alzheimer’s disease |
| FTD | frontotemporal dementia |
| ALS | amyotrophic lateral sclerosis |
| OPCA | olivopontocerebellar atrophy |
| QOC2 | coenzyme Q2 |
| REM | rapid eye movement |
| RBD | REM sleep behavior disorder |
| BD | bipolar disorder |
| MDD | major depressive disorder |
| PRISMA | Preferred Reporting Items for Systematic Reviews and Meta-Analyses |
| H&Y | Hoehn and Yahr scale |
| UPDRS | Unified Parkinson’s Disease Rating Scale |
| UMSARS | Unified Multiple System Atrophy Rating Scale |
| MDS | movement disorder society |
| MRI | magnetic resonance imaging |
| CT | computed tomography |
References
- Gilman, S.; Wenning, G.K.; Low, P.A.; Brooks, D.J.; Mathias, C.J.; Trojanowski, J.Q.; Wood, N.W.; Colosimo, C.; Dürr, A.; Fowler, C.J.; et al. Second consensus statement on the diagnosis of multiple system atrophy. Neurology 2008, 71, 670. [Google Scholar] [CrossRef] [PubMed]
- Goh, Y.Y.; Saunders, E.; Pavey, S.; Rushton, E.; Quinn, N.; Houlden, H.; Chelban, V. Multiple system atrophy. Pract. Neurol. 2023, 23, 208–221. [Google Scholar] [CrossRef]
- Low, P.A.; Reich, S.G.; Jankovic, J.; Shults, C.W.; Stern, M.B.; Novak, P.; Tanner, C.M.; Gilman, S.; Marshall, F.J.; Wooten, F.; et al. Natural history of multiple system atrophy in the USA: A prospective cohort study. Lancet Neurol. 2015, 14, 710–719. [Google Scholar] [CrossRef]
- Fanciulli, A.; Wenning, G.K. Multiple-System Atrophy. N. Engl. J. Med. 2015, 372, 249–263. [Google Scholar] [CrossRef] [PubMed]
- Palma, J.-A.; Norcliffe-Kaufmann, L.; Kaufmann, H. Diagnosis of multiple system atrophy. Auton. Neurosci. Basic Clin. 2018, 211, 15–25. [Google Scholar] [CrossRef]
- Wan, L.; Zhu, S.; Chen, Z.; Qiu, R.; Tang, B.; Jiang, H. Multidimensional biomarkers for multiple system atrophy: An update and future directions. Transl. Neurodegener. 2023, 12, 38. [Google Scholar] [CrossRef]
- Gaetani, L.; Blennow, K.; Calabresi, P.; Di Filippo, M.; Parnetti, L.; Zetterberg, H. Neurofilament light chain as a biomarker in neurological disorders. J. Neurol. Neurosurg. Psychiatry 2019, 90, 870–881. [Google Scholar] [CrossRef]
- Ramani, S.; Berard, J.A.; Walker, L.A.S. The relationship between neurofilament light chain and cognition in neurological disorders: A scoping review. J. Neurol. Sci. 2021, 420, 117229. [Google Scholar] [CrossRef]
- van Zeggeren, I.E.; Ter Horst, L.; Heijst, H.; Teunissen, C.E.; van de Beek, D.; Brouwer, M.C. Neurofilament light chain in central nervous system infections: A prospective study of diagnostic accuracy. Sci. Rep. 2022, 12, 14140. [Google Scholar] [CrossRef]
- Liampas, I.; Kyriakoulopoulou, P.; Karakoida, V.; Kavvoura, P.A.; Sgantzos, M.; Bogdanos, D.P.; Stamati, P.; Dardiotis, E.; Siokas, V. Blood-Based Biomarkers in Frontotemporal Dementia: A Narrative Review. Int. J. Mol. Sci. 2024, 25, 11838. [Google Scholar] [CrossRef]
- Gallingani, C.; Carbone, C.; Tondelli, M.; Zamboni, G. Neurofilaments Light Chain in Neurodegenerative Dementias: A Review of Imaging Correlates. Brain Sci. 2024, 14, 272. [Google Scholar] [CrossRef]
- Quinn, N. A short clinical history of multiple system atrophy. Clin. Auton. Res. Off. J. Clin. Auton. Res. Soc. 2015, 25, 3–7. [Google Scholar] [CrossRef] [PubMed]
- Marmion, D.J.; Peelaerts, W.; Kordower, J.H. A historical review of multiple system atrophy with a critical appraisal of cellular and animal models. J. Neural Transm. 2021, 128, 1507–1527. [Google Scholar] [CrossRef]
- Papp, M.I.; Kahn, J.E.; Lantos, P.L. Glial cytoplasmic inclusions in the CNS of patients with multiple system atrophy (striatonigral degeneration, olivopontocerebellar atrophy and Shy-Drager syndrome). J. Neurol. Sci. 1989, 94, 79–100. [Google Scholar] [CrossRef]
- Ubhi, K.; Low, P.; Masliah, E. Multiple System Atrophy: A Clinical and Neuropathological Perspective. Trends Neurosci. 2011, 34, 581–590. [Google Scholar] [CrossRef]
- Valera, E.; Spencer, B.; Mott, J.; Trejo, M.; Adame, A.; Mante, M.; Rockenstein, E.; Troncoso, J.C.; Beach, T.G.; Masliah, E.; et al. MicroRNA-101 Modulates Autophagy and Oligodendroglial Alpha-Synuclein Accumulation in Multiple System Atrophy. Front. Mol. Neurosci. 2017, 10, 329. [Google Scholar] [CrossRef] [PubMed]
- Leńska-Mieciek, M.; Madetko-Alster, N.; Alster, P.; Królicki, L.; Fiszer, U.; Koziorowski, D. Inflammation in multiple system atrophy. Front. Immunol. 2023, 14, 1214677. [Google Scholar] [CrossRef] [PubMed]
- Campese, N.; Fanciulli, A.; Stefanova, N.; Haybaeck, J.; Kiechl, S.; Wenning, G.K. Neuropathology of multiple system atrophy: Kurt Jellinger`s legacy. J. Neural Transm. 2021, 128, 1481–1494. [Google Scholar] [CrossRef]
- McKay, J.H.; Cheshire, W.P. First symptoms in multiple system atrophy. Clin. Auton. Res. 2018, 28, 215–221. [Google Scholar] [CrossRef]
- Schrag, A.; Bohlken, J.; Kostev, K. Pre-diagnostic presentations of Multiple System Atrophy case control study in a primary care dataset. Park. Relat. Disord. 2022, 99, 101–104. [Google Scholar] [CrossRef]
- Tada, M.; Onodera, O.; Tada, M.; Ozawa, T.; Piao, Y.-S.; Kakita, A.; Takahashi, H.; Nishizawa, M. Early development of autonomic dysfunction may predict poor prognosis in patients with multiple system atrophy. Arch. Neurol. 2007, 64, 256–260. [Google Scholar] [CrossRef] [PubMed]
- Roncevic, D.; Palma, J.-A.; Martinez, J.; Goulding, N.; Norcliffe-Kaufmann, L.; Kaufmann, H. Cerebellar and parkinsonian phenotypes in multiple system atrophy: Similarities, differences and survival. J. Neural Transm. 2014, 121, 507–512. [Google Scholar] [CrossRef] [PubMed]
- Koga, S.; Aoki, N.; Uitti, R.J.; van Gerpen, J.A.; Cheshire, W.P.; Josephs, K.A.; Wszolek, Z.K.; Langston, J.W.; Dickson, D.W. When DLB, PD, and PSP masquerade as MSA: An autopsy study of 134 patients. Neurology 2015, 85, 404–412. [Google Scholar] [CrossRef]
- Andersson, E.; Janelidze, S.; Lampinen, B.; Nilsson, M.; Leuzy, A.; Stomrud, E.; Blennow, K.; Zetterberg, H.; Hansson, O. Blood and cerebrospinal fluid neurofilament light differentially detect neurodegeneration in early Alzheimer’s disease. Neurobiol. Aging 2020, 95, 143–153. [Google Scholar] [CrossRef]
- Freedman, M.S.; Gnanapavan, S.; Booth, R.A.; Calabresi, P.A.; Khalil, M.; Kuhle, J.; Lycke, J.; Olsson, T. Consortium of Multiple Sclerosis Centers. Guidance for use of neurofilament light chain as a cerebrospinal fluid and blood biomarker in multiple sclerosis management. eBioMedicine 2024, 101, 104970. [Google Scholar] [CrossRef] [PubMed]
- Bavato, F.; Barro, C.; Schnider, L.K.; Simrén, J.; Zetterberg, H.; Seifritz, E.; Quednow, B.B. Introducing neurofilament light chain measure in psychiatry: Current evidence, opportunities, and pitfalls. Mol. Psychiatry 2024, 29, 2543–2559. [Google Scholar] [CrossRef] [PubMed]
- Hozo, S.P.; Djulbegovic, B.; Hozo, I. Estimating the mean and variance from the median, range, and the size of a sample. BMC Med. Res. Methodol. 2005, 5, 13. [Google Scholar] [CrossRef] [PubMed]
- Wan, X.; Wang, W.; Liu, J.; Tong, T. Estimating the sample mean and standard deviation from the sample size, median, range and/or interquartile range. BMC Med. Res. Methodol. 2014, 14, 135. [Google Scholar] [CrossRef] [PubMed]
- Teresa Greco, G.B.-Z.; Rin, A.Z. How to impute study-specific standard deviations in meta-analyses of skewed continuous endpoints? World J. Meta-Anal. 2015, 3, 215–224. [Google Scholar] [CrossRef]
- Holmberg, B.; Rosengren, L.; Karlsson, J.; Johnels, B. Increased cerebrospinal fluid levels of neurofilament protein in progressive supranuclear palsy and multiple-system atrophy compared with Parkinson’s disease. Mov. Disord. 1998, 13, 70–77. [Google Scholar] [CrossRef] [PubMed]
- Hall, S.; Janelidze, S.; Surova, Y.; Widner, H.; Zetterberg, H.; Hansson, O. Cerebrospinal fluid concentrations of inflammatory markers in Parkinson’s disease and atypical parkinsonian disorders. Sci. Rep. 2018, 8, 13276. [Google Scholar] [CrossRef] [PubMed]
- Hall, S.; Öhrfelt, A.; Constantinescu, R.; Andreasson, U.; Surova, Y.; Bostrom, F.; Nilsson, C.; Håkan, W.; Decraemer, H.; Någga, K.; et al. Accuracy of a Panel of 5 Cerebrospinal Fluid Biomarkers in the Differential Diagnosis of Patients With Dementia and/or Parkinsonian Disorders. Arch. Neurol. 2012, 69, 1445. [Google Scholar] [CrossRef] [PubMed]
- Holmberg, B.; Johnels, B.; Ingvarsson, P.; Eriksson, B.; Rosengren, L. CSF-neurofilament and levodopa tests combined with discriminant analysis may contribute to the differential diagnosis of Parkinsonian syndromes. Park. Relat. Disord. 2001, 8, 23–31. [Google Scholar] [CrossRef]
- Bäckström, D.C.; Eriksson Domellöf, M.; Linder, J.; Olsson, B.; Öhrfelt, A.; Trupp, M.; Zetterberg, H.; Blennow, K.; Forsgren, L. Cerebrospinal Fluid Patterns and the Risk of Future Dementia in Early, Incident Parkinson Disease. JAMA Neurol. 2015, 72, 1175. [Google Scholar] [CrossRef]
- Hansson, O.; Janelidze, S.; Hall, S.; Magdalinou, N.; Lees, A.J.; Andreasson, U.; Norgren, N.; Linder, J.; Forsgren, L.; Constantinescu, R.; et al. Blood-based NfL: A biomarker for differential diagnosis of parkinsonian disorder. Neurology 2017, 88, 930–937. [Google Scholar] [CrossRef] [PubMed]
- Chen, Y.; Huang, J.; Li, Y.; Chen, X.; Ye, Q. Diagnostic value of six plasma biomarkers in progressive supranuclear palsy, multiple system atrophy, and Parkinson’s disease. Clin. Chim. Acta 2025, 565, 119975. [Google Scholar] [CrossRef] [PubMed]
- Liu, M.; Cai, Y.; Pan, J.; Wang, T.; Li, Y.; Yu, Q.; Mao, W.; Chan, P. Serum neurofilament light chain as a diagnostic and prognostic biomarker in multiple system atrophy: A prospective cohort study. J. Neurol. 2024, 272, 74. [Google Scholar] [CrossRef]
- Peng, L.; Wan, L.; Liu, M.; Long, Z.; Chen, D.; Yuan, X.; Tang, Z.; Fu, Y.; Zhu, S.; Lei, L.; et al. Diagnostic and prognostic performance of plasma neurofilament light chain in multiple system atrophy: A cross-sectional and longitudinal study. J. Neurol. 2023, 270, 4248–4261. [Google Scholar] [CrossRef]
- Li, Q.; Li, Z.; Han, X.; Shen, X.; Wang, F.; Bai, L.; Li, Z.; Zhang, R.; Wang, Y.; Zhu, X. A Panel of Plasma Biomarkers for Differential Diagnosis of Parkinsonian Syndromes. Front. Neurosci. 2022, 16, 805953. [Google Scholar] [CrossRef]
- Guo, Y.; Shen, X.-N.; Huang, S.-Y.; Chen, S.-F.; Wang, H.-F.; Zhang, W.; Zhang, Y.R.; Cheng, W.; Cui, M.; Dong, Q.; et al. Head-to-head comparison of 6 plasma biomarkers in early multiple system atrophy. NPJ Park. Dis. 2023, 9, 40. [Google Scholar] [CrossRef]
- Abdo, W.F.; Bloem, B.R.; Van Geel, W.J.; Esselink, R.A.J.; Verbeek, M.M. CSF neurofilament light chain and tau differentiate multiple system atrophy from Parkinson’s disease. Neurobiol. Aging 2007, 28, 742–747. [Google Scholar] [CrossRef] [PubMed]
- Marques, T.M.; van Rumund, A.; Oeckl, P.; Kuiperij, H.B.; Esselink, R.A.J.; Bloem, B.R.; Otto, M.; Verbeek, M.M. Serum NFL Discriminates Parkinson Disease from Atypical Parkinsonisms. Neurology 2019, 92, e1479–e1486. [Google Scholar] [CrossRef] [PubMed]
- Herbert, M.K.; Aerts, M.B.; Beenes, M.; Norgren, N.; Esselink, R.A.J.; Bloem, B.R.; Kuiperij, H.B.; Verbeek, M.M. CSF Neurofilament Light Chain but not FLT3 Ligand Discriminates Parkinsonian Disorders. Front. Neurol. 2015, 6, 91. [Google Scholar] [CrossRef] [PubMed]
- Katzdobler, S.; Nübling, G.; Klietz, M.; Fietzek, U.M.; Palleis, C.; Bernhardt, A.M.; Wegner, F.; Huber, M.; Rogozinski, S.; Schneider, L.S.; et al. GFAP and NfL as fluid biomarkers for clinical disease severity and disease progression in multiple system atrophy (MSA). J. Neurol. 2024, 271, 6991–6999. [Google Scholar] [CrossRef] [PubMed]
- Schulz, I.; Kruse, N.; Gera, R.G.; Kremer, T.; Cedarbaum, J.; Barbour, R.; Zago, W.; Schade, S.; Otte, B.; Bartl, M.; et al. Systematic Assessment of 10 Biomarker Candidates Focusing on α-Synuclein-Related Disorders. Mov. Disord. Off. J. Mov. Disord. Soc. 2021, 36, 2874–2887. [Google Scholar] [CrossRef] [PubMed]
- Chelban, V.; Nikram, E.; Perez-Soriano, A.; Wilke, C.; Foubert-Samier, A.; Vijiaratnam, N.; Guo, T.; Jabbari, E.; Olufodun, S.; Gonzalez, M.; et al. Neurofilament light levels predict clinical progression and death in multiple system atrophy. Brain 2022, 145, 4398–4408. [Google Scholar] [CrossRef] [PubMed]
- Magdalinou, N.K.; Paterson, R.W.; Schott, J.M.; Fox, N.C.; Mummery, C.; Blennow, K.; Bhatia, K.; Morris, H.R.; Giunti, P.; Warner, T.T.; et al. A panel of nine cerebrospinal fluid biomarkers may identify patients with atypical parkinsonian syndromes. J. Neurol. Neurosurg. Psychiatry 2015, 86, 1240–1247. [Google Scholar] [CrossRef]
- Quadalti, C.; Calandra-Buonaura, G.; Baiardi, S.; Mastrangelo, A.; Rossi, M.; Zenesini, C.; Giannini, G.; Candelise, N.; Sambati, L.; Polischi, B.; et al. Neurofilament light chain and α-synuclein RT-QuIC as differential diagnostic biomarkers in parkinsonisms and related syndromes. NPJ Park. Dis. 2021, 7, 93. [Google Scholar] [CrossRef]
- Bech, S.; Hjermind, L.E.; Salvesen, L.; Nielsen, J.E.; Heegaard, N.H.H.; Jørgensen, H.L.; Rosengren, L.; Blennow, K.; Zetterberg, H.; Winge, K. Amyloid-related biomarkers and axonal damage proteins in parkinsonian syndromes. Park. Relat. Disord. 2012, 18, 69–72. [Google Scholar] [CrossRef]
- Tokutake, T.; Kasuga, K.; Tsukie, T.; Ishiguro, T.; Shimohata, T.; Onodera, O.; Ikeuchi, T. Clinical correlations of cerebrospinal fluid biomarkers including neuron-glia 2 and neurofilament light chain in patients with multiple system atrophy. Park. Relat. Disord. 2022, 102, 30–35. [Google Scholar] [CrossRef] [PubMed]
- Lin, C.-H.; Li, C.-H.; Yang, K.-C.; Lin, F.-J.; Wu, C.-C.; Chieh, J.-J.; Chiu, M.J. Blood NfL: A biomarker for disease severity and progression in Parkinson disease. Neurology 2019, 93, e1104–e1111. [Google Scholar] [CrossRef] [PubMed]
- Canaslan, S.; Schmitz, M.; Villar-Piqué, A.; Maass, F.; Gmitterová, K.; Varges, D.; Lingor, P.; Llorens, F.; Hermann, P.; Zerr, I. Detection of cerebrospinal fluid neurofilament light chain as a marker for alpha-synucleinopathies. Front. Aging Neurosci. 2021, 13, 717930. [Google Scholar] [CrossRef]
- Singer, W.; Schmeichel, A.M.; Shahnawaz, M.; Schmelzer, J.D.; Boeve, B.F.; Sletten, D.M.; Gehrking, T.L.; Gehrking, J.A.; Olson, A.D.; Savica, R.; et al. Alpha-Synuclein Oligomers and Neurofilament Light Chain in Spinal Fluid Differentiate Multiple System Atrophy from Lewy Body Synucleinopathies. Ann. Neurol. 2020, 88, 503–512. [Google Scholar] [CrossRef] [PubMed]
- Constantinescu, R.; Rosengren, L.; Johnels, B.; Zetterberg, H.; Holmberg, B. Consecutive analyses of cerebrospinal fluid axonal and glial markers in Parkinson’s disease and atypical parkinsonian disorders. Park. Relat. Disord. 2010, 16, 142–145. [Google Scholar] [CrossRef] [PubMed]
- Hu, X.; Yang, Y.; Gong, D. Cerebrospinal fluid levels of neurofilament light chain in multiple system atrophy relative to Parkinson’s disease: A meta-analysis. Neurol. Sci. Off. J. Ital. Neurol. Soc. Ital. Soc. Clin. Neurophysiol. 2017, 38, 407–414. [Google Scholar] [CrossRef] [PubMed]
- Krismer, F.; Fanciulli, A.; Meissner, W.G.; Coon, E.A.; Wenning, G.K. Multiple system atrophy: Advances in pathophysiology, diagnosis, and treatment. Lancet Neurol. 2024, 23, 1252–1266. [Google Scholar] [CrossRef] [PubMed]
- Angelopoulou, E.; Bougea, A.; Papadopoulos, A.; Georgakis, M.K.; Stefanis, L. CSF and circulating NfL as biomarkers for the discrimination of Parkinson disease from atypical parkinsonian syndromes: Meta-analysis. Neurol. Clin. Pract. 2021, 11, e867–e875. [Google Scholar] [CrossRef] [PubMed]
- Sferruzza, G.; Bosco, L.; Falzone, Y.M.; Filippi, M.; Riva, N. Neurofilament light chain as a biological marker for amyotrophic lateral sclerosis: A meta-analysis study. Amyotroph. Lateral Scler. Front. Degener. 2022, 23, 446–457. [Google Scholar] [CrossRef] [PubMed]
- Kouchaki, E.; Dashti, F.; Mirazimi, S.M.A.; Alirezaei, Z.; Jafari, S.H.; Hamblin, M.R.; Mirzaei, H. Neurofilament light chain as a biomarker for diagnosis of multiple sclerosis. EXCLI J. 2021, 20, 1308–1325. [Google Scholar] [CrossRef]
- Nguyen, A.D.; Malmstrom, T.K.; Aggarwal, G.; Miller, D.K.; Vellas, B.; Morley, J.E. Serum neurofilament light levels are predictive of all-cause mortality in late middle-aged individuals. eBioMedicine 2022, 82, 104146. [Google Scholar] [CrossRef]
- Wang, S.Y.; Chen, W.; Xu, W.; Li, J.Q.; Hou, X.H.; Ou, Y.N.; Yu, J.T.; Tan, L. Neurofilament light chain in cerebrospinal fluid and blood as a biomarker for neurodegenerative diseases: A systematic review and meta-analysis. J. Alzheimers Dis. 2019, 72, 1353–1361. [Google Scholar] [CrossRef] [PubMed]
- Liampas, I.; Kyriakoulopoulou, P.; Siokas, V.; Tsiamaki, E.; Stamati, P.; Kefalopoulou, Z.; Chroni, E.; Dardiotis, E. Apolipoprotein E gene in α-synucleinopathies: A narrative review. Int. J. Mol. Sci. 2024, 25, 1795. [Google Scholar] [CrossRef] [PubMed]
- Gaig, C.; Valldeoriola, F.; Gelpi, E.; Rey, M.J.; Martí, M.J.; Graus, F.; Tolosa, E. Rapidly progressive diffuse Lewy body disease. Mov. Disord. 2011, 26, 1316–1323. [Google Scholar] [CrossRef]
- Tsukamoto, K.; Matsusue, E.; Kanasaki, Y.; Kakite, S.; Fujii, S.; Kaminou, T.; Ogawa, T. Significance of apparent diffusion coefficient measurement for the differential diagnosis of multiple system atrophy, progressive supranuclear palsy, and Parkinson’s disease: Evaluation by 3.0-T MR imaging. Neuroradiology 2012, 54, 947–955. [Google Scholar] [CrossRef]
- Laurens, B.; Constantinescu, R.; Freeman, R.; Gerhard, A.; Jellinger, K.; Jeromin, A.; Krismer, F.; Mollenhauer, B.; Schlossmacher, M.G.; Shaw, L.; et al. Fluid biomarkers in multiple system atrophy: A review of the MSA Biomarker Initiative. Neurobiol. Dis. 2015, 80, 29–41. [Google Scholar] [CrossRef] [PubMed]
- Taha, H.B.; Hornung, S.; Dutta, S.; Fenwick, L.; Lahgui, O.; Howe, K.; Elabed, N.; Del Rosario, I.; Wong, D.Y.; Duarte Folle, A.; et al. Toward a biomarker panel measured in CNS-originating extracellular vesicles for improved differential diagnosis of Parkinson’s disease and multiple system atrophy. Transl. Neurodegener. 2023, 12, 14. [Google Scholar] [CrossRef] [PubMed] [PubMed Central]
- Dash, S.K.; Kamble, N.; Stezin, A.; Yadav, R.; Netravathi, M.; Saini, J.; Pal, P. Imaging Markers of Multiple System Atrophy and Their Association With Disease Severity: A Cross-Sectional Study. Cureus 2024, 16, e67896. [Google Scholar] [CrossRef]
- Kim, H.-J.; Jeon, B.; Fung, V.S.C. Role of Magnetic Resonance Imaging in the Diagnosis of Multiple System Atrophy. Mov. Disord. Clin. Pract. 2016, 4, 12–20. [Google Scholar] [CrossRef] [PubMed]
- Cilia, R.; Marotta, G.; Benti, R.; Pezzoli, G.; Antonini, A. Brain SPECT imaging in multiple system atrophy. J. Neural Transm. 2005, 112, 1635–1645. [Google Scholar] [CrossRef] [PubMed]
- Zhao, P.; Zhang, B.; Gao, S.; Li, X. Clinical features, MRI, and 18F-FDG-PET in differential diagnosis of Parkinson disease from multiple system atrophy. Brain Behav. 2020, 10, e01827. [Google Scholar] [CrossRef]
- Liampas, I.; Siokas, V.; Zoupa, E.; Kyriakoulopoulou, P.; Stamati, P.; Provatas, A.; Tsouris, Z.; Tsimourtou, V.; Lyketsos, C.G.; Dardiotis, E. Neuropsychiatric symptoms and white matter hyperintensities in older adults without dementia. Int. Psychogeriatr. 2024, 36, 1051–1063. [Google Scholar] [CrossRef] [PubMed]
- Liampas, I.; Siokas, V.; Stamati, P.; Kyriakoulopoulou, P.; Tsouris, Z.; Zoupa, E.; Folia, V.; Lyketsos, C.G.; Dardiotis, E. Neuropsychiatric Symptoms Associated With Frontotemporal Atrophy in Older Adults Without Dementia. Int. J. Geriatr. Psychiatry 2024, 39, e70008. [Google Scholar] [CrossRef] [PubMed]
- Antonioni, A.; Raho, E.M.; Manzoli, L.; Koch, G.; Flacco, M.E.; Di Lorenzo, F. Blood phosphorylated Tau181 reliably differentiates amyloid-positive from amyloid-negative subjects in the Alzheimer’s disease continuum: A systematic review and meta-analysis. Alzheimers Dement. 2025, 17, e70068. [Google Scholar] [CrossRef]
- Page, M.J.; McKenzie, J.E.; Bossuyt, P.M.; Boutron, I.; Hoffmann, T.C.; Mulrow, C.D.; Shamseer, L.; Tetzlaff, J.M.; Akl, E.A.; Brennan, S.E.; et al. The PRISMA 2020 statement: An updated guideline for reporting systematic reviews. BMJ 2021, 372, n71. [Google Scholar] [CrossRef] [PubMed]


| Author—Publication Year | Settings | Participants per Group (Female%), Age in Years ± SD (Unless Stated Otherwise) | Diagnostic Criteria | Disease Duration in Years ± SD (Unless Stated Otherwise) | Disease Severity |
|---|---|---|---|---|---|
| Katzdobler 2024 [44] 1,2,3,* | MSA patients: recruited at the Department of Neurology, LMU University Hospital, LMU Munich and the Department of Neurology, Hannover Medical School. PD patients: recruited at the LMU Hospital and within the DESCRIBE and DANCER study of the German Center for Neurodegenerative Diseases (Germany) | Controls = 25 (44%), 62.4 ± 9.2 MSA = 47 (34%), 59.9 ± 7.8 PD = 24 (50%), 59.7 ± 8.7 | MSA= second consensus statement on the diagnosis of multiple system atrophy PD = MDS-PD criteria | MSA = 4.0 ± 1.9 PD = 4.4 ± 3.3 | MSA: UMSARS I + II = 43.8 ± 13.9 MSA: MDS-UPDRS III = 43.1 ± 17.8 PD: MDS-UPDRS III = 25.1 ± 12.2 |
| Chen 2025 [36] 1 | Patients from a cohort of Fujian Medical University Union Hospital-PD (China) | Controls = 30 (43%), 65.9 ± 6.0 MSA = 30 (46%), 64.5 ± 7.8 PD = 56 (35.7%), 65.0 ± 7.6 PSP = 33 (42.4%), 67.8 ± 5.9 | MSA = second consensus statement on the diagnosis of multiple system atrophy PD = MDS-PD criteria PSP = MDS criteria All patients underwent brain magnetic resonance imaging or computed tomography scans | Months MSA = 40.3 ± 21.4 PD = 64.5 ± 34.9 PSP = 50.5 ± 29.8 | |
| Liu 2024 [37] 2 | Patients were enrolled from the CHina Initiative on Neurodegeneration in Aging (CHINA) cohort of patients with parkinsonism syndromes from the Movement Disorders Center of the Xuanwu Hospital at Capital Medical University in Beijing (China) | Controls = 54 (42.6%), 62.2 ± 6.9 MSA = 102 (40.2%), 60.9 ± 7.0 PD = 62 (48.4%), 65.3 ± 6.5 | MSA = second consensus statement on the diagnosis of multiple system atrophy PD = MDS-PD criteria | Median (IQR) MSA = 2.5 (1.5–3.5) PD = 4.1 (1.9–7.4) | Median (IQR) MSA: UMSARS total = 33 (26–45.5) |
| Peng 2023 [38] 1 | Patients were recruited from the Department of Neurology, Xiangya Hospital, Central South University and Changde First People’s Hospital, Hunan (China) | Controls = 211 (48%), 57.2 ± 9 MSA = 214 (44%), 58.2 ± 6.7 PD = 65 (44%), 62.9 ± 10.3 | MSA = second consensus statement on the diagnosis of multiple system atrophy. All MSA patients were screened for exclusion of most common polyglutamine (polyQ) ataxia including spinocerebellar ataxia (SCA1, SCA2, SCA3, SCA6, SCA7, SCA17) and dentatorubral–pallidoluysian atrophy (DRPLA). PD = MDS-PD criteria | MSA = 2.4 ± 1.6 PD = 7.2 ± 4.3 | MSA: UMSARS total = 38.14 ± 16.48 |
| Guo 2023 [40] 1 | Patients from Huashan Hospital, Fudan University and healthy controls from Qingdao Municipal Hospital (China) | Controls = 100 (56%), 59.50 ± 8.91 MSA = 73 (43%), 58.62 ± 7.85 PD = 28 (42%), 64.04 ± 9.33 | MSA = second consensus statement on the diagnosis of multiple system atrophy PD = MDS-PD criteria | Months MSA = 19.48 ± 8.69 PD = 19.79 ± 10.92 | |
| Tokutake 2022 [50] 3 | Patients from Niigata University Hospital or at affiliated hospitals (Japan) | Controls = 20 (50%), 67 ± 5.9 MSA = 50 (50%), 65.9 ± 8.7 | MSA = second consensus statement on the diagnosis of multiple system atrophy | MSA = 5.0 ± 3.0 | UMSARS I = 20.8 ± 7.7 UMSARS II = 23.6 ± 9.2 |
| Chelban 2022 [46] 1,3 | Patients and controls from MSA specialist centers (UK (PROSPECT-M study), France, Spain, Germany and Russia) | Controls = 40 (50%), Median (IQR) = 64.5 (59–68) MSA-C = 106 (44%), Median (IQR) = 64 (56–59) MSA-P = 106 (56%), Median (IQR) = 64 (58–69) | MSA = second consensus statement on the diagnosis of multiple system atrophy A subset of participants also had volumetric T1-weighted 3 T MRI. | Median (IQR) MSA = 5 (3–6.5) | MSA-C: UMSARS total = 45.4 ± 16.5 MSA-P: UMSARS total = 46.6 ± 15.9 |
| Li 2022 [39] 1 | Patients from the movement disorders outpatient clinics of the General Hospital of Tianjin Medical University (China) | Controls = 33 (48%), 66.15 ± 4.75 MSA = 13 (43%), 63.11 ± 7.69 PD = 45 (11%), 66.15 ± 4.75 PSP = 8 (37.5%), 70.00 ± 7.31 | MSA = second consensus statement on the diagnosis of multiple system atrophy PD = UK Parkinson’s Disease Society Brain Bank criteria PSP = National Institute for Neurological Disorders and Stroke/Society criteria for PSP | MSA = 2.22 ± 0.67 PD = 4.92 ± 2.47 PSP = 2.33 ± 1.86 | MSA: Hoehn–Yahr stage = 3.63 ± 0.92 MSA: MDS-UPDRSIII = 42.54 ± 18.00 PD: Hoehn–Yahr stage = 1.31 ± 0.53 PD: MDS-UPDRSIII = 17.95 ± 10.70 PSP: Hoehn–Yahr stage = 3.17 ± 0.41 PSP: MDS-UPDRSIII = 25.75 ± 9.87 |
| Quadalti 2021 [48] 1,3 | Patients from Institute of Neurological Sciences of Bologna (ISNB) (Italy) | Controls = 72 (52.8%), 58.1 ± 10.1 MSA = 80 (53.8%), 61.1 ± 8.0 PD = 116 (30.2%), 59.9 ± 10.3 LBD = 64 (29.7%), 73.8 ± 5.7 PSP/CBS = 58 (46.5%), 71.2 ± 6.8 | MSA = second consensus statement on the diagnosis of multiple system atrophy PD = MDS-PD criteria PSP/CBS = MDS criteria LBD = Fourth consensus report of the DLB Consortium Diagnostic investigations included, when available MRI, DaTSCAN, (MIBG)-SPECT, PSG | Months MSA = 51.2 ± 31.9 PD = 73.9 ± 52.6 LBD = 75.9 ± 90.9 PSP/CBS = 50.8 ± 31.2 | MSA: Hoehn–Yahr = 3.1 ± 2.9 MSA: UPDRS III = 33.6 ± 11.9 PD: Hoehn–Yahr = 1.5 ± 0.6 PD: UPDRS III = 16.3 ± 8.5 LBD: Hoehn–Yahr = 2.1 ± 0.7 LBD: UPDRS III = 33.9 ± 11.2 PSP/CBS: Hoehn–Yahr = 2.7 ± 0.8 PSP/CBS: UPDRS III = 38.9 ± 25.4 |
| Canaslan 2021 [52] 3 | (Finland) | Controls = 35 (28%), 60.75 ± 13.39 MSA = 26 (53%), 65.15 ± 11.12 PD = 29 (31%), 66.38 ± 11.44 LBD = 23 (30%), 71.17 ± 10.13 | MSA = first and second consensus statement on the diagnosis of multiple system atrophy PD = MDS-PD criteria LBD = fourth consensus report of the DLB Consortium | ||
| Schulz 2021 [45] 2,3 | Samples collected at the Paracelsus-Elena-Klinik, Kassel (Germany) | Controls = 20 (30%), 68.7 ± 6.38 MSA = 17 (23%), 66.47 ± 10.02 PD = 151 (34%), 69.36 ± 9.55 LBD = 45 (31%), 70.51 ± 6.51 CBD = 16 (50%), 69.25 ± 5.60 PSP = 38 (34%), 69.32 ± 6.57 | MSA = second consensus statement on the diagnosis of multiple system atrophy PD = UK Parkinson’s Disease Society Brain Bank criteria LBD = fourth consensus report of the DLB Consortium PSP = MDS criteria CBD = Armstrong 2013 criteria for the diagnosis of corticobasal degeneration Also 1.5-tesla (MRI) to determine structural, quantitative levodopa testing, smell identification test | MSA: UPDRS III = 31 ± 6 PD: UPDRS III = 30 ± 17 PD: H&Y stage (median (IQR)) = 3 (1.5) LBD: UPDRS III = 27 ± 10 | |
| Singer 2020 [53] 3 | Subjects were enrolled as a part of a prospective, longitudinal study of synucleinopathies (MSA, PD, and controls; Mayo Longitudinal Synucleinopathy Biomarker Study, NS092625) and prospective studies of dementia (DLB; Mayo Alzheimer’s Disease Research Center, AG016574 and Longitudinal Imaging Bio-markers of Disease Progression in DLB, NS100620) (USA) | Controls = 29 (52%), 58.5 ± 7.4 MSA = 62 (31%), 59.2 ± 6.8 PD = 16 (6%), 65.9 ± 6.0 LBD = 13 (0%), 66.8 ± 8.3 | MSA = second consensus statement on the diagnosis of multiple system atrophy PD = MDS-PD criteria | Median (IQR) MSA = 3.2 (2.4–4.4) PD = 7.5 (5.4–10.8) LBD = 5.1 (4.2–8.5) | MSA: UMSARS total = 31.0 ± 9.1 |
| Lin 2019 [51] 1 | Patients were recruited from the National Taiwan University Hospital, a tertiary referral center in Taiwan. | Controls = 40 (45%), 68.6 ± 9.5 MSA = 22 (47.7%), 65.8 ± 7.4 PD = 116 (43.2%), 68.5 ± 11.2 | MSA = second consensus statement on the diagnosis of multiple system atrophy PD = UK Parkinson’s Disease Society Brain Bank criteria | MSA = 5.2 ± 3.1 PD = 7.8 ± 6.5 | MSA: Hoehn–Yahr stages (“off”) = 4.8 ± 2.4 MSA: UPDRS part III scores (“off”) = 32.6 ± 10.1 PD: Hoehn–Yahr stages (“off”) = 3.1 ± 1.2 PD: UPDRS part III scores (“off”) = 25.1 ± 10.6 |
| Marques 2019 [42] 2,3,** | Patients from a study performed at the Radboud University Medical Center Nijmegen from the movement disorders outpatient clinic (the Netherlands) | Controls = 53 (45%), 57.5 ± 9.8 MSA = 22 (31.8%), 60.7 ± 7.1 PD = 55 (30.9%), 57 ± 10 PSP = 7 (42.8%), 68.9 ± 4.1 | MSA = second consensus statement on the diagnosis of multiple system atrophy PD = UK Parkinson’s Disease Society Brain Bank criteria PSP = National Institute of Neurological Disorders and Stroke and Society for Progressive Supranuclear Palsy criteria for PSP Also (brain MRI, IBZM (iodobenzamide)-SPECT, anal sphincter EMG) | Months MSA = 33.9 ± 26.4 PD = 34.2 ± 26.3 PSP = 35.7 ± 19.2 | MSA: H&Y score = 2.4 ± 1.0 MSA: UPDRS score = 29 ± 13.9 PD: H&Y score = 2.0 ± 0.6 PD: UPDRS score = 26.5 ± 11.9 PSP: H&Y score = 3.3 ± 0.7 PSP: UPDRS score = 35.9 ± 15.6 |
| Hall 2018 [31] 3 | Patients from the Clinic of Neurology, Skåne University Hospital, as part of the Swedish BioFINDER Study (Sweden) | Controls = 50 (56%), 65.3 ± 8.6 MSA = 24 (50%), 63.8 ± 8.0 PD = 131 (39%), 64.9 ± 10.6 PSP = 14 (64%), 71.5 ± 6.2 | MSA = second consensus statement on the diagnosis of multiple system atrophy PD = NINDS criteria for PD PSP = National Institute of Neurological Disorders and Stroke and Society for Progressive Supranuclear Palsy criteria for PSP | MSA = 7.2 ± 4.5 PD = 5.5 ± 4.8 PSP = 5.7 ± 2.3 | MSA: Hoehn–Yahr score = 4.1 ± 0.9 MSA: UPDRS part III scores = 45.1 ± 19.2 PD: Hoehn–Yahr score = 2.0 ± 0.8 PD: UPDRS part III scores = 17.1 ± 10.5 PSP: Hoehn–Yahr score = 4.1 ± 0.6 PSP: UPDRS part III scores = 45.4 ± 14.2 |
| Hansson 2017 [35] 3 | 3 cohorts: Cohort 1 (Lund cohort) => In this convenience series, study participants were recruited at the Neurology Clinic, Skåne University Hospital, Lund (Sweden) | Controls = 53 (57%), 65 ± 8.4 MSA = 30 (43%), 64 ± 9.1 PD = 171 (37%), 65 ± 10.6 PSP = 19 (57%), 72 ± 5.9 CBD = 5 (80%), 69 ± 4.9 | MSA = first consensus statement on the diagnosis of multiple system atrophy PD = National Institute of Neurological Disorders and Stroke Diagnostic Criteria for PD PSP = NINDS criteria for PSP CBD = Armstrong 2013 Criteria for the diagnosis of corticobasal degeneration | MSA = 6.5 ± 4.3 PD = 5.3 ± 5.2 PSP = 5.9 ± 2.2 CBD = 3.6 ± 1.3 | MSA: Hoehn–Yahr score = 3.9 ± 1.1 MSA: UPDRS part III scores = 42 ± 21.1 PD: Hoehn–Yahr score = 1.9 ± 0.8 PD: UPDRS part III scores = 16.2 ± 10.3 PSP: Hoehn–Yahr score = 4.1 ± 0.7 PSP: UPDRS part III scores = 43 ± 15.1 CBD: Hoehn–Yahr score = 3.5 ± 1.7 CBD: UPDRS part III scores = 38.4 ± 26.7 |
| Cohort 2 = (London cohort) => enrolled at clinics at the National Hospital for Neurology and Neurosurgery, Queen Square (UK) | Controls = 26 (46%), 61 ± 9.5 MSA = 30 (47%), 65 ± 5.7 PD = 20 (45%), 65 ± 8.6 PSP = 29 (44%), 71 ± 6.1 CBD = 12 (83%), 71 ± 7.2 | MSA = first consensus statement on the diagnosis of multiple system atrophy PD = UK Parkinson’s Disease Society Brain Bank criteria PSP = NINDS criteria for PSP CBD = Armstrong 2013 Criteria for the diagnosis of corticobasal degeneration | MSA = 4.3 ± 2.1 PD = 9.3 ± 6 PSP = 5.4 ± 2.8 CBD = 3.8 ± 2.2 | MSA: Hoehn–Yahr score = 3.2 ± 1.0 PD: Hoehn–Yahr score = 2.5 ± 0.9 PSP: Hoehn–Yahr score = 3.9 ± 0.9 CBD: Hoehn–Yahr score = 3.2 ± 1 | |
| Cohort 3 = (early disease cohort) => with early-stage disease (disease duration < 3 years) the Neurological Department, Sahlgrenska University Hospital, Göteborg (Sweden) | MSA = 28 (54%), 66 ± 9.4 PD = 53 (43%), 65 ± 12.2 CBD = 6 (100%), 65 ± 12.3 PSP = 22 (64%), 70 ± 8.2 | MSA = first consensus statement on the diagnosis of multiple system atrophy PD = UK Parkinson’s Disease Society Brain Bank criteria CBD = Lang’s criteria for the diagnosis of corticobasal degeneration | MSA = 4.3 ± 2.1 PD= 9.3 ± 6 PSP = 5.4 ± 2.8 CBD = 3.8 ± 2.2 | MSA: Hoehn–Yahr score = 3.1 ± 0.9 MSA: UPDRS part III scores = 27.6 ± 4 PD: Hoehn–Yahr score = 2 ± 0.6 PD: UPDRS part III scores = 23.4 ± 1.7 PSP: Hoehn–Yahr score = 3.2 ± 1 PSP: UPDRS part III scores = 29.6 ± 4 CBD: Hoehn–Yahr score = 2.8 ± 1 | |
| Herbert 2015 [43] 3 | Patients referred to our tertiary movement disorder center at Radboud University Medical Centre, Nijmegen (The Netherlands) | Discovery Cohort Controls = 57 (35.1%), 57.0 ± 11.5 MSA = 27 (44.4%), 62.6 ± 9.0 PD = 36 (38.9), 60.1 ± 10.4 | MSA = second consensus statement on the diagnosis of multiple system atrophy PD = the accuracy of diagnosis of parkinsonian syndromes in a specialist movement disorder service | Months, Median (Range) MSA = 43.7 (8–96) PD = 43.8 (6–158) | MSA: Hoehn–Yahr score = 2.7 ± 1.2 MSA: UPDRS = 32.5 ± 16.7 PD: Hoehn–Yahr score = 2.0 ± 0.60 PD: UPDRS = 30.3 ± 11.5 |
| Validation Cohort Controls = 56 (42.9%), 55.9 ± 11.1 MSA = 25 (32%), 62.5 ± 9.5 PD = 32 (28.1%) 56.5 ± 11.7 | MSA = second consensus statement on the diagnosis of multiple system atrophy PD = the accuracy of diagnosis of parkinsonian syndromes in a specialist movement disorder service | Months, Median (Range) MSA = 38.0 (12–106) PD = 25.1 (6–84) | MSA: Hoehn–Yahr score = 2.6 ± 0.9 MSA: UPDRS = 32.4 ± 13.7 PD: Hoehn–Yahr score = 1.7 ± 0.4 PD: UPDRS = 20.4 ± 8.9 | ||
| Magdalinou 2015 [47] 3 | Patients from the movement disorders and cognitive clinics at the National Hospital for Neurology and Neurosurgery, Queen Square (UK) | Age = Mean (95%CI) Controls = 30 (50%), 59.8 (56.1–63.4) MSA = 31 (49.4%), 64.3 (62.2–66.4) PD = 31 (35.5%), 67.1 (64–70.2) PSP = 33 (42.4%), 70.3 (68.2–72.4) CBD = 14 (71.4%), 69.8 (65.5–74.1) | MSA = second consensus statement on the diagnosis of multiple system atrophy PSP = NINDS criteria for PSP All patients with parkinsonism underwent structural brain imaging (MRI/CT) | Median (IQR) MSA = 4 (3–6) PD = 8 (5–15) PSP = 5 (3–7) CBD = 3.5 (2–5) | Mean (95%CI) MSA: Hoehn–Yahr score = 3.2 (2.9–3.6) PD: Hoehn–Yahr score = 2.8 (2.4–3.1) PSP: Hoehn–Yahr score = 3.7 (3.4–4.1) CBD: Hoehn–Yahr score = 3.2 (2.8–3.6) |
| Bäckström 2015 [34] 3 | Patients from a population-based incidence study of unselected cases of new onset idiopathic parkinsonism from a defined geographic catchment area (Sweden) | Age = Median Controls = 30 (46.7%), 69.6 MSA = 11 (27.3%), 72.9 PD = 99 (41.4%), 71.3 PSP = 12 (50%), 74.6 | MSA = first consensus statement on the diagnosis of multiple system atrophy PD = UK Parkinson’s Disease Society Brain Bank criteria All patients with PD underwent N-ω-flouropropyl-2β-carbomethoxy-3β-(4-123I-i o dophenyl)nortropane, 123I-ioflupane (FP-CIT) single-photon emission computed tomography, and all demonstrated pathologic uptake. PSP = NINDS criteria for PSP | Months, Median MSA = 25 PD = 16 PSP = 13 | Median MSA: modified Hoehn and Yahr Scale stage = 2.0 PD: modified Hoehn and Yahr Scale stage = 2.0 PSP: modified Hoehn and Yahr Scale stage = 2.5 |
| Hall 2012 [32] 3 | Patients from Skane University Hospital and Sahlgrenska University Hospital. (Sweden) | Age = Median (IQR) Controls = 107 (60.7%), 70 (63–76) MSA = 48 (54.2%) 64 (59–72) PD = 90 (34.4%) 63 (56–71) PSP = 45 (55.6%) 70 (64–74) LDB = 70 (31.4%) 74 (69–81) CBD = 12 (41.7%) 71 (66–76) | MSA = first consensus statement on the diagnosis of multiple system atrophy PD = National Institute of Neurological Disorders and Stroke diagnostic criteria for PD PSP = National Institute of Neurological Disorders and Stroke–Society for Progressive Supranuclear Palsy International Workshop CBD = NINDS criteria LBD = Fourth consensus report of the DLB Consortium | Median (IQR) MSA: Hoehn–Yahr score = 4 (3–5) PD: Hoehn–Yahr score = 2.5 (2–3) PSP: Hoehn–Yahr score = 4 (4–4) CBD: Hoehn–Yahr score = 4.5 (3–5) | |
| Bech 2012 [49] 3 | Patients from the outpatient Movement Disorders clinic at the Department of Neurology, Bispebjerg Hospital, and from the Memory Disorders Clinic, Department of Neurology, Rigshospitalet, Copenhagen University Hospitals. (Denmark) | Age = Median (range) MSA = 10 (40%), 60 (50–770) PD = 22 (40.9%), 56.5 (22–72) PSP = 10 (40%), 59.5 (55–65) LDB = 11 (18%), 70 (54–83) CBD = 3 (33%), 75 (59–76) | MSA = second consensus statement on the diagnosis of multiple system atrophy PD = UK Parkinson’s Disease Society Brain Bank clinical diagnostic criteria PSP = SIC Task Force Appraisal of Clinical Diagnostic Criteria LBD = third report of the DLB Consortium | Median (range) MSA = 5 (2–9) PD = 7 (2–22) PSP = 5 (3–10) LDB = 3 (2–8) CBD = 2 (1–7) | |
| Constantinescu 2010 [54] 3 | Patients referred to the movement disorders team at the Neurology Department, Sahlgrenska University Hospital, Gothenburg (Sweden) | Controls = 59 (44%) MSA = 21 (62%) 57.4 PD = 10 (30%) 49.8 PSP = 14 (43%) 60.7 CBD = 5 (27%) 69.1 | MSA = first consensus statement on the diagnosis of multiple system atrophy PD = UK Parkinson’s Disease Society Brain Bank criteria PSP = National Institute of Neurological Disorders and Stroke and Society for Progressive Supranuclear Palsy CBD = according to Lang et al. | MSA = 3.2 PD = 7.4 PSP = 2.9 CBD = 3.4 | MSA: mean Hoehn–Yahr score = 3.3 PD: mean Hoehn–Yahr score = 2.9 PSP: mean Hoehn–Yahr score = 2.8 CBD: mean Hoehn–Yahr score = 3.3 |
| Abdo 2007 [41] 3 | Patients referred to the movement disorder clinic of the Department of Neurology at the Radboud University Nijmegen Medical Centre (The Netherlands) | Controls = 106, 52.8 ± 9.2 MSA-P = 19, 59.6 ± 6.6 PD = 31, 52.5 ± 10.8 | MSA = SIC Task Force appraisal of clinical diagnostic criteria for parkinsonian disorders PD = UK Parkinson’s Disease Society Brain Bank criteria All patients had a brain MRI or CT-scan, some underwent an anal sphincter EMG and ancillary investigations to visualize the integrity of the pre-synaptic dopaminergic system ([123I]-CIT) or post-synaptic dopaminergic system (123IBZM-SPECT). | MSA = 4.1 ± 2.1 PD = 3.6 ± 2.8 | Median (IQR) MSA: modified Hoehn–Yahr score = 2.5 (2.0–3.0) PD: modified Hoehn–Yahr score = 1.5 (1.5–2.0) |
| Holmberg 2001 [33] 3 | Department of Neurology, University of Gothenburg, Sahlgrenska University Hospital (Sweden) | MSA = 36 (36%), 63.1 ± 9.4 PD = 35 (42%), 61.5 ± 10.5 PSP = 14 (35%), 68.5 ± 4.6 | MSA = MDS criteria PD = UK Parkinson’s Disease Society Brain Bank criteria PSP = SIC Task Force Appraisal of Clinical Diagnostic Criteria MRI or a CT scan, a levodopa test with PLM registrations were performed | MSA = 4.7 ± 3.1 PD = 10.6 ± 6.9 PSP = 4.5 ± 2.5 | |
| Holmberg 1998 [30] 3 | Department of Neurology, University of Gothenburg, Sahlgrenska University Hospital (Sweden) | MSA = 10 (50%), 63.1 ± 9.2 PD = 19 (42%), 64.6 ± 7.8 PSP = 12 (66%), 66.5 ± 4.6 | MSA = MDS criteria PD = UK Parkinson’s Disease Society Brain Bank criteria PSP = Criteria proposed by Golbe and Davis MRI or a CT scan | MSA = 5.4 ± 1.6 PD = 14.3 ± 9 PSP = 5.9 ± 3.7 |
| Author—Publication Year | Sample Type | MSA | CONTROLS | PD | Diagnostic Metrics (Cut-Off Values = pg/mL) | ||||||
|---|---|---|---|---|---|---|---|---|---|---|---|
| N | Mean * | SD * | N | Mean * | SD * | N | Mean * | SD * | |||
| Katzdobler 2024 [44] | Plasma | 47 | 24.3 | 8.8 | 21 | 11.4 | 4.8 | 23 | 10.9 | 9.0 | MSA vs. PD -AUC = 0.90 -Threshold = 14.07 |
| CSF | 15 | 4580.1 | 2254.2 | 14 | 703.4 | 262.2 | 14 | 748.1 | 350.8 | MSA vs. PD -AUC = 0.97 -Threshold = 1835.0 | |
| Chen 2025 [36] | Plasma | 30 | 63.5 | 45.8 | 30 | 22.5 | 15.3 | 56 | 33.9 | 20.6 | MSA vs. HC -AUC = 0.916 -Sensitivity = 93.3% -Specificity = 80.0% MSA vs. PD -AUC = 0.795 -Sensitivity = 83.3% -Specificity = 66.1% |
| Liu 2024 [37] | Serum | 102 | (Median) 356 | (IQR) 260–455 | 54 | (Median) 118 | (IQR) 102–141 | 62 | (Median) 165 | (IQR) 121–217 | MSA vs. HC -AUC = 0.935 -Threshold = 154.5 -Sensitivity = 99% -Specificity = 85.2% MSA vs. PD -AUC = 0.866 -Threshold = 223.5 -Sensitivity = 89.2% -Specificity = 80.6% |
| Peng 2023 [38] | Plasma | 214 | (Median) 35.94 | (IQR) 6.99–171.6 | 211 | (Median) 10.26 | (IQR) 1.96–102.8 | 65 | (Median) 15.95 | (IQR) 3.5–172.51 | MSA vs. HC -AUC = 0.946 -Threshold = 21.50-Sensitivity = 87.4% -Specificity = 92.4% MSA vs. PD -AUC = 0.849 -Threshold = 24.36-Sensitivity = 79.4% -Specificity = 78.5% |
| Guo 2023 [40] | Plasma | 73 | 40.92 | 44.89 | 100 | 13.74 | 8.53 | 28 | 27.26 | 19.79 | MSA vs. HC -AUC = 0.930 -Threshold = 22.68 -Sensitivity = 90% -Specificity = 86% MSA-P vs. PD -AUC = 0.662 -Threshold = 20.24 -Sensitivity = 94% -Specificity = 57% |
| Tokutake 2022 [50] | CSF | 50 | 15,876 | 7779 | 20 | 2208 | 698.3 | MSA vs. HC -AUC = 1 -Threshold = 3827 -Sensitivity = 100% -Specificity = 100% | |||
| Chelban 2022 [46] | Plasma | 212 | (Median) 39.9 | (IQR) 27–48 | 40 | (Median) 9.1 | (IQR) 8.7–9.8 | ||||
| CSF | 105 | (Median) 4329 | (IQR) 2577–5862 | 40 | (Median) 560 | (IQR) 420–855 | |||||
| Li 2022 [39] | Plasma | 13 | 86.53 | 33.74 | 33 | 16.00 | 5.18 | 45 | 20.43 | 14.09 | MSA vs. HC -AUC = 1 -Sensitivity = 100% -Specificity = 100% MSA vs. PD -AUC = 0.983 -Sensitivity = 100% -Specificity = 95.6% MSA vs. PSP -AUC = 0.802 -Sensitivity = 78.3% -Specificity = 87.5% |
| Quadalti 2021 [48] 1 | Plasma | 54 | (Median) 34.0 | (IQR) 24.5–40.8 | 37 | (Median) 8.9 | (IQR) 6.3–12.2 | 62 | (Median) 10.2 | (IQR) 8.1–13.8 | MSA vs. PD -AUC = 0.972 -Threshold = 17.2 -Sensitivity = 90.3% -Specificity = 96.4% |
| CSF | 68 | (Median) 3098.0 | (IQR) 2062.0–4314.0 | 35 | (Median) 514.2 | (IQR) 339.0–650.0 | 116 | (Median) 566.5 | (IQR) 424.0–694.0 | MSA vs. PD -AUC = 0.991 -Threshold = 1196 -Sensitivity = 95.7% -Specificity = 100% | |
| Canaslan 2021 [52] 2 | CSF | 26 | 3839 | (S.E.M) 615.8 | 35 | 810 | (S.E.M) 104.8 | 29 | 960.5 | (S.E.M) 108.8 | Combined MSA/LBD vs. PD -AUC = 0.87 Combined MSA/LBD vs. controls -AUC = 0.92 |
| Schulz 2021 [45] 3 | Serum | 17 | 43.65 | 21.02 | 20 | 17.95 | 8.43 | 151 | 73.75 | 254.70 | MSA vs. HC -AUC = 0.922 MSA vs. PD -AUC = 0.617 MSA vs. PSP -AUC = 0.592 MSA vs. LBD -AUC = 0.661 MSA vs. CBD -AUC = 0.535 |
| CSF | 17 | 2886.59 | 1481.57 | 20 | 922.20 | 446.41 | 151 | 2130.91 | 2174.48 | MSA vs. HC -AUC = 0.925 MSA vs. PD -AUC = 0.712 MSA vs. PSP -AUC = 0.577 MSA vs. LBD -AUC = 0.771 MSA vs. CBD -AUC = 0.574 | |
| Singer 2020 [53] | CSF | MSA vs. HC -AUC = 1 -Threshold = 1024–1225 -Sensitivity = 100% -Specificity = 100% MSA vs. PD/LBD -AUC = 0.97 -Threshold = 1400 -Sensitivity = 97% -Specificity = 90% | |||||||||
| Lin 2019 [51] | Plasma | 22 | 35.8 | 6.2 | 40 | 10.6 | 2.3 | 116 | 17.6 | 2.8 | MSA vs. PD -AUC = 0.802 -Threshold = 24.06 -Sensitivity = 75.3% -Specificity = 80.4% |
| Marques 2019 [42] ** | Serum | 22 | 22.2 | 11 | 53 | 11.5 | 6.5 | 55 | 10.4 | 4.9 | Combined MSA/PSP vs. HC -AUC = 0.88 -Sensitivity = 93% -Specificity = 72% Combined MSA/PSP vs. PD -AUC = 0.91 -Sensitivity = 86% -Specificity = 85% |
| CSF | 21 | 65,487 | 4138 | 32 | 1265 | 551 | 54 | 1249 | 666 | Combined MSA/PSP vs. HC -AUC = 0.89 -Sensitivity = 75% -Specificity = 100% Combined MSA/PSP vs. PD -AUC = 0.90 -Sensitivity = 75% -Specificity = 98% | |
| Hall 2018 [31] | CSF | 24 | 3502.0 | 1932.7 | 50 | 887.2 | 724.0 | 131 | 870.2 | 649.1 | |
| Hansson 2017 [35] | Lund cohort CSF | 28 | 3435 | 1884 | 50 | 887 | 724 | 147 | 896 | 647 | Blood NfL: PD vs. MSA -AUC = 0.91 -Sensitivity = 80% -Specificity = 91% |
| London cohort CSF | 29 | 3004 | 1438 | 26 | 638 | 291 | 5 | 2041 | 2908 | Blood NfL: PD vs. MSA -AUC = 0.87 -Sensitivity = 97% -Specificity = 90% | |
| Herbert 2015 [43] | Discovery Cohort CSF | 27 | 4548 | 3206 | 57 | 1503 | 619 | 36 | 1350 | 915 | |
| Validation Cohort CSF | 25 | 5938 | 4267 | 56 | 1290 | 664 | 32 | 1103 | 442 | ||
| Magdalinou 2015 [47] | CSF | 31 | (Median) 3024 | (IQR) 1984–3818 | 30 | (Median) 560 | (IQR) 444–854 | 31 | (Median) 966 | (IQR) 637–1349 | MSA vs. PSP -AUC = 0.66 |
| Bäckström 2015 [34] | CSF | 11 | (Median) 1215 | (IQR) 881–2052 | 30 | (Median) 878 | (IQR) 667–1120 | 99 | (Median) 1143 | (IQR) 706–1864 | |
| Hall 2012 [32] 4 | CSF | 48 | (Median) 4075 | (IQR) 2270–7105 | 107 | (Median) 860 | (IQR) 610–1185 | 90 | (Median) 980 | (IQR) 670–1320 | PD vs. PSP/MSA/CBD -AUC = 0.93 |
| Bech 2012 [49] (data from Hu et al. [55]) | CSF | 10 | 1038 | 584 | 22 | 175 | 70 | ||||
| Constantinescu 2010 [54] | CSF | 21 | (Median) 1207 | (Range) 250–6030 | 59 | (Median) 250 | (Range) 250–710 | 10 | (Median) 250 | (Range) 250–347 | |
| Abdo 2007 [41] | CSF | 18 | (Median) 33.4 | (IQR) 18.3–62 | 36 | (Median) 5.2 | (IQR) 0–17.4 | 31 | (Median) 6.7 | (IQR) 5.4–7.7 | MSA-P vs. PD -AUC = 0.92 -Threshold = 17.15 -Sensitivity = 83% -Specificity = 90% |
| Holmberg 2001 [33] | CSF | 36 | 864 | 737 | 35 | 210 | 103 | ||||
| Holmberg 1998 [30] | CSF | 10 | 920 | 460 | 19 | 190 | 70 | ||||
Disclaimer/Publisher’s Note: The statements, opinions and data contained in all publications are solely those of the individual author(s) and contributor(s) and not of MDPI and/or the editor(s). MDPI and/or the editor(s) disclaim responsibility for any injury to people or property resulting from any ideas, methods, instructions or products referred to in the content. |
© 2025 by the authors. Licensee MDPI, Basel, Switzerland. This article is an open access article distributed under the terms and conditions of the Creative Commons Attribution (CC BY) license (https://creativecommons.org/licenses/by/4.0/).
Share and Cite
Demiri, S.; Veltsista, D.; Siokas, V.; Spiliopoulos, K.C.; Tsika, A.; Stamati, P.; Chroni, E.; Dardiotis, E.; Liampas, I. Neurofilament Light Chain in Cerebrospinal Fluid and Blood in Multiple System Atrophy: A Systematic Review and Meta-Analysis. Brain Sci. 2025, 15, 241. https://doi.org/10.3390/brainsci15030241
Demiri S, Veltsista D, Siokas V, Spiliopoulos KC, Tsika A, Stamati P, Chroni E, Dardiotis E, Liampas I. Neurofilament Light Chain in Cerebrospinal Fluid and Blood in Multiple System Atrophy: A Systematic Review and Meta-Analysis. Brain Sciences. 2025; 15(3):241. https://doi.org/10.3390/brainsci15030241
Chicago/Turabian StyleDemiri, Silvia, Dimitra Veltsista, Vasileios Siokas, Kanellos C. Spiliopoulos, Antonia Tsika, Polyxeni Stamati, Elisabeth Chroni, Efthimios Dardiotis, and Ioannis Liampas. 2025. "Neurofilament Light Chain in Cerebrospinal Fluid and Blood in Multiple System Atrophy: A Systematic Review and Meta-Analysis" Brain Sciences 15, no. 3: 241. https://doi.org/10.3390/brainsci15030241
APA StyleDemiri, S., Veltsista, D., Siokas, V., Spiliopoulos, K. C., Tsika, A., Stamati, P., Chroni, E., Dardiotis, E., & Liampas, I. (2025). Neurofilament Light Chain in Cerebrospinal Fluid and Blood in Multiple System Atrophy: A Systematic Review and Meta-Analysis. Brain Sciences, 15(3), 241. https://doi.org/10.3390/brainsci15030241