
Validating EEG, MEG and Combined MEG and EEG Beamforming for an Estimation of the Epileptogenic Zone in Focal Cortical Dysplasia

 and
and 
Abstract
1. Introduction
2. Patients and Methods
2.1. Patients
2.2. Data Acquisition
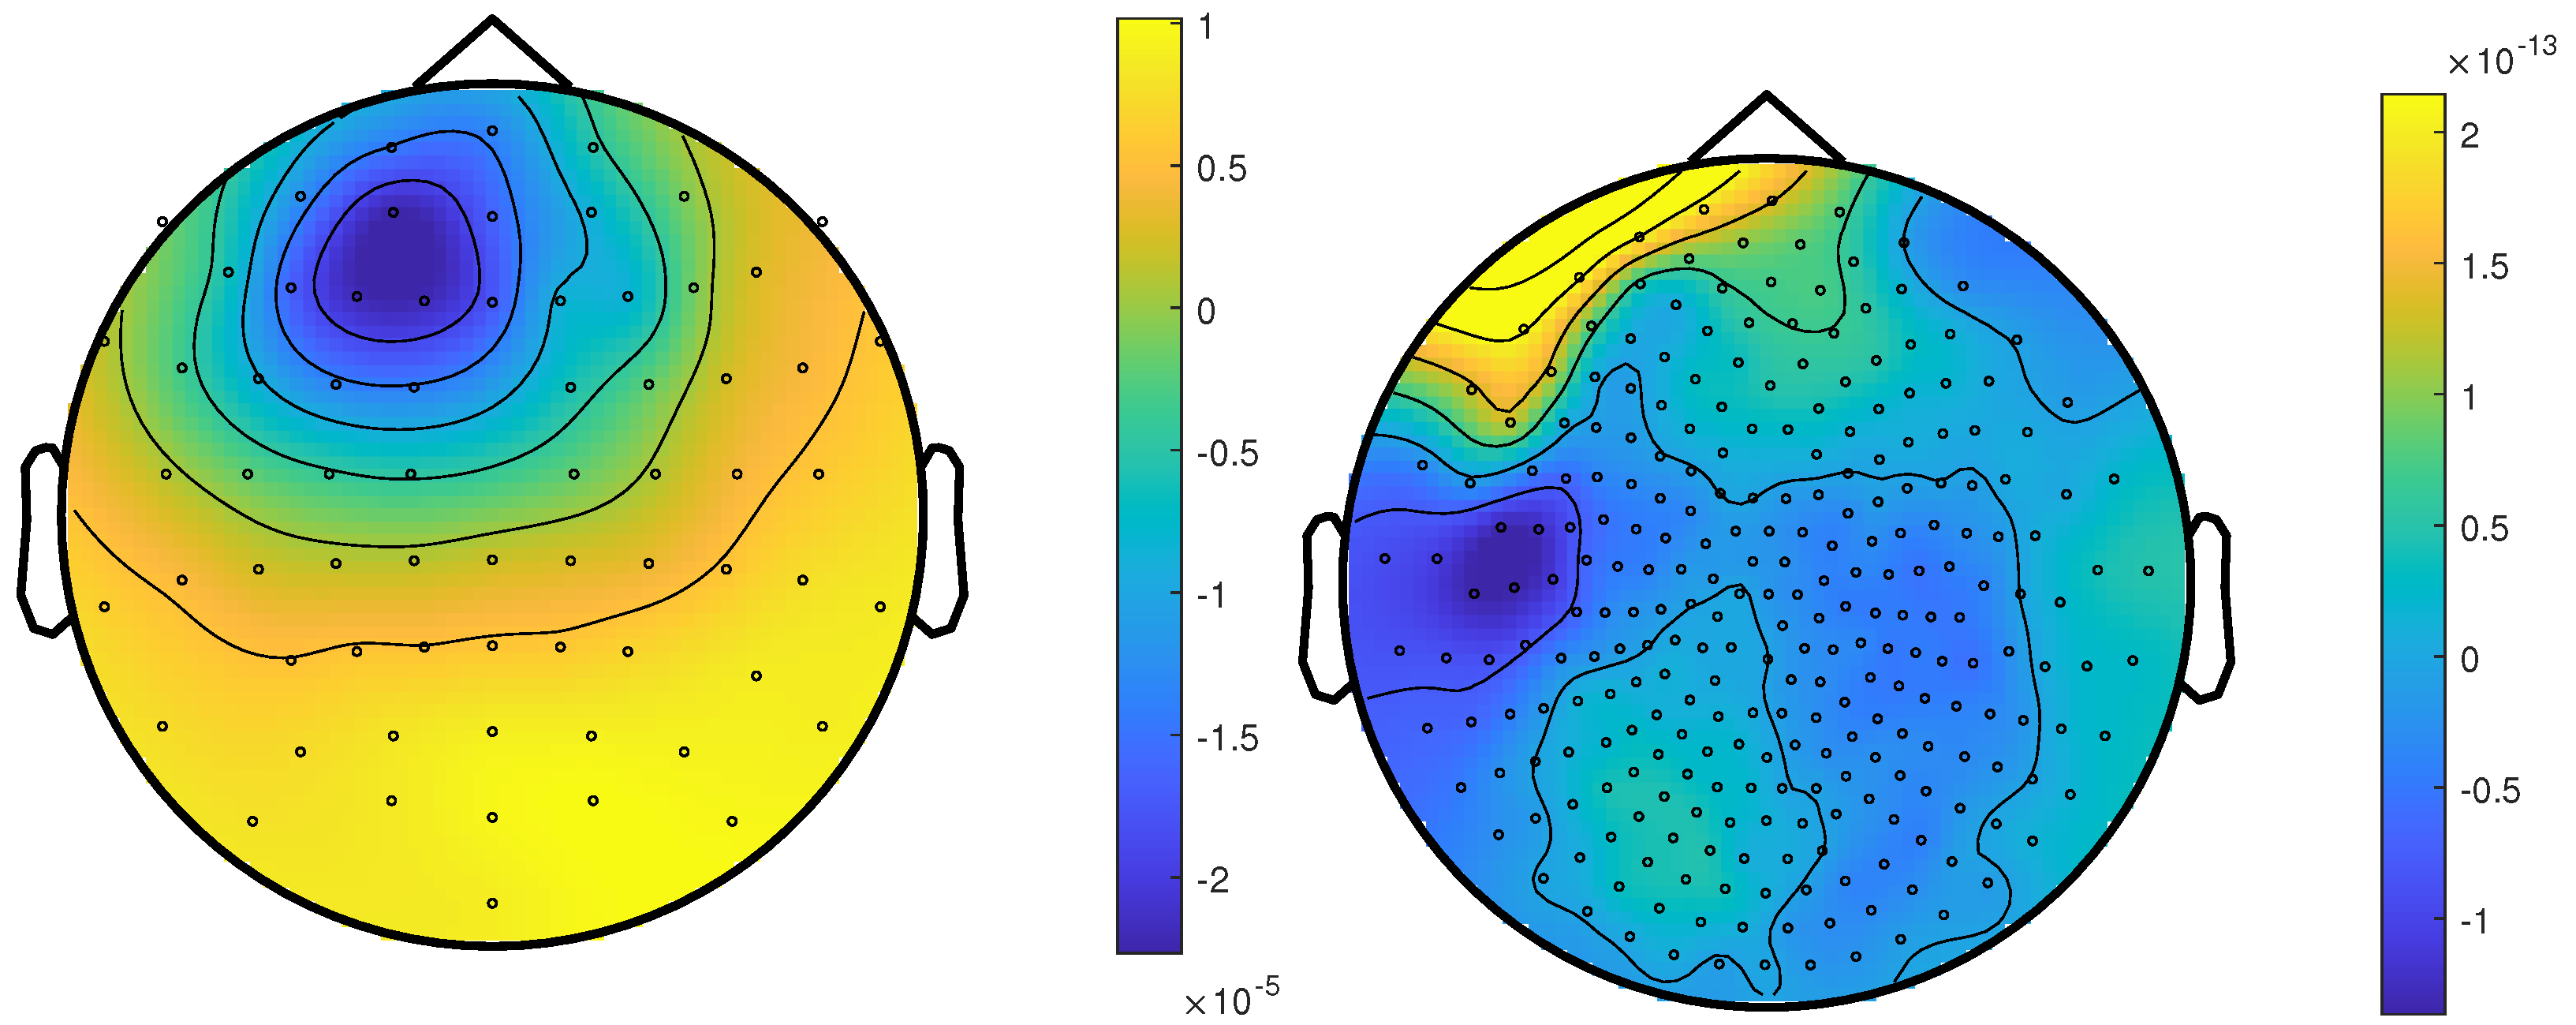
2.2.1. System Setup
2.2.2. Measurement Protocol
2.3. Data Preprocessing
2.3.1. MRI Segmentation and Source Space
2.3.2. Tissue Conductivity
2.3.3. Calibration
2.3.4. Data Preprocessing
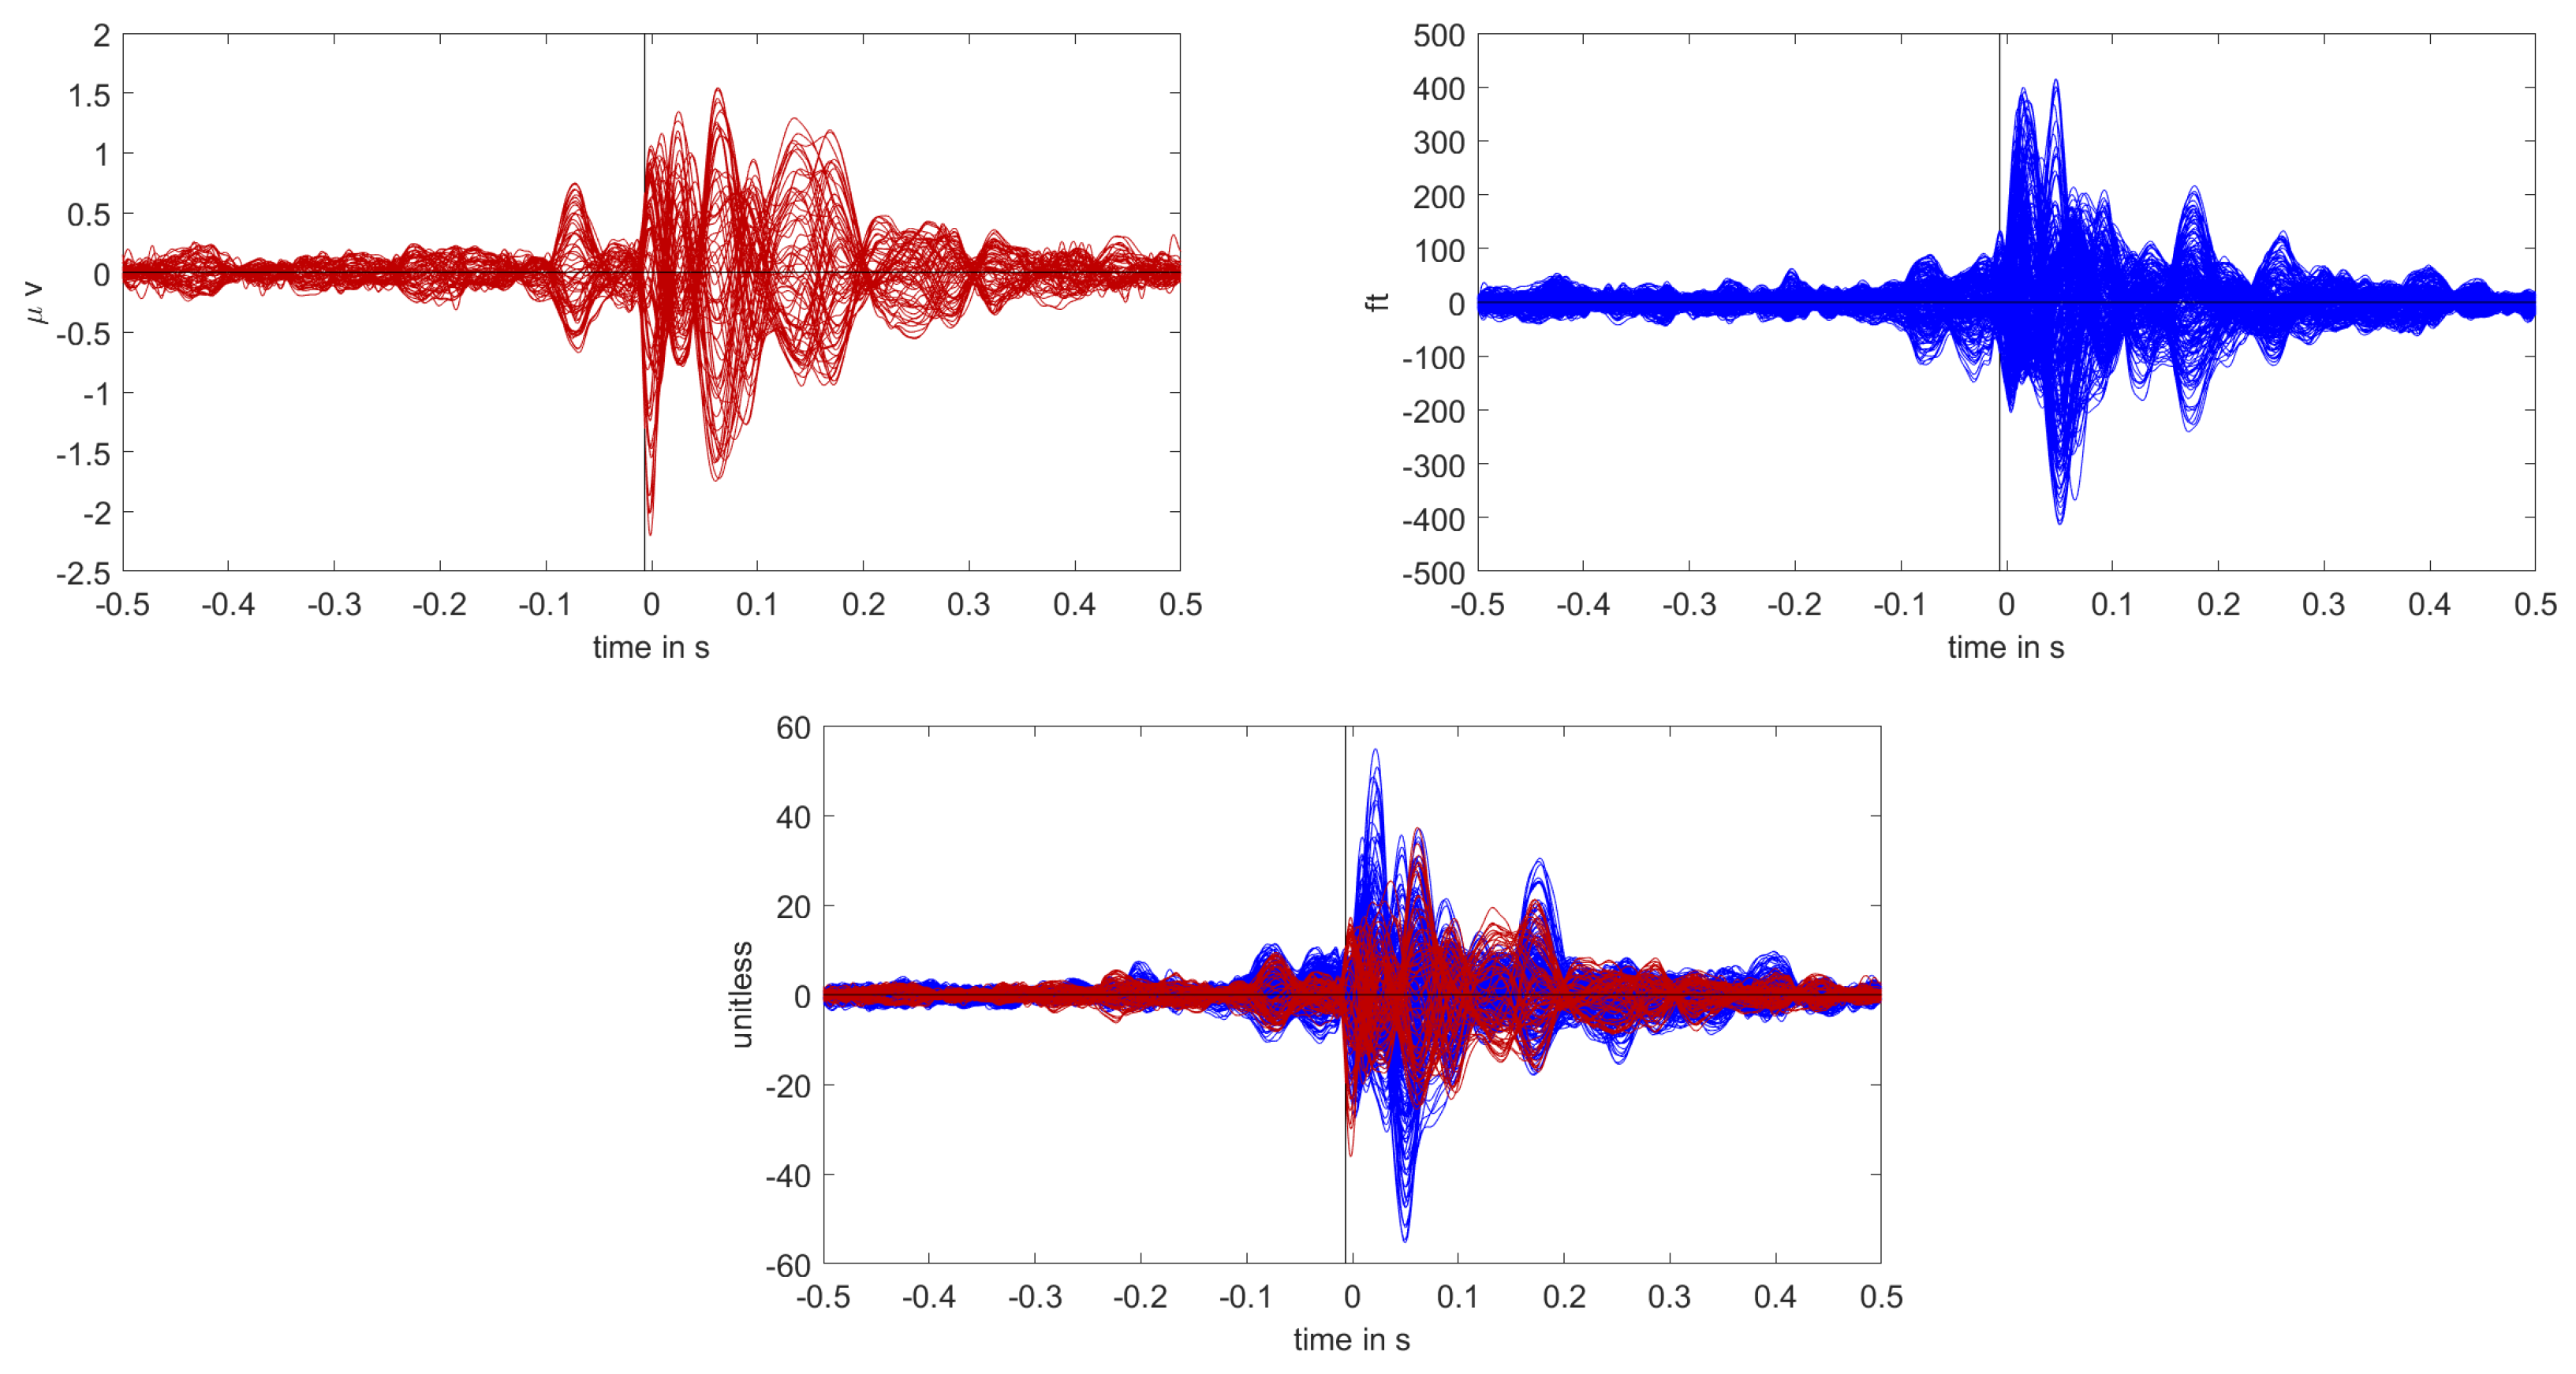
2.3.5. Averaging and Time Points of Interest
2.4. Inverse Problem and Comparison
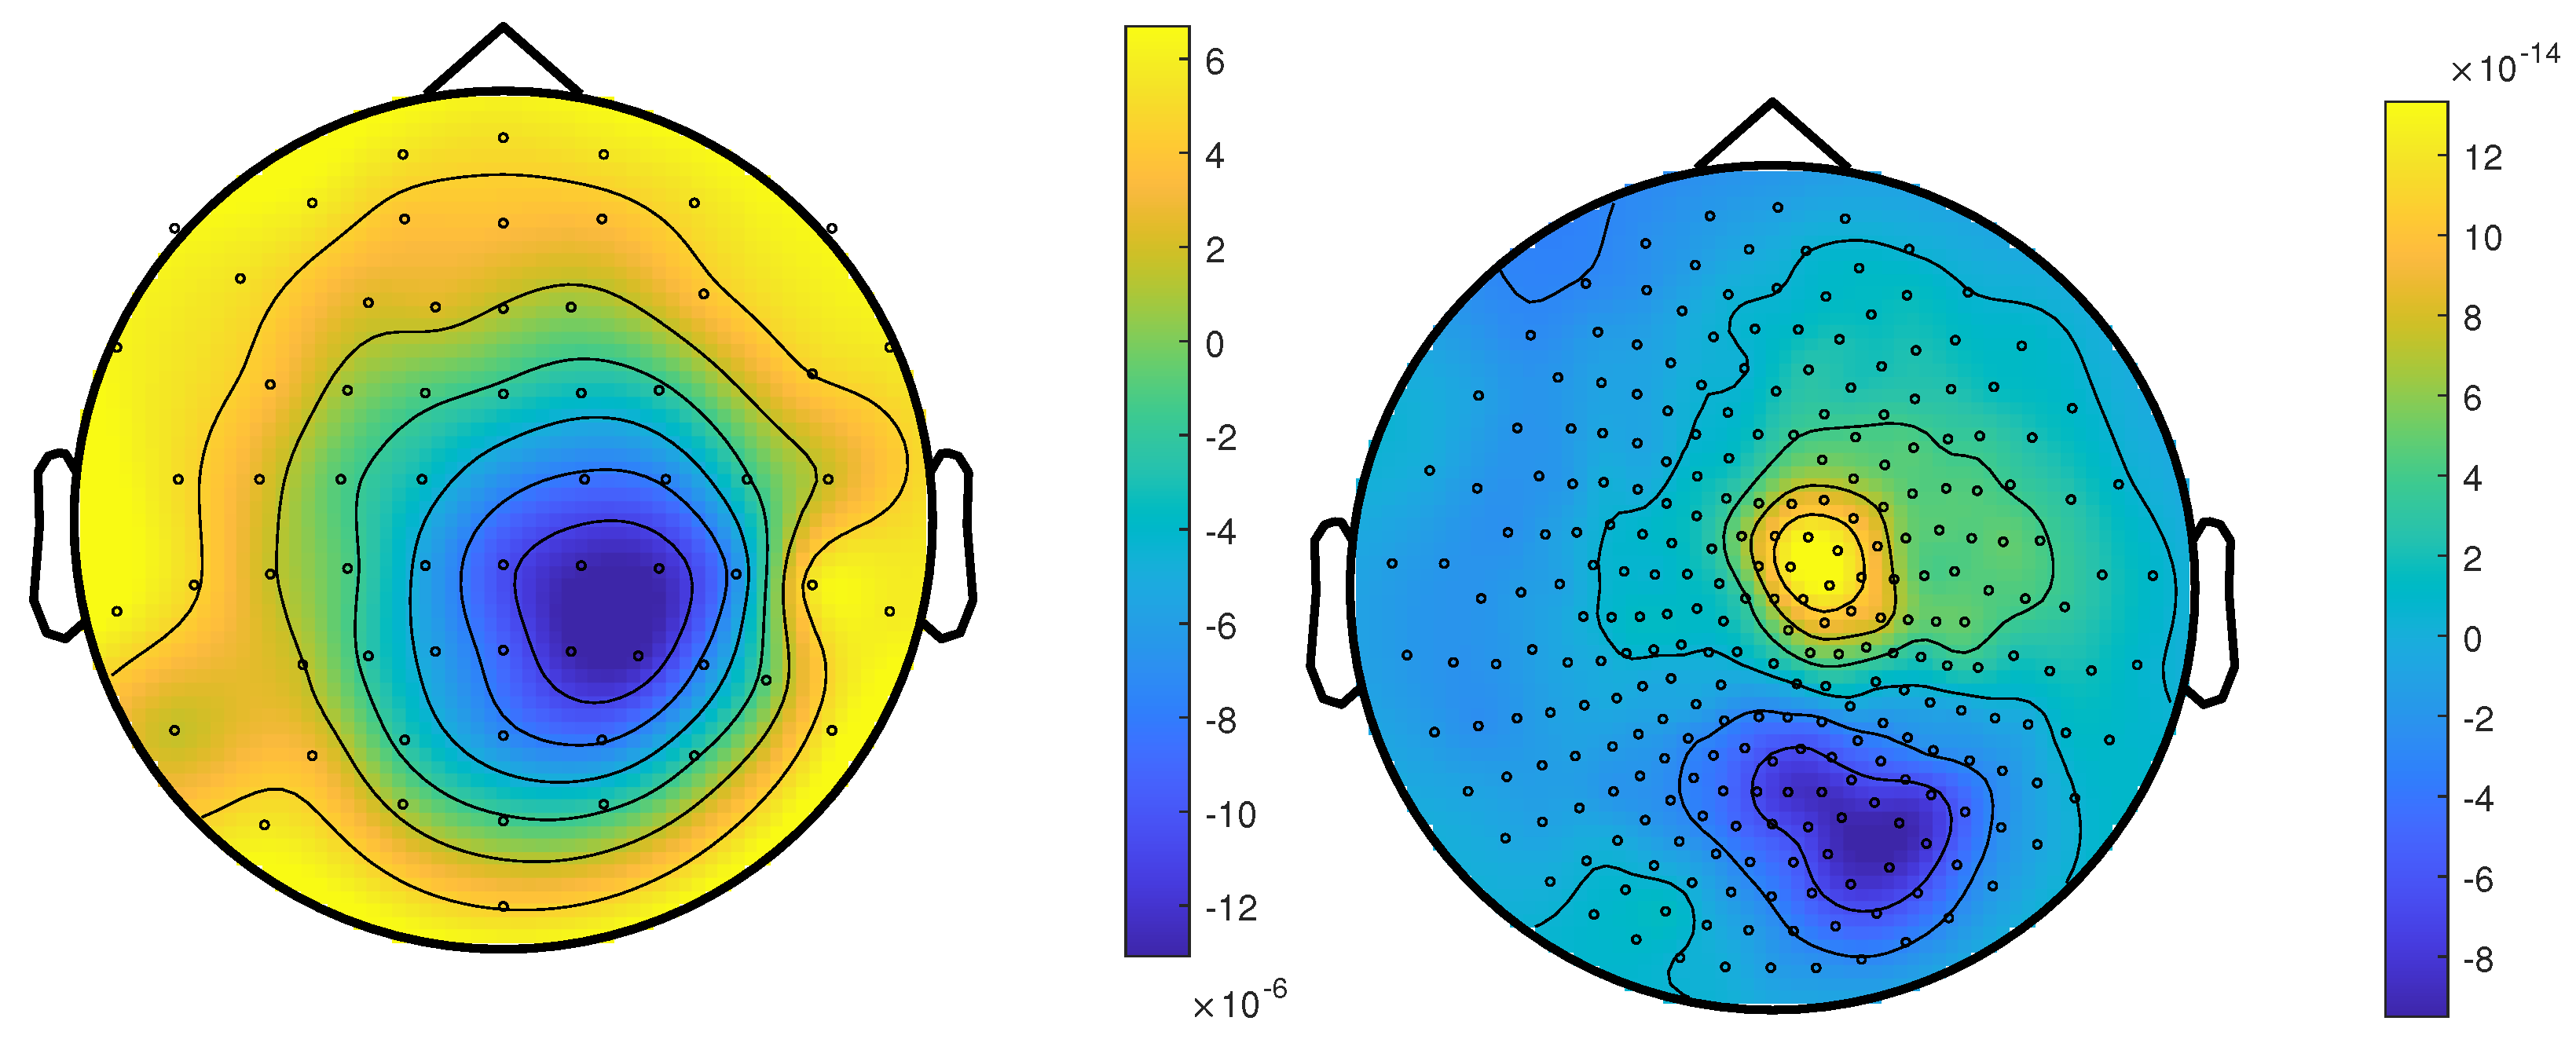
2.4.1. Beamformer Filter Design
2.4.2. Dipole Scan
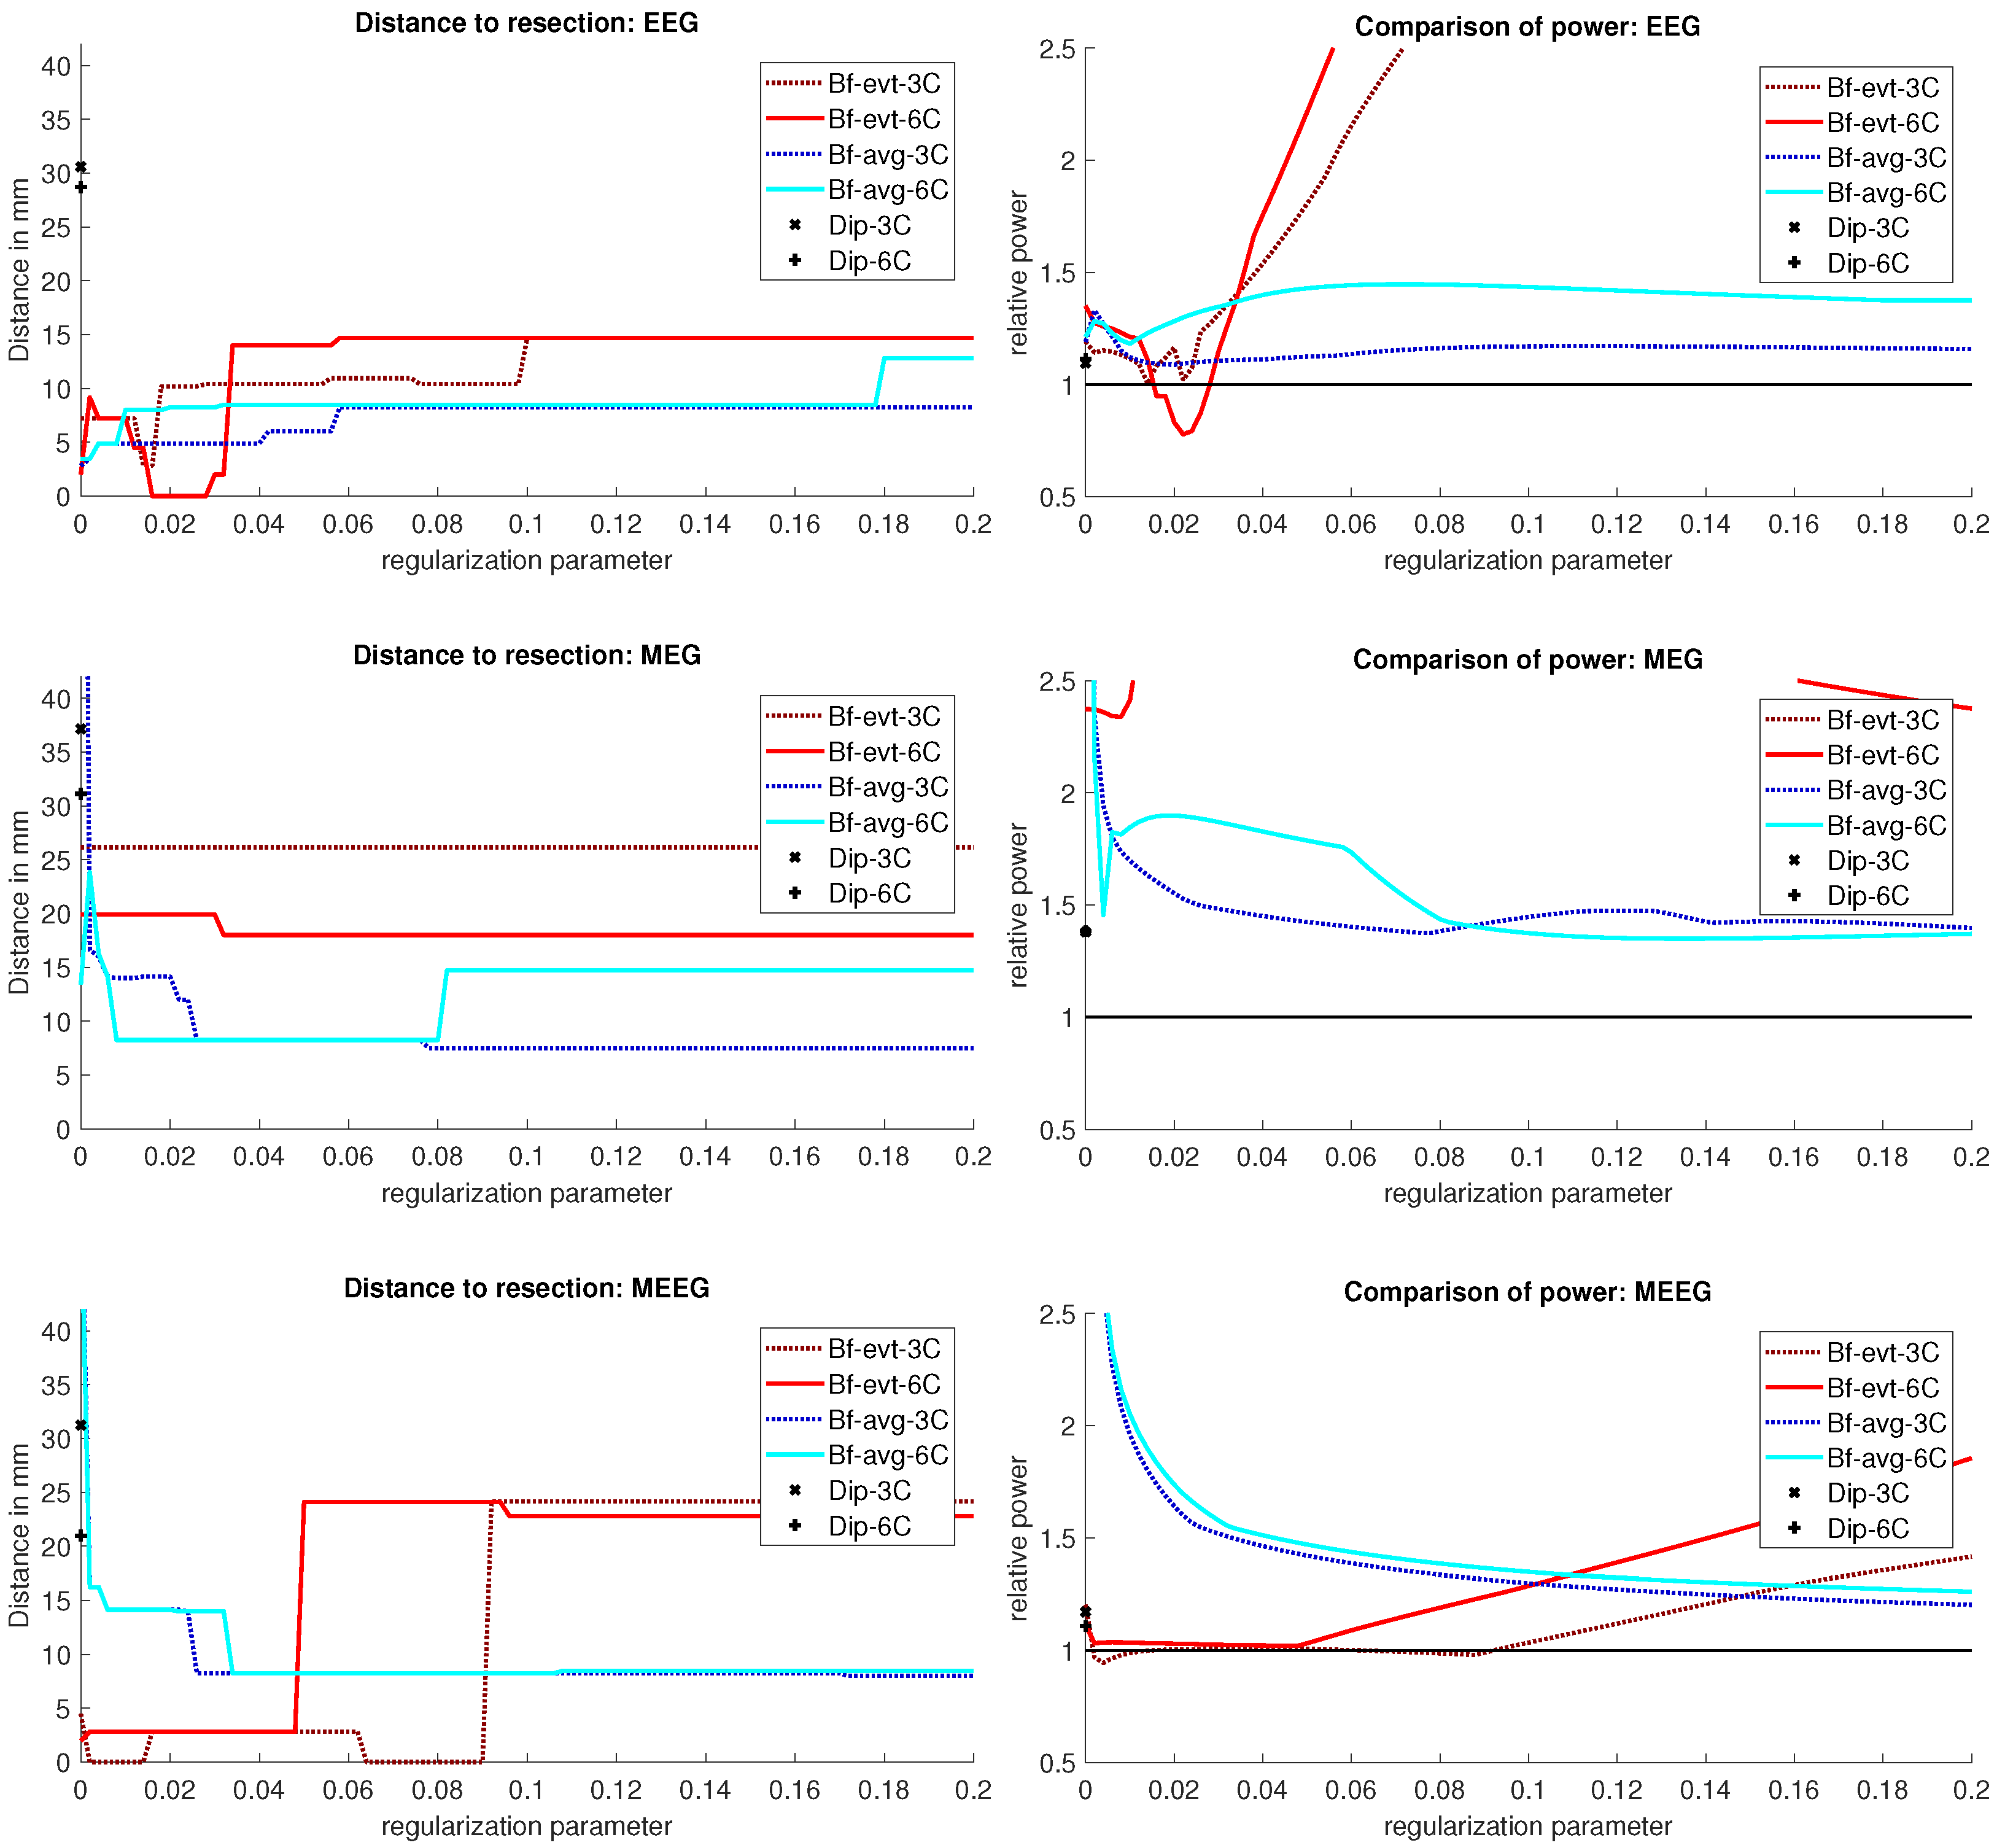
2.4.3. Comparison of Results
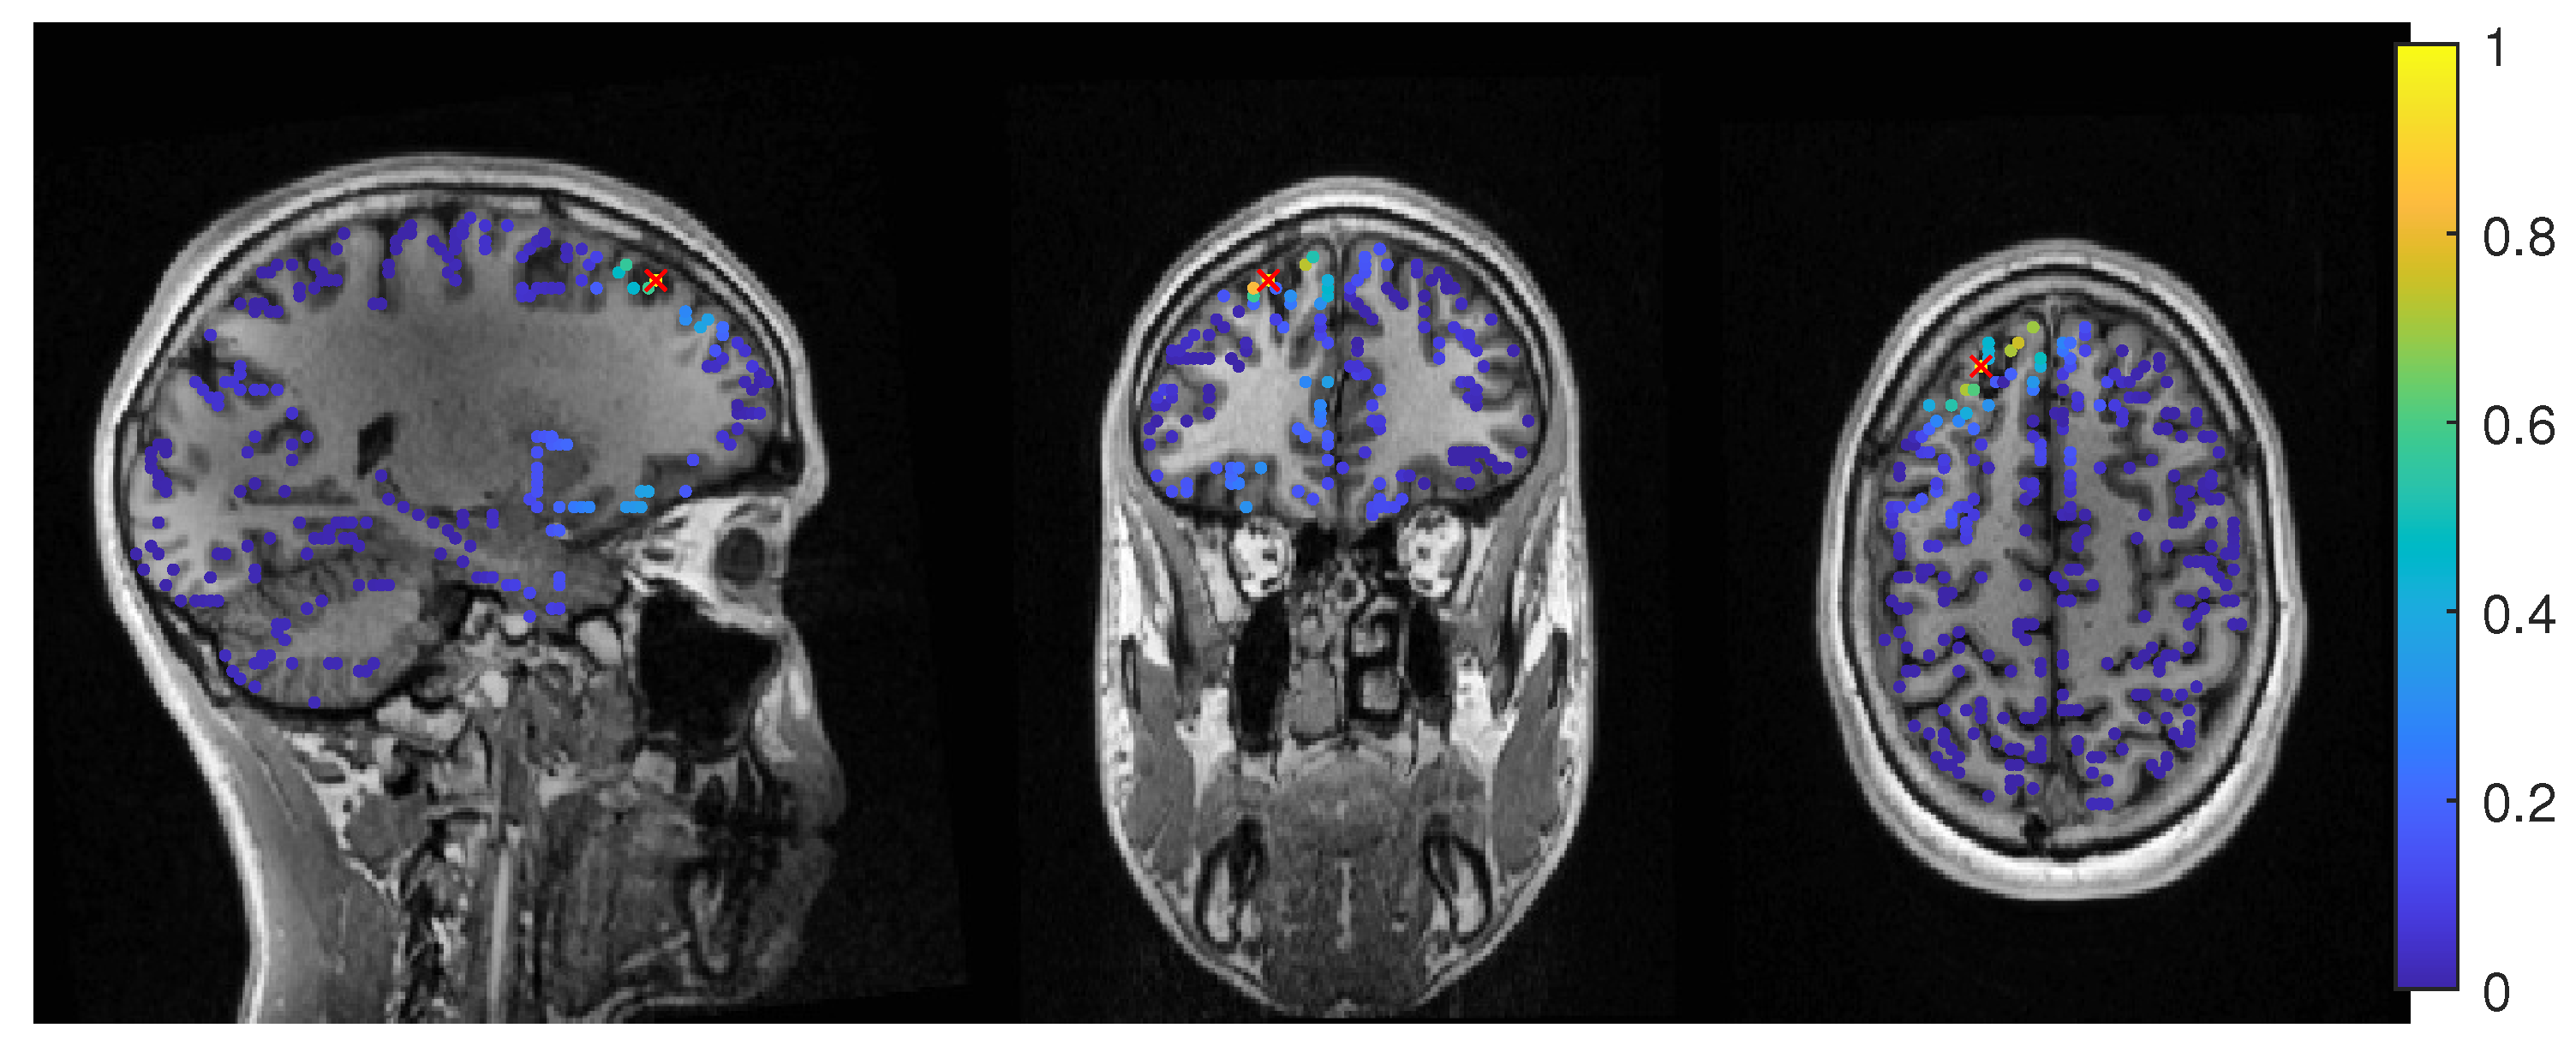
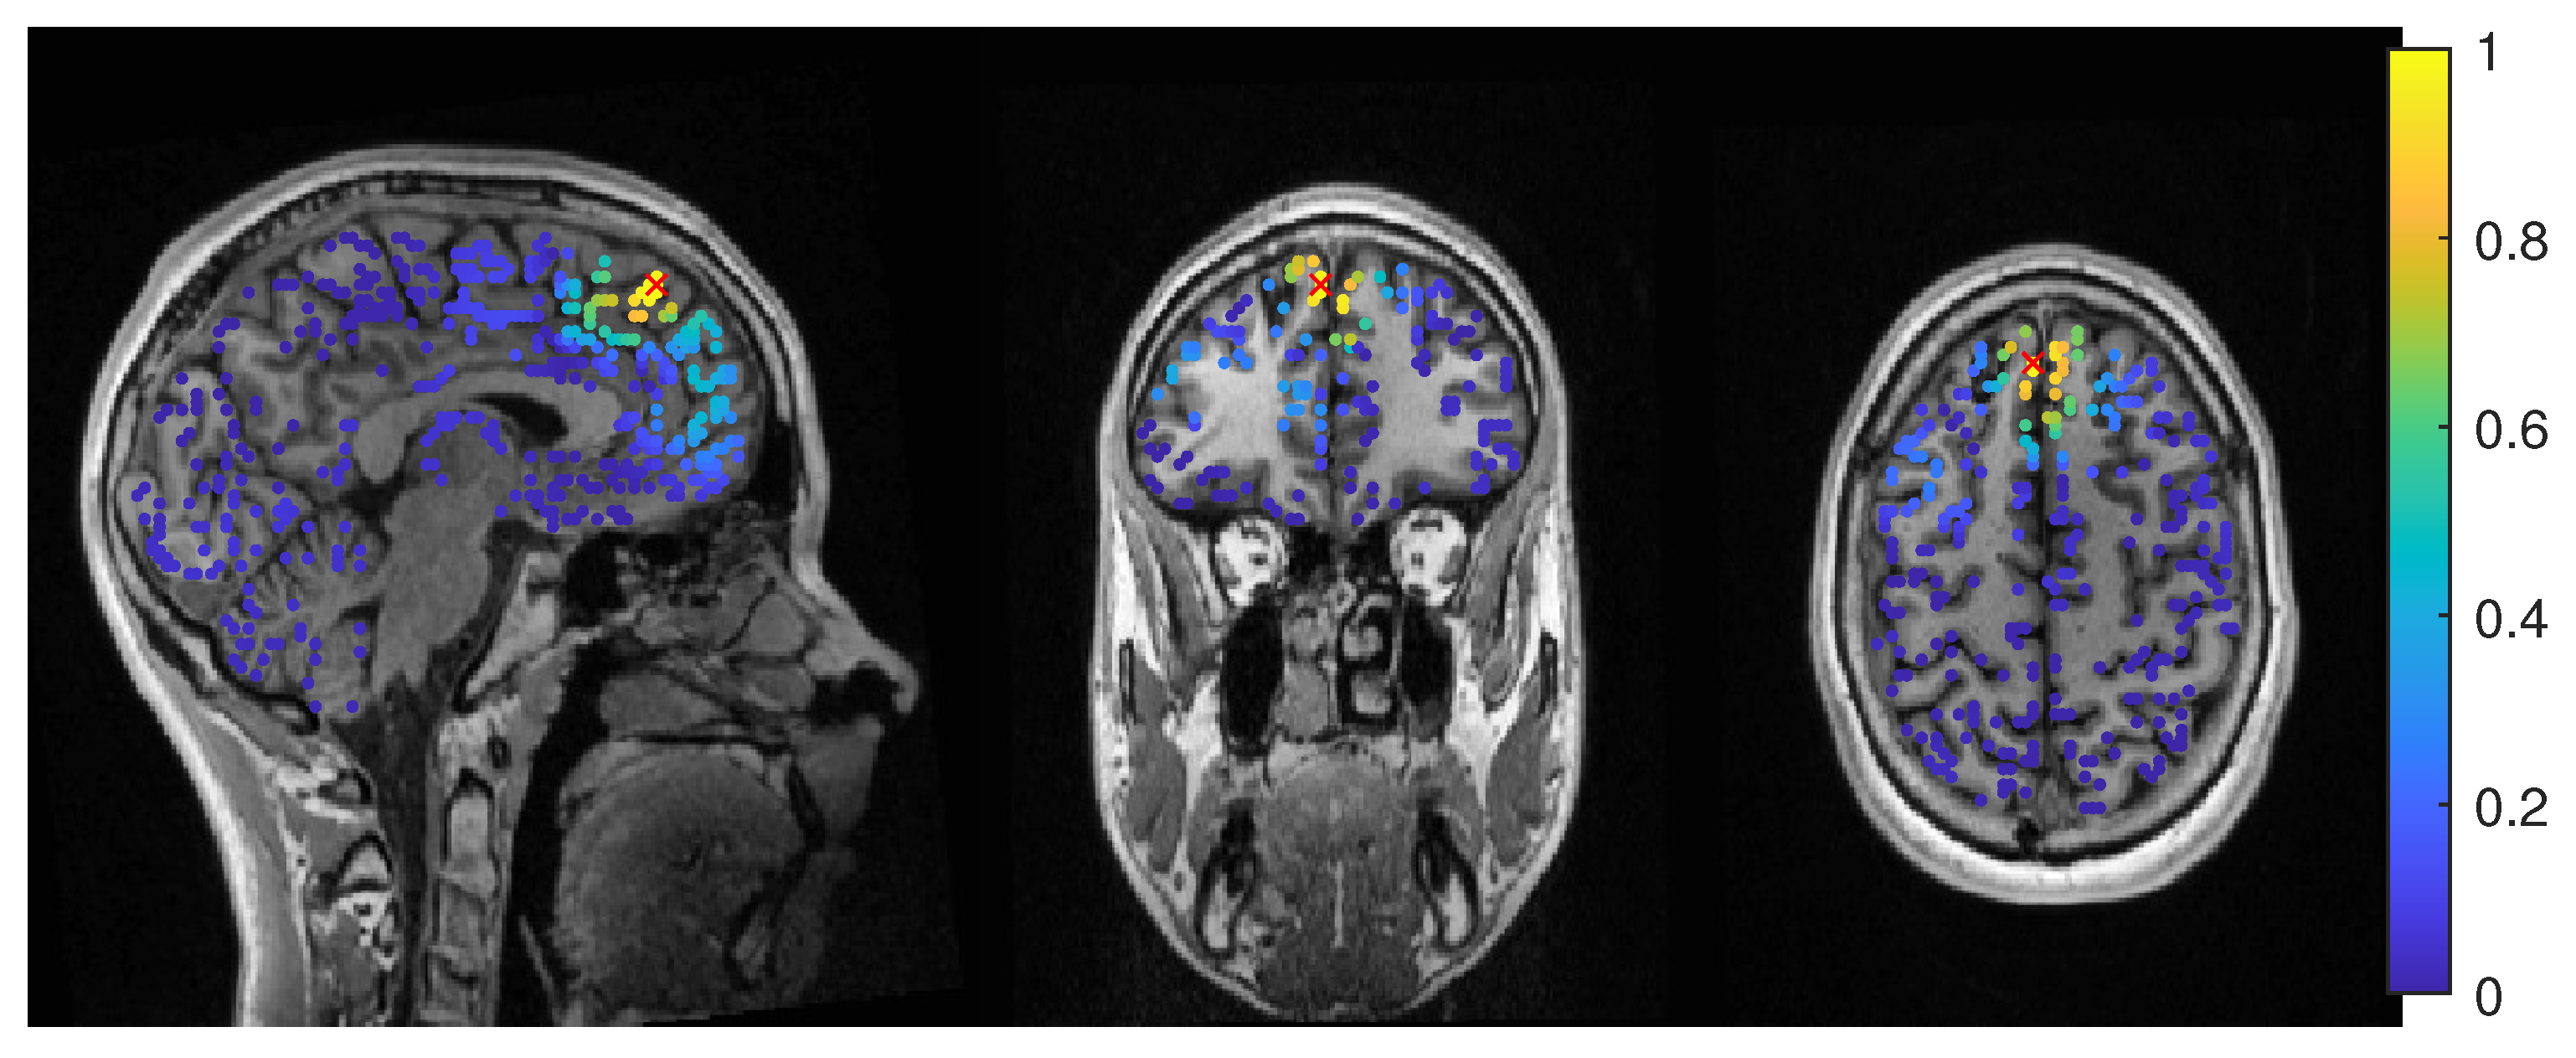
3. Results
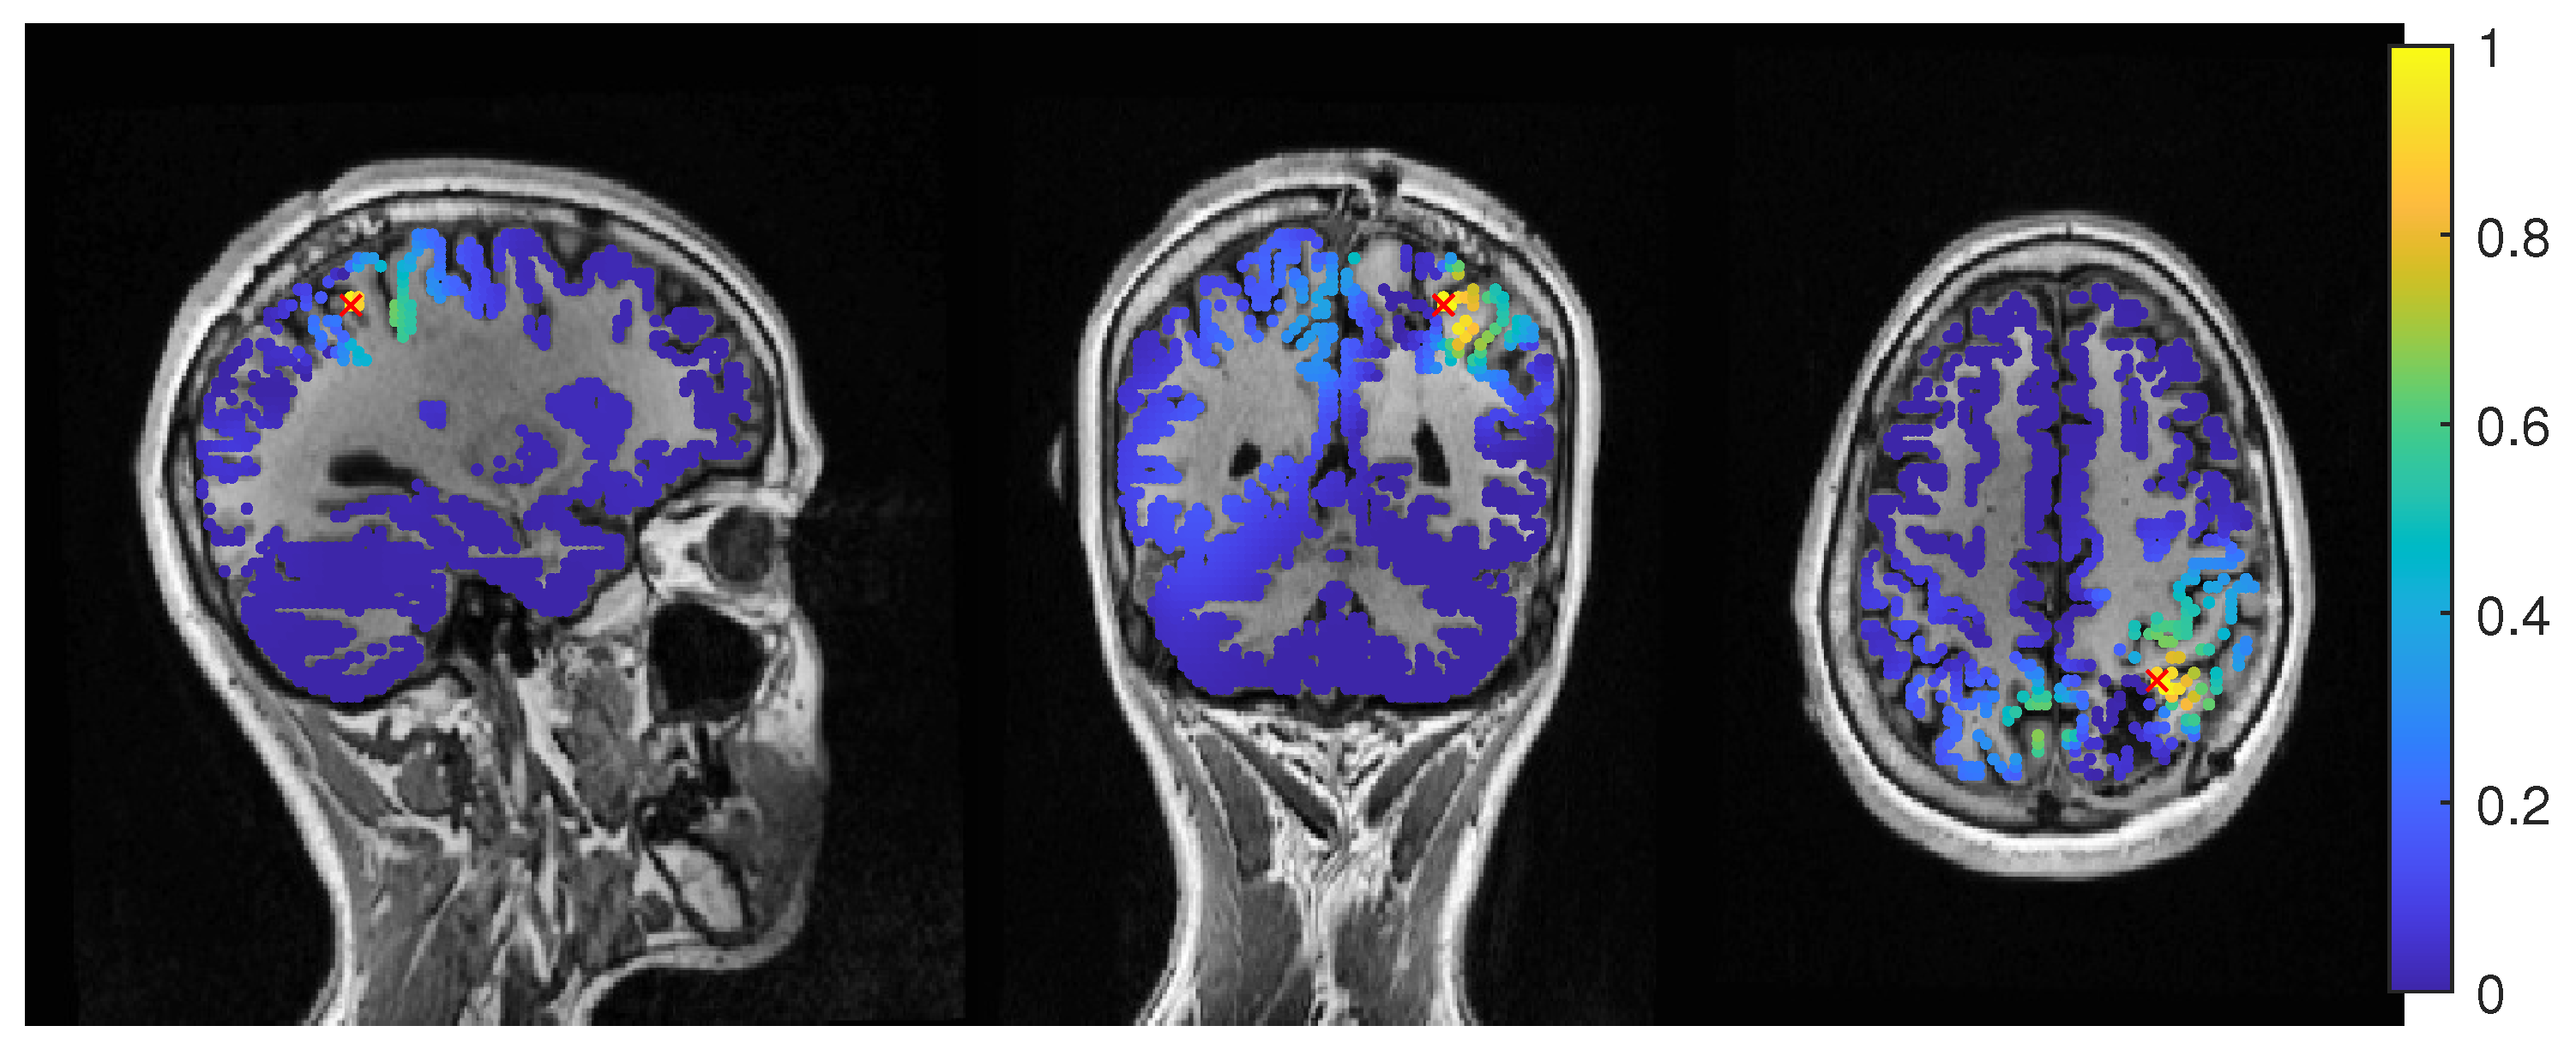
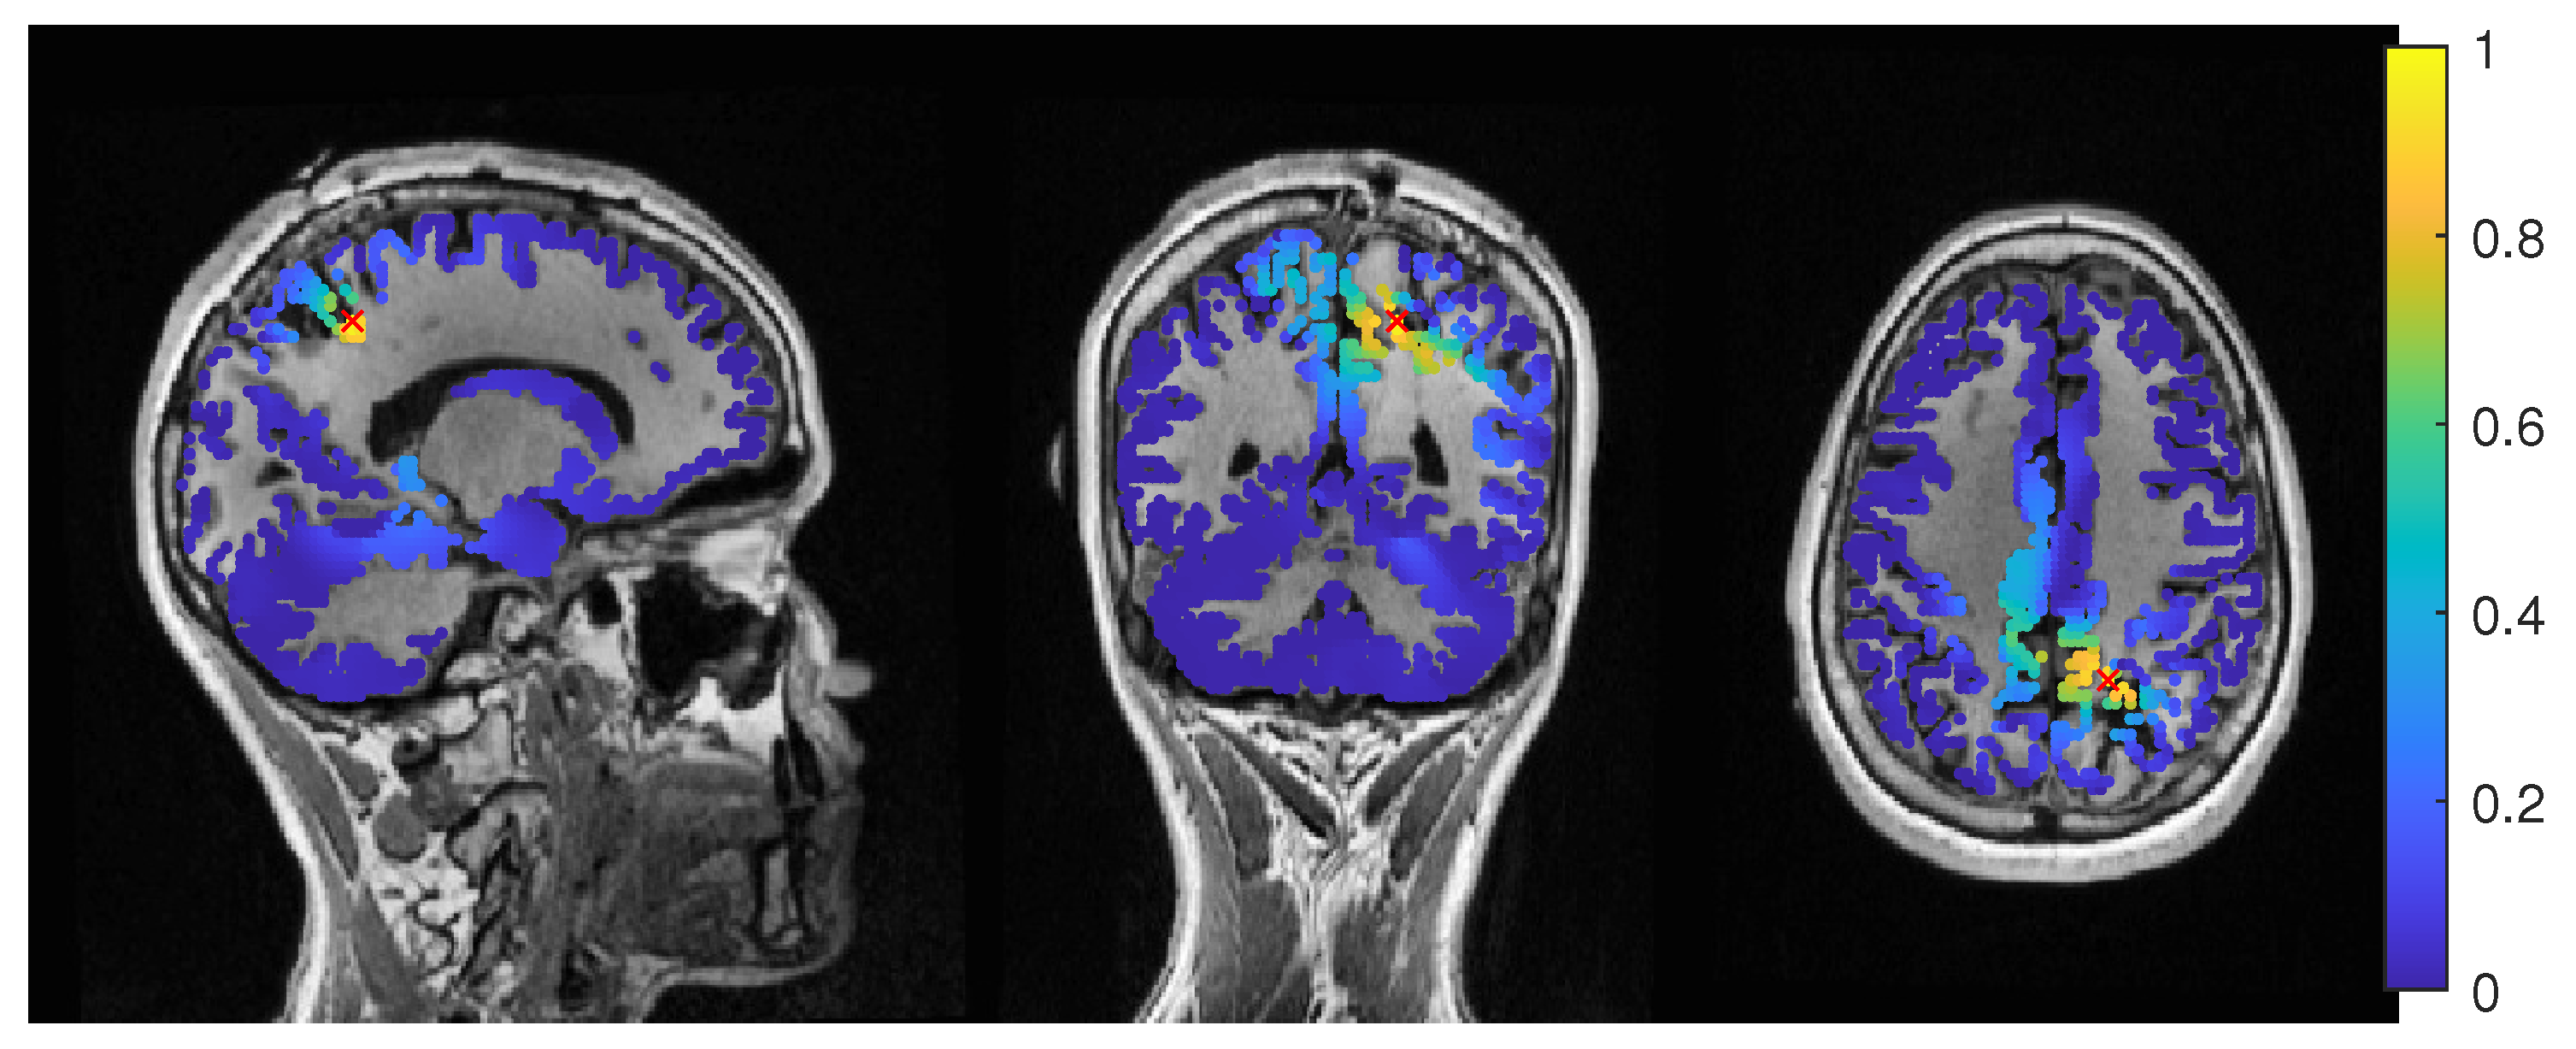
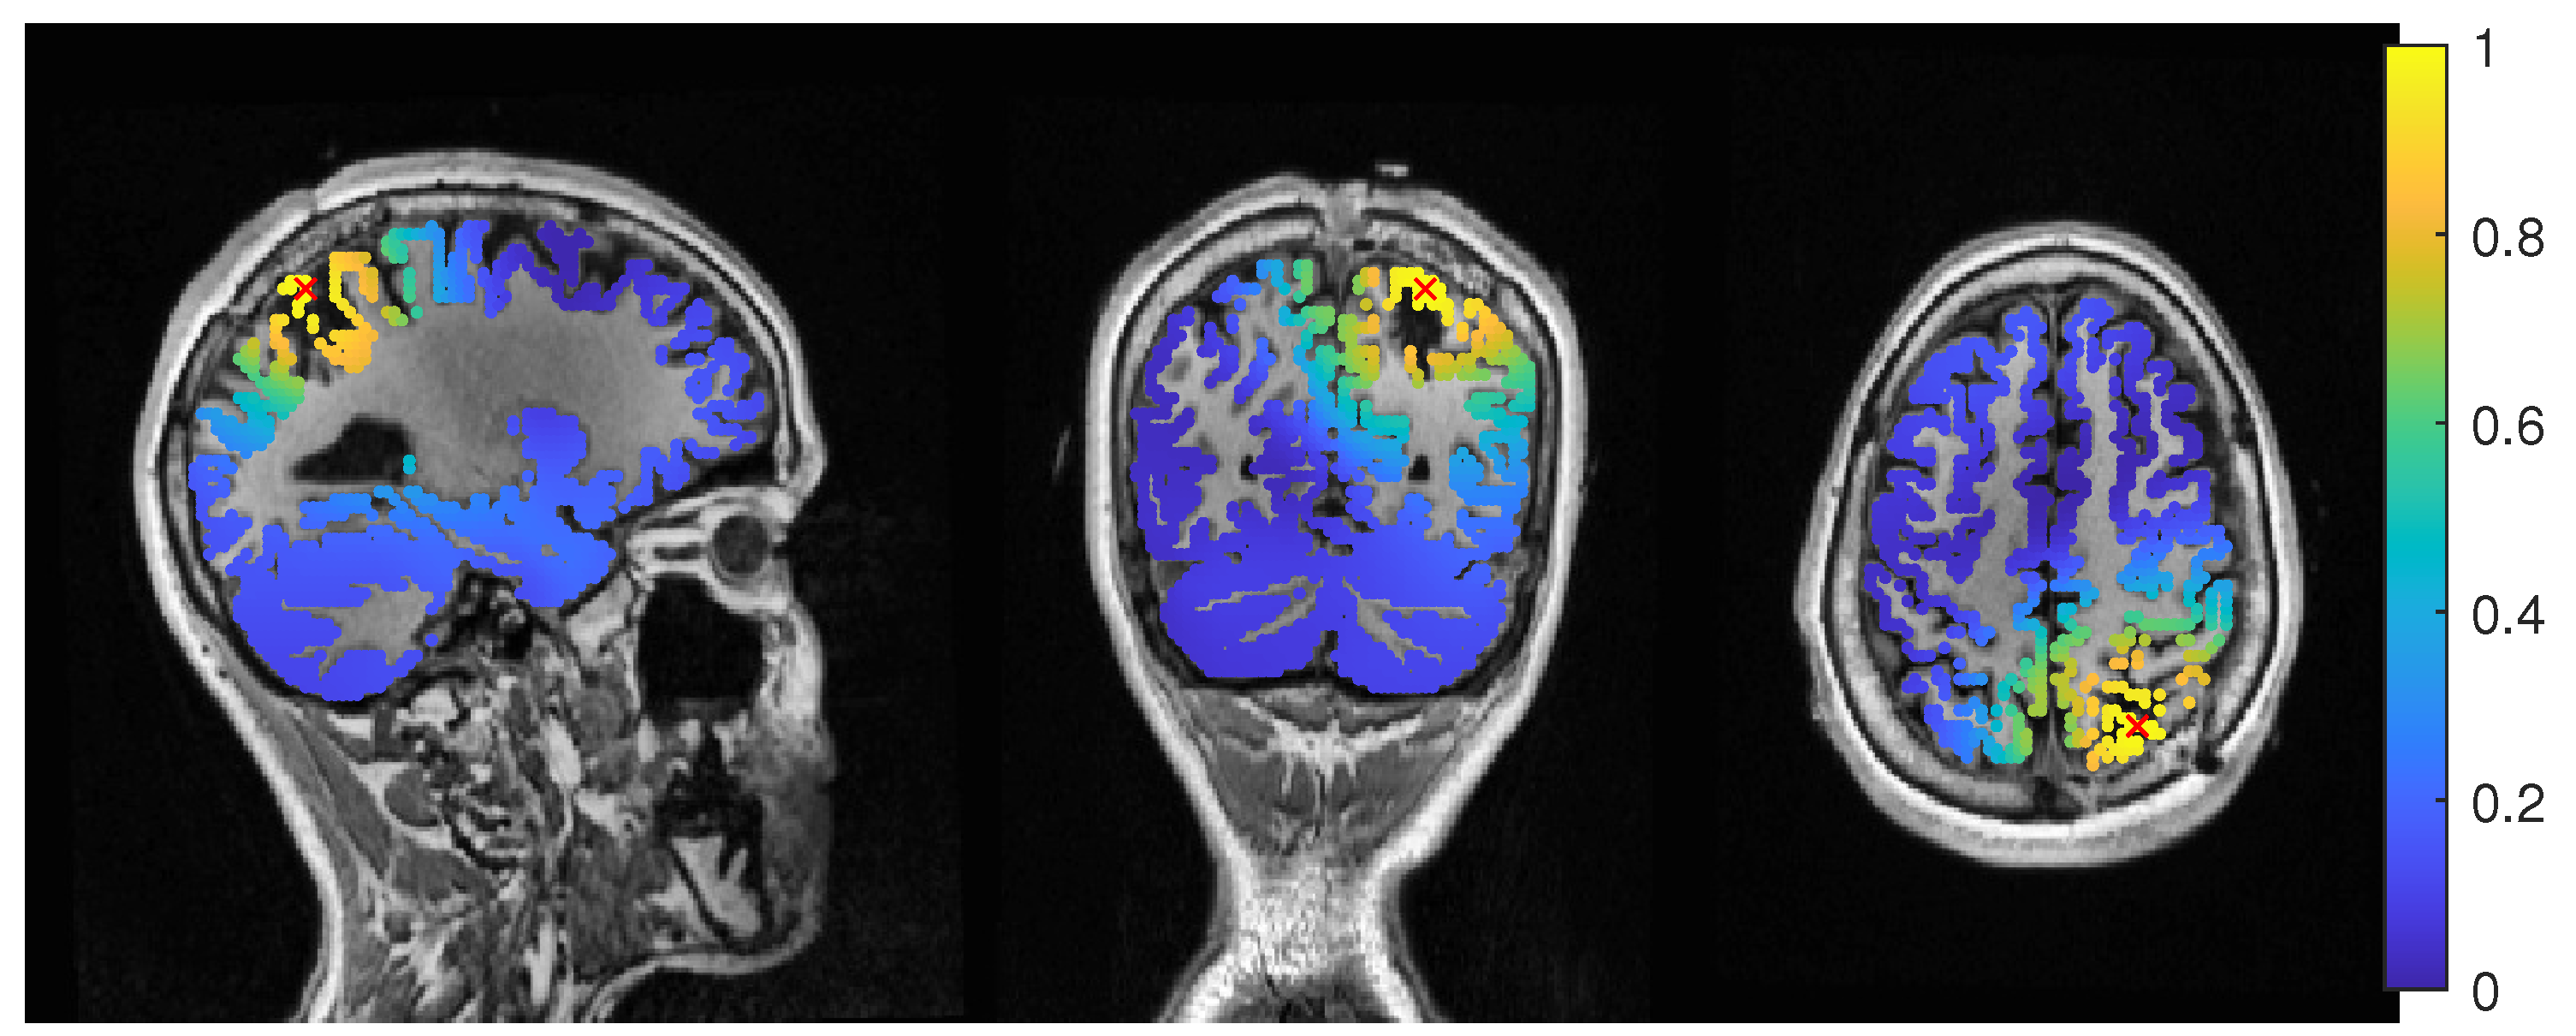
3.1. Patient 1
3.1.1. EEG
3.1.2. MEG
3.1.3. MEEG
3.2. Patient 2
3.2.1. EEG
3.2.2. MEG
3.2.3. MEEG
4. Discussion
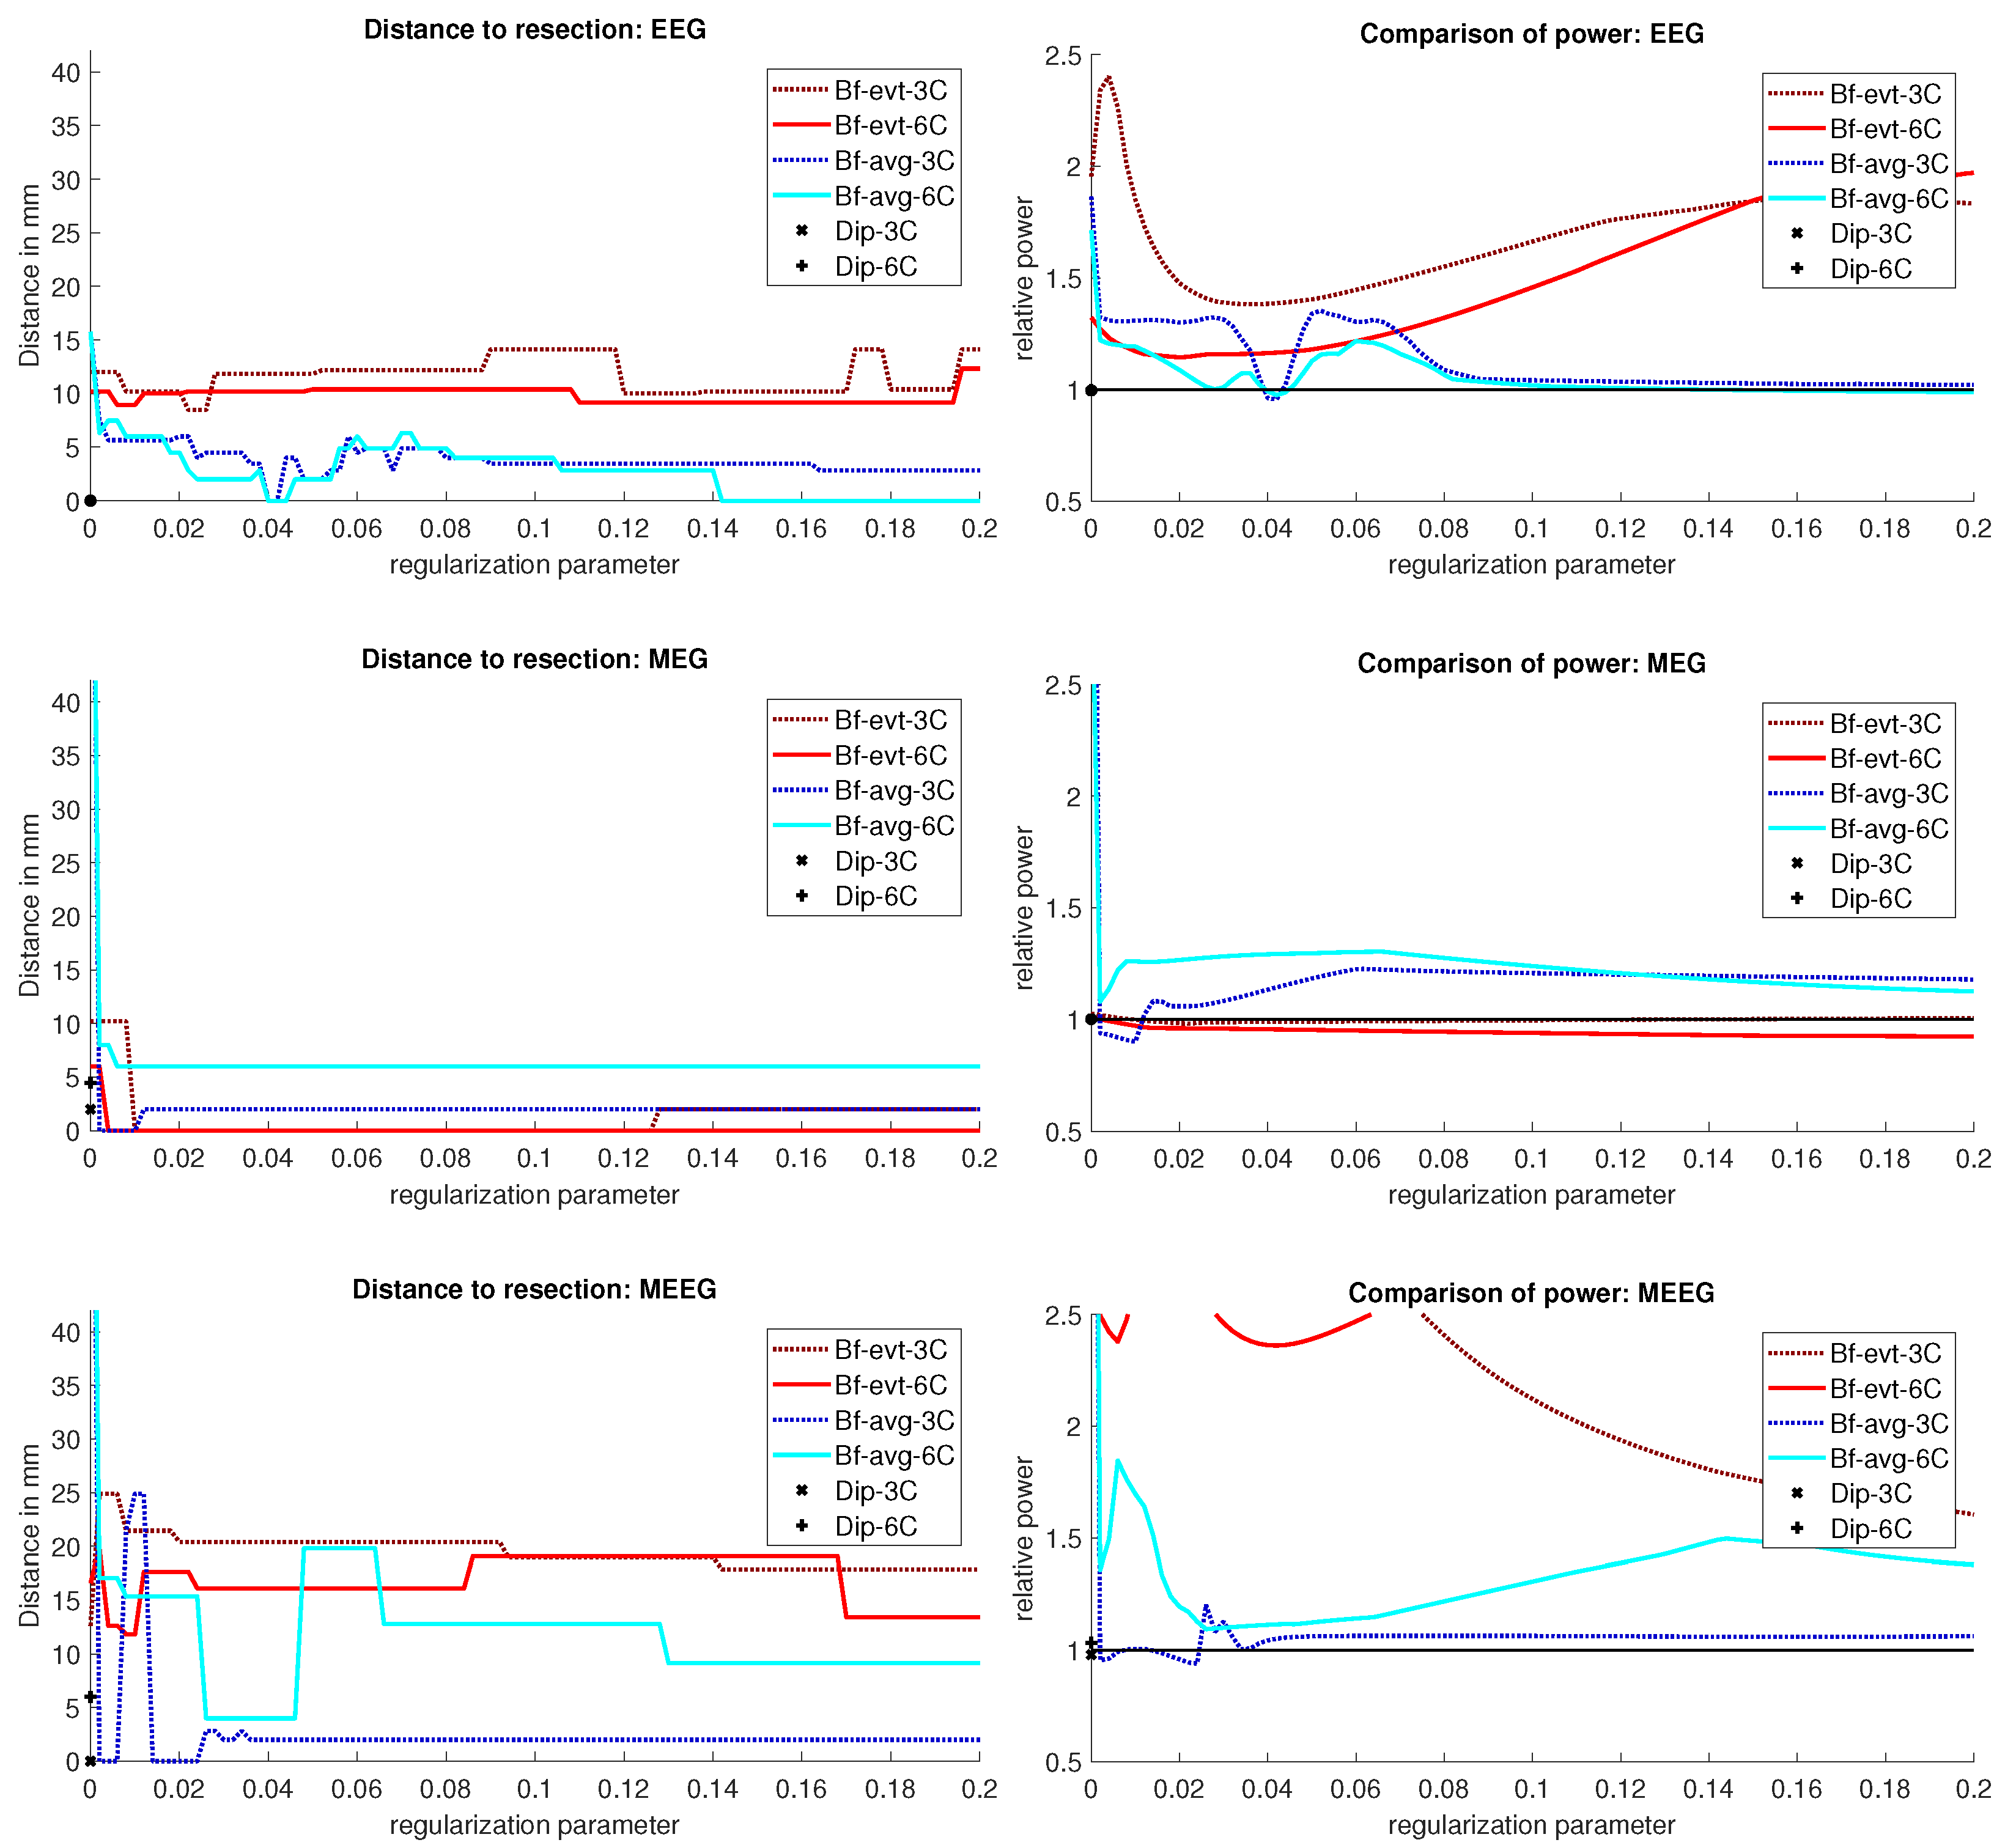
4.1. Difference between the Patients
4.2. Beamformer Parameters and Localization
4.3. Models and Modalities
4.4. Limitations of Our Error Criterion
5. Conclusions
Author Contributions
Funding
Institutional Review Board Statement
Informed Consent Statement
Data Availability Statement
Acknowledgments
Conflicts of Interest
References
- Kwan, P.; Arzimanoglou, A.; Berg, A.T.; Brodie, M.J.; Hauser, W.A.; Mathern, G.; Moshé, S.L.; Perucca, E.; Wiebe, S.; French, J. Definition of drug resistant epilepsy: Consensus proposal by the ad hoc Task Force of the ILAE Commission on Therapeutic Strategies. Epilepsia 2010, 51, 1069–1077. [Google Scholar] [CrossRef] [PubMed]
- Taylor, R.S.; Sander, J.W.; Taylor, R.J.; Baker, G.A. Predictors of health-related quality of life and costs in adults with epilepsy: A systematic review. Epilepsia 2011, 52, 2168–2180. [Google Scholar] [CrossRef] [PubMed]
- Brodie, M.J.; Barry, S.J.E.; Bamagous, G.A.; Norrie, J.D.; Kwan, P. Patterns of treatment response in newly diagnosed epilepsy. Neurology 2012, 78, 1548–1554. [Google Scholar] [CrossRef] [PubMed]
- Blumcke, I.; Spreafico, R.; Haaker, G.; Coras, R.; Kobow, K.; Bien, C.G.; Pfäfflin, M.; Elger, C.; Widman, G.; Schramm, J.; et al. Histopathological findings in brain tissue obtained during epilepsy surgery. N. Engl. J. Med. 2017, 377, 1648–1656. [Google Scholar] [CrossRef]
- De Tisi, J.; Bell, G.S.; Peacock, J.L.; McEvoy, A.W.; Harkness, W.F.; Sander, J.W.; Duncan, J.S. The long-term outcome of adult epilepsy surgery, patterns of seizure remission, and relapse: A cohort study. Lancet 2011, 378, 1388–1395. [Google Scholar] [CrossRef]
- Antonakakis, M.; Schrader, S.; Aydin, Ü.; Khan, A.; Gross, J.; Zervakis, M.; Rampp, S.; Wolters, C.H. Inter-Subject Variability of Skull Conductivity and Thickness in Calibrated Realistic Head Models. NeuroImage 2020, 223, 117353. [Google Scholar] [CrossRef]
- Ossenblok, P.; De Munck, J.C.; Colon, A.; Drolsbach, W.; Boon, P. Magnetoencephalography is more successful for screening and localizing frontal lobe epilepsy than electroencephalography. Epilepsia 2007, 48, 2139–2149. [Google Scholar] [CrossRef]
- Sutherling, W.W.; Mamelak, A.N.; Thyerlei, D.; Maleeva, T.; Minazad, Y.; Philpott, L.; Lopez, N. Influence of magnetic source imaging for planning intracranial EEG in epilepsy. Neurology 2008, 71, 990–996. [Google Scholar] [CrossRef]
- Murakami, H.; Wang, Z.I.; Marashly, A.; Krishnan, B.; Prayson, R.A.; Kakisaka, Y.; Mosher, J.C.; Bulacio, J.; Gonzalez-Martinez, J.A.; Bingaman, W.E.; et al. Correlating magnetoencephalography to stereo-electroencephalography in patients undergoing epilepsy surgery. Brain 2016, 139, 2935–2947. [Google Scholar] [CrossRef]
- Stefan, H.; Hummel, C.; Scheler, G.; Genow, A.; Druschky, K.; Tilz, C.; Kaltenhäuser, M.; Hopfengärtner, R.; Buchfelder, M.; Romstöck, J. Magnetic brain source imaging of focal epileptic activity: A synopsis of 455 cases. Brain 2003, 126, 2396–2405. [Google Scholar] [CrossRef]
- Rampp, S.; Stefan, H.; Wu, X.; Kaltenhäuser, M.; Maess, B.; Schmitt, F.C.; Wolters, C.H.; Hamer, H.; Kasper, B.S.; Schwab, S.; et al. Magnetoencephalography for epileptic focus localization in a series of 1000 cases. Brain 2019, 142, 3059–3071. [Google Scholar] [CrossRef]
- Dassios, G.; Fokas, A.S.; Hadjiloizi, D. On the complementarity of electroencephalography and magnetoencephalography. Inverse Probl. 2007, 23, 2541–2549. [Google Scholar] [CrossRef]
- Iwasaki, M.; Pestana, E.; Burgess, R.C.; Luders, H.O.; Shamoto, H.; Nakasato, N. Detection of Epileptiform Activity by Human Interpreters: Blinded Comparison between Electroencephalography and Magnetoencephalography. Epilepsia 2005, 46, 59–68. [Google Scholar] [CrossRef]
- Knake, S.; Halgren, E.; Shiraishi, H.; Hara, K.; Hamer, H.; Grant, P.; Carr, V.; Foxe, D.; Camposano, S.; Busa, E.; et al. The value of multichannel MEG and EEG in the presurgical evaluation of 70 epilepsy patients. Epilepsy Res. 2006, 69, 80–86. [Google Scholar] [CrossRef]
- Brette, R.; Destexhe, A. (Eds.) Handbook of Neural Activity Measurement; Cambridge University Press: Cambridge, UK, 2012. [Google Scholar] [CrossRef]
- Montes-Restrepo, V.; Van Mierlo, P.; Strobbe, G.; Staelens, S.; Vandenberghe, S.; Hallez, H. Influence of skull modelling approaches on EEG source localization. Brain Topogr. 2014, 27, 95–111. [Google Scholar] [CrossRef]
- Vorwerk, J.; Cho, J.H.; Rampp, S.; Hamer, H.; Knösche, T.R.; Wolters, C.H. A guideline for head volume conductor modelling in EEG and MEG. NeuroImage 2014, 100, 590–607. [Google Scholar] [CrossRef]
- Ramon, C.; Schimpf, P.; Haueisen, J.; Holmes, M.; Ishimaru, A. Role of soft bone, CSF and gray matter in EEG simulations. Brain Topogr. 2004, 16, 245–248. [Google Scholar] [CrossRef]
- Rice, J.K.; Rorden, C.; Little, J.S.; Parra, L.C. Subject position affects EEG magnitudes. NeuroImage 2013, 64, 476–484. [Google Scholar] [CrossRef]
- Azizollahi, H.; Aarabi, A.; Wallois, F. Effects of uncertainty in head tissue conductivity and complexity on EEG forward modelling in neonates. Hum. Brain Mapp. 2016, 37, 3604–3622. [Google Scholar] [CrossRef]
- Piastra, M.C.; Nüßing, A.; Vorwerk, J.; Clerc, M.; Engwer, C.; Wolters, C.H. A comprehensive study on electroencephalography and magnetoencephalography sensitivity to cortical and subcortical sources. Hum. Brain Mapp. 2021, 42, 978–992. [Google Scholar] [CrossRef]
- McCann, H.; Pisano, G.; Beltrachini, L. Variation in Reported Human Head Tissue Electrical Conductivity Values. Brain Topogr. 2019, 32, 825–858. [Google Scholar] [CrossRef]
- Hallez, H.; Vanrumste, B.; Hese, P.V.; Delputte, S.; Lemahieu, I. Dipole estimation errors due to differences in modelling anisotropic conductivities in realistic head models for EEG source analysis. Phys. Med. Biol. 2008, 53, 1877–1894. [Google Scholar] [CrossRef]
- Güllmar, D.; Haueisen, J.; Reichenbach, J.R. Influence of anisotropic electrical conductivity in white matter tissue on the EEG/MEG forward and inverse solution. A high-resolution whole head simulation study. NeuroImage 2010, 51, 145–163. [Google Scholar] [CrossRef]
- Vorwerk, J.; Aydin, Ü.; Wolters, C.H.; Butson, C.R. Influence of head tissue conductivity uncertainties on EEG dipole reconstruction. Front. Neurosci. 2019, 13, 1–17. [Google Scholar] [CrossRef]
- Vallaghe, S.; Clerc, M. A Global Sensitivity Analysis of Three- and Four-Layer EEG Conductivity Models. IEEE Trans. Biomed. Eng. 2009, 56, 988–995. [Google Scholar] [CrossRef]
- Huang, M.X.; Song, T.; Hagler, D.J.; Podgorny, I.; Jousmaki, V.; Cui, L.; Gaa, K.; Harrington, D.L.; Dale, A.M.; Lee, R.R.; et al. A novel integrated MEG and EEG analysis method for dipolar sources. NeuroImage 2007, 37, 731–748. [Google Scholar] [CrossRef]
- Schimpf, P.; Ramon, C.; Haueisen, J. Dipole models for the EEG and MEG. IEEE Trans. Biomed. Eng. 2002, 49, 409–418. [Google Scholar] [CrossRef]
- Beltrachini, L. Sensitivity of the Projected Subtraction Approach to Mesh Degeneracies and Its Impact on the Forward Problem in EEG. IEEE Trans. Biomed. Eng. 2019, 66, 273–282. [Google Scholar] [CrossRef]
- Fuchs, M.; Wagner, M.; Wischmann, H.A.; Köhler, T.; Theißen, A.; Drenckhahn, R.; Buchner, H. Improving source reconstructions by combining bioelectric and biomagnetic data. Electroencephalogr. Clin. Neurophysiol. 1998, 107, 93–111. [Google Scholar] [CrossRef]
- Van Veen, B.; Van Drongelen, W.; Yuchtman, M.; Suzuki, A. Localization of brain electrical activity via linearly constrained minimum variance spatial filtering. IEEE Trans. Biomed. Eng. 1997, 44, 867–880. [Google Scholar] [CrossRef]
- Gross, J.; Kujala, J.; Hamalainen, M.; Timmermann, L.; Schnitzler, A.; Salmelin, R. Dynamic imaging of coherent sources: Studying neural interactions in the human brain. Proc. Natl. Acad. Sci. USA 2001, 98, 694–699. [Google Scholar] [CrossRef] [PubMed]
- Hillebrand, A.; Singh, K.D.; Holliday, I.E.; Furlong, P.L.; Barnes, G.R. A new approach to neuroimaging with magnetoencephalography. Hum. Brain Mapp. 2005, 25, 199–211. [Google Scholar] [CrossRef] [PubMed]
- Kirsch, H.E.; Robinson, S.; Mantle, M.; Nagarajan, S. Automated localization of magnetoencephalographic interictal spikes by adaptive spatial filtering. Clin. Neurophysiol. 2006, 117, 2264–2271. [Google Scholar] [CrossRef] [PubMed]
- Hall, M.B.; Nissen, I.A.; van Straaten, E.C.; Furlong, P.L.; Witton, C.; Foley, E.; Seri, S.; Hillebrand, A. An evaluation of kurtosis beamforming in magnetoencephalography to localize the epileptogenic zone in drug resistant epilepsy patients. Clin. Neurophysiol. 2018, 129, 1221–1229. [Google Scholar] [CrossRef]
- Velmurugan, J.; Nagarajan, S.S.; Mariyappa, N.; Ravi, S.G.; Thennarasu, K.; Mundlamuri, R.C.; Raghavendra, K.; Bharath, R.D.; Saini, J.; Arivazhagan, A.; et al. Magnetoencephalographic imaging of ictal high-frequency oscillations (80–200 Hz) in pharmacologically resistant focal epilepsy. Epilepsia 2018, 59, 190–202. [Google Scholar] [CrossRef]
- Van Klink, N.; Hillebrand, A.; Zijlmans, M. Identification of epileptic high frequency oscillations in the time domain by using MEG beamformer-based virtual sensors. Clin. Neurophysiol. 2016, 127, 197–208. [Google Scholar] [CrossRef]
- Nissen, I.A.; Stam, C.J.; Reijneveld, J.C.; van Straaten, I.E.C.W.; Hendriks, E.J.; Baayen, J.C.; De Witt Hamer, P.C.; Idema, S.; Hillebrand, A. Identifying the epileptogenic zone in interictal resting-state MEG source-space networks. Epilepsia 2016, 58, 137–148. [Google Scholar] [CrossRef]
- Van Dellen, E.; Douw, L.; Hillebrand, A.; de Witt Hamer, P.C.; Baayen, J.C.; Heimans, J.J.; Reijneveld, J.C.; Stam, C.J. Epilepsy surgery outcome and functional network alterations in. NeuroImage 2014, 86, 354–363. [Google Scholar] [CrossRef]
- Brookes, M.J.; Vrba, J.; Robinson, S.E.; Stevenson, C.M.; Peters, A.M.A.M.; Barnes, G.R.; Hillebrand, A.; Morris, P.G. Optimising experimental design for MEG beamformer imaging. NeuroImage 2008, 39, 1788–1802. [Google Scholar] [CrossRef]
- Cheyne, D.O.; Bakhtazad, L.; Gaetz, W. Spatiotemporal mapping of cortical activity accompanying voluntary movements using an event-related beamforming approach. Hum. Brain Mapp. 2006, 27, 213–229. [Google Scholar] [CrossRef]
- Cheyne, D.; Bostan, A.C.; Gaetz, W.; Pang, E.W. Event-related beamforming: A robust method for presurgical functional mapping using MEG. Clin. Neurophysiol. 2007, 118, 1691–1704. [Google Scholar] [CrossRef] [PubMed]
- Rosenow, F.; Lüders, H. Presurgical evaluation of epilepsy. Brain 2001, 124, 1683–1700. [Google Scholar] [CrossRef] [PubMed]
- Zucca, I.; Milesi, G.; Padelli, F.; Rossini, L.; Gozzo, F.; Figini, M.; Barbaglia, A.; Cardinale, F.; Tassi, L.; Bruzzone, M.G.; et al. An image registration protocol to integrate electrophysiology, MRI and neuropathology data in epileptic patients explored with intracerebral electrodes. J. Neurosci. Methods 2018, 303, 159–168. [Google Scholar] [CrossRef] [PubMed]
- Rampp, S.; Rössler, K.; Hamer, H.; Illek, M.; Buchfelder, M.; Doerfler, A.; Pieper, T.; Hartlieb, T.; Kudernatsch, M.; Koelble, K.; et al. Dysmorphic neurons as cellular source for phase-amplitude coupling in Focal Cortical Dysplasia Type II. Clin. Neurophysiol. 2021, 132, 782–792. [Google Scholar] [CrossRef]
- Wellmer, J.; Parpaley, Y.; Rampp, S.; Popkirov, S.; Kugel, H.; Aydin, Ü.; Wolters, C.H.; von Lehe, M.; Voges, J. Lesion guided stereotactic radiofrequency thermocoagulation for palliative, in selected cases curative epilepsy surgery. Epilepsy Res. 2016, 121, 39–46. [Google Scholar] [CrossRef]
- Schrader, S.; Antonakakis, M.; Rampp, S.; Engwer, C.; Wolters, C.H. A novel method for calibrating head models to account for variability in conductivity and its evaluation in a sphere model. Phys. Med. Biol. 2020, 65, 1–22. [Google Scholar] [CrossRef]
- Tuch, D.S.; Wedeen, V.J.; Dale, A.M.; George, J.S.; Belliveau, J.W. Conductivity tensor mapping of the human brain using diffusion tensor MRI. Proc. Natl. Acad. Sci. USA 2001, 98, 11697–11701. [Google Scholar] [CrossRef]
- Rullmann, M.; Anwander, A.; Dannhauer, M.; Warfield, S.K.; Duffy, F.H.; Wolters, C.H. EEG source analysis of epileptiform activity using a 1 mm anisotropic hexahedra finite element head model. NeuroImage 2009, 44, 399–410. [Google Scholar] [CrossRef]
- Oostenveld, R.; Fries, P.; Maris, E.; Schoffelen, J.M. FieldTrip: Open source software for advanced analysis of MEG, EEG, and invasive electrophysiological data. Comput. Intell. Neurosci. 2011, 2011, 156869. [Google Scholar] [CrossRef]
- Otsu, N. A Threshold Selection Method from Gray-Level Histograms. IEEE Trans. Syst. Man Cybern. 1979, 20, 62–66. [Google Scholar] [CrossRef]
- Lanfer, B.; Scherg, M.; Dannhauer, M.; Knösche, T.R.; Wolters, C.H. Influences of Skull Segmentation Deficiencies on EEG Source Analysis. NeuroImage 2012, 62, 418–431. [Google Scholar] [CrossRef]
- Ruthotto, L.; Kugel, H.; Olesch, J.; Fischer, B.; Modersitzki, J.; Burger, M.; Wolters, C.H. Diffeomorphic susceptibility artifact correction of diffusion-weighted magnetic resonance images. Phys. Med. Biol. 2012, 57, 5715–5731. [Google Scholar] [CrossRef]
- Aydin, Ü.; Vorwerk, J.; Küpper, P.; Heers, M.; Kugel, H.; Galka, A.; Hamid, L.; Wellmer, J.; Kellinghaus, C.; Rampp, S.; et al. Combining EEG and MEG for the Reconstruction of Epileptic Activity Using a Calibrated Realistic Volume Conductor Model. PLoS ONE 2014, 9, e93154. [Google Scholar] [CrossRef]
- Wolters, C.H.; Anwander, A.; Berti, G.; Hartmann, U. Geometry-Adapted Hexahedral Meshes Improve Accuracy of Finite-Element-Method-Based EEG Source Analysis. IEEE Trans. Biomed. Eng. 2007, 54, 1446–1453. [Google Scholar] [CrossRef]
- Medani, T.; Lautru, D.; Schwartz, D.; Ren, Z.; Sou, G. FEM method for the EEG forward problem and improvement based on modification of the Saint Venant’s method. Prog. Electromagn. Res. 2015, 153, 11–22. [Google Scholar] [CrossRef]
- Schrader, S.; Westhoff, A.; Piastra, M.C.; Miinalainen, T.; Pursiainen, S.; Vorwerk, J.; Brinck, H.; Wolters, C.H.; Engwer, C. DUNEuro—A software toolbox for forward modelling in bioelectromagnetism. PLoS ONE 2021, 16, e0252431. [Google Scholar] [CrossRef]
- Dannhauer, M.; Lanfer, B.; Wolters, C.H.; Knösche, T.R. Modeling of the human skull in EEG source analysis. Hum. Brain Mapp. 2011, 32, 1383–1399. [Google Scholar] [CrossRef]
- Homma, S.; Musha, T.; Nakajima, Y.; Okamoto, Y.; Blom, S.; Flink, R.; Hagbarth, K.E. Conductivity ratios of the scalp-skull-brain head model in estimating equivalent dipole sources in human brain. Neurosci. Res. 1995, 22, 51–55. [Google Scholar] [CrossRef]
- Baumann, S.B.; Wozny, D.R.; Kelly, S.K.; Meno, F.M. The electrical conductivity of human cerebrospinal fluid at body temperature. IEEE Trans. Biomed. Eng. 1997, 44, 220–225. [Google Scholar] [CrossRef]
- Hari, R.; Karhu, J.; Hämäläinen, M.; Knuutila, J.; Salonen, O.; Sams, M.; Vilkman, V. Functional Organization of the Human First and Second Somatosensory Cortices: A Neuromagnetic Study. Eur. J. Neurosci. 1993, 5, 724–734. [Google Scholar] [CrossRef]
- Allison, T.; Wood, C.C.; McCarthy, G.; Spencer, D.D. Cortical somatosensory evoked potentials. II. Effects of excision of somatosensory or motor cortex in humans and monkeys. J. Neurophysiol. 1991, 66, 64–82. [Google Scholar] [CrossRef]
- Nakamura, A.; Yamada, T.; Goto, A.; Kato, T.; Ito, K.; Abe, Y.; Kachi, T.; Kakigi, R. Somatosensory homunculus as drawn by MEG. NeuroImage 1998, 7, 377–386. [Google Scholar] [CrossRef]
- Akalin Acar, Z.; Acar, C.E.; Makeig, S. Simultaneous head tissue conductivity and EEG source location estimation. NeuroImage 2016, 124, 168–180. [Google Scholar] [CrossRef]
- Baysal, U.; Haueisen, J. Use of a priori information in estimating tissue resistivities—Application to human data in vivo. Physiol. Meas. 2004, 25, 737–748. [Google Scholar] [CrossRef]
- Hoekema, R.; Wieneke, G.H.; Leijten, F.S.; Van Veelen, C.W.; Van Rijen, P.C.; Huiskamp, G.J.; Ansems, J.; Van Huffelen, A.C. Measurement of the conductivity of skull, temporarily removed during epilepsy surgery. Brain Topogr. 2003, 16, 29–38. [Google Scholar] [CrossRef]
- Wendel, K.; Väisänen, J.; Seemann, G.; Hyttinen, J.; Malmivuo, J. The influence of age and skull conductivity on surface and subdermal bipolar EEG leads. Comput. Intell. Neurosci. 2010, 2010, 397272. [Google Scholar] [CrossRef] [PubMed]
- Lai, Y.; Van Drongelen, W.; Ding, L.; Hecox, K.E.; Towle, V.L.; Frim, D.M.; He, B. Estimation of in vivo human brain-to-skull conductivity ratio from simultaneous extra- and intra-cranial electrical potential recordings. Clin. Neurophysiol. 2005, 116, 456–465. [Google Scholar] [CrossRef]
- Akhtari, M.; Bryant, H.C.; Mamelak, A.N.; Flynn, E.R.; Heller, L.; Shih, J.J.; Mandelkern, M.; Matlachov, A.; Ranken, D.M.; Best, E.D.; et al. Conductivities of three-layer live human skull. Brain Topogr. 2002, 14, 151–167. [Google Scholar] [CrossRef] [PubMed]
- Lantz, G.; Spinelli, L.; Seeck, M.; de Peralta Menendez, R.G.; Sottas, C.C.; Michel, C.M. Propagation of Interictal Epileptiform Activity Can Lead to Erroneous Source Localizations: A 128-Channel EEG Mapping Study. J. Clin. Neurophysiol. 2003, 20, 311–319. [Google Scholar] [CrossRef] [PubMed]
- Aydin, Ü.; Vorwerk, J.; Dümpelmann, M.; Küpper, P.; Kugel, H.; Heers, M.; Wellmer, J.; Kellinghaus, C.; Haueisen, J.; Rampp, S.; et al. Combined EEG/MEG can outperform single modality EEG or MEG source reconstruction in presurgical epilepsy diagnosis. PLoS ONE 2015, 10, e0118753. [Google Scholar] [CrossRef] [PubMed]
- Sekihara, K.; Nagarajan, S.; Poeppel, D.; Marantz, A. Asymptotic SNR of Scalar and Vector Minimum-Variance Beamformers for Neuromagnetic Source Reconstruction. IEEE Trans. Biomed. Eng. 2004, 51, 1726–1734. [Google Scholar] [CrossRef]
- Sekihara, K.; Nagarajan, S.S. Adaptive Spatial Filters for Electromagnetic Brain Imaging; Series in Biomedical Engineering; Springer: Berlin/Heidelberg, Germany, 2008. [Google Scholar] [CrossRef]
- Hashimoto, I.; Kimura, T.; Iguchi, Y.; Takino, R.; Sekihara, K. Dynamic activation of distinct cytoarchitectonic areas of the human SI cortex after median nerve stimulation. Neuroreport 2001, 12, 1891–1897. [Google Scholar] [CrossRef][Green Version]
- Jaiswal, A.; Nenonen, J.; Stenroos, M.; Gramfort, A.; Dalal, S.S.; Westner, B.U.; Litvak, V.; Mosher, J.C.; Schoffelen, J.M.; Witton, C.; et al. Comparison of beamformer implementations for MEG source localization. NeuroImage 2020, 216, 116797. [Google Scholar] [CrossRef]
- Wolters, C.H.; Beckmann, R.F.; Rienäcker, A.; Buchner, H. Comparing regularized and non-regularized nonlinear dipole fit methods: A study in a simulated sulcus structure. Brain Topogr. 1999, 12, 3–18. [Google Scholar] [CrossRef]
- Škrinjar, O.; Nabavi, A.; Duncan, J. Model-driven brain shift compensation. Med. Image Anal. 2002, 6, 361–373. [Google Scholar] [CrossRef]
- Mouthaan, B.E.; Rados, M.; Boon, P.; Carrette, E.; Diehl, B.; Jung, J.; Kimiskidis, V.; Kobulashvili, T.; Kuchukhidze, G.; Larsson, P.G.; et al. Diagnostic accuracy of interictal source imaging in presurgical epilepsy evaluation: A systematic review from the E-PILEPSY consortium. Clin. Neurophysiol. 2019, 130, 845–855. [Google Scholar] [CrossRef]
- Nissen, I.A.; Stam, C.J.; Citroen, J.; Reijneveld, J.C.; Hillebrand, A. Preoperative evaluation using magnetoencephalography: Experience in 382 epilepsy patients. Epilepsy Res. 2016, 124, 23–33. [Google Scholar] [CrossRef]
- Neugebauer, F.; Möddel, G.; Rampp, S.; Burger, M.; Wolters, C.H. The Effect of Head Model Simplification on Beamformer Source Localization. Front. Neurosci. 2017, 11, 625. [Google Scholar] [CrossRef]
- Fischer, M.J.M.; Scheler, G.; Stefan, H. Utilization of magnetoencephalography results to obtain favourable outcomes in epilepsy surgery. Brain 2005, 128, 153–157. [Google Scholar] [CrossRef]
- Oishi, M.; Otsubo, H.; Iida, K.; Suyama, Y.; Ochi, A.; Weiss, S.K.; Xiang, J.; Gaetz, W.; Cheyne, D.; Chuang, S.H.; et al. Preoperative simulation of intracerebral epileptiform discharges: Synthetic aperture magnetometry virtual sensor analysis of interictal magnetoencephalography data. J. Neurosurg. Pediatr. 2006, 105, 41–49. [Google Scholar] [CrossRef]
- Wennberg, R.; Cheyne, D.O. Reliability of MEG source imaging of anterior temporal spikes: Analysis of an intracranially characterized spike focus. Clin. Neurophysiol. 2014, 125, 903–918. [Google Scholar] [CrossRef]
- Bast, T.; Boppel, T.; Rupp, A.; Harting, I.; Hoechstetter, K.; Fauser, S.; Schulze-Bonhage, A.; Rating, D.; Scherg, M. Noninvasive source localization of interictal EEG spikes: Effects of signal-to-noise ratio and averaging. J. Clin. Neurophysiol. 2006, 23, 487–497. [Google Scholar] [CrossRef]
- Van Veen, B.D.; Buckley, K. Beamforming: A versatile approach to spatial filtering. IEEE ASSP Mag. 1988, 5, 4–24. [Google Scholar] [CrossRef]
- Mohamed, I.S.; Otsubo, H.; Ferrari, P.; Sharma, R.; Ochi, A.; Elliott, I.; Go, C.; Chuang, S.; Rutka, J.; Snead, C.; et al. Source localization of interictal spike-locked neuromagnetic oscillations in pediatric neocortical epilepsy. Clin. Neurophysiol. 2013, 124, 1517–1527. [Google Scholar] [CrossRef]
- Vrba, J.; Robinson, S.E. Signal processing in magnetoencephalography. Methods 2001, 25, 249–271. [Google Scholar] [CrossRef]
- McCann, H.M.; Beltrachini, L. Impact of skull sutures, spongiform bone distribution, and aging skull conductivities on the EEG forward and inverse problems. J. Neural Eng. 2021, 2, 1–31. [Google Scholar] [CrossRef]
- Salayev, K.A.; Nakasato, N.; Ishitobi, M.; Shamoto, H.; Kanno, A.; Iinuma, K. Spike orientation may predict epileptogenic side across cerebral sulci containing the estimated equivalent dipole. Clin. Neurophysiol. 2006, 117, 1836–1843. [Google Scholar] [CrossRef]
- Pataraia, E.; Lindinger, G.; Deecke, L.; Mayer, D.; Baumgartner, C. Combined MEG/EEG analysis of the interictal spike complex in mesial temporal lobe epilepsy. NeuroImage 2005, 24, 607–614. [Google Scholar] [CrossRef] [PubMed]
- Aydin, Ü.; Rampp, S.; Wollbrink, A.; Kugel, H.; Cho, J.H.; Knösche, T.R.; Grova, C.; Wellmer, J.; Wolters, C.H. Zoomed MRI Guided by Combined EEG/MEG Source Analysis: A Multimodal Approach for Optimizing Presurgical Epilepsy Work-up and its Application in a Multi-focal Epilepsy Patient Case Study. Brain Topogr. 2017, 30, 1–17. [Google Scholar] [CrossRef] [PubMed]
- Kasper, B.S.; Rössler, K.; Hamer, H.M.; Dörfler, A.; Blümcke, I.; Coras, R.; Roesch, J.; Mennecke, A.; Wellmer, J.; Sommer, B.; et al. Coregistrating magnetic source and magnetic resonance imaging for epilepsy surgery in focal cortical dysplasia. NeuroImage Clin. 2018, 19, 487–496. [Google Scholar] [CrossRef] [PubMed]
- Nakajima, M.; Widjaja, E.; Baba, S.; Sato, Y.; Yoshida, R.; Tabei, M.; Okazaki, A.; Sakuma, S.; Holowka, S.A.; Ochi, A.; et al. Remote MEG dipoles in focal cortical dysplasia at bottom of sulcus. Epilepsia 2016, 57, 1169–1178. [Google Scholar] [CrossRef]
- Hillebrand, A.; Barnes, G.R. The use of anatomical constraints with MEG beamformers. NeuroImage 2003, 20, 2302–2313. [Google Scholar] [CrossRef]
- Urbach, H.; Scheffler, B.; Heinrichsmeier, T.; Von Oertzen, J.; Kral, T.; Wellmer, J.; Schramm, J.; Wiestler, O.D.; Blümcke, I. Focal cortical dysplasia of Taylor’s balloon cell type: A clinicopathological entity with characteristic neuroimaging and histopathological features, and favorable postsurgical outcome. Epilepsia 2002, 43, 33–40. [Google Scholar] [CrossRef]
- Zucca, I.; Milesi, G.; Medici, V.; Tassi, L.; Didato, G.; Cardinale, F.; Tringali, G.; Colombo, N.; Bramerio, M.; D’Incerti, L.; et al. Type II focal cortical dysplasia: Ex vivo 7T magnetic resonance imaging abnormalities and histopathological comparisons. Ann. Neurol. 2016, 79, 42–58. [Google Scholar] [CrossRef]
- Cepeda, C.; Hurst, R.S.; Flores-Hernández, J.; Hernández-Echeagaray, E.; Klapstein, G.J.; Boylan, M.K.; Calvert, C.R.; Jocoy, E.L.; Nguyen, O.K.; André, V.M.; et al. Morphological and electrophysiological characterization of abnormal cell types in pediatric cortical dysplasia. J. Neurosci. Res. 2003, 72, 472–486. [Google Scholar] [CrossRef]
- Garbelli, R.; Spreafico, R.; Barbaglia, A.; Rossini, L.; Milesi, G.; Zucca, I.; Cossu, M.; Bramerio, M.; Tassi, L. Stereo-EEG, radiofrequency thermocoagulation and neuropathological correlations in a patient with MRI-negative type IIb focal cortical dysplasia. Seizure 2016, 41, 1–3. [Google Scholar] [CrossRef][Green Version]
- Mühlebner, A.; Iyer, A.M.; van Scheppingen, J.; Anink, J.J.; Jansen, F.E.; Veersema, T.J.; Braun, K.P.; Spliet, W.G.M.; van Hecke, W.; Söylemezoğlu, F.; et al. Specific pattern of maturation and differentiation in the formation of cortical tubers in tuberous sclerosis complex (TSC): Evidence from layer-specific marker expression. J. Neurodev. Disord. 2016, 8, 9. [Google Scholar] [CrossRef]


Publisher’s Note: MDPI stays neutral with regard to jurisdictional claims in published maps and institutional affiliations. |
© 2022 by the authors. Licensee MDPI, Basel, Switzerland. This article is an open access article distributed under the terms and conditions of the Creative Commons Attribution (CC BY) license (https://creativecommons.org/licenses/by/4.0/).
Share and Cite
Neugebauer, F.; Antonakakis, M.; Unnwongse, K.; Parpaley, Y.; Wellmer, J.; Rampp, S.; Wolters, C.H. Validating EEG, MEG and Combined MEG and EEG Beamforming for an Estimation of the Epileptogenic Zone in Focal Cortical Dysplasia. Brain Sci. 2022, 12, 114. https://doi.org/10.3390/brainsci12010114
Neugebauer F, Antonakakis M, Unnwongse K, Parpaley Y, Wellmer J, Rampp S, Wolters CH. Validating EEG, MEG and Combined MEG and EEG Beamforming for an Estimation of the Epileptogenic Zone in Focal Cortical Dysplasia. Brain Sciences. 2022; 12(1):114. https://doi.org/10.3390/brainsci12010114
Chicago/Turabian StyleNeugebauer, Frank, Marios Antonakakis, Kanjana Unnwongse, Yaroslav Parpaley, Jörg Wellmer, Stefan Rampp, and Carsten H. Wolters. 2022. "Validating EEG, MEG and Combined MEG and EEG Beamforming for an Estimation of the Epileptogenic Zone in Focal Cortical Dysplasia" Brain Sciences 12, no. 1: 114. https://doi.org/10.3390/brainsci12010114
APA StyleNeugebauer, F., Antonakakis, M., Unnwongse, K., Parpaley, Y., Wellmer, J., Rampp, S., & Wolters, C. H. (2022). Validating EEG, MEG and Combined MEG and EEG Beamforming for an Estimation of the Epileptogenic Zone in Focal Cortical Dysplasia. Brain Sciences, 12(1), 114. https://doi.org/10.3390/brainsci12010114