Abstract
The probe tip of a micro-coordinate Measuring Machine (micro-CMM) is a microsphere with a diameter of hundreds of microns, and its sphericity is generally controlled within tens to hundreds of nanometers. However, the accurate measurement of the microsphere morphology is difficult because of the small size and high precision requirement. In this study, a measurement method with two scanning probes is proposed to obtain dimensions including the diameter and sphericity of microsphere. A series of maximum cross-sectional profiles of the microsphere in different angular directions are scanned simultaneously and differently by the scanning probes. By integrating the data of these maximum profiles, the dimensions of the microsphere can be calculated. The scanning probe is fabricated by combining a quartz tuning fork and a tungsten tip, which have a fine vertical resolution at a sub-nano scale. A commercial ruby microsphere is measured with the proposed method. Experiments that involve the scanning of six section profiles are carried out to estimate the dimensions of the ruby microsphere. The repeatability error of one section profile is 15.1 nm, which indicates that the measurement system has favorable repeatability. The mainly errors in the measurement are eliminated. The measured diameter and roundness are all consistent with the size standard of the commercial microsphere. The measurement uncertainty is evaluated, and the measurement results show that the method can be used to measure the dimensions of microspheres effectively.
1. Introduction
Microspheres with a diameter of tens of micrometers to several millimeters are increasingly used in the field of precision machinery and scientific research. With the rapid development of micro–nano manufacturing technology, such as micro-coordinate measuring machines (micro-CMMs) [1,2], microspheres with enhanced accuracy are urgently required. For a microsphere used in the probe of micro-CMM, its diameter should be hundreds of microns, and sphericity should be controlled within tens to hundreds of nanometers to ensure measurement accuracy [3,4,5].
Methods and technologies for microsphere measurement have yet to be developed, even though spheres with a diameter of over 1 mm can be measured easily with high accuracy in accordance with ISO 3290-1-2008. According to the guideline of ISO 3290-1-2008, three perpendicular equatorial circles of a ball are examined to acquire the corresponding roundness, and the maximum of three roundness values is designated as the sphericity of the measured ball. However, this guideline is unsuitable for the measurement of microspheres. As such, the development of microsphere measurement technologies for microspheres is in development, and some novel solutions have been proposed. For example, Küng et al. proposed a 3D roundness measurement method for microspheres [6]. In this method, three ruby spheres with the diameter of 1 mm are calibrated each another simultaneously with a self-developed ultraprecision micro-CMM, and the standard deviation of measurement repeatability is less than 5 nm. Nevertheless, the calibration of microspheres with a diameter of hundreds of micrometers has not yet to be described by this method. Zhao et al. developed a modified atomic force microscope system with a precise homebuilt air-bearing spindle. The system can fabricate and measure nanostructures on the surface of a micro ball [7,8]. Fan et al. designed a measurement method with two developed miniature Michelson interferometers and showed that the run-out of the resolution can reach 1 nm [9]. These contact-type measuring methods mentioned above have good reliability and high accuracy, but they are limited by key equipment. In addition to contact-type measurement methods, optical methods are used to measure microspheres. Griesmann et al. measured a microsphere with a spherical Fizeau interferometer [10]. Bartl et al. determined the size of microspheres with a spherical Fizeau interferometer and an image splicing technology [11]. Chen et al. evaluated the sphericity parameters of a CMM probe through optical image measurement and surface reconstruction [12]. Optical methods are simple and have a high measurement speed, but their accuracy is in the level of micrometer level only.
In this study, a measurement method for microsphere is proposed, and a measurement system is developed. By this method, cross-sectional profiles of a microsphere are scanned with two scanning probes. The obtained data are designated to estimate the dimensions of the microsphere.
2. Measurement Method and Systems
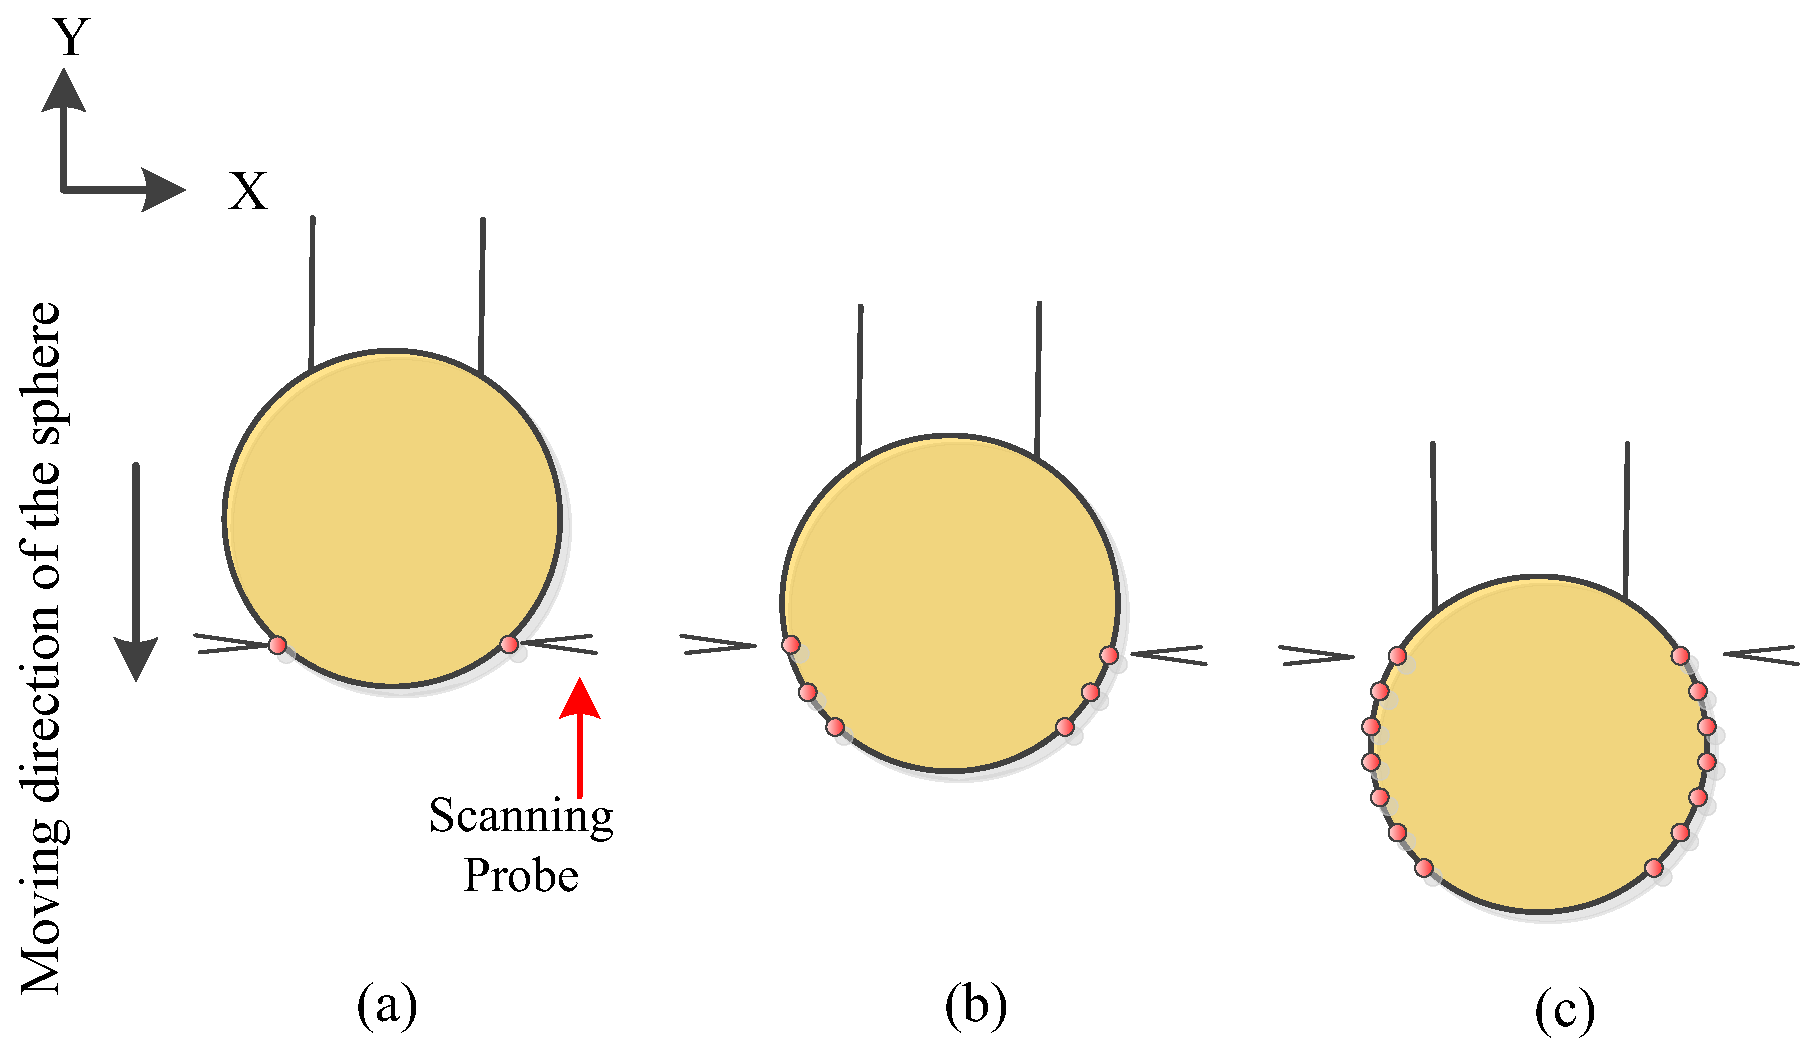
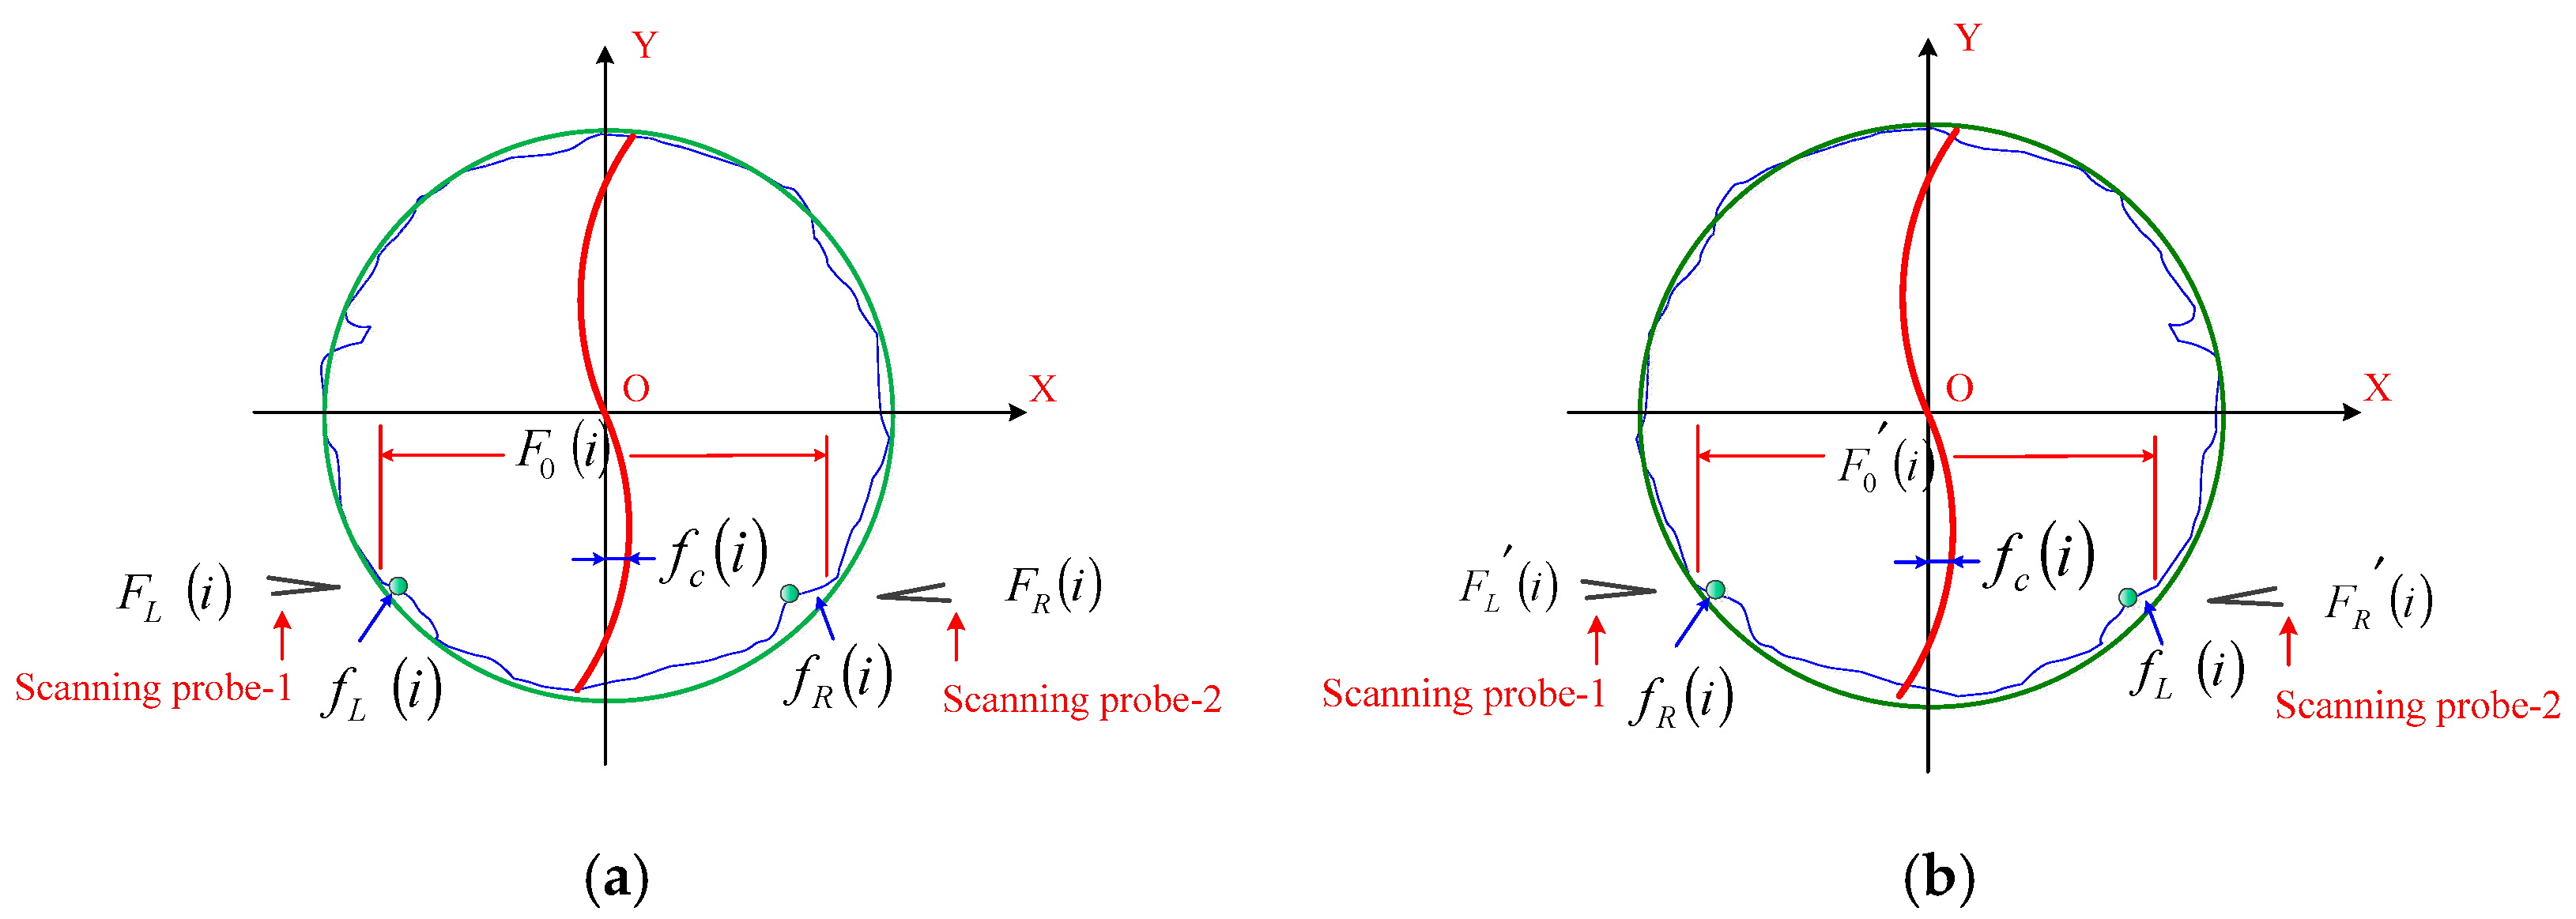
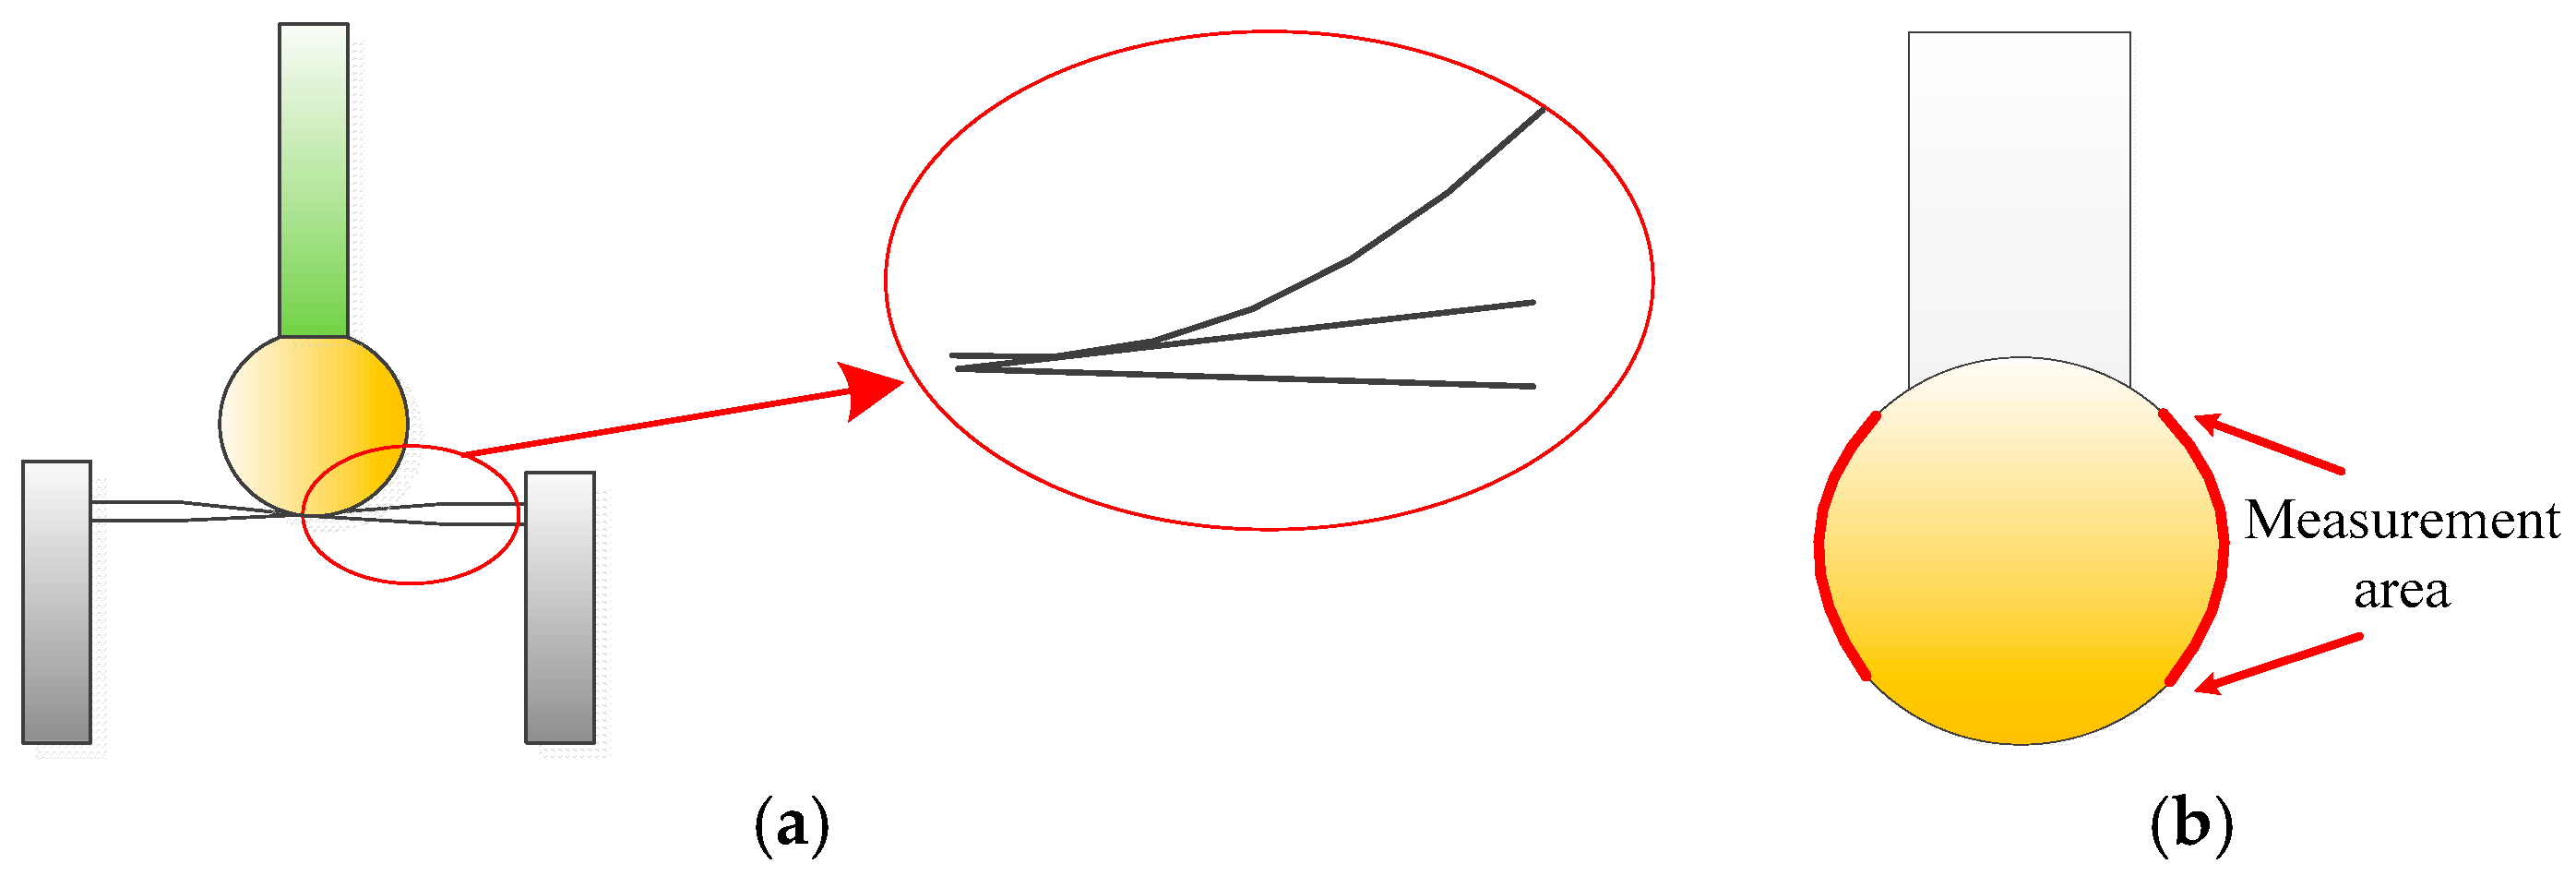
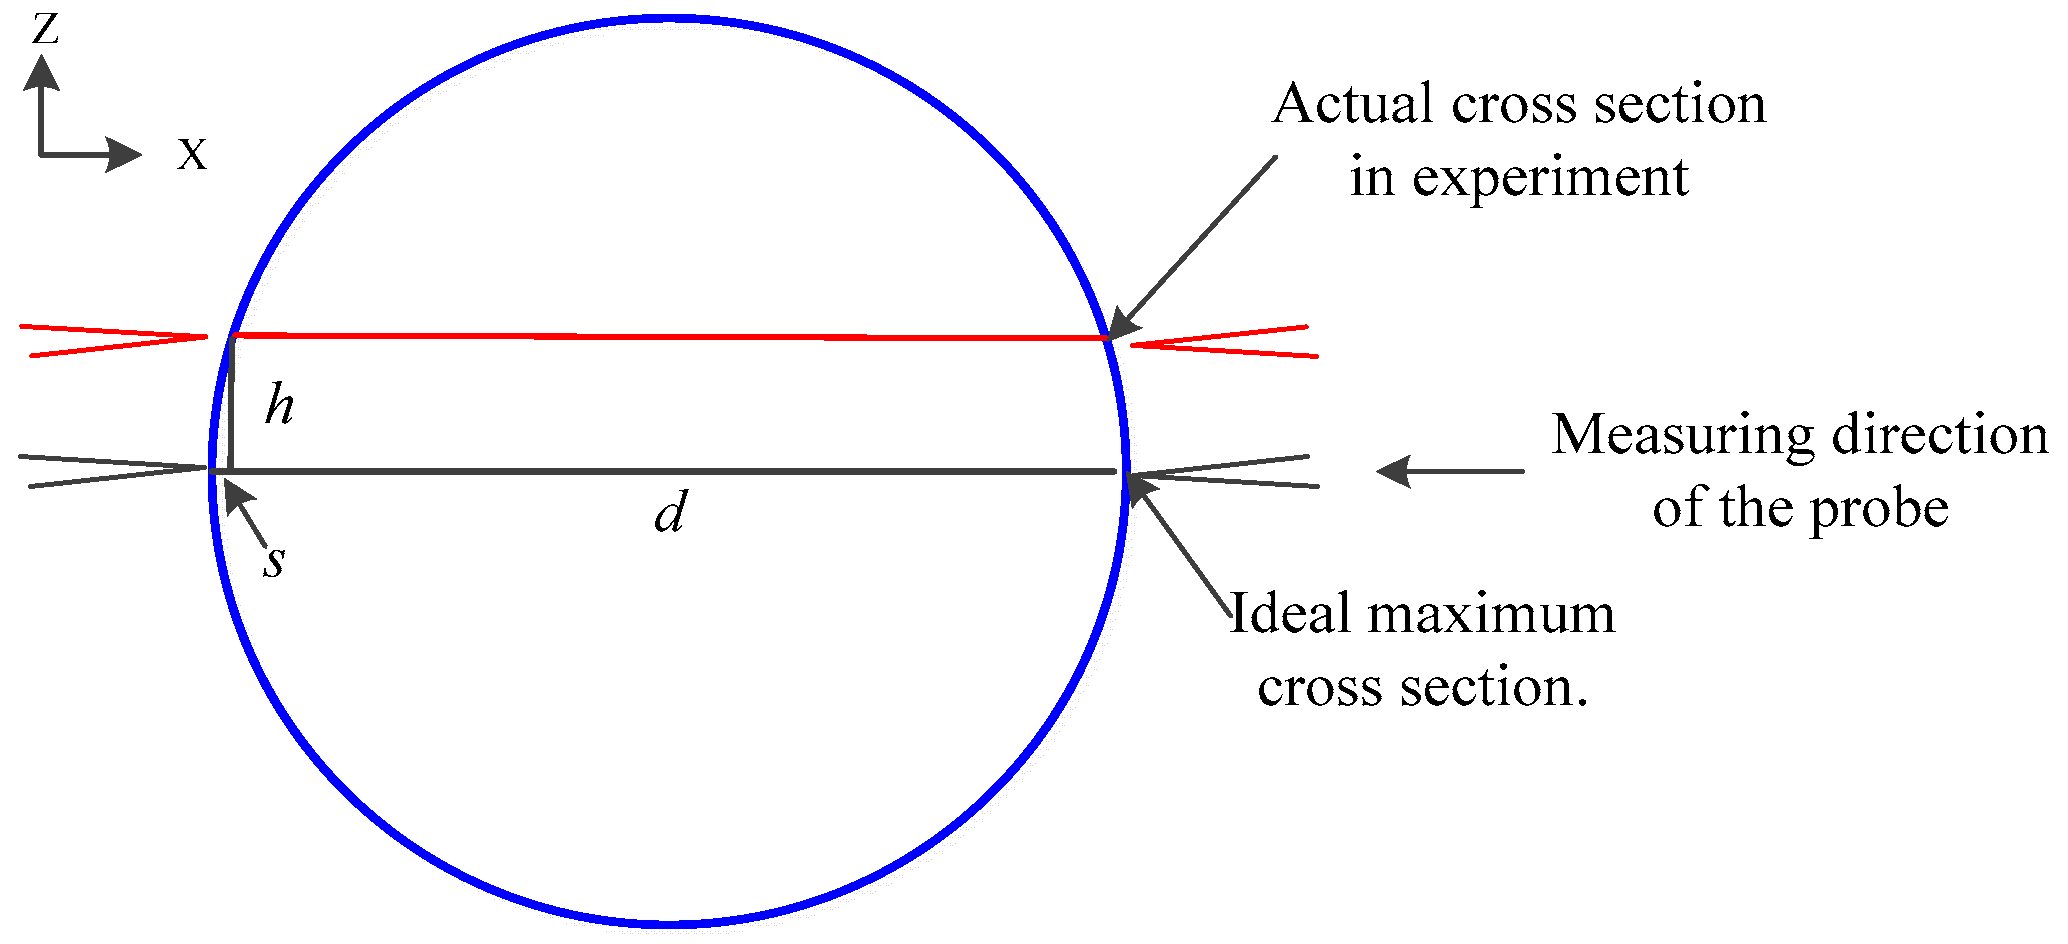
2.1. Measurement Method
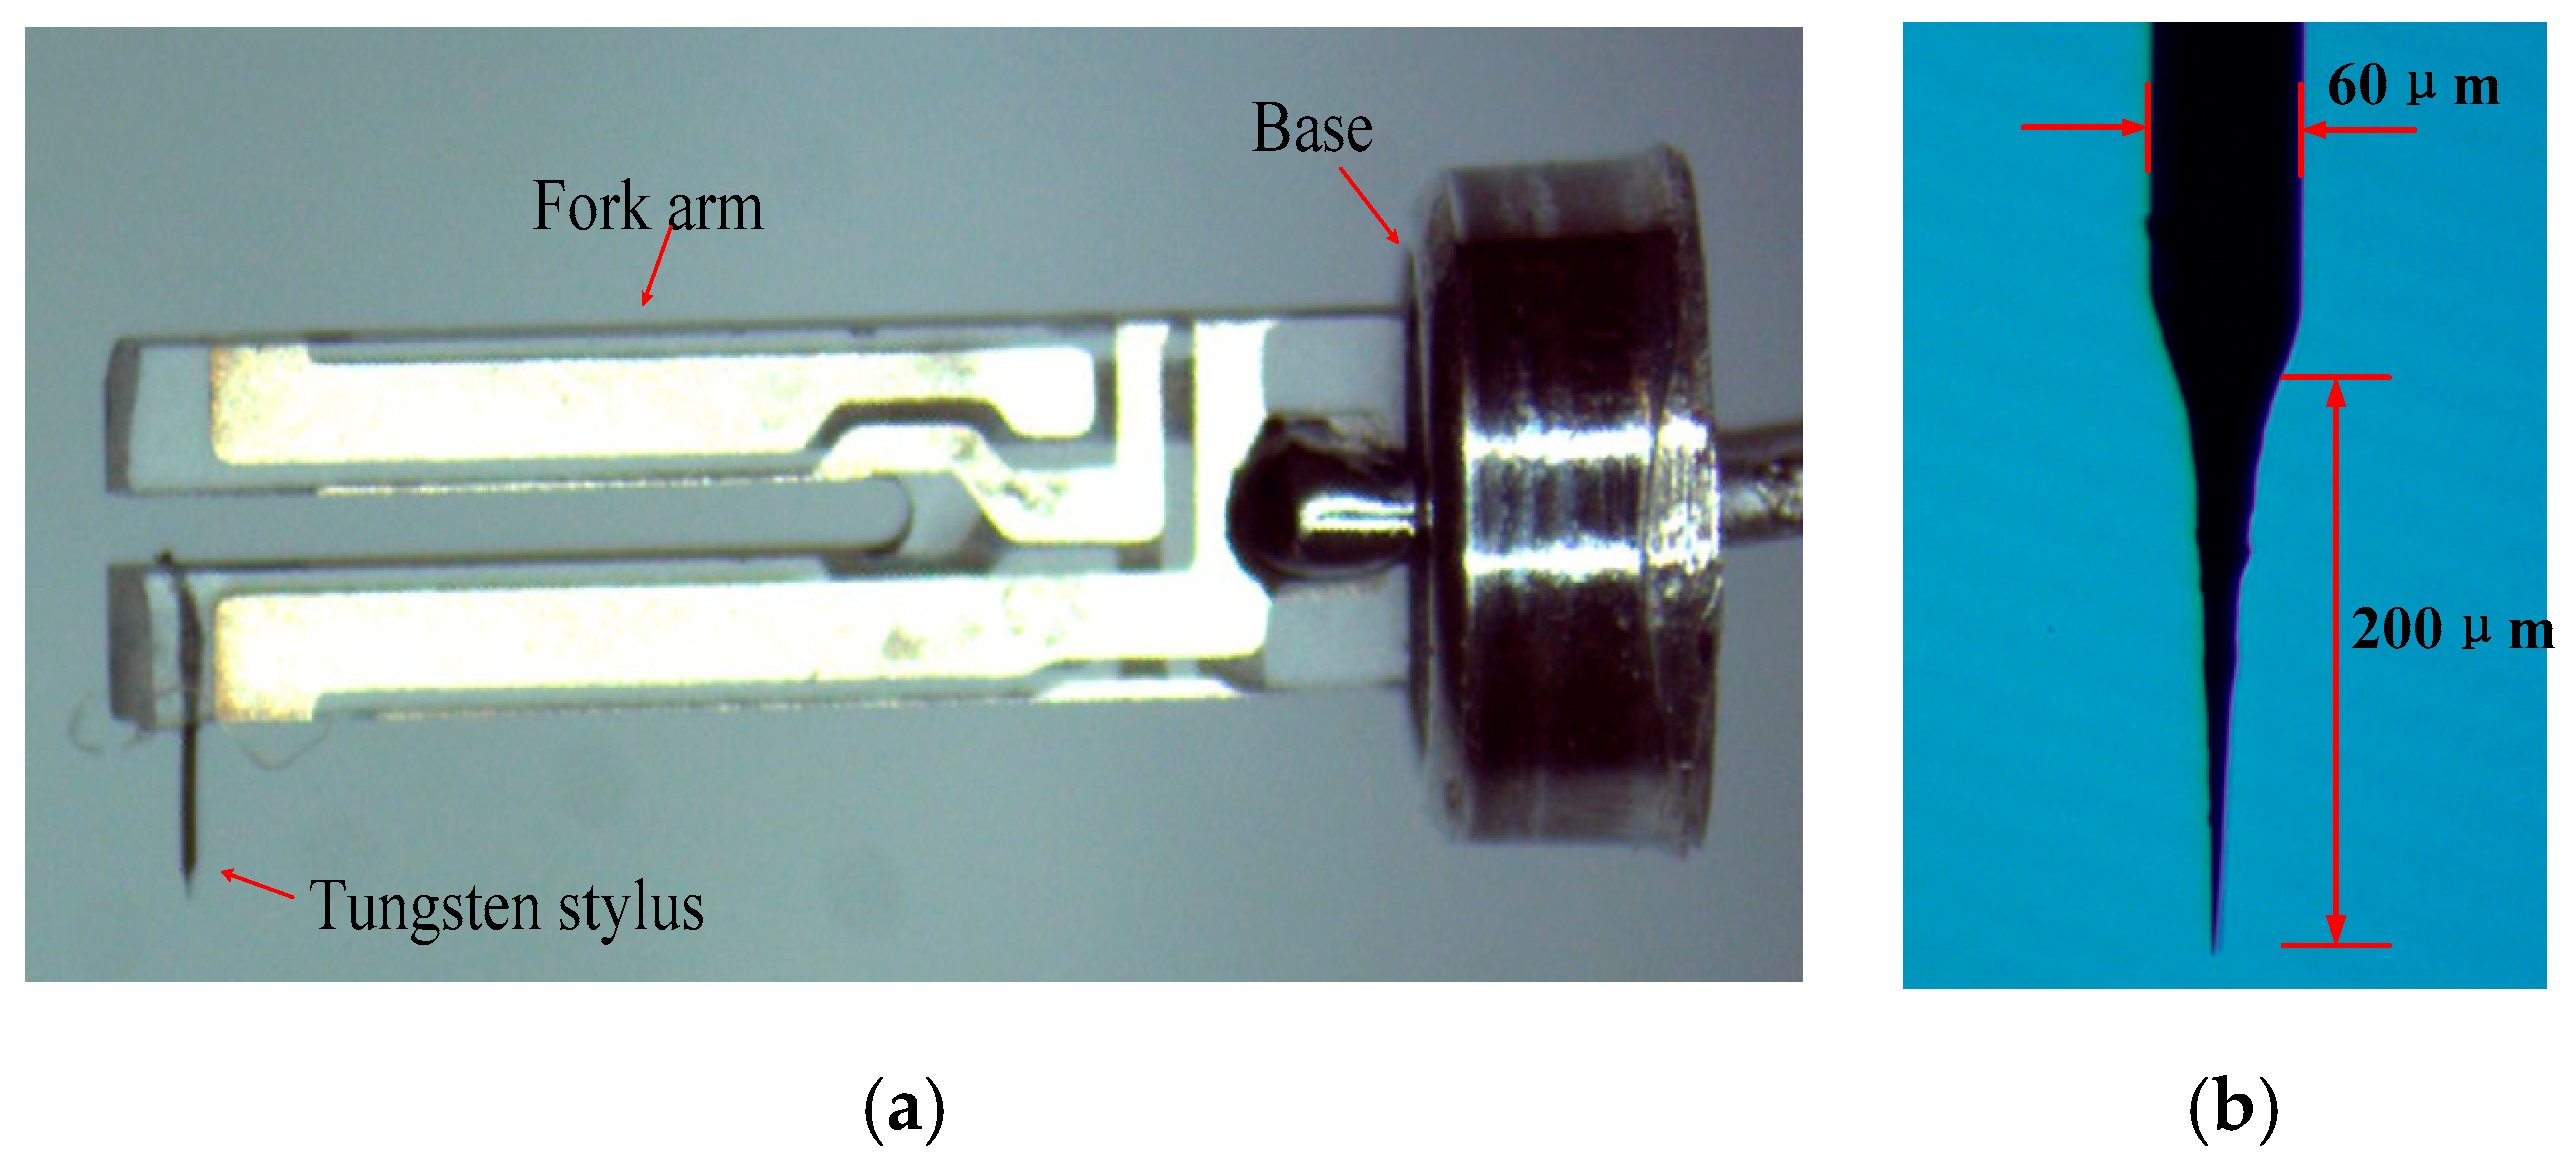
The principle of the proposed microsphere measurement system is demonstrated in Figure 1. In this system, a measured microsphere made of ruby is clamped with a clamping fixture, and the fixture is assembled on a micro stage (Micro stage-3). The line profile of the microsphere in the maximum cross section is scanned simultaneously and differently with two scanning probes (scanning probe-1 and scanning probe-2). During the measurement, the microsphere moves along the Y direction (as shown in Figure 1) via micro stage-3, and the two probes move along the X direction separately and oppositely driven by micro stage-1 and micro stage-2. After one of the cross-sectional profiles is scanned, the microsphere is rotated by the rotary stage with a predetermined degree, such as 30°, and a new profile of the cross section is scanned. Two CCD cameras are installed on the top (This one is not shown in Figure 1) and front of the microsphere to confirm the visual alignment.
The schematic of the measurement process is shown in Figure 2, where a maximal cross-sectional profile of the microsphere is scanned. Figure 2a illustrates the initial position of the measurement process. After one two-point measurement is completed, probes move away from the microsphere in the X direction. Afterward, the microsphere moves down to a new position along the Y direction, and two probes move toward the microsphere to perform a new two-point measurement (Figure 2b). Figure 2c provides the complete result of a maximal cross-sectional profile of the microsphere. After the measurement of one cross-sectional profile is completed, the microsphere is rotated by rotary stage, and another cross-sectional profile can be scanned. By the same way, several cross sections of the microsphere can be measured. The dimensions of the microsphere can be fitted after integrating the data of the multi-sections.
Figure 2.
Measurement of a maximal cross section profile circle: (a) Initial measurement position; (b) Measurement process; (c) A circle measurement is finished.
In the process of measuring a cross-sectional profile, the yaw error is the main factor affecting the measurement accuracy. In our method, after the measurement of one cross-sectional profile is completed, the microsphere is turned with the angle of 180 degrees, and the cross-sectional profile at the opposite position is measured [13]. By measuring the two opposite cross-sectional profiles, the yaw error can be eliminated.
Figure 3a shows the measurement principle of a cross-sectional profile, is the measurement data of scanning probe-1, is the measurement data of scanning probe-2, is the assumed true value of the chord length, and are the morphological errors at left and right, is the yaw error, i is the index of measurement positions. After the measurement of the profile circle shown in Figure 3a is completed, the microsphere is turned with the angle of 180 degrees, and the opposite cross-sectional profile can be measured. The measurement principle of the opposite profile is shown in Figure 3b, is the measurement data of scanning probe-1, is the measurement data of scanning probe-2, is the assumed true value of the chord length of the opposite circle. For the two opposite circles, the measurement results of the two probes can be expressed as:
Figure 3.
Measurement principle of two opposite cross-sectional profiles: (a) The measurement of a cross-sectional profile, (b) The measurement of the opposite cross-sectional profile after turning 180 degrees.
Sum the four equations, the morphological errors and can be automated eliminated, and the yaw error can be separated as the following equation.
For our method, the yaw error in the measurement of every cross-sectional profile will be eliminated, and the measurement accuracy of the microsphere can be guaranteed.
2.2. Scanning Probe
Figure 4 illustrates the structure of the scanning probe, which is constructed with a quartz tuning fork and a tungsten stylus. Figure 4a,b present the photos of the scanning probe and the tungsten stylus, respectively. The tungsten stylus is made of a tungsten wire with a diameter of 60 μm through electrochemical polishing. The effective length of the tungsten stylus can reach 150–200 μm, and the diameter of the stylus tip is about 20–50 nm. The stylus is long and sharp enough to scan the microspheres with diameters of several hundred microns.
Figure 4.
Photography of a scanning probe and tungsten stylus. (a) Photography of a scanning probe; (b) Photography of a tungsten stylus.
In this study, the diameter of the measured microsphere ranges from tens to hundreds of micrometers. According to the scanning strategy shown in Figure 2, a structural interference may occur between the probe tip and the microsphere when the bottom area is scanned because the surface of the microsphere has a large curvature, especially near the bottom (the lower position of the microsphere in Figure 2). Figure 5 shows the structural interference between the probes and the microsphere. The bottom area of the microsphere is omitted during scanning to avoid the influence of the interference (Figure 5b).
Figure 5.
Principle of interference and measuring area. (a) Interference between the probe tip and sphere bottom area; (b) Measurement area.
The type of the quartz tuning fork in this work is Citizen CFS308. The quality factor (Q-factor) and the first eigenfrequency of the fork are approximately 104 and 32.768 kHz in a vacuum, respectively. When the tungsten stylus is adhered to the fork, the resonant frequency of the probes decreases sharply. A sweeping sine signal is chosen as the excitation signal to confirm the resonant characteristic of probes, the resonant frequency of the probes is about 31.9 kHz, and the Q-factor is about 3000. This Q-factor is still very high, and the quartz tuning fork is extremely sensitive to external force. Therefore, such a high Q-factor ensures that the probe has a high spatial resolution. The experimental results reveal that the spatial resolution of the probe is about 0.4 nm.
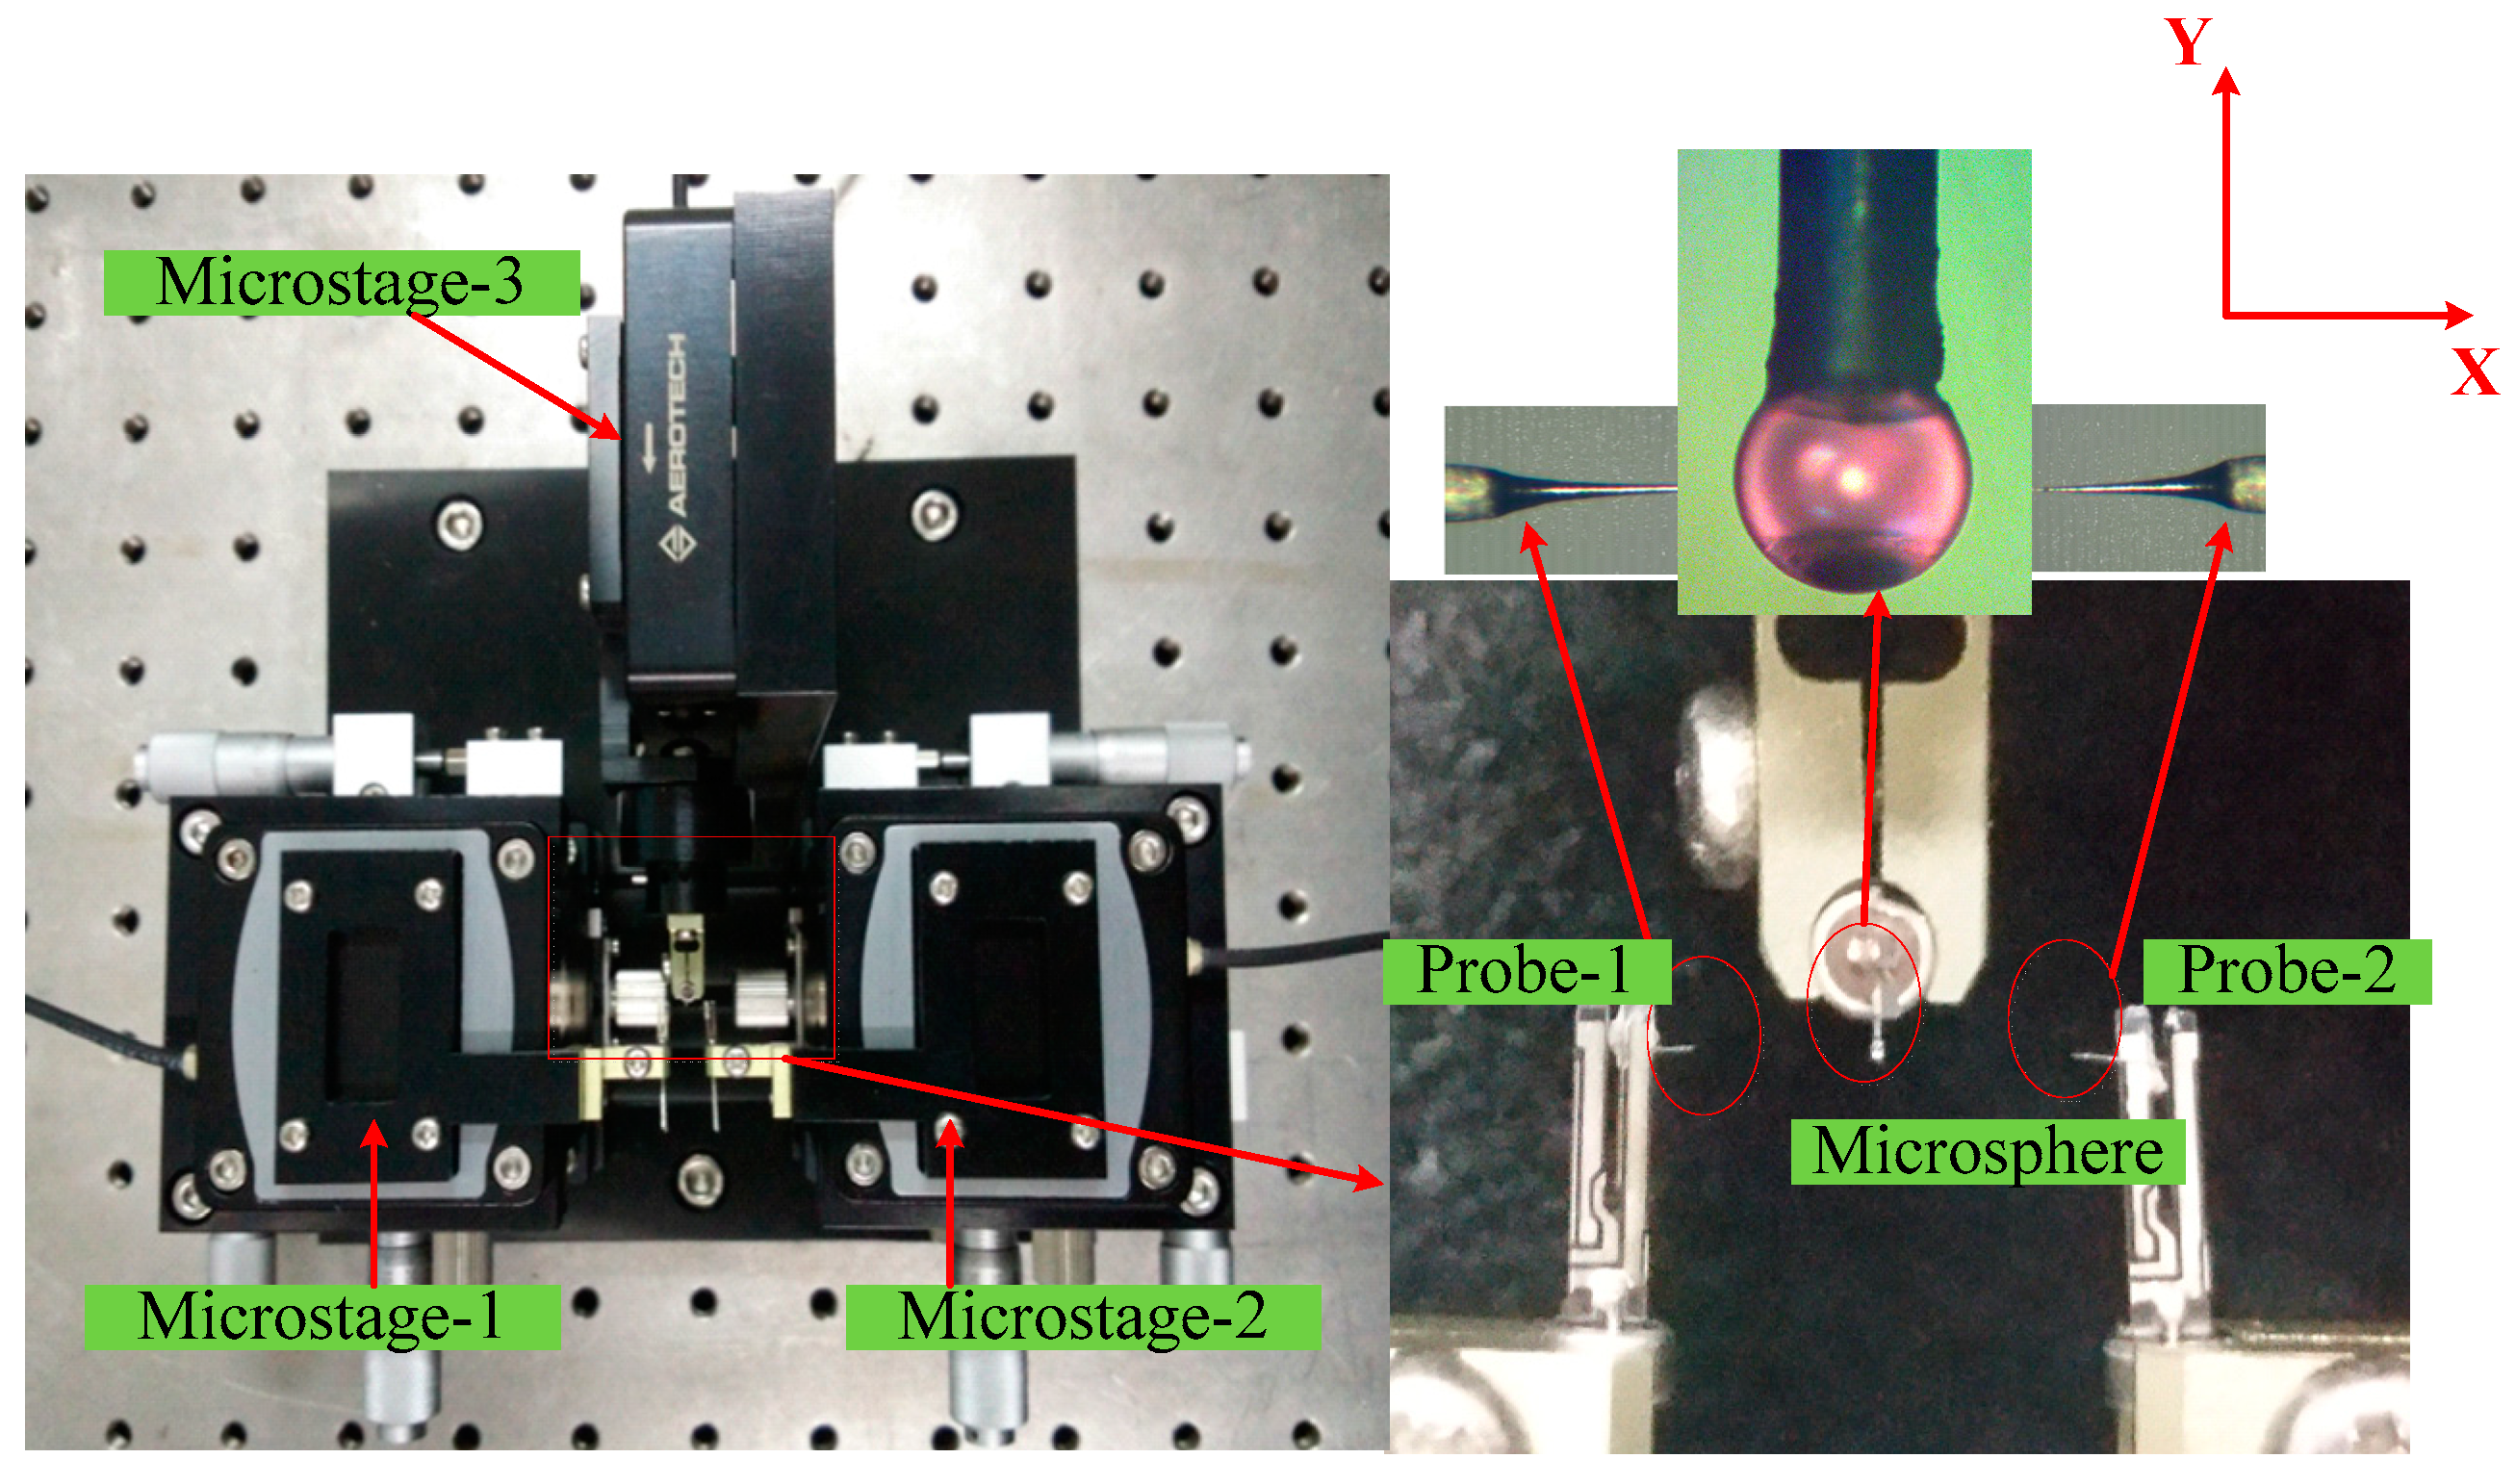
2.3. Assembly Structures
Figure 6 shows the assembly of the scanning probe and the micro stage. The scanning probe is driven to move left and right by the micro stage, and its displacement is measured accurately with a capacitance displacement sensor, which is integrated with the micro stage. The stylus of the scanning probe is adjusted to align with the measuring line of the capacitance sensor and thus the Abbe error of the probe displacement is reduced.
The clamping fixture of the microsphere is shown in Figure 7. The microsphere is mounted in line with the center of the micro stage and can be rotated. Twelve locating holes are evenly distributed around the rotating dial with an interval of 30°. The different cross-sectional profile circles of the microsphere can be scanned by changing the angle of the rotating dial. This fixture ensures that six cross-sectional profiles can be scanned by adjusting the rotating dial. In Figure 1 and Figure 2, the microsphere and the clamping structure are located on the micro stage-3 and moved forward and backward by the micro stage during scanning. The displacement of the microsphere is measured with a capacitance displacement sensor in the micro stage. The clamping structure is designed to align the microsphere with the displacement sensor and thus avoid the Abbe error in the measurement.
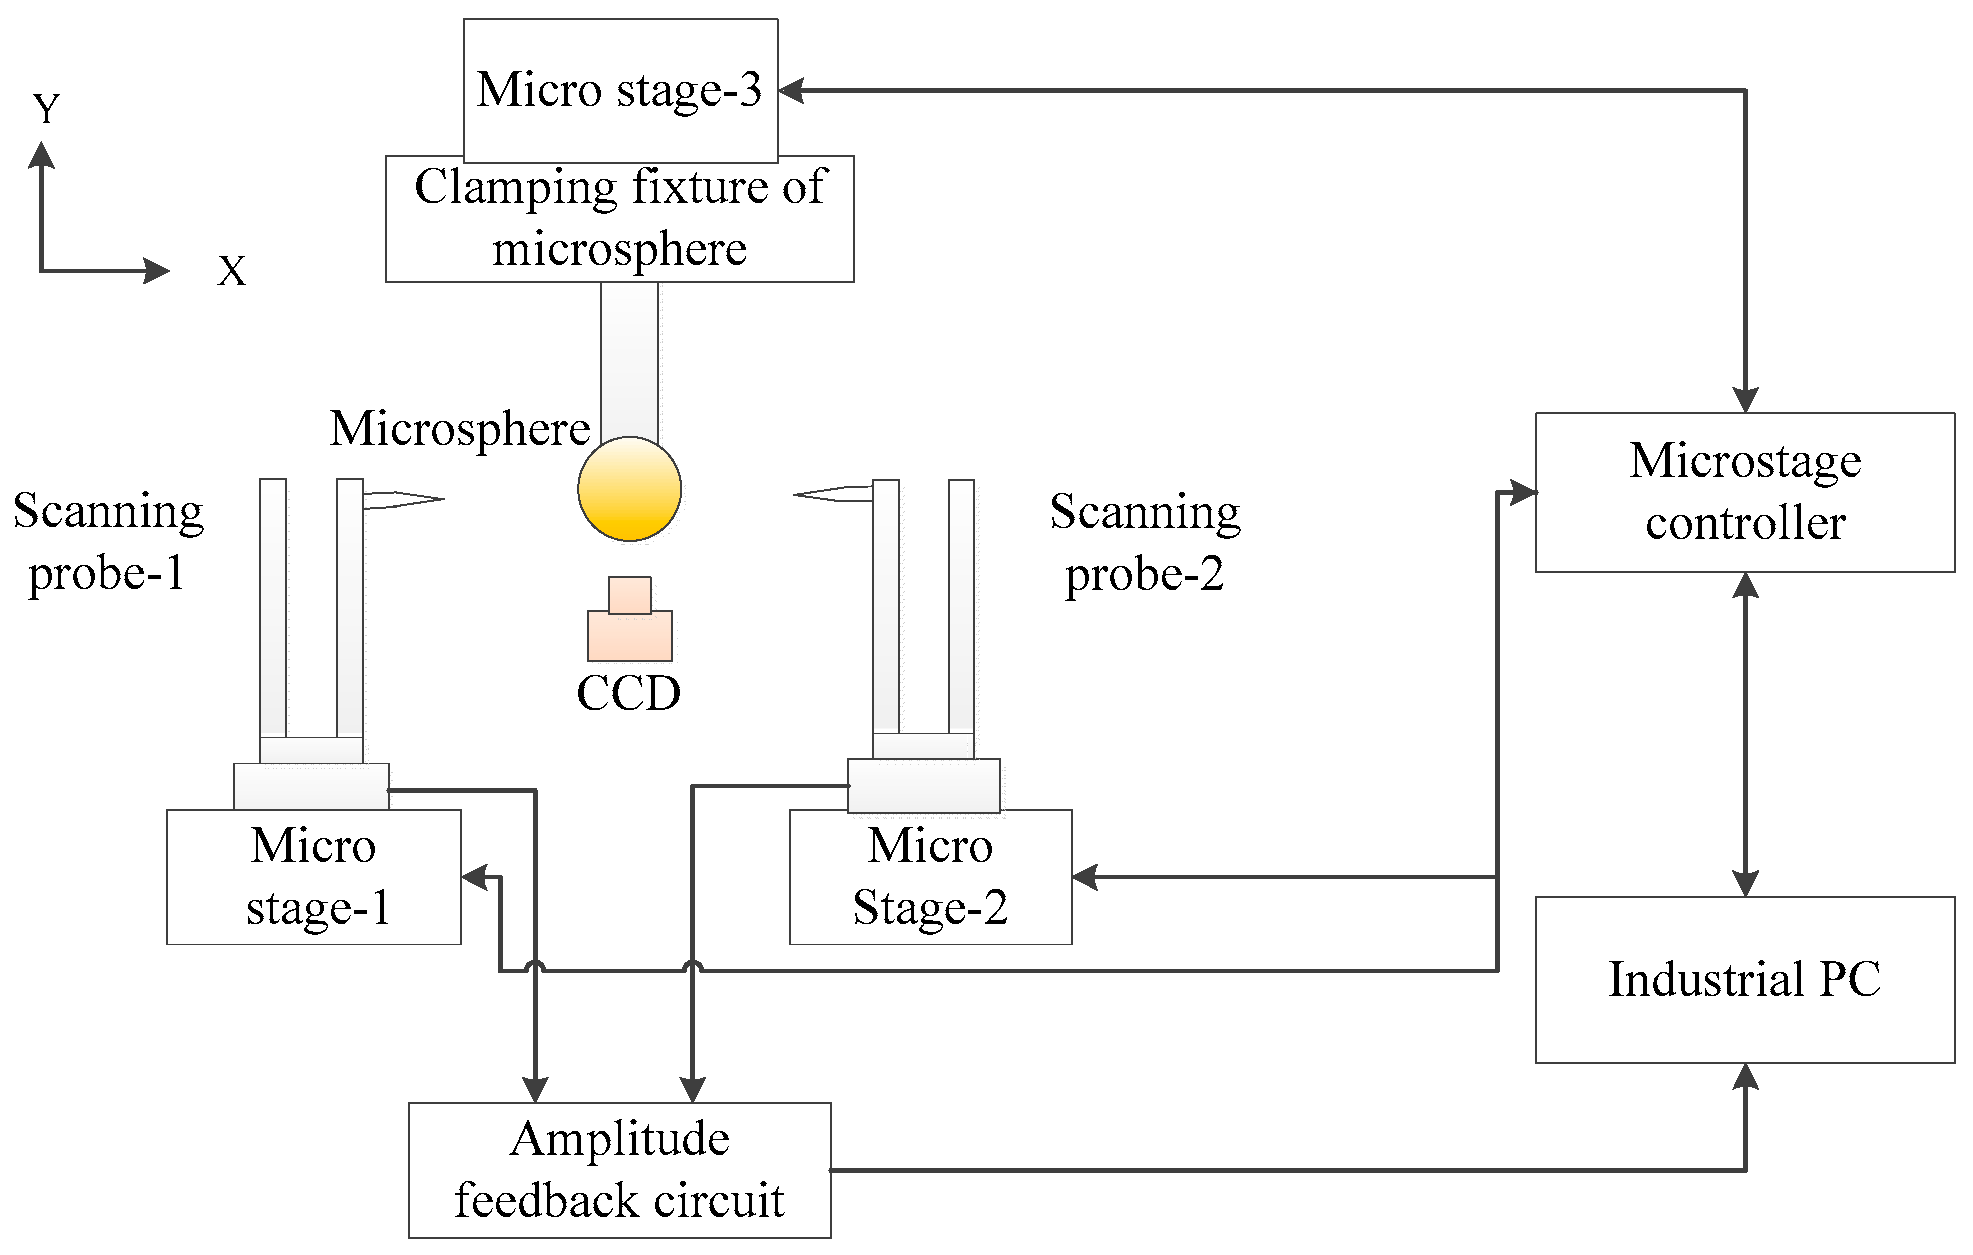
2.4. Microsphere Measurement System
Figure 1 has illustrated the developed measurement system, which comprises a micro stage controller, two CCD cameras, a signal generator, a processing circuit, and a measurement structure. The measurement structure is composed of three micro stages with nano-drive precision in two directions. Figure 8 presents the photograph of the measurement system.
Among the three micro stages produced by Aerotech Inc, Pittsburgh, PA, USA. The stages in the X and Y directions are QNP-50-250L and QNP-60-500L, respectively. The strokes of the stages in the X and Y directions are 250 and 500 μm, respectively. During the measurement, the micro stages are set to work in a closed-loop mode, and the closed-loop control of the stages is conducted with their built-in piezoelectric actuators and capacitance sensors. The corresponding driving resolutions of the stages under the closed loop in the X and Y directions are 0.5 and 0.9 nm, respectively. The pitch and yaw errors of the stages in X and Y directions are 1.2 and 2.5 arc sec, respectively. The position errors of the stages are tiny, the linearity of the stages in X and Y direction are 0.01 and 0.007 percent of the motion displacement, and the bidirectional repeatability errors of the stages in X and Y direction are 1 and 3 nm, respectively. The displacement range of the stage in the Y direction ensures that the microsphere with a diameter of less than 500 μm can be fully measured. The micro stages in X direction are installed on two separate 3D macro platforms, which have strokes of ±6.5 mm in the X and Y directions and 10 mm in the Z direction.
3. Experiment and Results
3.1. Visual Alignment
For the measurement method, both probes must move along the maximal cross-sectional profile. Otherwise, an alignment error occurs in the direction of measurement as shown in Figure 9.
In Figure 9, d is the diameter of the sphere, h is the offset distance between the ideal maximum cross section and the actual cross section in the experiment, and s is the alignment error caused by h. The formula for h is:
As , the formula above can be simplified as:
If d and h are 300 and 1.7 μm, respectively, then s is 10 nm. The probes and the maximum cross section should be aligned very well to reduce the alignment error. Herein, the alignment is adjusted by the 3D macro platform and the two CCD microscopes. The pixel numbers of the camera is 1920 × 1080, the pixel size is 2.75 × 2.75 μm, the objective lens magnification is 4.5, and the field of the view is 1.2 × 0.7 mm. The alignment result is calculated by edge detection of the images based on the wavelet analysis, and h can be controlled at about 1 μm.
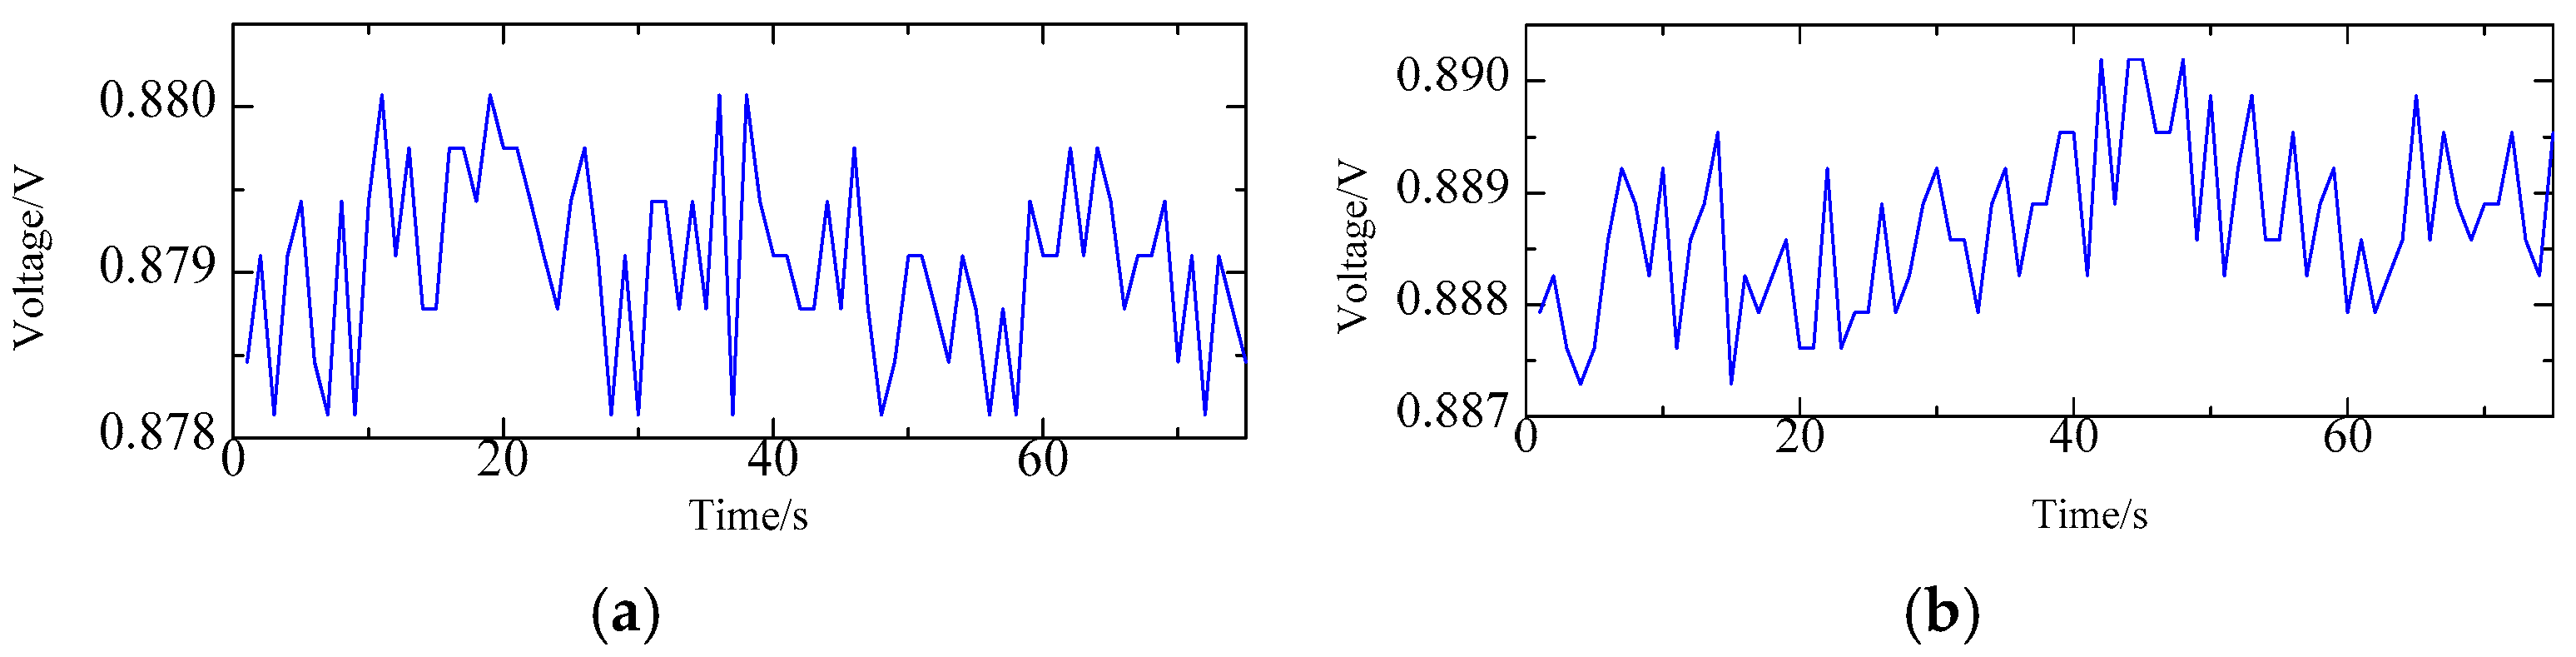
3.2. Properties of Scanning Probes
The approaching curves of the two probes are obtained to calculate the measurement sensitivity (Figure 10). Approach movement is performed by moving the stage toward the microsphere. The approaching curve shows the relationship between the output signal and the displacement of the probe. In the test, the probe vibrates freely at its resonant frequency at the start position, and the probe, together with the micro stage, moves toward the microsphere with a step distance of 5 nm. When the probe taps the microsphere, the vibration amplitude of the probe decreases sharply. The probe, together with the micro stage, stops moving until the amplitude drops to a setpoint value, which is often set as 80% of the free vibration amplitude.
The output voltage of the probe is a linear function of its vibration amplitude. In Figure 10, the slope rate of the decreased part is the sensitivity of the probe, that is, the slope rates of probe-1 and probe-2 are about 7.3 and 8.1 V/µm in the vertical direction, respectively.
When the probes are moving toward the microsphere, the noise curves are about 3 mV for each probe (Figure 11). Combined with the obtained sensitivity, the vertical spatial resolutions for probe-1 and probe-2 can be calculated as 0.41 and 0.37 nm, respectively.
The resolution is calculated in a theoretical way by the sensitivity and the dynamic noise in the vertical direction. During the measurement, the probe is driven by the micro stage, the driving resolution remains on the nanometer scale, which is much smaller than the value of the roundness and sphericity of the microsphere, and the measurement accuracy can be guaranteed.
3.3. Repeatability of Maximal Cross-Sectional Profile Measurement
The maximal cross-sectional profile of the ruby microsphere is measured to verify the feasibility of the proposed method. Figure 12 illustrates a group of measuring data (solid triangle) and its fitted data (blue solid dot).
The data from the two probes are fitted separately by the least-squares method to obtain their respective centers. A coordinate transformation is conducted to make the centers coincide with each other. Thus, the data from the two probes can be integrated with a common center. Then this center is moved to the origin of the coordinate, and the least-squares fitting is implemented for the whole data to acquire the final result of the cross-sectional profile circle. Normally, the shape of the cross section circle is very smooth, and the error in the integration process of the two centers is very small and can be neglected. The experiments are repeatedly performed (four times) to verify stability and repeatability (Figure 13). The standard deviation of the repeatability of a single measurement position is 15.1 nm.
3.4. Microsphere Measurement
As the same measurement procedure of the maximal cross-sectional profile mentioned above, the other five maximal cross-sectional profiles are measured. The intersection angle of any two adjacent sections is 30°, and the six maximal cross-sectional profiles are evenly distributed on the microsphere. Figure 14 shows the measuring data (red solid triangle) and the fitted data (blue solid dot) of the cross-sectional circles.
As mentioned in Section 2.1, the yaw error is eliminated by measuring the two opposite cross-sectional profiles. The yaw error is combined of the linear error and the nonlinear error. The linear error is caused by the non-perpendicularity between the motion direction of the microsphere and the measuring line of the probes, and its value is about 16.5′. The nonlinear error is caused by the microstage-3, and its value fluctuates within −20–20 nm. Measurement results before and after eliminating the yaw are listed in Table 1. The dimensions of the six cross-sectional profiles are estimated. For each cross section of the microsphere, 20 points are sampled to fit the dimensions of the profile circle by the least-squares method. The overall microsphere is constructed with six profiles with 120 points, and this amount of data is sufficient to calculate the sphericity. The diameter and sphericity of the microsphere are fitted by using the least-squares method.
As demonstrated in Table 1, after eliminating the yaw error, the sphericity error of the ruby microsphere is reduced. The measured ruby microsphere in this study is the tip of a Renishaw commercial stylus. The type of the Renishaw commercial stylus is A-5003-5201, the nominal diameter of the ruby microsphere is 300 μm. The ruby microsphere meets grade 5 in the standard of DIN 5401:2002, the dimensional tolerance of the diameter is ±5.63 μm, the spherical dimension deviation of a single circle (roundness: the deviation from sphere form) is 0.13 μm, and the diameter deviation of every circle is less than 0.13 μm.
Table 1 demonstrates that the measured diameters of the six angular cross-sectional circles conform to the diameter tolerance range, the maximum diameter difference of the measured circles is 0.123 μm, and the roundness of the cross section circle is less than 0.13 μm. The measurement results are all consistent with the DIN 5401:2002 standard, and the measurement accuracy of the developed method can be guaranteed.
In this system, after eliminating the yaw error, there are mainly four errors exist in the process of measurement. They are the alignment error of the two probes, the repeatability of the measurement position, the linearity of micro stage-3 and the residual yaw error.
The principle of the alignment error is demonstrated in Figure 9, where the offset distance between the ideal maximum cross section and the actual cross section can be controlled within about 1 μm. The measured diameter is 303.643 μm. According to the principle in Figure 9, the standard deviation of the calculated alignment error is 2.2 nm. The linearity of micro stage-3 is 0.007 percent of the motion displacement estimated based on the technological manual, which is about 9.5 nm. After eliminating the yaw error, the residual errors of the measured six cross-sectional profiles are shown in Figure 15. The residual yaw errors of the measured six cross-sectional profiles are fluctuated within −31.9–26.5 nm, and the standard deviation of the residual yaw is 12.9 nm.
The alignment error, the repeatability, the linearity of micro stage-3 and the residual yaw error are the mainly factors that affect the accuracy of the diameter and the roundness. The combined error of the four errors is approximate 22.1 nm. In the process of the measurement of a cross-sectional circle, the repeatability and the residual yaw error are influenced by each other, thus the actual measurement error is less than the mentioned combined error. For the measurement result after eliminating the yaw error, the standard uncertainty of the diameter of a cross-sectional circle is about 8.3 nm, which is defined as u1 and calculated based on the transitive relation of the least-squares theory. The standard deviation of the diameters of the six cross-sectional profiles is about 23.1 nm and defined as u2. The standard uncertainty of the measured diameter of the microsphere can be calculated by combing u1 and u2, which is about 24.6 nm. Here, the chosen coverage factor k is 2, then the expanded uncertainty of the diameter is 49.2 nm. Therefore, the measured diameter of the microsphere is 303.643 ± 0.049 μm, and the sphericity is 0.132 μm.
4. Conclusions
A measurement method of the microsphere is developed in this study. An experimental system is set up, and a commercial ruby microsphere is measured. For the ruby microsphere, repeated experiments of a maximal cross-sectional profile are conducted, and the repeatability error is 15.1 nm. Cross-sectional circles in six different angles are examined on the basis of the repeated experiments, and the dimensions are fitted by the least-squares method, the diameter of the ruby microsphere is 303.643 ± 0.049 μm, and the sphericity is 0.132 μm. The measurement results are all consistent with the size standard and reveal that our method is effective and accurate.
Author Contributions
Investigation and Methodology, Q.H. and R.L.; Design and perform experiments, C.F. and J.X.; Data processing, L.C.; Writing—original draft preparation, C.F. and C.W.; Writing—review and editing, R.C. and L.Z.
Funding
This research was funded by the National Science Foundation of China (51475131), the Fundamental Research Funds for the Central Universities (JZ2018HGTA0211, JZ2017HGBZ0943).
Conflicts of Interest
The authors declare no conflict of interest.
References
- Fan, K.C.; Fei, Y.T.; Yu, X.F.; Chen, Y.J.; Wang, W.L.; Chen, F.; Liu, Y.S. Development of a low-cost micro-cmm for 3d micro/nano measurements. Meas. Sci. Technol. 2006, 17, 524–532. [Google Scholar] [CrossRef]
- Huang, Q.X.; Wu, K.; Wang, C.C.; Li, R.J.; Fan, K.C.; Fei, Y.T. Development of an abbe error free micro coordinate measuring machine. Appl. Sci. 2016, 6, 97. [Google Scholar] [CrossRef]
- Claverley, J.D.; Leach, R.K. Development of a three-dimensional vibrating tactile probe for miniature cmms. Precis. Eng. 2013, 37, 491–499. [Google Scholar] [CrossRef]
- Hidaka, K.; Schellekens, P.H.J. Study of a small-sized ultrasonic probe. Cirp. Ann-Manuf. Techn. 2006, 55, 567–570. [Google Scholar] [CrossRef]
- Miller, J.; Dutta, S.; Morse, E.; Yague-Fabra, J. Effective stylus diameter determination using near zero-width reference. Precis. Eng. 2011, 35, 500–504. [Google Scholar] [CrossRef]
- Küng, A.; Meli, F.; Thalmann, R. Ultraprecision micro-cmm using a low force 3d touch probe. Meas. Sci. Technol. 2007, 18, 319. [Google Scholar] [CrossRef]
- Zhao, X.S.; Geng, Y.Q.; Li, W.B.; Yan, Y.D.; Hu, Z.J.; Sun, T.; Liang, Y.C.; Dong, S. Fabrication and measurement of nanostructures on the micro ball surface using a modified atomic force microscope. Rev. Sci. Instrum. 2012, 83, 115104. [Google Scholar] [CrossRef] [PubMed]
- Li, Z.Q.; Sun, T.; Li, P.; Zhao, X.S.; Dong, S. Measuring the nose roundness of diamond cutting tools based on atomic force microscopy. J. Vac. Sci. Technol. B 2009, 27, 1394–1398. [Google Scholar] [CrossRef]
- Fan, K.C.; Wang, N.; Wang, Z.W.; Zhang, H. Development of a roundness measuring system for microspheres. Meas. Sci. Technol. 2014, 25, 64009. [Google Scholar] [CrossRef]
- Griesmann, U.; Soons, J.; Wang, Q. Measuring form and radius of spheres with interferometry. Cirp. Ann-Manuf. Techn. 2004, 53, 451–454. [Google Scholar] [CrossRef]
- Bartl, G.; Krystek, M.; Nicolaus, A.; Giardini, W. Interferometric determination of the topographies of absolute sphere radii using the sphere interferometer of ptb. Meas. Sci. Technol. 2010, 21, 115101. [Google Scholar] [CrossRef]
- Chen, L.C. Automatic 3d surface reconstruction and sphericity measurement of micro spherical balls of miniaturized coordinate measuring probes. Meas. Sci. Technol. 2007, 18, 1748–1755. [Google Scholar] [CrossRef]
- Evans, C.J.; Hocken, R.J.; Estler, W.T. Self-calibration: Reversal, redundancy, error separation, and ‘absolute testing’. CIRP Annals 1996, 45, 617–634. [Google Scholar] [CrossRef]
© 2019 by the authors. Licensee MDPI, Basel, Switzerland. This article is an open access article distributed under the terms and conditions of the Creative Commons Attribution (CC BY) license (http://creativecommons.org/licenses/by/4.0/).