Article

Solvent Effects in Highly Efficient Light-Induced Molecular Aggregation

by
Masayuki Shirakawa
1,
Takayoshi Kobayashi
2,3 and
Eiji Tokunaga
1,*
1
Department of Physics, Faculty of science, Tokyo University of Science, 1-3 Kagurazaka, Shinjuku-ku, Tokyo 162-8601, Japan
2
Advanced Ultrafast Laser Research Centerand Department of Engineering Science, the University of Electro-Communications, Chofu, Tokyo 182-8585, Japan
3
Department of Electrophysics, National Chiao-Tung University, Hsinchu 300, Taiwan
*
Author to whom correspondence should be addressed.
Appl. Sci. 2019, 9(24), 5381; https://doi.org/10.3390/app9245381
Submission received: 7 October 2019 / Revised: 5 December 2019 / Accepted: 6 December 2019 / Published: 9 December 2019
(This article belongs to the Section Applied Physics General)

Abstract

:
It has been reported that when irradiated with laser light non-resonant with the main absorption peaks, porphyrin molecules (4-[10,15,20-tris(4-sulfophenyl)-21,24-dihydroporphyrin-5-yl]benzenesulfonic acid, TPPS) in an aqueous solution become 10,000 to 100,000 times more efficient in light-induced molecular aggregation than expected from the ratio of gradient force potential to the thermal energy of molecules at room temperature. To determine the mechanism of this phenomenon, experiments on the light-induced aggregation of TPPS in alcohol solutions (methanol, ethanol, and butanol) were performed. In these alcohol solutions, the absorbance change was orders of magnitude smaller than in the aqueous solution. Furthermore, it was found that the absorbance change in the aqueous solution tended to be saturated with the increase of the irradiation intensity, but in the ethanol solution, the absorbance change increased linearly. These results can be qualitatively explained by the model in which intermolecular light-induced interactions between molecules within a close distance among randomly distributed molecules in the laser irradiation volume are highly relevant to the signal intensity. However, conventional dipole–dipole interactions, such as the Keesom interaction, are not quantitatively consistent with the results.

1. Introduction

Since optical trapping and manipulation of a micro-meter size particle were achieved by A. Ashkin and co-workers in 1970–80s [1,2], laser trapping has been applied not only to biological cells [3,4], but also to smaller particles such as biomolecules [5] and nanoparticles [6,7,8,9]. Although there have also been reports on the possibility of single molecular trapping at room temperature [10,11] and a manipulation method of single molecules with resonant laser irradiation has been theoretically proposed [12,13,14], stable trapping and manipulation of 1-nm-sized molecules at room temperature via light-gradient force is challenging. This is because the optical trapping potential ( ( 1 / 2 ) α F 2 ) of molecules due to the light-induced force (gradient force) is much smaller than the kinetic energy of the thermal motion of the molecules (KBT) at room temperature due to the tiny polarizability volume for α of the molecules.
In general, for stable trapping of particles or other moieties at room temperature, the trapping potential has to be deeper than the thermal energy at the temperature. Although the use of a sufficiently high-power laser is a possible choice to approach this condition, it can cause thermal effects and disturbs optical trapping. Therefore, recent research has focused on enhancing the laser-induced force by exploiting the surface plasmonic effects to overcome the thermal disturbance and limited focus size due to diffraction [15,16]. In many cases, plasmon optical tweezers employ metal nano structures to enhance the optical force between metal nano-gaps [17,18]. Another experimental method exploits the opto-thermoelectric field generated from opto-thermal fluidics [19].
Photophysical crystallization or aggregation with non-resonant laser irradiation has also been studied for decades [20,21] and is applied for preparing protein single crystals for X-ray diffraction analysis of the atomic structure of proteins [22,23,24,25]. The optical trapping force is also applied for laser crystallization and aggregation [26,27]. In most of these studies, supersaturated solutions of solute molecules that form crystals or aggregates in equilibrium states were irradiated with laser light. In these experiments, the laser works as either a trigger for nucleation or an accelerator of crystal growth [28,29]. Recently, there have been interesting reports on the crystallization or aggregation of organic molecules “on air-liquid surfaces” utilizing light-induced force as a direct trapping force instead of a mere trigger [30,31,32].
For molecular J-aggregates [33,34], some reports have demonstrated the formation of J-aggregates in a saturated solution via laser irradiation [26,27]. The “bottom-up” approach exploits the self-assembly nature of J-aggregates to form nanostructures, e.g., layer structures [35,36,37]. It is well known that the concentration of solutes and electrolytes, pH [38,39,40], temperature [41], and solution viscosity [42] contribute to formation of J-aggregates. Moreover, there is a collaborative effect on aggregation formation among the molecular hydrophobic effect and molecular-solvent and intermolecular hydrogen bonding [43,44,45], making the solvent effect on the aggregation phenomenon diverse. Additionally, it is difficult to control the size of micro-aggregates that configure macro-aggregates [46] because the generation of micro-aggregates occurs during the rapid change of the first-order phase transition and is highly dependent on the surrounding environment [41,47]. Intermediate states in the formation process of micro-aggregates are considered to have a very short transient lifetime and are difficult to clearly identify.
In our preceding paper [48], we proposed to employ an absorption spectrum to observe the changes in molecular aggregation states introduced by light-induced force. In previous research, the processes of crystal growth or aggregation of amino acids and proteins by light-induced force have been observed primarily via fluorescence imaging, light-scattering imaging, or fluorescence spectrum measurement [26,27]. However, fluorescence signals generally reflect only the lowest excited electronic states, and light-scattering signal intensity is too weak to provide the properties of micro-aggregates. Thus, it is difficult to obtain detailed information about aggregation states such as aggregation numbers from the spectroscopic methods listed above.
We have successfully identified in the previous report [48] that the aggregation states of porphyrin molecules, 4-[10,15,20-tris(4-sulfophenyl)-21,24-dihydroporphyrin-5-yl]benzenesulfonic acid (TPPS), are formed in an unsaturated solution with continuous-wave laser irradiation, off-resonant from main molecular absorption peaks. We have observed absorbance change, Δ A ~ 10 3 , in the resonance region of the optical transition to the aggregation state. Surprisingly, this absorbance change is approximately 104–105 times larger than the ratio of the optical trapping potential energy to the thermal energy (10−7–10−8), and its physical mechanism is unknown. Differing from previous studies [10,26,27,28,29,30], our study employs neither a metal nanostructure to enhance the optical force via a plasmonic effect [15,16,17,18] nor other surface effects [30,31,32]. In this paper, to determine how to elucidate the mechanism of the phenomenon, we investigate the solvent dependence of the light-induced absorbance change.

2. Materials and Methods
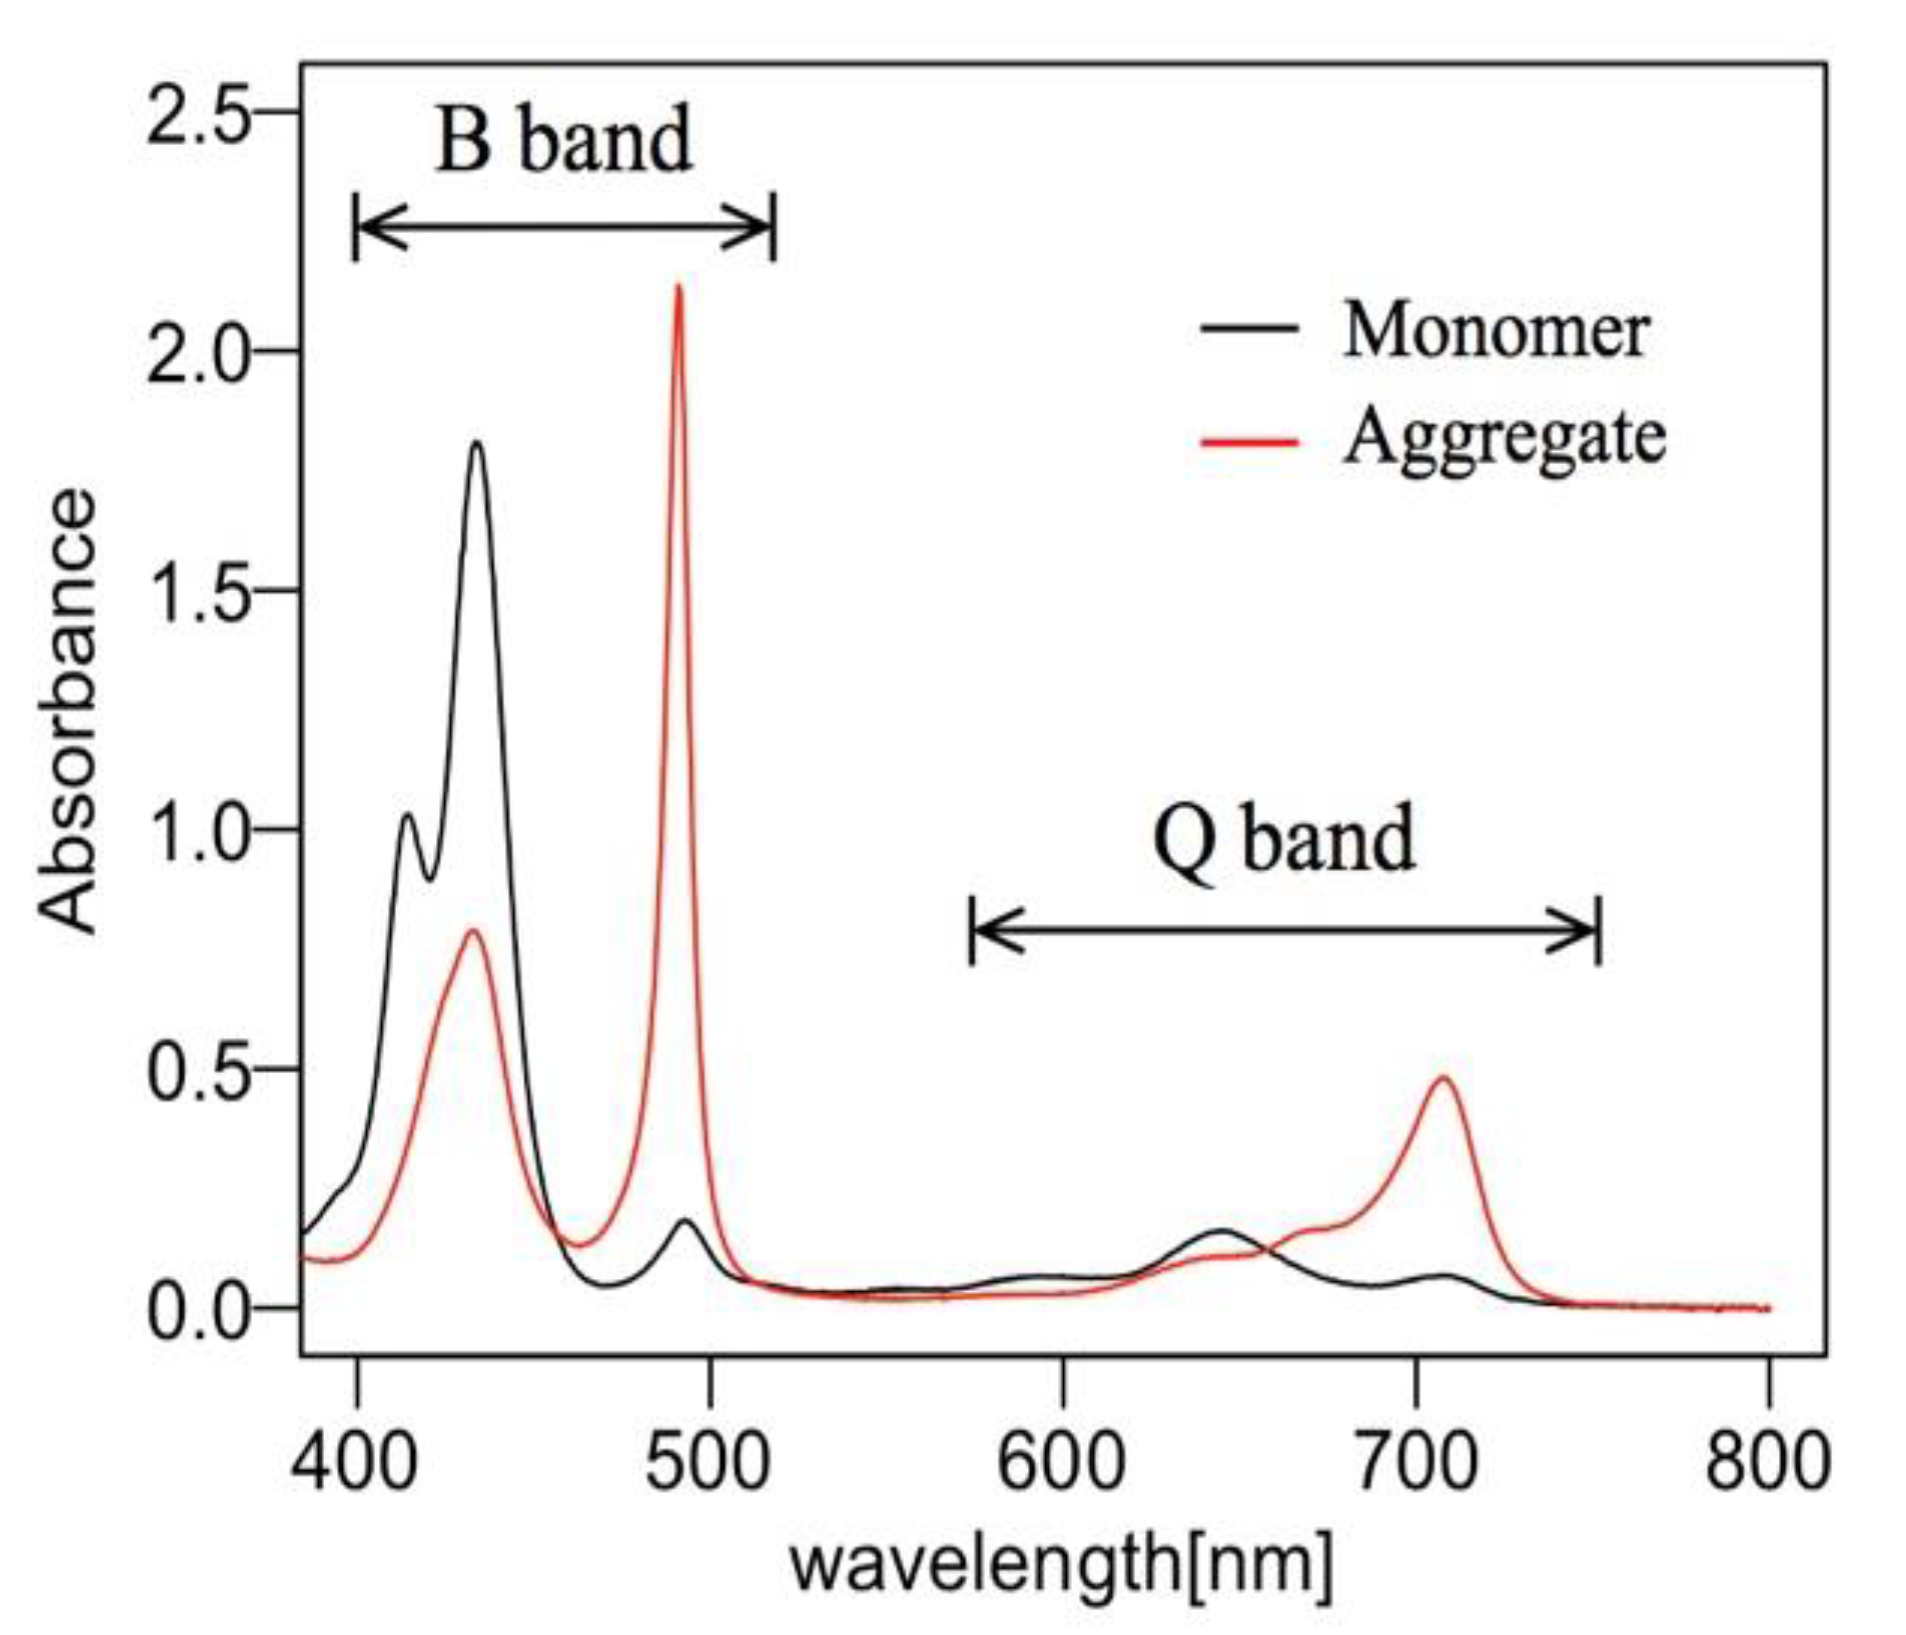
2.1. J-Aggregate

TPPS has three states with different absorption peaks: free-base “F” monomers, diacid “D” monomers, and J-aggregates. The state of TPPS changes depending on the pH and solute concentration. When the pH value is lowered and the proton concentration is raised, its state changes from F monomers to D monomers and from D- to J-aggregates [38,39]. For the F monomer state, TPPS absorbs the near far-red region and blue region, called the Q band and B band, respectively. This band structure can be explained by Gouterman’s four-orbital model and originates from HOMO-LUMO (Highest Occupied Molecular Orbital-Lowest Unoccupied Molecular Orbital) splitting due to asymmetry of the molecular electronic structure [49,50]. The TPPS monomer exists as an F monomer whose absorption peaks at 414 nm in poor solvent of protons. When protons are contained in the solution at a sufficiently high concentration, they coordinate to nitrogen atoms in porphyrin rings, and the TPPS molecules change into the D monomers, whose absorption peaks at 433 nm, 19-nm redshifted from the F monomers. The D monomers form stable J-aggregates with the Coulomb interaction, which is enhanced by proton coordination to nitrogen atoms in porphyrins [51]. When porphyrins form J-aggregates, the molecules align straight in the microscale, and the absorption peak redshifts to 490 nm and narrows due to the Coulomb interaction between the molecules’ transition dipole moments, forming a so-called “Frenkel exciton” (Figure 1). The energy level is redshifted by the exciton formation described by the following Equations (1) and (2):
E k = E 0 + 2 J cos ( k π N + 1 ) ,
J = M 2 4 π ε r 3 ( 1 3 cos 2 θ 0 ) ,
where M is the transition dipole moment, r is the distance between molecules, θ 0 is the aggregation angle, ε is the permittivity of the solvent, and k is the state number of the Frenkel exciton.
A one dimensional aggregated state is termed a micro-aggregate or coherent aggregate, and its exciton wave function stays coherent. Then, micro-aggregates form a higher-order structure called “macro-aggregates”, e.g., with a sheet or tube structure [52,53]. Figure 1 shows the absorption spectra of TPPS samples in water in a 1-mm-thick quartz cell that were measured with a spectrophotometer (Shimadzu, UV-3150). When the monomer state was dominant in the sample solution, the F monomer absorption peak at 414 nm and the D monomer absorption peak at 433 nm appeared, forming the B band. However, when the J-aggregate was dominant, the J-aggregate absorption peak at 490 nm became prominent. During the change from monomers to aggregates, the absorption peak in the Q band was also redshifted.

2.2. Sample Preparation

In this experiment, we prepared several liquid samples wherein TPPS molecules (Tokyo Chemical Industry, Tokyo, Japan) were dissolved in different solvents. We used purified water (San-ei Chemical Co., Kumamoto, Japan), ethanol, methanol, and butanol (Kanto Chemical Co., Tokyo, Japan) as the sample solutions. We prepared a 0.82-mmol/L water solution of TPPS by dissolving 3.9 mg of TPPS in 5.1 mL of purified water. Then, 400 µL of the 0.82-mmol/L TPPS water solution was measured with a micro-pipet and diluted with 5 mL of water, methanol, ethanol, and butanol. To prepare the F monomer state samples for each solvent, 200 µL of 0.1-mol/L NaOH aqueous solution was added to the prepared diluted sample for the aqueous and methanol samples, and 400 µL for the ethanol and butanol samples. The twofold amount of the NaOH aqueous solution was needed for ethanol and butanol solutions to be in the F monomer state. The prepared samples were all in the F monomer state and had an absorption peak at 414 nm. The concentrations of the samples are listed in Table 1. For the alcohol solutions, the listed concentrations were estimated from the ratio of absorption spectrum area of the TPPS F monomer peak (These concentration values are nearly the same as those estimated from the above dilution process, but the estimation based on the oscillator strength may be more accurate considering the measurement errors).

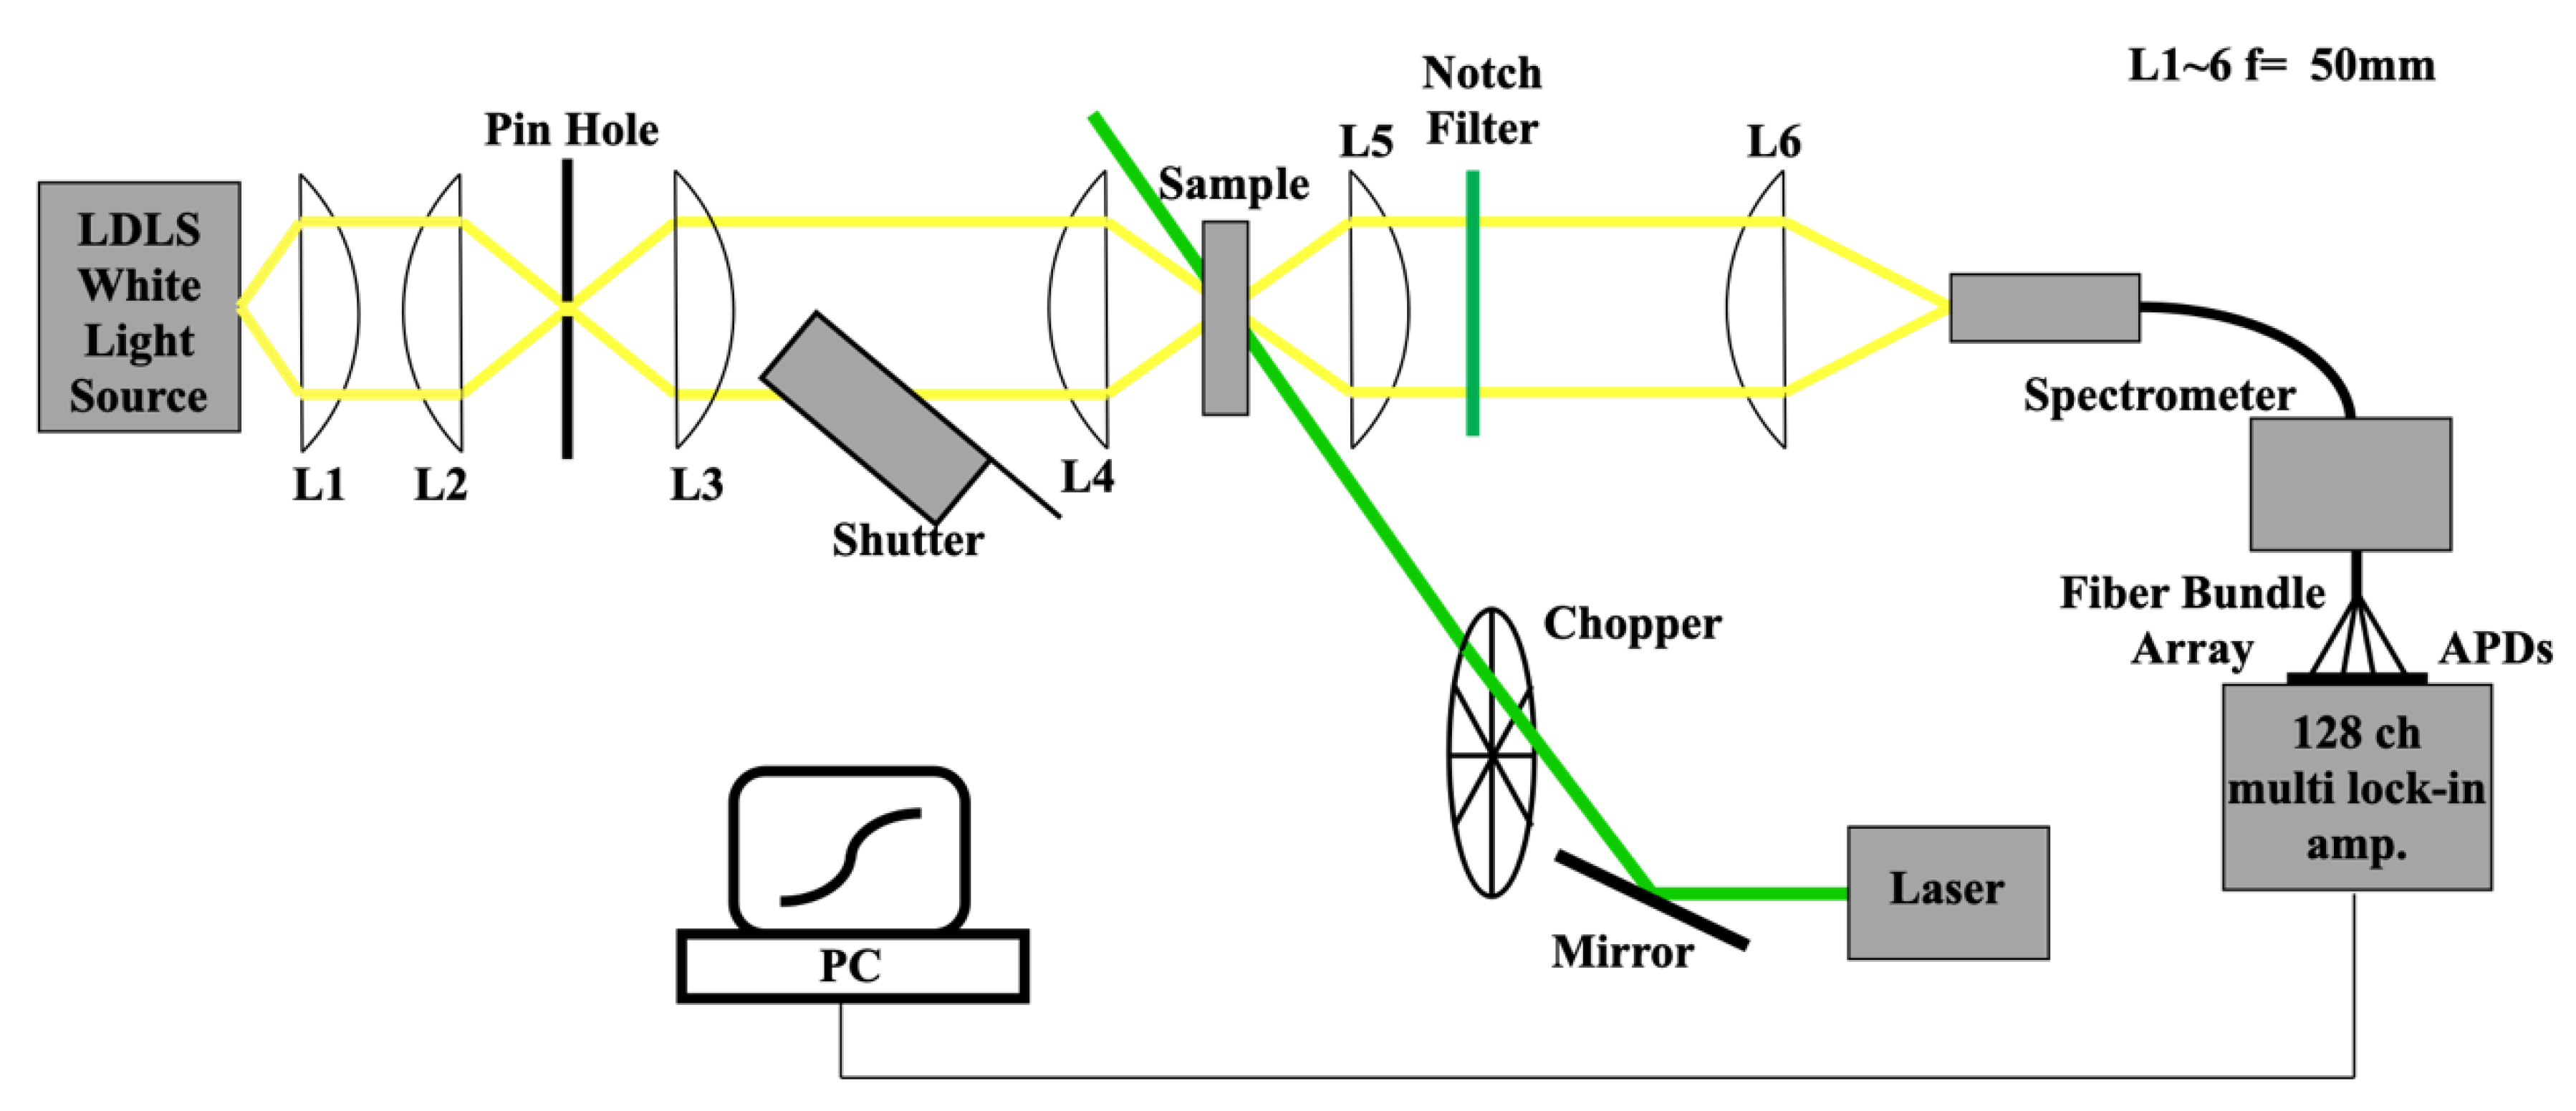
2.3. Experimental Set-up

In our experiment, through the absorbance change spectra, we observed the aggregation state of the TPPS changes with laser irradiation. The pump-probe experimental set-up to detect the absorbance change spectra is shown in Figure 2. The stationary white light from the laser-driven Xe light source (EQ-99, Energetiq Technology, Inc., Wilmington, MA, United States) used as the probe was collimated and focused on a sample with achromatic lenses in general cases and with quartz lenses when we studied a shorter wavelength region than the F monomer peak for the results of Section 3.3. The transmitted light was detected by a spectrometer (Acton SpectraPro 300i, Acton Research Co., Acton, MA, USA) with a 128-channel lock-in detector. When the pump was intercepted at 227 Hz by a mechanical chopper, the laser light was commonly focused on the sample with the probe light. Pump-induced change in the transmitted probe light spectrum was observed primarily in the wavelength range of the B band. The change in the transmitted light intensity synchronized with the pump modulation frequency included photoluminescence from the sample, therefore the probe light was also modulated using a shutter to detect the change correlated with both pump and probe modulations via tandem lock-in detection. This procedure prevented contribution from the photoluminescence in the detected signal. A detailed description of the tandem multichannel lock-in detection method is given as an example in Refrences [54,55]. The irradiation laser light source was a diode-laser-pumped solid-state laser (MGL-FN-532-1W, Changchun New Industries Optoelectronics Tech. Co., Changchun, China) at 532 nm. We observed the irradiation intensity dependence of absorption change spectra by increasing the irradiation power from 173 mW to 1260 mW for the water and ethanol samples. To prevent decolorization from heating via laser absorption, the sample solution was flowed at 4 cm/s with a perista pump (SJ-1211, ATTO Co., Tokyo, Japan) in a cell constructed from two slide glasses and an inserted 300-µm flouroplastic spacer.

3. Results and Discussion

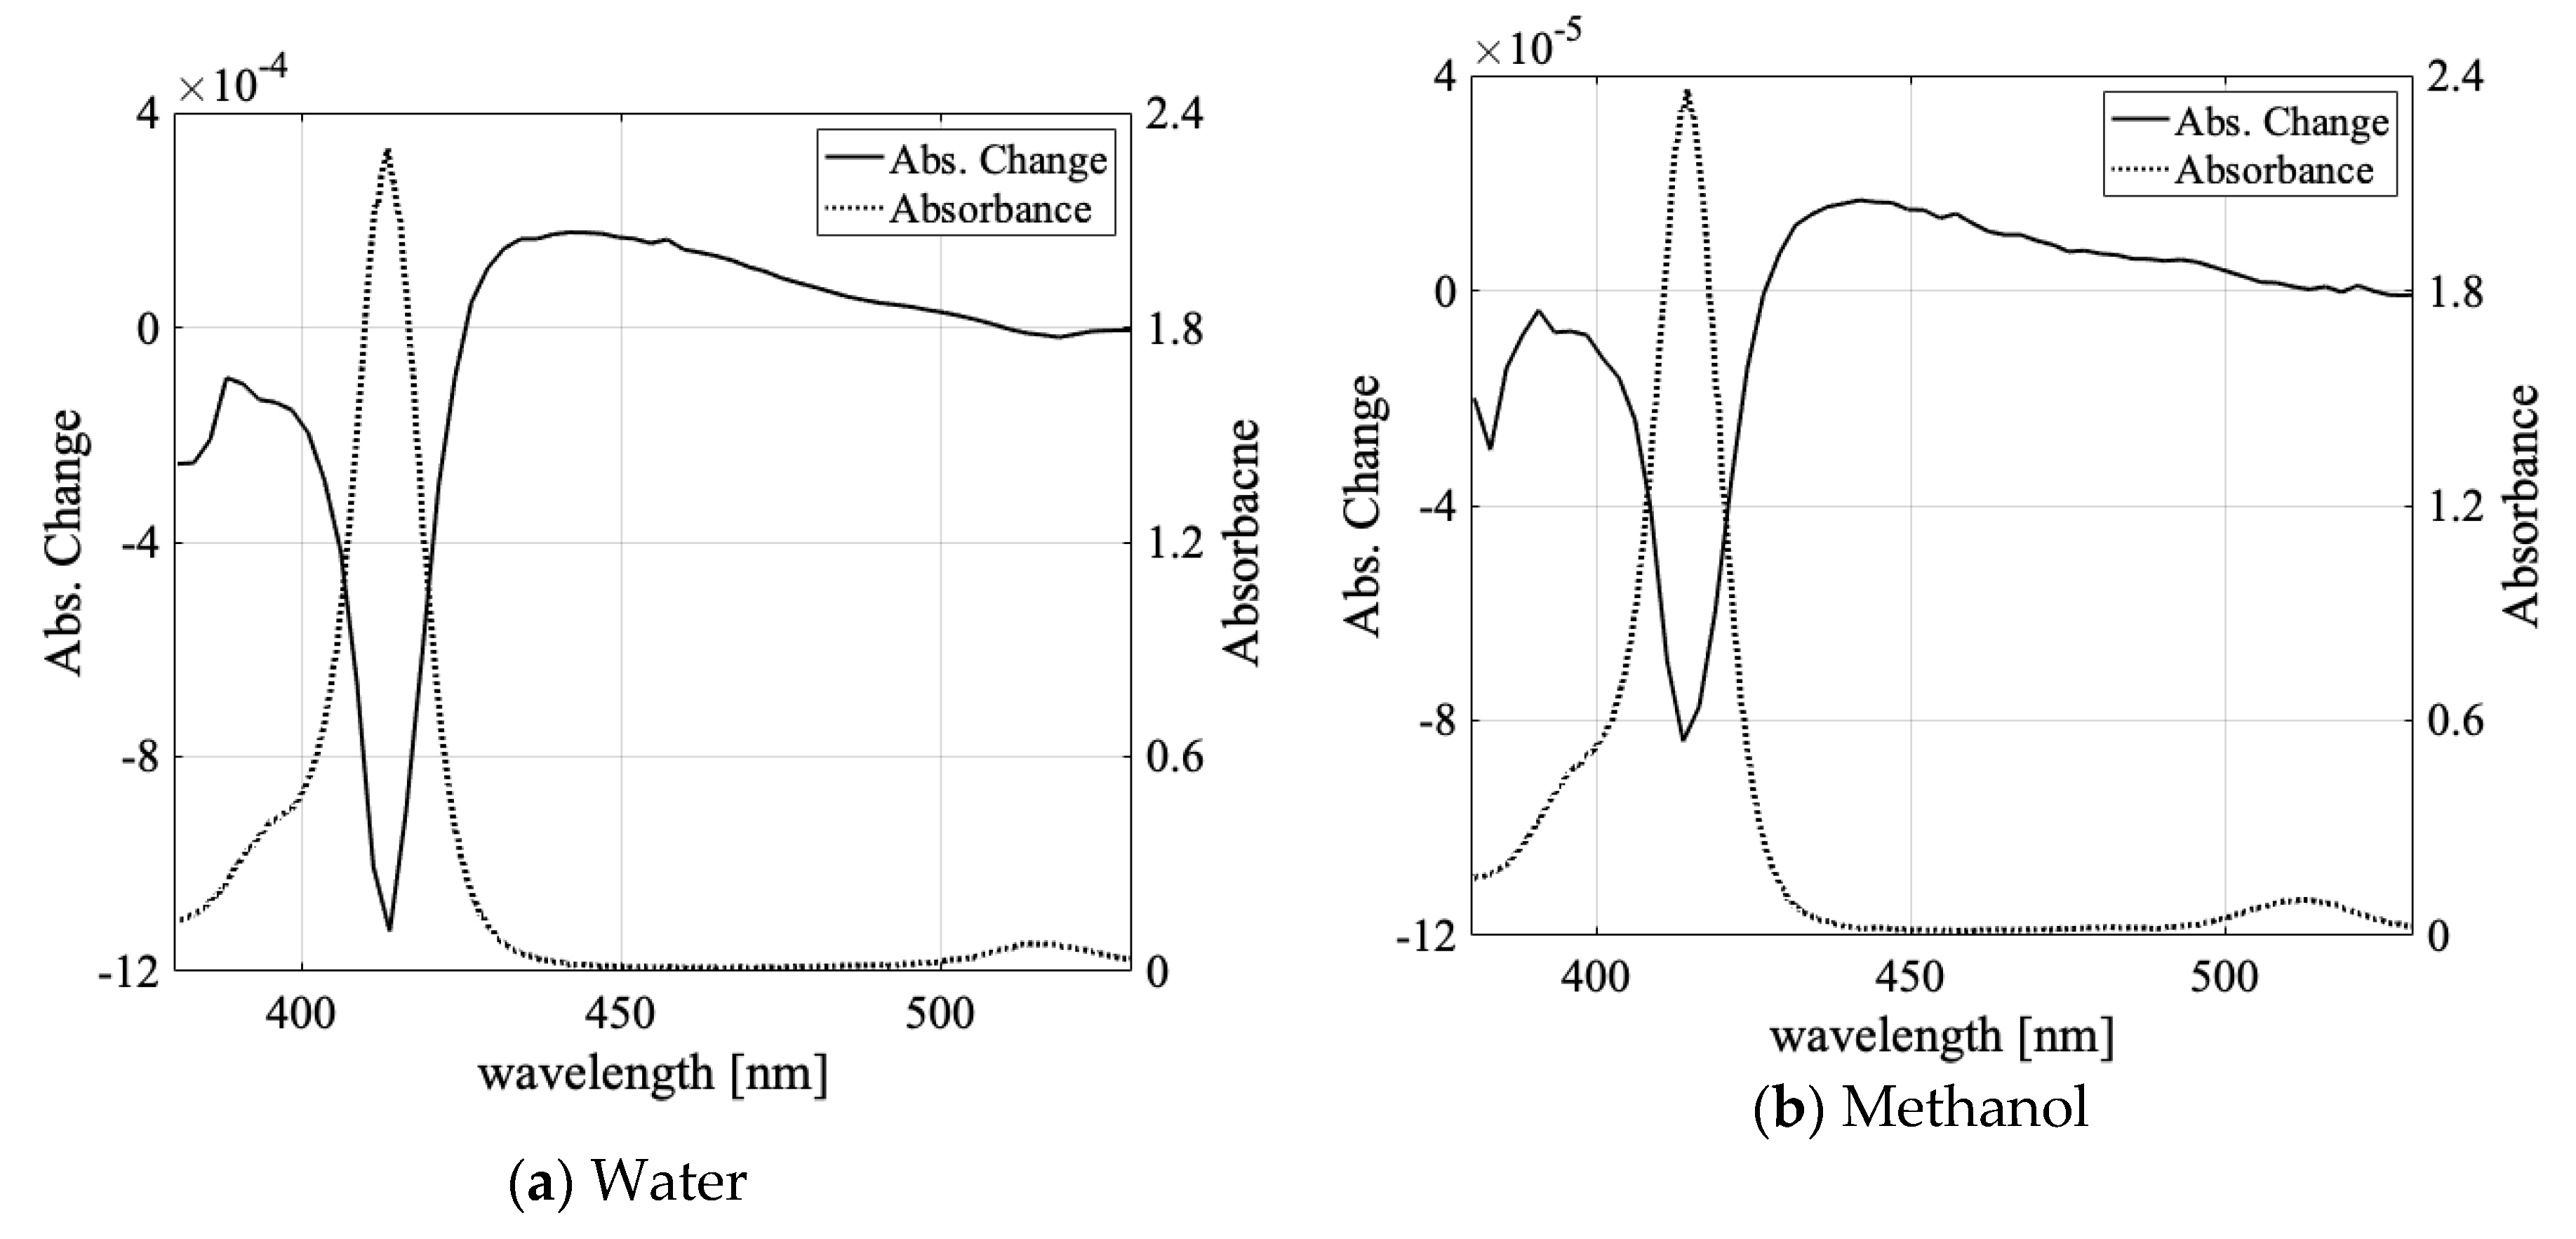
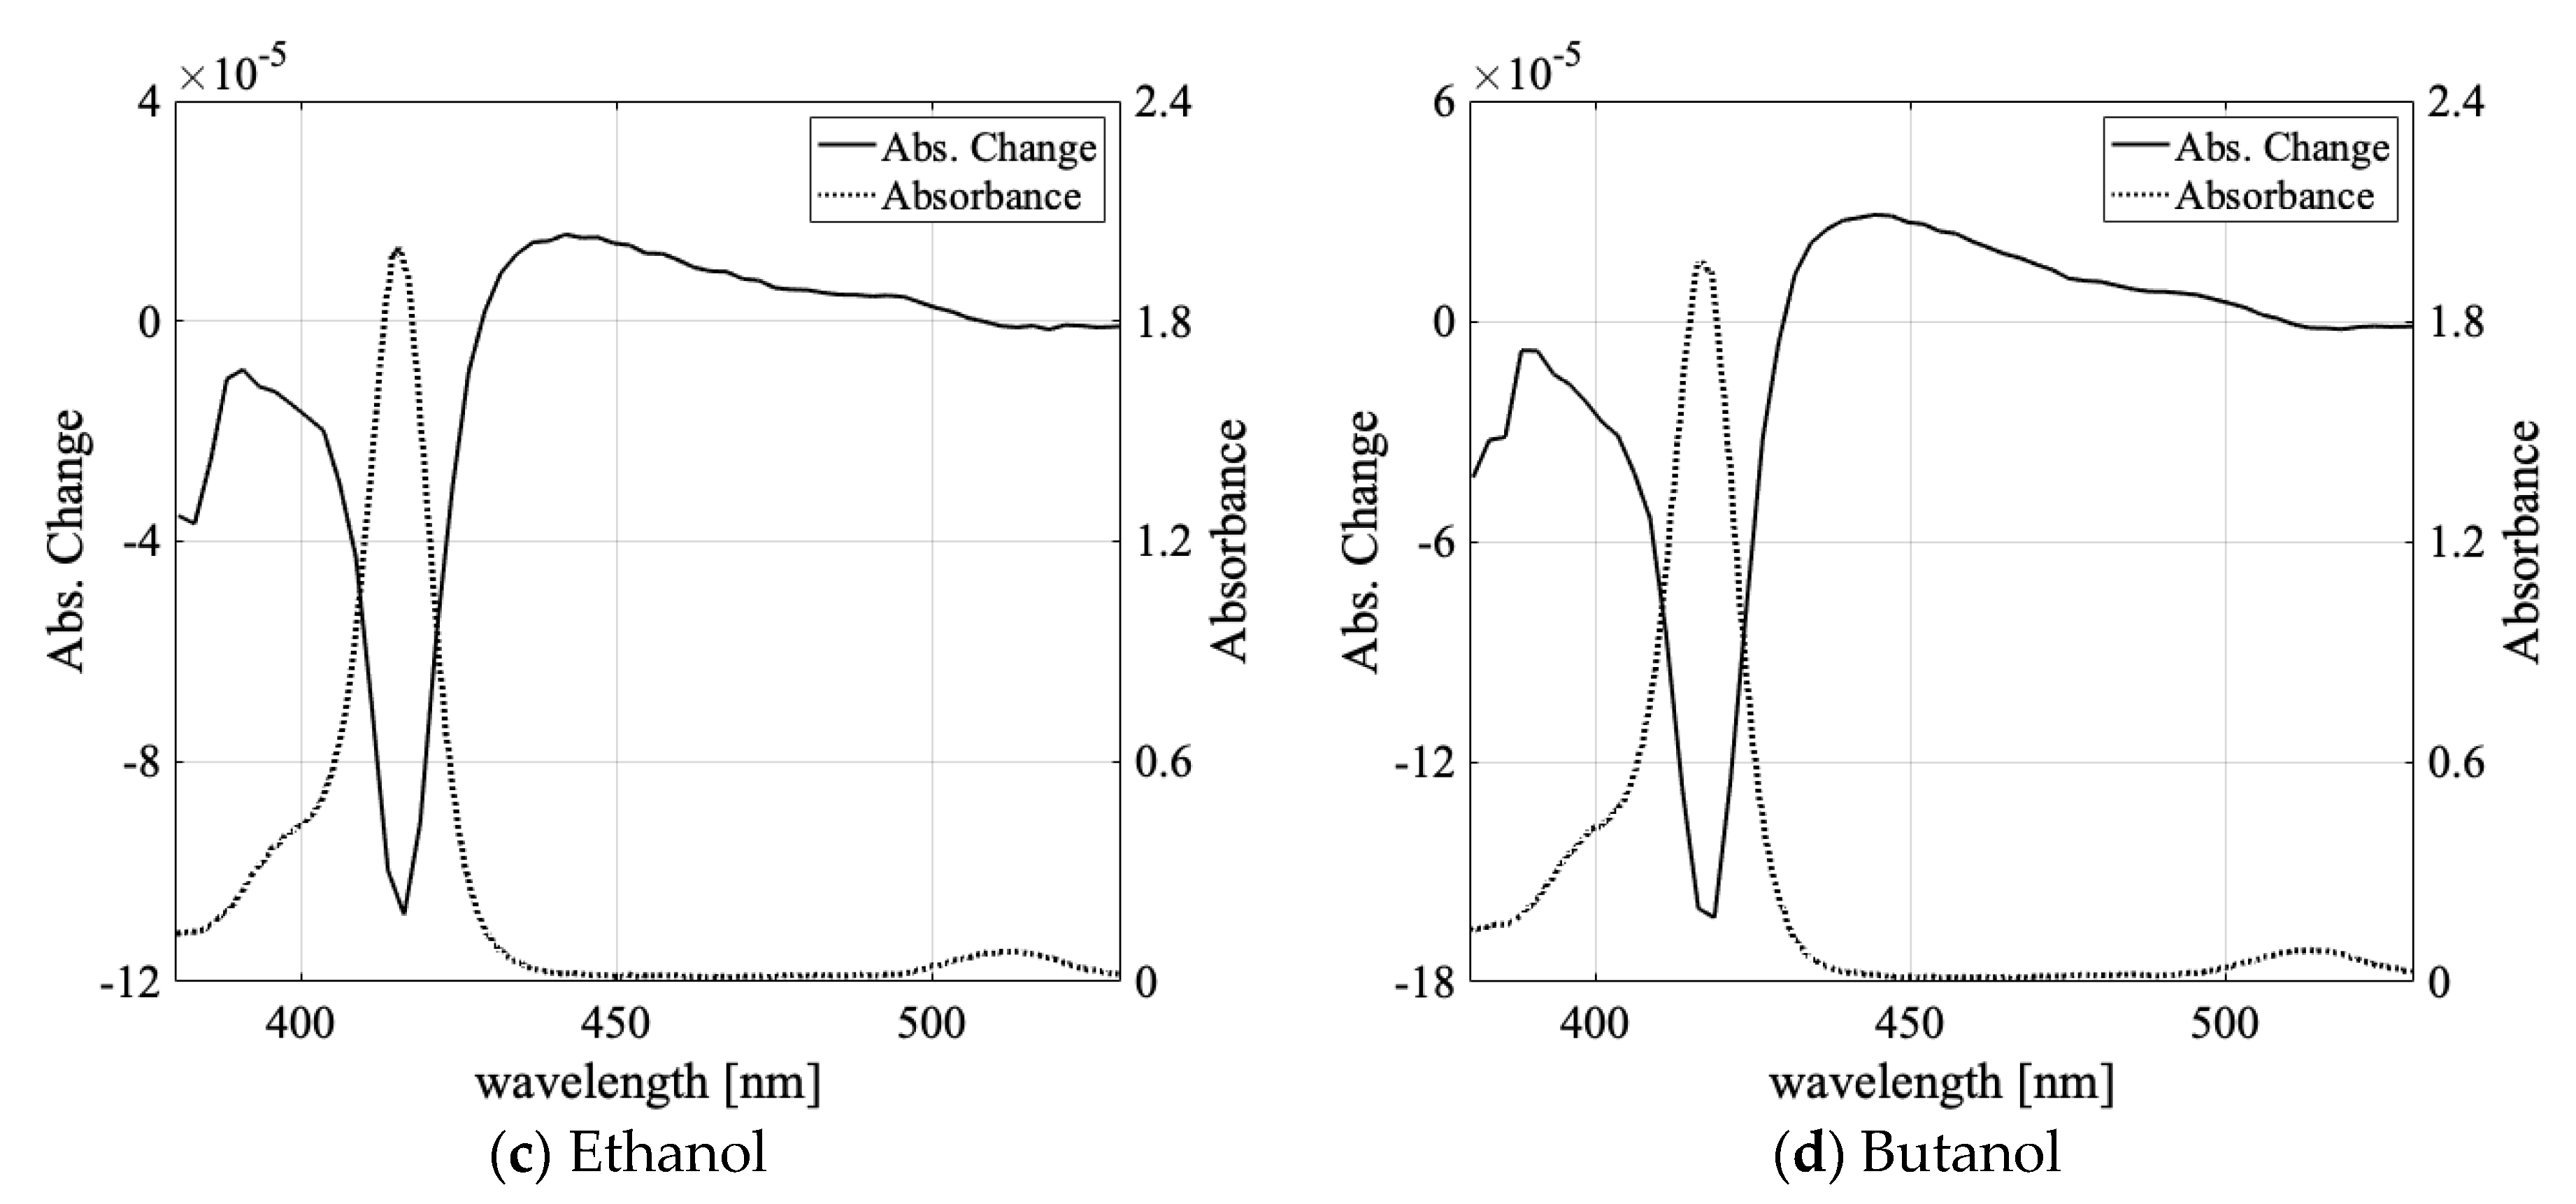
3.1. Solvent Dependence of Absorption Change Spectra

We determined the absorbance change spectra of the prepared samples via laser irradiation. Figure 3a–d shows the absorbance change spectra when 532-nm laser light was irradiated to the F-monomer-dominant water, ethanol, methanol, and butanol solution samples.
The absorption decreased by Δ A ~ 10 4 at the monomer absorption peak and increased by Δ A ~ 10 5 in the broad spectral region of the aggregates. Table 2 lists the decreased and increased peak values of the absorbance change for each sample.
We observed an absorption increase of Δ A ~ 10 3 for the 16-µmol/L TPPS aqueous sample in our former report [48]; the difference between reference [48] and the present paper was due to differences in the NaOH concentration and laser intensity (2 times larger and 10 times smaller than in reference [48], respectively). The absorbance change in the organic solvent was smaller by one order of magnitude compared with the water solvent case (Figure 3a). There have been reports that the viscosity of solvents affects molecular aggregation [23] and that the viscosity depends on the solvents’ hydrogen bonds [56]. Thus, it is conceivable that solvent hydrogen bonds could contribute to molecular aggregation and light-induced aggregation. In Table 3, the fractional volumes of the hydroxyl group in each solvent molecule are compared at room temperature.
The fractional volume of the hydroxyl group in water was the largest; it was 4.5 times, 6.5 times, and 10.2 times larger than in methanol, ethanol, and butanol, respectively. The aggregation efficiency (absorbance increase/the ratio of light-gradient force potential to molecular thermal kinetic energy) was over 10 times larger for the water sample than for the alcohol samples. The fractional volume of the OH group can be correlated with the difference of absorbance change between the water solution and the alcohol solutions, as shown in Figure 3b–d and Table 2 and Table 3.
Throughout the TPPS molecular aggregation process, protonation of the porphyrin ring contributed to the formation of J-aggregates. Each solvent had different values for the TPPS protonation constant [57]. The constant in water is larger by one to two orders of magnitude than that in methanol and ethanol according to reference [57], which could have caused the light-induced aggregation change to differ between different solvents.
Comparing the absorbance change of the aqueous sample ( Δ A ~ 1.77 × 10 4 for 59 µmol/L) with that of the methanol sample ( Δ A ~ 1.68 × 10 5 , for 62 µmol/L), the absorbance change in the former normalized by the TPPS concentration was approximately 11 times larger than in the latter. The protonation constant in water was approximately 100 times larger than in organic solutions. Therefore, the difference in absorbance change for each solvent could be explained by a difference in the protonation constant. To the best of our knowledge, there has been no quantitative discussion about the relationship between the protonation constant and aggregation constant of TPPS. However, a previous report indicated that TPPS J-aggregates are made from protonated TPPS molecules, which are generated as the pH value lowers and the “proton concentration rises” [38]. Therefore, it is reasonable to assume that the observed light-induced aggregation was related to the protonation constant.

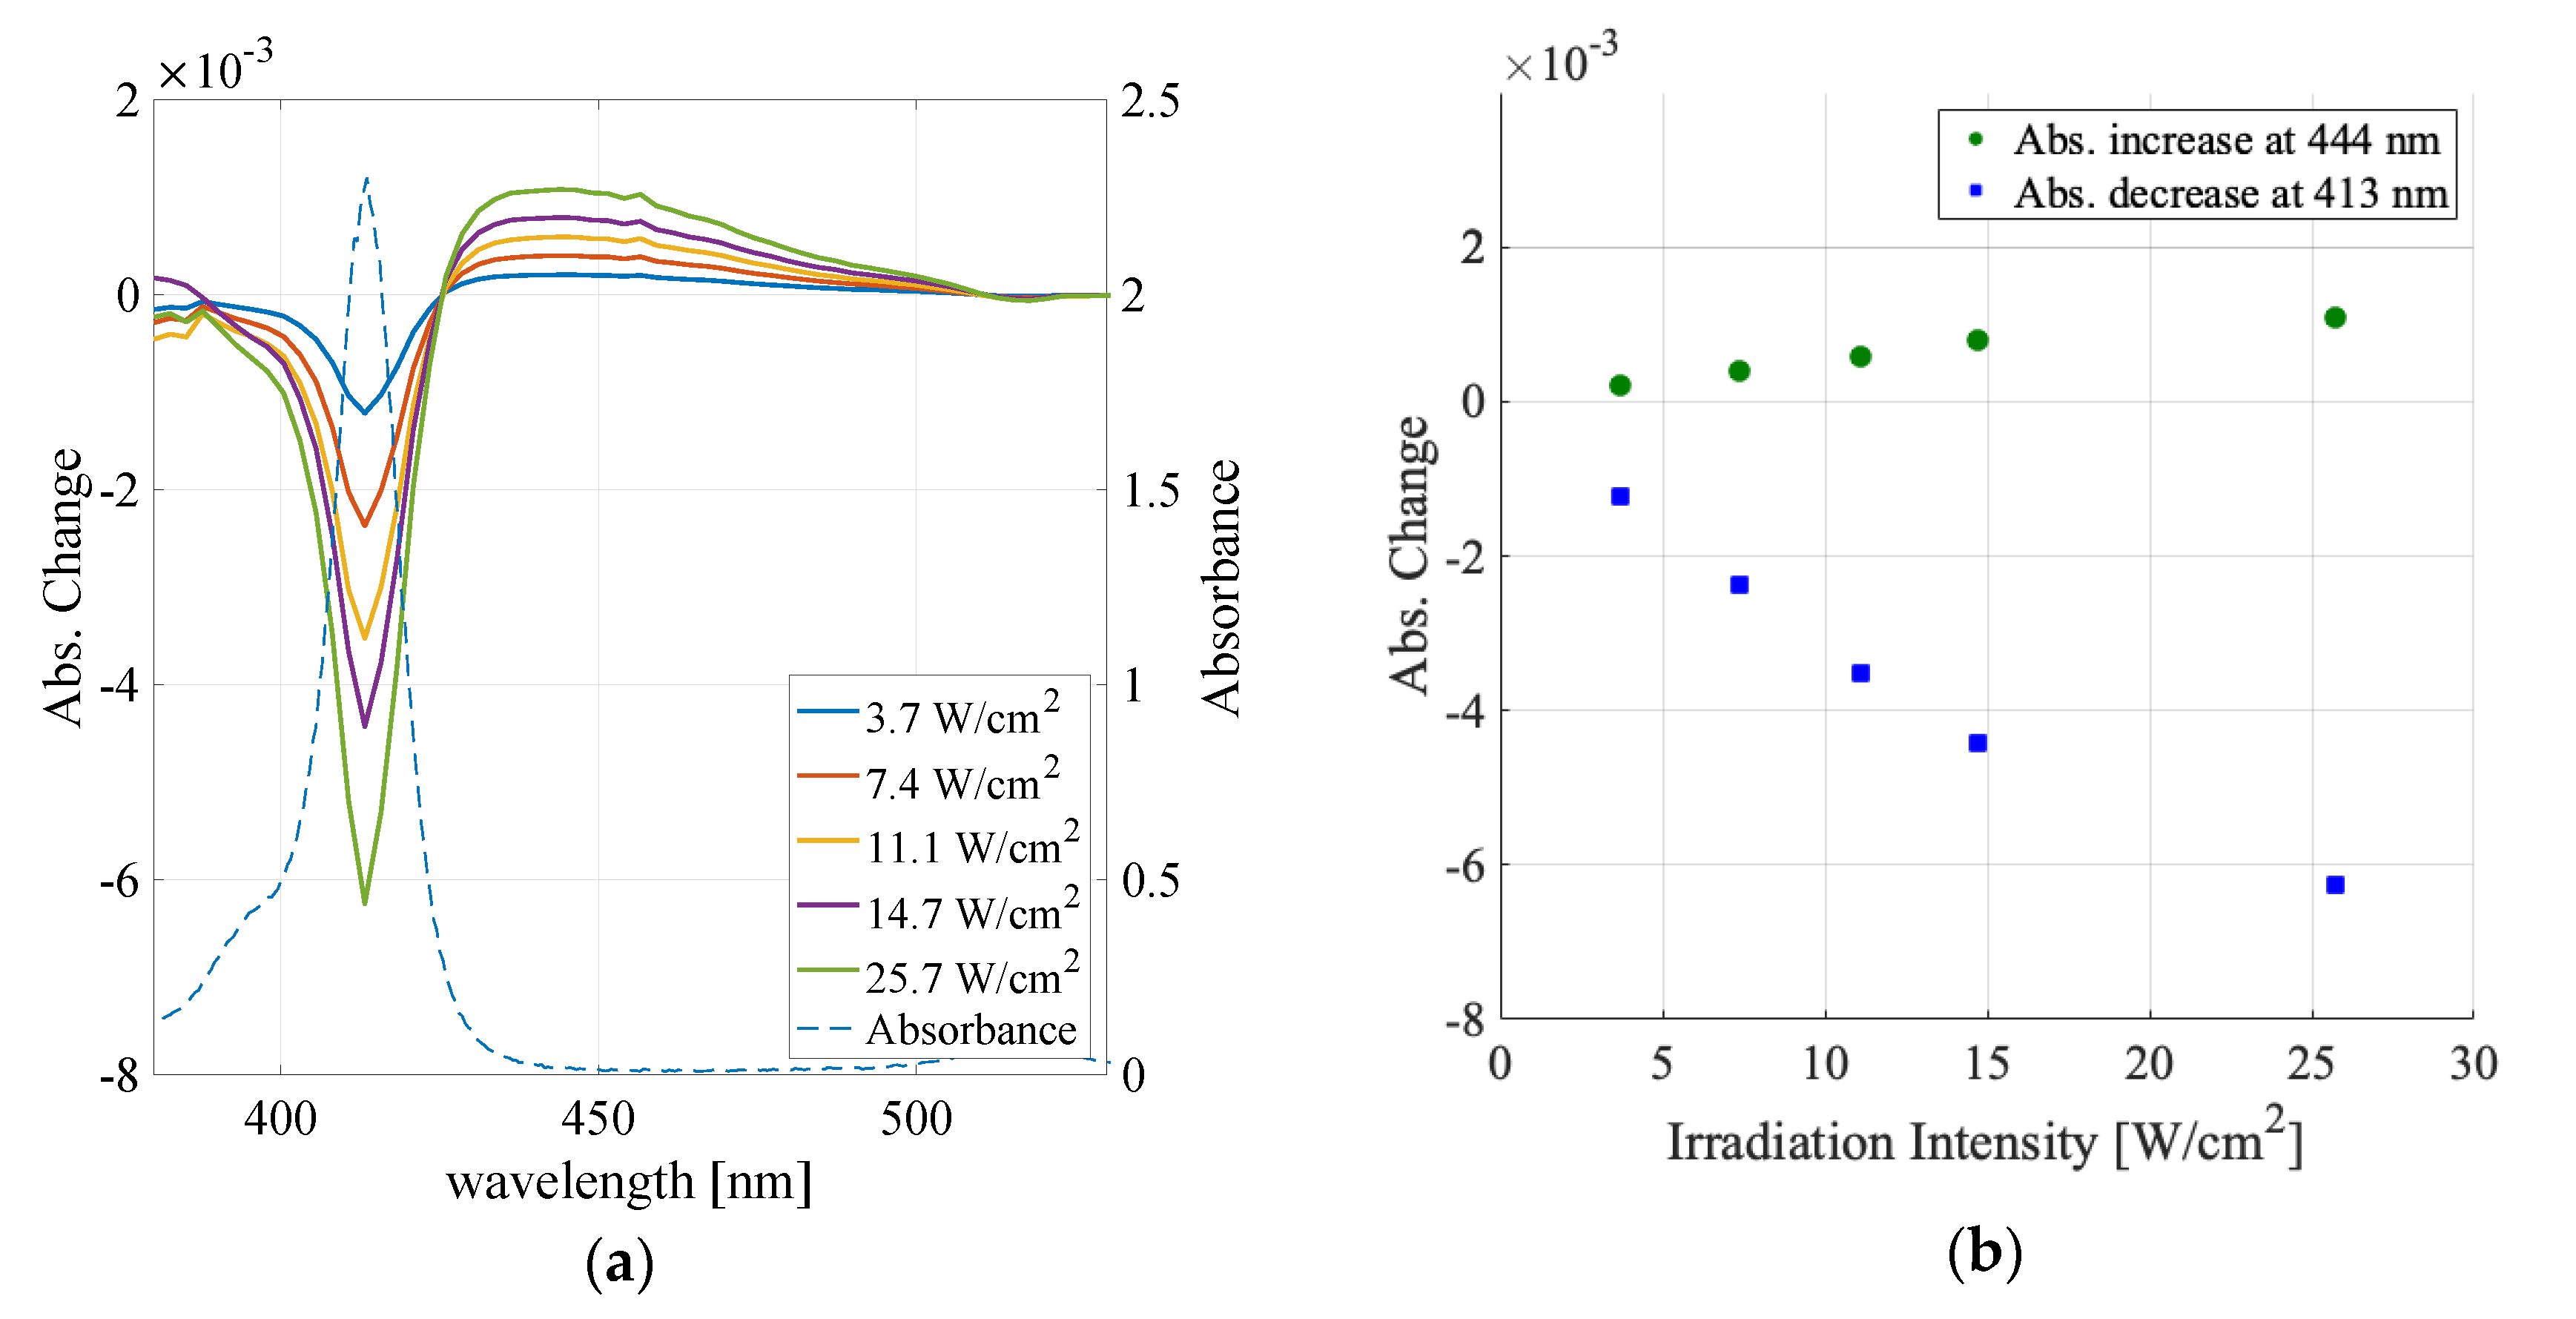
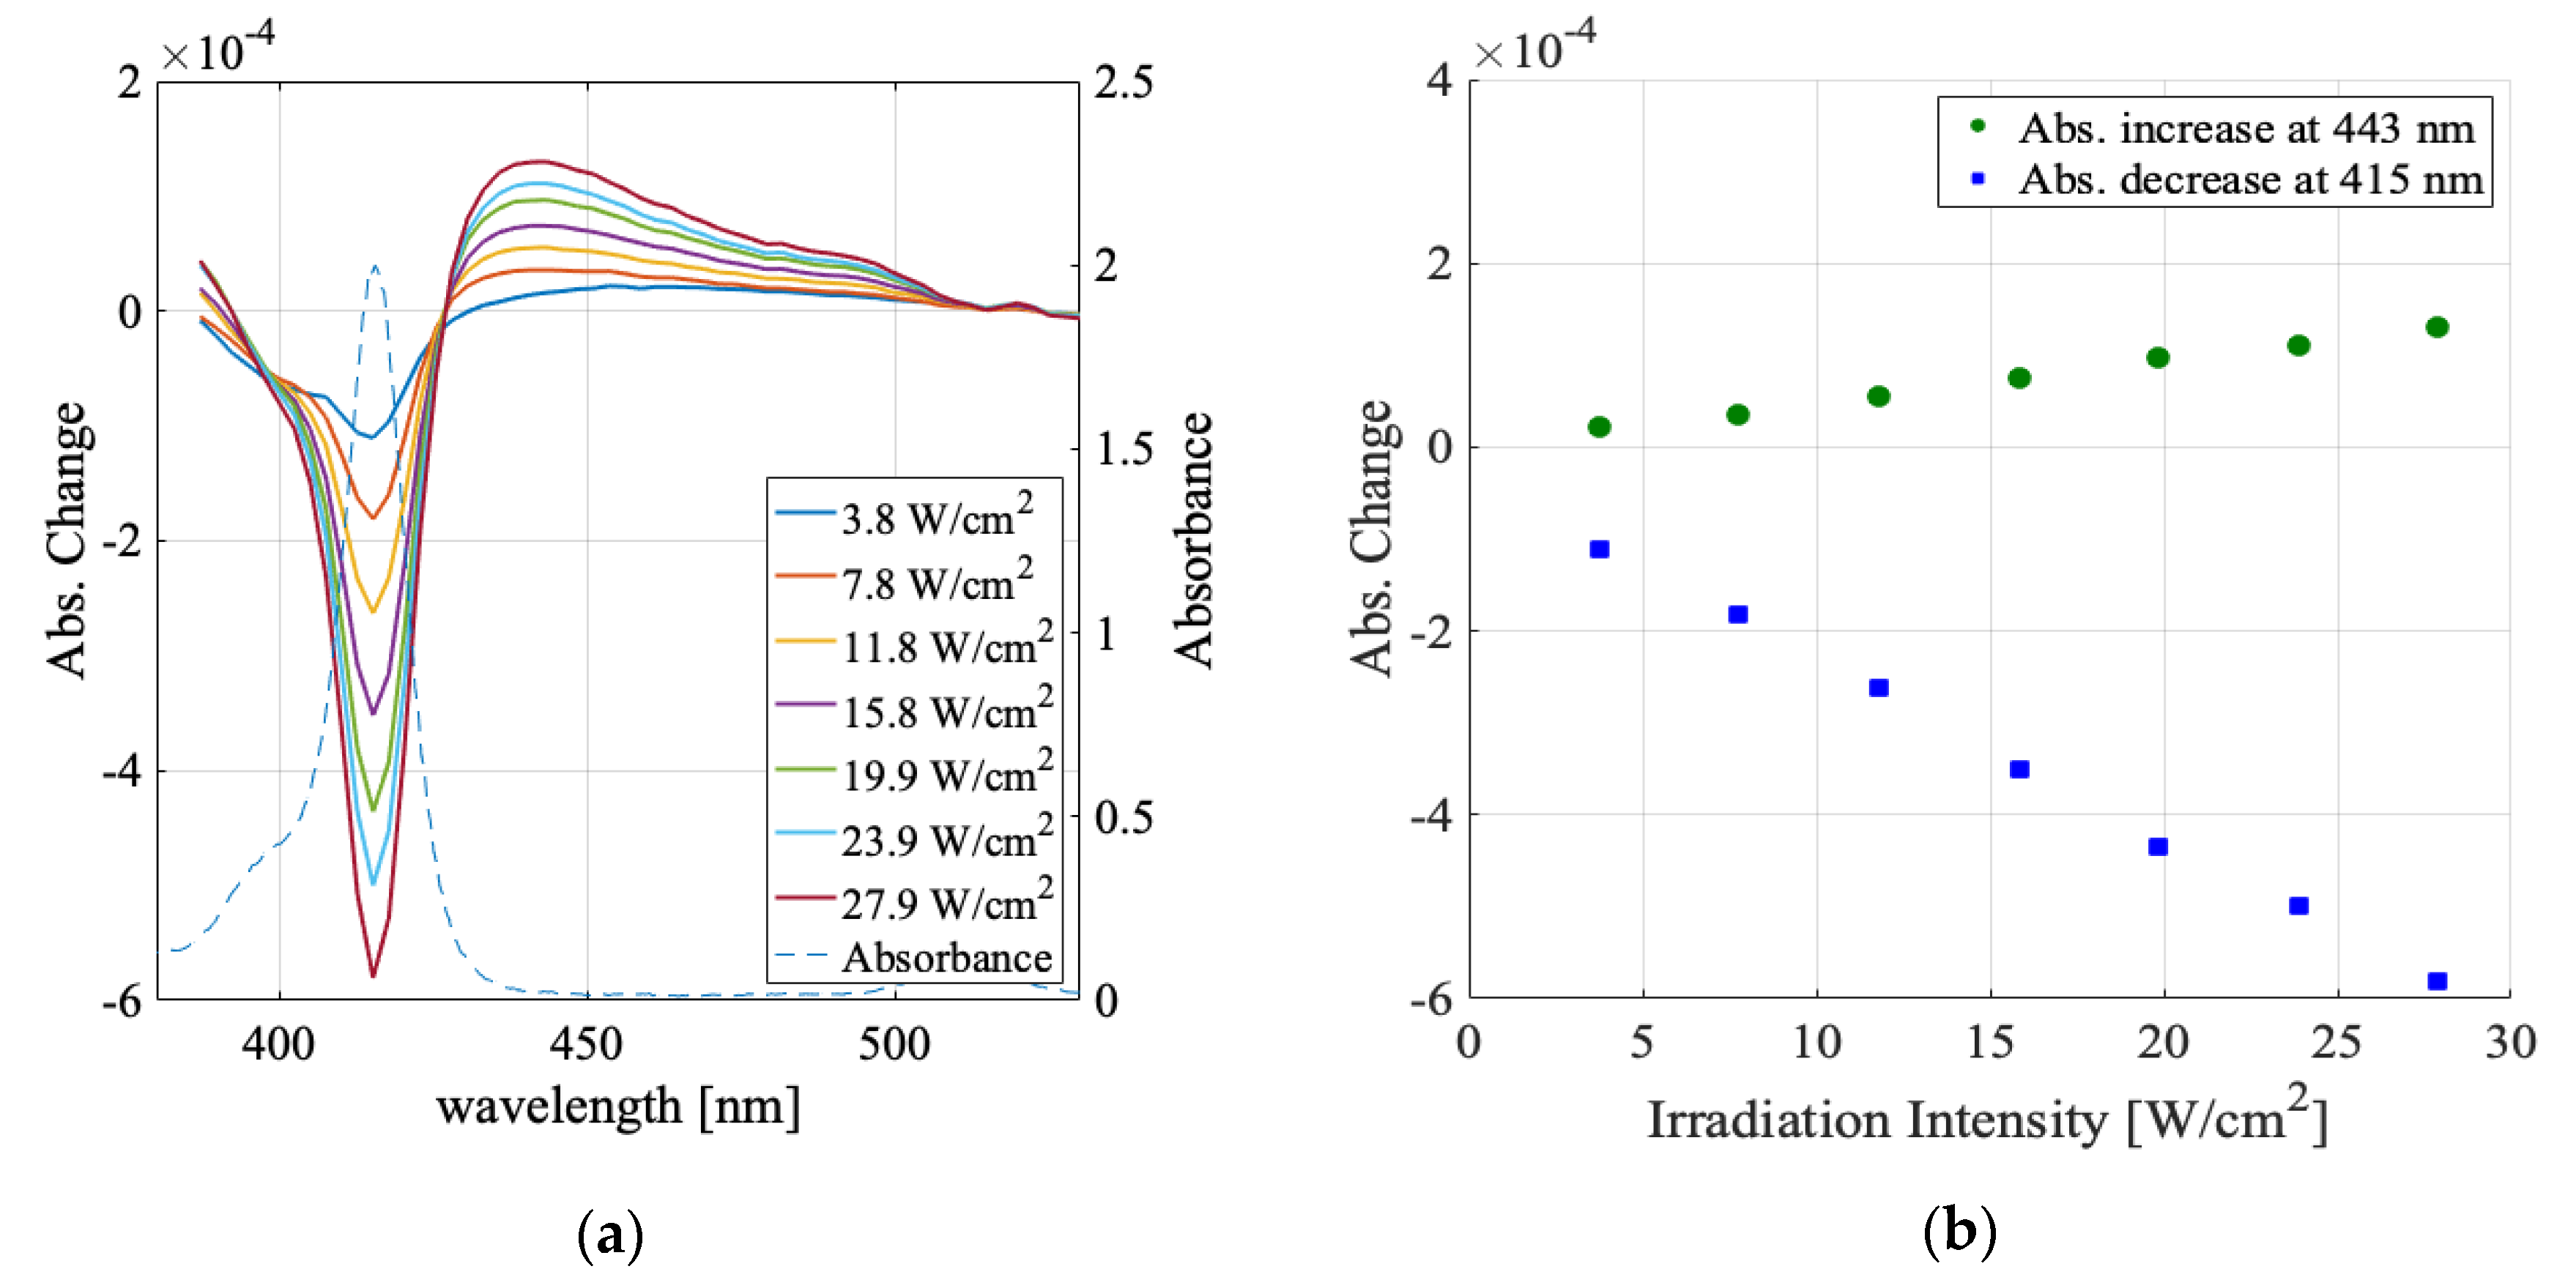
3.2. Irradiation Intensity Dependence

In addition to the solvent dependence of the laser-induced absorbance change spectra, we investigated the irradiation intensity dependence of the absorbance change for newly prepared water and ethanol samples (Figure 4 and Figure 5).
Figure 4a shows the absorbance change spectra in the water sample for the irradiation intensity, from 3.7 to 25.7 W/cm2. Figure 4b displays the absorbance change vs. irradiation intensity at the absorbance increase peak (444 nm) and absorbance decrease peak (413 nm). Both the increase and decrease depended nonlinearly on the irradiation power and converged as the irradiation intensity increased. The observed curves could be fitted to y = A ( 1 exp ( B x ) ) with the fitting parameters in Table 4.
For the absorbance decrease, the fitting parameter A was −0.0101, which indicated the maximum attainable change in the F monomer peak absorbance in the limit of the infinite irradiation intensity. This maximum change (decrease) in the absorbance was 70 times smaller than the sample absorbance considering the cell thickness, indicating that only a part of TPPS molecules within the laser irradiation spot can change its aggregation states.
Figure 5 shows the absorbance change spectra in the ethanol solution for the same irradiation intensity as that in Figure 4. The absorbance change spectra in ethanol were similar to those in water, observed as the increase in the broad spectral range and decrease at the monomer absorption peak. However, this sample’s dependence on the irradiation intensity was linear over the whole intensity range, differing from that for the water solution sample.
In the water solution sample, the absorbance change was large and seemed to be saturated. The maximum change estimated from the saturation behavior was smaller by two orders of magnitude than the original sample absorbance. In contrast, in the ethanol sample, the absorbance change was smaller and depended linearly on the irradiation intensity. These features could be explained qualitatively as follows: There was an upper limit to the ratio of aggregated molecules to monomer molecules in the laser-irradiated volume because only those molecules that were located statistically as closely as they could interact were aggregated. The capability of the formation of J-aggregate depends on the solvent species, resulting in the different intensity dependence in different solvents observed here.

3.3. Absorbance Change in the Shorter Wavelength Region (Light-Induced Formation of H- and J-Aggregates)

If light-induced absorbance changes occur among molecules in a random arrangement, both J-aggregates and H-aggregates are expected to be created upon light irradiation depending on the angle between the aggregate axes and the molecular transition dipole moments [58]. If this was the case in the present experiment, the absorbance of higher energy ranges than the F monomer absorption peak was assumed to increase. To confirm this, the achromatic lenses in our optics were exchanged with quartz lenses, and the absorbance change spectra were observed, including higher energy regions than the F monomer absorption peak in Figure 6.
As such, we observed that the absorbance change also increased at a higher energy than the F monomer absorption. According to the Frenkel exciton model for aggregation molecules, the sign of the energy level shift of the excited state due to the association formation changes depending on the association angle. In the model (Equation (2)), the aggregation energy is positive when the aggregation angle is over 54.7°, and its absorption peak shifts to a higher energy and shorter wavelength. Thus, the observed absorbance change at a shorter wavelength than the monomer absorption indicated that aggregation states with a larger aggregation angle, such as H-aggregates, were generated via the light irradiation.
TPPS monomer molecules have transition dipole moments that are orthogonal due to their D2h symmetry. Thus, in the equilibrium state wherein the aggregates were fully developed, J-aggregates appeared at 490 nm (with respect to the D monomer at 434 nm), and H-aggregates appeared at 424 nm [58]. However, we observed an increase in absorption at wavelengths shorter than 390 nm, which is shorter than the peak wavelength of 414 nm of the F monomer. This means that an H-aggregate with a configuration that does not exist in the equilibrium state was generated by laser irradiation. This is characteristic of the non-equilibrium association caused by light-induced force, wherein the broad absorption increase of J-aggregates occurs in the energy region corresponding to the J-aggregates with aggregation numbers 2, 3, 4, and so on [40] or J-aggregates whose association angles and intermolecular distances are different from the equilibrium state. This could explain the increase in absorption on both sides of the F monomer absorption peak.

3.4. Contribution by Keesom Interaction

In Section 3.2, regarding the irradiation intensity dependence of the absorbance change, we proposed a plausible model based on the concept that those molecules within the transition dipole-transition dipole interaction distance in the light irradiation volume interact with one another to create the absorption spectra characteristic of J- or H-aggregates. Although this is qualitatively reasonable, it needed to be validated quantitatively.
We considered the Keesom interaction as a possible intermolecular interaction in the model. The Keesom interaction [59,60,61] is known as the electric dipole interaction between molecules in thermal motion, as described below:
U ( r ) = 1 3 k B T ( μ 1 μ 2 4 π ε 0 ε r ) 2 1 r 6 ,
(r: distance between dipoles, µi: electric dipole of molecule i, T: absolute temperature, kB: Boltzmann constant, ε0: permittivity of vacuum, εr: relative permittivity of solution)
The concentrations of the TPPS molecules were 59 µmol/L in the water solution and 52 µmol/L in the ethanol solution. For these concentrations, the average center-to-center distance between neighboring TPPS molecules was 72 nm in the water and 76 nm in the ethanol. Taking the TPPS oscillator strength as 1.723 at 413 nm [62], the Keesom potential energy between molecules in the average distance was −1.2 × 10⁻¹⁹ eV in the water and −9 × 10⁻²⁰ eV in the ethanol. This potential energy was far smaller than the light-gradient force potential. Therefore, the Keesom interaction could not quantitatively explain the light-induced aggregation.

3.5. Other Effects (Surface and Thermal Convection Effect)

When the probe light and pump laser light were focused on the solvent/glass surface, we did not observe an amplification of the absorbance change. Though an air/solvent surface effect on the laser-induced crystallization was reported in reference [32], no indication of a contribution from the surface effect was found in our experiment. The phenomena, which we observed as absorbance change, are most likely to occur in bulk solvent circumstances.
When the temperature gradient occurs in a solvent, the thermal convection should affect the molecular motion. The volume force by convection is described as follows [63]:
F = g ρ β T
where g is the gravitational acceleration, ρ is the density of water, β is the thermal expansion coefficient, and T is the temperature difference from room temperature. As discussed in the former report [48], the TPPS molecular volume ( i 4 3 π r i 3 ; r i is van der Waals radius of TPPS atom i) and temperature rise for laser irradiation were estimated to be 1.46 nm2 and 20 degrees, respectively. For these parameters and estimation, the force on the TPPS molecule by convection was 6.0 × 10 26   N . The light-gradient force was 1.0 × 10⁻²⁴ N with a laser irradiation power of 265 W/cm2, radii of the irradiation spot of 120 µm, and TPPS polarizability of 3.9 × 10 38 cm2/V, as estimated with the following formula [64]:
α = 3 ε 0 v
where ε 0 is the vacuum permittivity and v is the TPPS volume mentioned above. Thus, the thermal convection effect was even smaller than the effect of the light-gradient force.

4. Conclusions

In this paper, we observed light-induced changes in the molecular aggregation states in the absorption spectra and performed comparative experiments with different solvents. Moreover, the irradiation intensity dependence of the absorption change spectra was compared between an aqueous solution and ethanol solution.
In the aqueous solution, the absorbance change per TPPS concentration grew larger by one order of magnitude than in the alcohol solutions. The protonation of TPPS could have been related to the solvent effect because of the larger protonation constant in the water compared with that in the alcohol solutions [57]. However, it has been argued that intermolecular hydrogen bonds in the molecular J-aggregates are disturbed by interactions with surrounding solvent molecules [44], so further experiments are needed regarding the role of hydrogen bonds in the aggregate formation of porphyrin molecules.
The irradiation intensity dependence of the absorbance change was nonlinear and showed saturation behavior for the aqueous solution; however, it was linear without saturation for the ethanol solution. The absorption change tended to be saturated with intensity only in the aqueous solution, and its saturated value determined from the fitting was two orders of magnitude smaller than the sample absorbance. This means that there was a limit to the change induced by the aggregate formation, even if the irradiated light intensity increased to infinity.
These results and the increase in absorbance in higher energy regions than the F monomer are qualitatively consistent with a model wherein light-induced interactions work only between molecules that are accidentally closely located among those randomly distributed and oriented within the light-irradiated volume as a mechanism of light-induced molecular aggregation. However, the Keesom interaction and thermal convection effect are not enough to explain our results, although the thermophoresis effect has not been considered. To consider the contribution of the thermophoresis effect, the Soret coefficient of TPPS has to be estimated. However, no literature on the Soret coefficient of TPPS or porphyrin has been found yet, and no experimental or computational estimation of the coefficient was performed herein.
Although the mechanism is still unknown, the difference in the efficiency of light-induced aggregation between each solvent observed in this paper is an interesting result that contributes to determining the mechanism of highly efficient molecular aggregation via light-induced force for further improvement of efficiency.

Author Contributions

Conceptualization, E.T.; methodology, E.T., M.S., and T.K.; validation, M.S.; formal analysis, M.S.; investigation, M.S.; writing—original draft preparation, M.S.; writing—review and editing, E.T. and T.K.; supervision, E.T.

Funding

This research received no external funding.

Acknowledgments

The authors acknowledge technical support and advice by Kazuaki Nakata. The authors would like to thank Enago (www.enago.jp) for the English language review.

Conflicts of Interest

The authors declare no conflict of interest.

References

  1. Ashkin, A. Acceleration and Trapping of Particles by Radiation Pressure. Phys. Rev. Lett. 1970, 24, 156–159. [Google Scholar] [CrossRef] [Green Version]
  2. Ashkin, A.; Dziedzic, J.M.; Smith, P.W. Continuous-wave self-focusing and self-trapping of light in artificial Kerr media. Opt. Lett. 1982, 7, 276. [Google Scholar] [CrossRef] [PubMed]
  3. Ashkin, A.; Dziedzic, J.M.; Yamane, T. Optical trapping and manipulation of single cells using infrared laser beams. Nature 1987, 330, 769–771. [Google Scholar] [CrossRef] [PubMed]
  4. Kuo, S.C.; Sheet, M.E. Optical tweezers in cell biology. Trends Cell Biol. 1992, 2, 116–118. [Google Scholar] [CrossRef]
  5. Svoboda, K.; Schmidt, C.F.; Schnapp, B.J.; Block, S.M. Direct observation of kinesin stepping by optical trapping interferometry. Nature 1993, 365, 721–727. [Google Scholar] [CrossRef]
  6. Hajizadeh, F.; Reihani, S.N. Optimized optical trapping of gold nanoparticles. Opt. Express 2010, 18, 551. [Google Scholar] [CrossRef]
  7. Pang, Y.; Gordon, R. Optical Trapping of 12 nm Dielectric Spheres Using Double-Nanoholes in a Gold Film. Nano Lett. 2011, 11, 3763–3767. [Google Scholar] [CrossRef]
  8. Xiao, F.; Ren, Y.; Shang, W.; Zhu, W.; Han, L.; Lu, H.; Mei, T.; Premaratne, M.; Zhao, J. Sub-10 nm particle trapping enabled by a plasmonic dark mode. Opt. Lett. 2018, 43, 3413. [Google Scholar] [CrossRef]
  9. Arita, Y.; Tkachenko, G.; McReynolds, N.; Marro, N.; Edwards, W.; Kay, E.R.; Dholakia, K. Invited Article: Optical trapping of ultrasmooth gold nanoparticles in liquid and air. APL Photonics 2018, 3, 070801. [Google Scholar] [CrossRef]
  10. Osborne, M.A.; Balasubramanian, S.; Furey, W.S.; Klenerman, D. Optically Biased Diffusion of Single Molecules Studied by Confocal Fluorescence Microscopy. J. Phys. Chem. B 1998, 102, 3160–3167. [Google Scholar] [CrossRef]
  11. Chirico, G.; Fumagalli, C.; Baldini, G. Trapped Brownian Motion in Single- and Two-Photon Excitation Fluorescence Correlation Experiments. J. Phys. Chem. B 2002, 106, 2508–2519. [Google Scholar] [CrossRef]
  12. Inaba, K.; Imaizumi, K.; Katayama, K.; Ichimiya, M.; Ashida, M.; Iida, T.; Ishihara, H.; Itoh, T. Optical manipulation of CuCl nanoparticles under an excitonic resonance condition in superfluid helium. Phys. Status Solidi B 2006, 243, 3829–3833. [Google Scholar] [CrossRef]
  13. Iida, T.; Ishihara, H. Theoretical Study of the Optical Manipulation of Semiconductor Nanoparticles under an Excitonic Resonance Condition. Phys. Rev. Lett. 2003, 90, 057403. [Google Scholar] [CrossRef] [PubMed]
  14. Kudo, T.; Ishihara, H. Two-color laser manipulation of single organic molecules based on nonlinear optical response. Eur. Phys. J. B 2013, 86, 98. [Google Scholar] [CrossRef]
  15. Juan, M.L.; Righini, M.; Quidant, R. Plasmon nano-optical tweezers. Nat. Photonics 2011, 5, 349–356. [Google Scholar] [CrossRef]
  16. Gao, D.; Ding, W.; Nieto-Vesperinas, M.; Ding, X.; Rahman, M.; Zhang, T.; Lim, C.; Qiu, C.-W. Optical manipulation from the microscale to the nanoscale: Fundamentals, advances and prospects. Light Sci. Appl. 2017, 6, e17039. [Google Scholar] [CrossRef]
  17. Yoo, D.; Gurunatha, K.L.; Choi, H.-K.; Mohr, D.A.; Ertsgaard, C.T.; Gordon, R.; Oh, S.-H. Low-Power Optical Trapping of Nanoparticles and Proteins with Resonant Coaxial Nanoaperture Using 10 nm Gap. Nano Lett. 2018, 18, 3637–3642. [Google Scholar] [CrossRef]
  18. Ecarnot, A.; Magno, G.; Yam, V.; Dagens, B. Ultra-efficient nanoparticle trapping by integrated plasmonic dimers. Opt. Lett. 2018, 43, 455. [Google Scholar] [CrossRef]
  19. Lin, L.; Wang, M.; Peng, X.; Lissek, E.N.; Mao, Z.; Scarabelli, L.; Adkins, E.; Coskun, S.; Unalan, H.E.; Korgel, B.A.; et al. Opto-thermoelectric nanotweezers. Nat. Photonics 2018, 12, 195–201. [Google Scholar] [CrossRef]
  20. Garetz, B.A.; Aber, J.E.; Goddard, N.L.; Young, R.G.; Myerson, A.S. Nonphotochemical, Polarization-Dependent, Laser-Induced Nucleation in Supersaturated Aqueous Urea Solutions. Phys. Rev. Lett. 1996, 77, 3475–3476. [Google Scholar] [CrossRef] [Green Version]
  21. Garetz, B.A.; Matic, J.; Myerson, A.S. Polarization Switching of Crystal Structure in the Nonphotochemical Light-Induced Nucleation of Supersaturated Aqueous Glycine Solutions. Phys. Rev. Lett. 2002, 89, 175501. [Google Scholar] [CrossRef] [PubMed]
  22. Adachi, H.; Takano, K.; Hosokawa, Y.; Inoue, T.; Mori, Y.; Matsumura, H.; Yoshimura, M.; Tsunaka, Y.; Morikawa, M.; Kanaya, S.; et al. Laser Irradiated Growth of Protein Crystal. Jpn. J. Appl. Phys. 2003, 42, L798–L800. [Google Scholar] [CrossRef]
  23. Adachi, H.; Murakami, S.; Niino, A.; Matsumura, H.; Takano, K.; Inoue, T.; Mori, Y.; Yamaguchi, A.; Sasaki, T. Membrane Protein Crystallization Using Laser Irradiation. Jpn. J. Appl. Phys. 2004, 43, L1376–L1378. [Google Scholar] [CrossRef]
  24. Okutsu, T.; Furuta, K.; Terao, M.; Hiratsuka, H.; Yamano, A.; Ferté, N.; Veesler, S. Light-Induced Nucleation of Metastable Hen Egg-White Lysozyme Solutions. Cryst. Growth Des. 2005, 5, 1393–1398. [Google Scholar] [CrossRef]
  25. Veesler, S.; Furuta, K.; Horiuchi, H.; Hiratsuka, H.; Ferté, N.; Okutsu, T. Crystals from Light: Photochemically Induced Nucleation of Hen Egg-White Lysozyme. Cryst. Growth Des. 2006, 6, 1631–1635. [Google Scholar] [CrossRef]
  26. Tanaka, Y.; Yoshikawa, H.; Masuhara, H. Two-Photon Fluorescence Spectroscopy of Individually Trapped Pseudoisocyanine J-Aggregates in Aqueous Solution. J. Phys. Chem. B 2006, 110, 17906–17911. [Google Scholar] [CrossRef]
  27. Tanaka, Y.; Yoshikawa, H.; Asahi, T.; Masuhara, H. Laser microfixation of highly ordered J aggregates on a glass substrate. Appl. Phys. Lett. 2007, 91, 041102. [Google Scholar] [CrossRef]
  28. Sugiyama, T.; Adachi, T.; Masuhara, H. Crystallization of Glycine by Photon Pressure of a Focused CW Laser Beam. Chem. Lett. 2007, 36, 1480–1481. [Google Scholar] [CrossRef]
  29. Sugiyama, T.; Adachi, T.; Masuhara, H. Crystal Growth of Glycine Controlled by a Focused CW Near-infrared Laser Beam. Chem. Lett. 2009, 38, 482–483. [Google Scholar] [CrossRef]
  30. Yuyama, K.; George, J.; Thomas, K.G.; Sugiyama, T.; Masuhara, H. Two-Dimensional Growth Rate Control of L -Phenylalanine Crystal by Laser Trapping in Unsaturated Aqueous Solution. Cryst. Growth Des. 2016, 16, 953–960. [Google Scholar] [CrossRef]
  31. Liu, T.-H.; Yuyama, K.; Hiramatsu, T.; Yamamoto, N.; Chatani, E.; Miyasaka, H.; Sugiyama, T.; Masuhara, H. Femtosecond-Laser-Enhanced Amyloid Fibril Formation of Insulin. Langmuir 2017, 33, 8311–8318. [Google Scholar] [CrossRef] [PubMed]
  32. Yuyama, K.; Chang, K.-D.; Tu, J.-R.; Masuhara, H.; Sugiyama, T. Rapid localized crystallization of lysozyme by laser trapping. Phys. Chem. Chem. Phys. 2018, 20, 6034–6039. [Google Scholar] [CrossRef] [PubMed]
  33. Kobayashi, T. J-Aggregates; World Scientific: Singapore, 1996; ISBN 978-981-02-2737-1. [Google Scholar]
  34. Kobayashi, T. J-Aggregates: Volume 2; World Scientific: Singapore, 2012; ISBN 978-981-4365-74-1. [Google Scholar]
  35. Yoon, S.M.; Hwang, I.-C.; Kim, K.S.; Choi, H.C. Synthesis of Single-Crystal Tetra(4-pyridyl)porphyrin Rectangular Nanotubes in the Vapor Phase. Angew. Chem. Int. Ed. 2009, 48, 2506–2509. [Google Scholar] [CrossRef] [PubMed]
  36. Campione, M.; Capitani, G.C.; Raimondo, L.; Sassella, A. Porphyrin Nanowires with Epitaxially Locked Uniaxial Orientation. J. Phys. Chem. C 2015, 119, 18210–18215. [Google Scholar] [CrossRef]
  37. Park, Y.; Hong, M.; Koo, J.Y.; Lee, M.; Lee, J.; Moon, D.J.; Sohn, S.H.; Joo, T.; Lim, W.T.; Lim, H.; et al. Reverse Anti-solvent Crystallization Process for the Facile Synthesis of Zinc Tetra(4-pyridyl)porphyrin Single Crystalline Cubes. Sci. Rep. 2017, 7, 2582. [Google Scholar] [CrossRef] [Green Version]
  38. Ohno, O.; Kaizu, Y.; Kobayashi, H. J-aggregate formation of a water-soluble porphyrin in acidic aqueous media. J. Chem. Phys. 1993, 99, 4128–4139. [Google Scholar] [CrossRef]
  39. Aggarwal, L.P.F.; Borissevitch, I.E. On the dynamics of the TPPS4 aggregation in aqueous solutions. Spectrochim. Acta Part A Mol. Biomol. Spectrosc. 2006, 63, 227–233. [Google Scholar] [CrossRef]
  40. Nakata, K.; Kobayashi, T.; Tokunaga, E. Electric field-controlled dissociation and association of porphyrin J-aggregates in aqueous solution. Phys. Chem. Chem. Phys. 2011, 13, 17756. [Google Scholar] [CrossRef]
  41. Kato, N.; Saito, K.; Serata, T.; Aida, H.; Uesu, Y. Morphology and thermochromic phase transition of merocyanine J-aggregate monolayers at the air-water and solid-water interfaces. J. Chem. Phys. 2001, 115, 1473–1484. [Google Scholar] [CrossRef]
  42. Udal’tsov, A.V.; Kazarin, L.A.; Sweshnikov, A.A. Self-assembly of large-scale aggregates of porphyrin from its dimers and their absorption and luminescence properties. J. Mol. Struct. 2001, 562, 227–239. [Google Scholar] [CrossRef]
  43. Bielejewski, M.; Łapiński, A.; Luboradzki, R.; Tritt-Goc, J. Solvent Effect on 1,2-O-(1-Ethylpropylidene)-α-d-glucofuranose Organogel Properties. Langmuir 2009, 25, 8274–8279. [Google Scholar] [CrossRef] [PubMed]
  44. Tian, Y.; Stepanenko, V.; Kaiser, T.E.; Würthner, F.; Scheblykin, I.G. Reorganization of perylene bisimide J-aggregates: From delocalized collective to localized individual excitations. Nanoscale 2012, 4, 218–223. [Google Scholar] [CrossRef] [PubMed]
  45. Villari, V.; Mineo, P.; Scamporrino, E.; Micali, N. Role of the hydrogen-bond in porphyrin J-aggregates. RSC Adv. 2012, 2, 12989. [Google Scholar] [CrossRef]
  46. Kobayashi, T.; Misawa, K. Hierarchical structure of one-dimensional J-aggregates. J. Lumin. 1997, 72–74, 38–40. [Google Scholar] [CrossRef]
  47. Wanless, E.J.; Davey, T.W.; Ducker, W.A. Surface Aggregate Phase Transition. Langmuir 1997, 13, 4223–4228. [Google Scholar] [CrossRef]
  48. Shirakawa, M.; Nakata, K.; Suzuki, M.; Kobayashi, T.; Tokunaga, E. Nonlinear Absorption Spectroscopy of Porphyrin J-aggregates in Aqueous Solution: Evidence for Control of Degree of Association by Light-Induced Force. J. Phys. Soc. Jpn. 2017, 86, 044703. [Google Scholar] [CrossRef]
  49. Gouterman, M. Spectra of porphyrins. J. Mol. Spectrosc. 1961, 6, 138–163. [Google Scholar] [CrossRef]
  50. Gouterman, M.; Wagnière, G.H.; Snyder, L.C. Spectra of porphyrins: Part II. Four orbital model. J. Mol. Spectrosc. 1963, 11, 108–127. [Google Scholar] [CrossRef]
  51. Chen, D.-M.; He, T.; Cong, D.-F.; Zhang, Y.-H.; Liu, F.-C. Resonance Raman Spectra and Excited-State Structure of Aggregated Tetrakis(4-sulfonatophenyl)porphyrin Diacid. J. Phys. Chem. A 2001, 105, 3981–3988. [Google Scholar] [CrossRef]
  52. El-Hachemi, Z.; Escudero, C.; Acosta-Reyes, F.; Casas, M.T.; Altoe, V.; Aloni, S.; Oncins, G.; Sorrenti, A.; Crusats, J.; Campos, J.L.; et al. Structure vs. properties—Chirality, optics and shapes—In amphiphilic porphyrin J-aggregates. J. Mater. Chem. C 2013, 1, 3337. [Google Scholar] [CrossRef] [Green Version]
  53. Vlaming, S.M.; Augulis, R.; Stuart, M.C.A.; Knoester, J.; van Loosdrecht, P.H.M. Exciton Spectra and the Microscopic Structure of Self-Assembled Porphyrin Nanotubes. J. Phys. Chem. B 2009, 113, 2273–2283. [Google Scholar] [CrossRef] [PubMed] [Green Version]
  54. Iwai, S.; Tanaka, M.; Mitsunaga, M.; Kobayashi, T.; Tokunaga, E. Excited-state absorption spectra for optically forbidden f-f transitions in an Eu3+: Y2SiO5 crystal and Eu3+ aqueous solution. J. Opt. Soc. Am. B 2008, 25, 1046. [Google Scholar] [CrossRef]
  55. Ishino, H.; Iwai, S.; Iwamoto, S.; Okumura, T.; Kobayashi, T.; Tokunaga, E. Nonlinear absorption microspectroscopy of single perylene nanocrystals with a multichannel double lock-in amplifier. Opt. Rev. 2010, 17, 337–340. [Google Scholar] [CrossRef]
  56. Friend, J.N.; Hargreaves, W.D. XC. Viscosity and the hydrogen bond: Hydroxyl and ortho effects. Lond. Edinb. Dublin Philos. Mag. J. Sci. 1945, 36, 731–756. [Google Scholar] [CrossRef]
  57. Farjtabar, A.; Gharib, F. Solvent Effect on Protonation Constants of 5,10,15,20-Tetrakis(4-sulfonatophenyl)porphyrin in Different Aqueous Solutions of Methanol and Ethanol. J. Solut. Chem. 2010, 39, 231–244. [Google Scholar] [CrossRef]
  58. Suzuki, M.; Nakata, K.; Kuroda, R.; Kobayashi, T.; Tokunaga, E. Electrooptic Kerr effect of porphyrin H-aggregates in polymer films: Polymer specific spectral blue shift. Chem. Phys. 2016, 469–470, 88–96. [Google Scholar] [CrossRef]
  59. Keesom, W.H. The second viral coefficient for rigid spherical molecules, whose mutual attraction is equivalent to that of a quadruplet placed at their centre. KNAW Proc. 1915, 18, 636–646. [Google Scholar]
  60. Maitland, G.C.; Rigby, M.; Smith, E.B.; Wakeham, W.A. Intermolecular Forces—Their Origin and Determination. Berichte der Bunsengesellschaft für Physikalische Chemie 1983, 87, 291–292. [Google Scholar] [CrossRef]
  61. Mortazavi-Manesh, S.; Ghotbi, C.; Taghikhani, V. A new model for predicting activity coefficients in aqueous solutions of amino acids and peptides. J. Chem. Thermodyn. 2003, 35, 101–112. [Google Scholar] [CrossRef]
  62. Nishikawa, Y.; Morishige, K.; Shigematsu, T.; Nishikawa, Y. Determination of acid-base dissociation constant of porphyrins and their spectroscopic behavior. Bunseki Kagaku 1988, 37, 284–291. [Google Scholar] [CrossRef] [Green Version]
  63. Roxworthy, B.J.; Bhuiya, A.M.; Vanka, S.P.; Toussaint, K.C. Understanding and controlling plasmon-induced convection. Nat. Commun. 2014, 5, 3173. [Google Scholar] [CrossRef] [PubMed] [Green Version]
  64. Griffiths, D.J. Introduction to Electrodynamics, 4th ed.; Always Learning; Pearson: Boston, MA, USA, 2013; ISBN 978-0-321-85656-2. [Google Scholar]
Figure 1. The electronic absorption spectra of 4-[10,15,20-tris(4-sulfophenyl)-21,24-dihydroporphyrin-5-yl]benzenesulfonic acid (TPPS) in water, at room temperature in a 1-mm-thick quartz cell, measured with a spectrophotometer (Shimadzu, UV-3150). The TPPS concentration is 82 µmol/L for monomer sample (black line), and J-aggregate sample (red line) obtained by adding 100 µL of 1M, HCl aq. to 3.6 mL of 82 µmol/L monomer sample.
Applsci 09 05381 g001
Figure 2. Experimental set-up (L: lens, APD: avalanche photodiode).
Applsci 09 05381 g002
Figure 3. (a) The absorbance change for water solution (solid line) and absorption spectra (dotted line); (bd) The absorbance change for methanol, ethanol, and butanol solution (solid line) and absorption spectra (dotted line). For Figures 3–6, absorption spectrum measured in 1-mm-thick quartz cell at room temperature and absorbance change measured in 0.3-mm-thick glass cell.
Applsci 09 05381 g003aApplsci 09 05381 g003b
Figure 4. (a) The laser irradiation intensity dependence of the absorbance change spectra for the water sample (colored solid lines) and sample absorption spectrum (dashed line). (b) Absorbance increase peak values (green circle) and decrease peak values (blue square).
Applsci 09 05381 g004
Figure 5. (a) The laser irradiation intensity dependence of the absorbance change spectra for the ethanol sample (colored solid lines) and sample absorption spectrum (dashed line). (b) Absorbance increase peak values (green circle) and decrease peak values (blue square).
Applsci 09 05381 g005
Figure 6. The absorbance change spectrum includes shorter wavelength area than F monomer absorption peak excited by 548 W/cm2 intensity laser (solid line) and sample absorption spectra (dotted line).
Applsci 09 05381 g006
Table 1. TPPS concentration and the amount of 0.1 mol/L NaOHaq for each solvent sample.
WaterMethanolEthanolButanol
Concentration (µmol/L)59625254
The amount of NaOH (µL)200200400400
Table 2. The peak values of absorbance increase and decrease in B band for each sample.
WaterMethanolEthanolButanol
Absorbance Increase 1.77 × 10 4 1.68 × 10 5 1.58 × 10 5 2.90 × 10 5
Absorbance Decrease 1.13 × 10 3 8.39 × 10 5 1.08 × 10 4 1.62 × 10 4
Table 3. Molar volume of a hydroxyl group in each solvent.
WaterMethanolEthanolButanol
Hydroxyl group [mol/cm3]0.1110.0250.0170.011
Table 4. Fitting parameters for absorbance increase (at 444 nm) and decrease (at 413 nm) against laser irradiation power.
AB
Absorbance increase at 444 nm0.00180.037
Absorbance decrease at 413 nm−0.01010.038

