Abstract
In this work, a rib design process is proposed to improve the local stiffness of gearbox housing for agricultural electric vehicles. Unlike conventional engines, electric powertrain noise includes high frequency factors and pure tones. Considering these characteristics, local stiffness was evaluated in the frequency range of interest for the prediction of dynamic behavior. The local stiffness of the gearbox housing was evaluated using the finite element (FE) model. Experimental modal analysis and FE model update were conducted to ensure the reliability of the results. Using the results of local stiffness evaluations, the stiffness weak point was identified, and the rib design location was selected through a strain analysis. The shape of the ribs was parameterized by width, length, and height, and parameter studies were used to compare the local stiffness increase rate according to the rib design pattern. According to the results, the stiffness increase rate against the same mass was distributed differently according to the rib shape, and the most efficient rib shape was selected from a manufacturing perspective.
1. Introduction
The development of eco-friendly vehicles through the electrification of powertrains is becoming an active area of research, and the demand for the development of such electric vehicles has been increasing in the agricultural machinery industry [1]. At the same time, new ergonomic designs are being highlighted as a way to improve the working environment, and studies are being actively conducted to evaluate and reduce noise and vibration generated from agricultural machines [2]. However, because the noise problem of electric vehicles is quite different from that of conventional engine driven vehicles, the existing sound design method can no longer be used [3]. The noise of electric vehicle powertrains includes high frequency factors and pure tones, and these are more annoying to the operator [4]. The powertrain of a typical electric vehicle consists of an electric motor, a single-speed reduction gearbox, and a differential [5]. For electric motors, because they operate at a relatively high rotation speed and low torque compared to internal combustion engines, the motors are generally manufactured by integration with a reduction gearbox.
The main sources of noise in electric vehicle powertrains are electromagnetic excitation, inverter switching, and gear wine [6]. Especially in the high frequency range, gear wine dominantly affects sound quality. The excitation force caused by the transmission error of the gear mesh is transmitted through the shaft and the bearing, and this vibrates the housing. Therefore, this study aims to reduce vibration by improving the stiffness of the gearbox housing through rib design and finally solve the problem of radiated noise in agricultural electric vehicle powertrains.
Fang et al. [6] experimentally investigated the sound quality of electric vehicle powertrains and redesigned the shape of the gearbox housing to improve it. Topology optimization was conducted with an objective function, the aim of which was to reduce the sound pressure level generated by gear wine in the frequency range of interest, and data were compared to assess the changes in sound quality. However, topology optimization is a technique that is generally used in the conceptual design phase; the shape that appears after optimization is often difficult to use in actual manufacturing. Therefore, in order to manufacture an actual housing, additional process steps are necessary, such as a parameter study using several cases designed in consideration of manufacturability.
Rib design is one of the ways to improve the stiffness of the housing, but the existing methods are problematic in that these techniques are dependent on experience and assumptions. Zhang et al. [7] analyzed the dynamic behavior by designing ribs on a relatively simple shell. They observed the natural frequency variation with the change in height, thickness, and width of the triangular rib. In order to improve the dynamic behavior, most studies aim to increase the first natural frequency for a resonance avoidance design. However, as mentioned above, the noise of electric vehicles has a high frequency characteristic, so the resonance avoidance design is limited.
Kim and Kim [8] improved the stiffness of the chassis mount to reduce vibration transmitted from the engine and suspension within the vehicle. They evaluated the body attachment stiffness of the mount using an impact hammer test with a set target level and compared the results after shape modification. In the case of noise transmitted through a structure, the stiffness of the component on a vibration transfer path acts as the main factor. Hence, most studies that have evaluated the stiffness of a local point have been conducted with components such as a mount.
A study evaluating local stiffness to reduce radiated noise was conducted by Lee et al. [9]. They evaluated the local stiffness on the housing surface to find and reinforce the parts that were relatively weak and contributed to the radiated noise and vibration in the transmission. As shown in that study, local stiffness can potentially be used to evaluate the dynamic response level of the housing throughout the frequency range of interest. In addition, it was suggested that the optimization method to increase this value could be considered as a vibration reduction method for the gearbox housing.
In this study, a finite element (FE) model was used to predict the dynamic behavior of gearbox housing for agricultural electric vehicles through an FE model-based numerical method, and the model was updated to ensure the reliability of the results. Local stiffness was evaluated to identify the stiffness weak points in the frequency range of interest and to design the ribs to improve them. The rib shape was parameterized, and the results of local stiffness evaluations according to the rib pattern were compared. Through the results, a rib design process for improving the stiffness of the gearbox housing was presented.
2. Finite Element Model Update and Validation of the Gearbox Housing
To numerically predict the dynamic behavior of the gearbox housing based on an FE model, it is necessary to verify whether the FE model reflects the dynamic characteristics of the actual housing. Modal parameters, such as the natural frequency, mode shape and damping, are variables that define the model’s unique dynamic characteristics and can be obtained through experimental modal analysis (EMA). These values can be used to update and validate the FE model. The overall process is shown in Figure 1 [10].
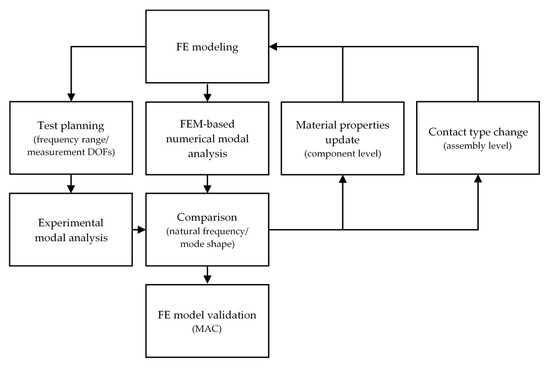
Figure 1.
Flowchart for the finite element (FE) model update process.
2.1. Experimental Modal Analysis
EMA was performed to obtain dynamic characteristics of the actual gearbox housing. The response of the system was determined by the dynamic characteristics of the structure, and the response varied with frequency. Variables defining these dynamic characteristics include the natural frequency, damping, and mode shape, and the EMA was conducted using the frequency response function (FRF) obtained from experiments.
Prior to the EMA, rough FE modeling was conducted, and the test geometry was modeled through FE model decimation. The sensor attachment positions and the measurement degrees of freedom (DOF) were determined based on the numerically predicted mode shapes (Figure 2).
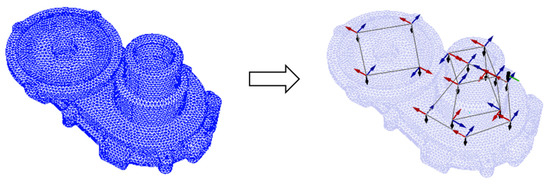
Figure 2.
Test geometry modeling by FE model decimation.
Tests were conducted in the free end condition, and the frequency range of interest was set within 3000 Hz from the excitation frequency information of the gearbox. The fundamental frequency of excitation due to the gear mesh at the rated speed (2650 rpm) of the gearbox is about 618 Hz. Even considering the 5th harmonic component, it is 3091 Hz, so it was determined that the validation of the FE model for vibration analysis was sufficient to review up to 3200 Hz. For the measurements of the FRF, the housing was excited with an impact hammer and the response was measured with three-axis accelerometers (Figure 3 and Table 1).
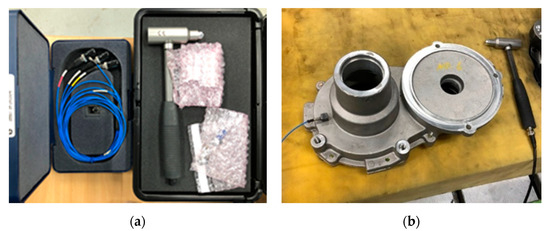
Figure 3.
Experimental modal analysis. (a) Test equipment; (b) Modal testing.

Table 1.
Specifications of test equipment.
The EMA results showed that six flexible modes, except for the rigid body mode, appeared in the frequency range of interest. The FRFs of the housing are shown in Figure 4, and the natural frequencies and damping values in each mode are shown in Table 2. The average damping values was about 0.316%, and this value was used for analysis with the FE model.
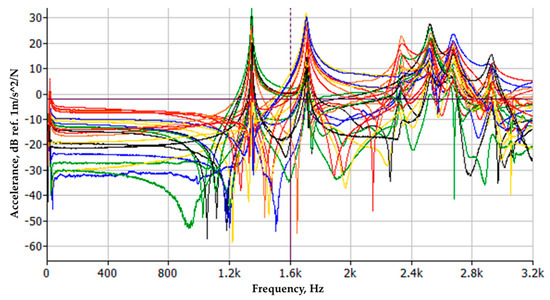
Figure 4.
Frequency response functions (FRFs) of the housing.
Table 2.
Results of the experimental modal analysis.
2.2. Finite Element Model Update
Experimentally obtained natural frequency and mode shape information about gearbox housing can be used to update and validate dynamic characteristics predicted by FE analysis. In this study, the FE model was updated through the optimization process using the natural frequency as the objective function. The optimization parameters included material properties that affected the inertia and stiffness of the housing (density, Young’s modulus, and Poisson’s ratio), and the contact type between the components of the gearbox housing (upper and lower case, Figure 5) was used.
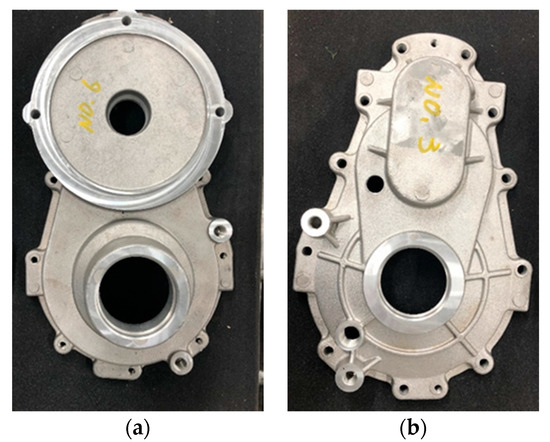
Figure 5.
Components of the gearbox housing. (a) Upper case; (b) Lower case.
Using the EMA results of each housing component, model update at the component level was conducted first. The initial material of the housing was defined by the properties of general aluminum, and the updated material properties are listed in Table 3.
Table 3.
Updated material properties.
The bolted joints of the assembled housing were connected using one-dimensional (1D) rigid elements (RBE2). In the initial analysis, no contact between the housing components was defined, and a case study was conducted according to the contact type available for linear analysis. As a result, when the contact surface of the housing component was analyzed by a bonded connection, the results were most similar to the EMA results. Table 4 shows the frequency differences from the EMA results before and after the FE model update.
Table 4.
Results of the FE model update.
2.3. Finite Element Model Validation
Numerically predicted dynamic characteristics of the FE model were validated using modal assurance criterion (MAC) values. A MAC value is a statistical indicator that compares the mode shape vectors of two different models. It is calculated by the following equation:
where : eigenvector of ‘i’th mode for EMA; : eigenvector of ‘j’th mode for the FE analysis (FEA). If the value is close to 1 in the same mode, the two models match [11].
Figure 6 shows that the MAC results between the updated FEA and the EMA were nearly 1 in the lower order modes (1st to 4th mode), which was the main range of interest, and the values were about 0.8 in the higher order modes (5th and 6th mode). These results indicate that the FE model used in this study was reliable. In Figure 7, the mode shapes of the FEA and EMA results were compared, and the dynamic behaviors of the two models were similar.
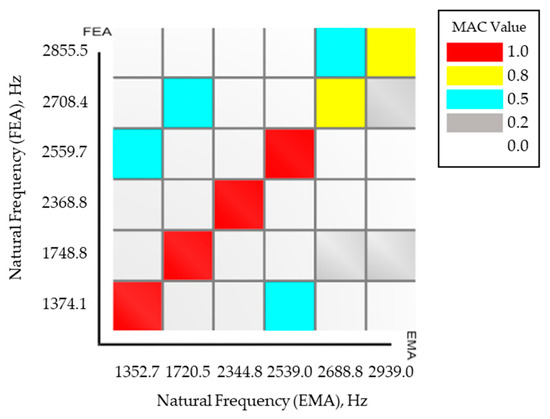
Figure 6.
Modal assurance criterion (MAC) results between the experimental modal analysis (EMA) and finite element analysis (FEA).
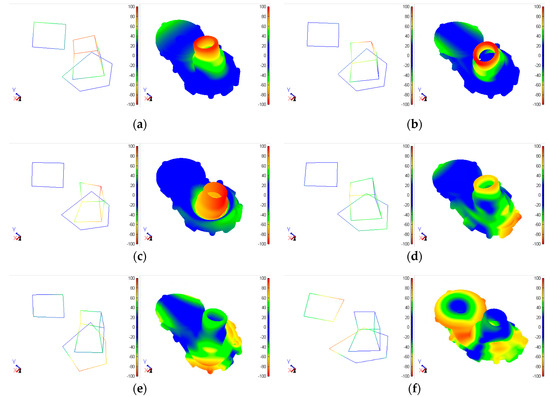
Figure 7.
Comparison of the mode shape between EMA (left) and FEA (right). (a) 1st mode; (b) 2nd mode; (c) 3rd mode; (d) 4th mode; (e) 5th mode; (f) 6th mode.
3. Local Stiffness Evaluation of the Gearbox Housing
3.1. Driving Point Frequency Response Analysis
Driving point frequency response was analyzed to predict the level of system response in the frequency range of interest. The driving point is the point at which the excitation point and response point the same (i = j). The inverse of the FRF to the displacement (compliance) is the dynamic stiffness of the structure. In this study, the local stiffness was evaluated using the driving point FRF. The local stiffness was evaluated at a total of 65 points by dividing the grid on the gearbox housing surface (Figure 8).
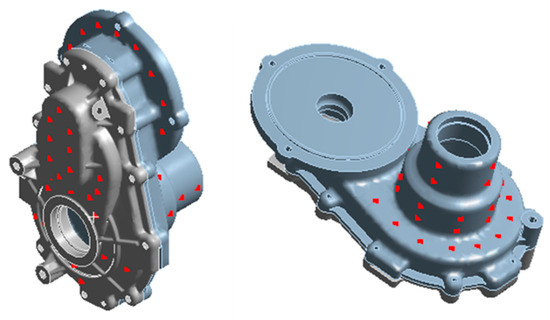
Figure 8.
Points evaluated for local stiffness.
The relevant equations are as follows.
where : compliance with and , m/N; : displacement of ‘i’th DOF, m; : excitation force of ‘j’th DOF, N.
where : dynamic stiffness with and , N/m.
In general, because the response measurement of the system mainly uses the accelerometer, the stiffness line on the FRF curve can be expressed as follows according to the relationship between the displacement and acceleration [8]:
where : acceleration, m/s2; : frequency, rad/s.
3.2. Identification of the Stiffness Weak Point
The FRFs analyzed on the gearbox housing surface were divided into six parts, and the local stiffness was numerically evaluated based on the FE model in the free end condition and the stiffness weak point was identified. The stiffness was evaluated as weakest at the 1st mode frequency for 1/2/3 parts and at the 4th mode frequency for 4/5/6 parts (Figure 9 and Table 5). Part 2, which showed the lowest level of stiffness in the local stiffness evaluation results, was selected as a stiffness weak point, and a housing rib design was developed to improve the stiffness.
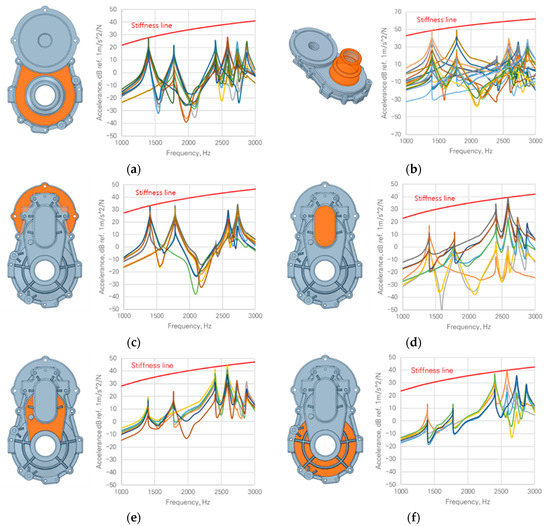
Figure 9.
Results of the local stiffness evaluation. (a) Part 1; (b) Part 2; (c) Part 3; (d) Part 4; (e) Part 5; (f) Part 6.
Table 5.
Results of the local stiffness evaluation.
4. Parameter Study of the Rib Design
Based on the results of local stiffness evaluations, ribs were designed to improve the stiffness of the gearbox housing. By reducing the vibration caused by deflection of the system, elastic strain analysis was conducted to find the location that had the greatest influence on deflection. By analyzing the elastic strain at the frequency of the 1st mode of the system, ribs were designed where the largest strain distribution was shown (Figure 10). The width (W), length (L), and height (H) of the rib were selected as parameters for the rib design (Figure 11). The local stiffness was evaluated after rib design only in part 2, which was identified as the stiffness weak point.
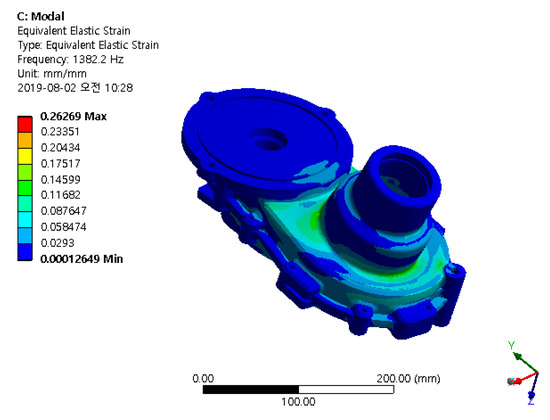
Figure 10.
Elastic strain of the 1st mode.
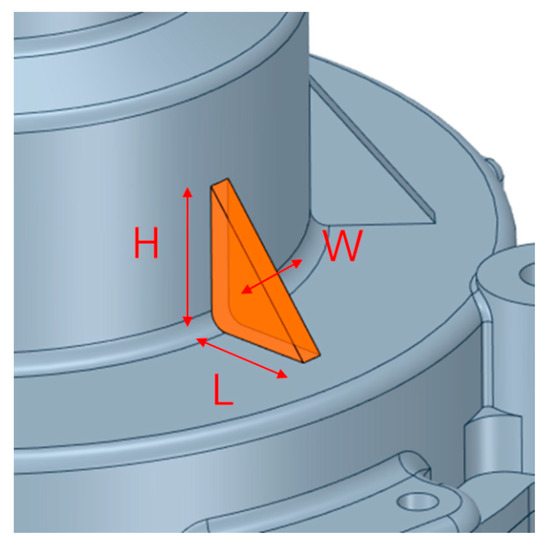
Figure 11.
Parameters of the rib design.
4.1. Parameter Study 1: Width versus Area
First, the local stiffness results were compared while increasing the width of the rib and decreasing the length and height at the same rate while fixing the mass of the rib (Table 6). The rib designed in the original housing had a width of 4 mm. Therefore, to check the effect of the rib width, the value was increased from 4 mm to 6 mm and 8 mm. According to the results, when the width was increased, the stiffness increase rate gradually decreased from 34.5% to 28.4%, and 24.6%, respectively. In other words, the rib design showed that it was more effective to increase the length or height than to increase the width with the same mass in terms of the stiffness increase rate
Table 6.
Results of parameter study 1.
4.2. Parameter Study 2: Length versus Height
Based on the results of parameter study 1, the width of the ribs was fixed at 4 mm and the results of the local stiffness evaluation were compared by varying the length and height (Table 7). In consideration of the shape of the housing, the lengths of the ribs were selected to be 10 mm, 15 mm, and 20 mm, and the heights of the ribs were selected to be 15 mm, 20 mm, 25 mm, 30 mm, and 35 mm. As the length and height of the ribs changed, they showed different mass distributions. In parameter study 2, the stiffness increase rate was divided by the mass of the rib, and this value was referred to as the efficiency (%/g); these data were then compared. Because the design of the ribs led to an increase in the material cost, the increase rate of stiffness against the rib mass was considered as an important indicator in manufacturing. In the results, the efficiency was the highest with 2.31 %/g when the rib length was 20 mm and the height was 25 mm. If the target stiffness is met when the actual housing is manufactured, the rib design can be considered by comparing the efficiency.
Table 7.
Results of parameter study 2.
4.3. Comparison between the Original and Modification Model
The results of our parameter studies showed that increasing the length or height was more effective than increasing the width of the rib. For the same width of 4 mm, the efficiency of dividing the stiffness increase by the mass of the ribs by varying the length and height was compared. Finally, the most efficient rib shape parameters with a length of 20 mm and height of 25 mm were selected for the modification model. Figure 12 shows the final modified design considering the shape and manufacturability of the housing.
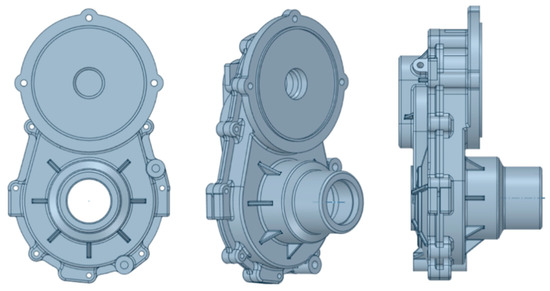
Figure 12.
Modification model.
In the modification model, the local stiffness of the stiffness weak point (part 2) was also evaluated. The driving point FRF was compared with the original model in the frequency range of interest (Figure 13). According to the results, the maximum amplitude of acceleration decreased by about 1.87 dB, and the local stiffness increased by about 43.3% compared with the original model.
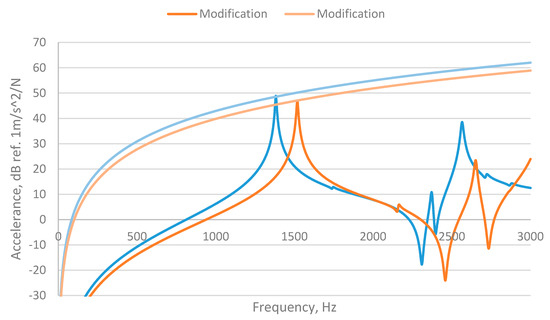
Figure 13.
FRF comparison between the original and modification model.
5. Conclusions
This study aimed to improve the stiffness of the gearbox housing of agricultural electric vehicles through rib design for vibration reduction. The local stiffness was numerically evaluated based on an FE model to confirm the stiffness improvement according to the rib design.
The model for the FE analysis was validated to ensure that it reflected the dynamic characteristics of the actual gearbox housing through the EMA and FE model update process. Local stiffness was evaluated in the validated model to identify weakness in the stiffness, and rib design was conducted through elastic strain analysis. The stiffness increase rate was compared according to the width, length, and height of the ribs. Finally, the rib shape which demonstrated the highest stiffness increase rate against the same mass was selected.
The main conclusions from this study are as follows.
- EMA and FE model update were conducted to predict the dynamic behavior of the system. In the results, the natural frequency value in the frequency range of interest showed an error within about 2.84%, and the mode shape was compared with the MAC value, where data had a value close to 1. From these results, the reliability of the FE model was validated.
- Before we designed the rib for stiffness improvement, the local stiffness was numerically evaluated based on the FE model at 65 points on the surface of the gearbox housing in the validated model, through which the stiffness weak point was identified and the stiffness increase rate before and after the rib design were compared.
- The direction of rib design was established through elastic strain analysis, and a parameter study was conducted using the rib width, length, and height as variables. According to the results, increasing the length and height was more effective in terms of stiffness increase than increasing the width in rib design. Finally, ribs with a width of 4 mm, a length of 20 mm, and a height of 25 mm were selected for the modification model, which showed the highest increase in stiffness relative to the same mass.
- When comparing the results of the frequency response analysis of the modified gearbox housing, the maximum acceleration amplitude in the frequency range of interest was reduced by about 1.87 dB compared with the original model, and the stiffness increase rate was about 43.3%.
Author Contributions
Conceptualization, Y.-J.P.; Data curation, G.-H.S. and S.-J.C.; Investigation, S.-J.C.; Methodology, Y.-J.P.; Software, G.-H.S. and S.-J.C.; Supervision, Y.-J.P.; Validation, G.-H.S.; Writing—original draft, G.-H.S.; Writing—review & editing, Y.-J.P.
Funding
This research received no external funding.
Conflicts of Interest
The authors declare no conflict of interest.
References
- McFadzean, B.; Butters, L. An investigation into the feasibility of hybrid and all-electric agricultural machines. Sci. Pap. Ser. A Agron. 2017, 60, 500–511. [Google Scholar]
- Baesso, M.M.; Martins, G.A.; Fischer, C.; Modolo, A.J.; Koja, F. Ergonomic evaluation of vibration and noise emissions of agricultural tractors based on power and working time. Trans. ASABE 2015, 58, 1177–1184. [Google Scholar]
- Govindswamy, K.; Eisele, G. Sound Character of Electric Vehicles; SAE Technical Paper 2011-01-1728; SAE 2011 Noise and Vibration Conference and Exhibition; SAE International: Warrendale, PA, USA, 2011. [Google Scholar]
- Meunier, S.; Rabau, G.; Friot, E. Annoyance and Loudness of Pure Tones in Noise: Application to Active Control of Fan Noise; CFA/DAGA 04; SFA: Paris, France, 2004. [Google Scholar]
- De Santiago, J.; Bernhoff, H.; Ekergard, B.; Eriksson, S.; Ferhatovic, S.; Waters, R.; Leijon, M. Electrical motor drivelines in commercial all-electric vehicles: A review. IEEE Trans. Veh. Technol. 2012, 61, 475–484. [Google Scholar] [CrossRef]
- Fang, Y.; Zhang, T. Sound quality investigation and improvement of an electric powertrain for electric vehicles. IEEE Trans. Ind. Electron. 2018, 65, 1149–1157. [Google Scholar] [CrossRef]
- Zhang, Y.; Phaneuf, K.; Hill, W. Dynamic Analysis of Rib Patterns; SAE Technical Paper 911066; Noise and vibration Conference and Exposition; SAE International: Warrendale, PA, USA, 1991. [Google Scholar]
- Kim, K.C.; Kim, C.M. A study on the body attachment stiffness for the road noise. J. Mech. Sci. Technol. 2005, 19, 1304–1312. [Google Scholar] [CrossRef]
- Lee, H.K.; Hong, S.M.; Kim, M.S.; Hur, J.W.; Yoo, D.K. A Research for the Noise Development of the FF 8th Speed Automatic Transmission. Trans. KSNVE 2016, 26, 559–566. [Google Scholar] [CrossRef][Green Version]
- Schedlinski, C.; Wagner, F.; Bohnert, K.; Frappier, J.; Irrgang, A.; Lehmann, R.; Müller, A. Experimental modal analysis and computational model updating of a car body in white. In International Seminar on Modal Analysis; KU Leuven: Leuven, Belgium, 2004. [Google Scholar]
- Friswell, M.; Mottershead, J.E. Finite Element Model Updating in Structural Dynamics; Springer Science & Business Media: Berlin, Germany, 2013; Volume 38. [Google Scholar]


© 2019 by the authors. Licensee MDPI, Basel, Switzerland. This article is an open access article distributed under the terms and conditions of the Creative Commons Attribution (CC BY) license (http://creativecommons.org/licenses/by/4.0/).