Article

Experimental Verification of Yam (Dioscorea rotundata) Drying with Solar Adsorption Drying

1
Food Science and Technology Department, Kwame Nkrumah University of Science and Technology, Kumasi 1916, Ghana
2
Agricultural and Biosystems Engineering Department, Kwame Nkrumah University of Science and Technology, Kumasi 1916, Ghana
3
Biobased Chemistry and Technology, Wageningen University Research, Gelderland 6708, The Netherlands
*
Author to whom correspondence should be addressed.
Appl. Sci. 2019, 9(18), 3927; https://doi.org/10.3390/app9183927
Submission received: 12 July 2019 / Revised: 10 September 2019 / Accepted: 12 September 2019 / Published: 19 September 2019
(This article belongs to the Special Issue Renewable Energy in Agriculture)

Abstract

:
This work evaluates the yam (Dioscorea rotundata) drying performance of solar adsorption drying (SAD) compared to solar drying (SD) and open sun drying (OSD). The evaluation concerns the drying cycle for batches of yam, the effect on vitamin C, color and composition. As SAD can be applied during the night, by using air dehumidified by passing through a bed of silica gel, the cycle time for drying batches of yam can be reduced over 20–25% compared to SD and halved compared to OSD. SAD is thereby most effective during the first nights of drying when the driving force is the highest. Composition was not affected by drying methods but did affect vitamin C content. Vitamin C retention is not significant different for SD and SAD, but with a slight preference for SD. For three yam cultivars (‘Pona’, ‘Lilii’ and ‘Dente’), ‘Lilii’ dried fastest and ‘Dente’ drying slowest. SAD maintained 16 the whitish color of yam better than the other drying methods.

1. Introduction

Yam (from the Dioscoreaceae family) is a perennial tuber crop from a climbing plant. Some species (Dioscorea) contain toxic or bioactive chemicals, while others are cultivated for pharmaceutical purposes [1]. Yams vary in appearance between and within species, however all yams have common growth habit of thin, twinning vines and a shallow wide radiator root system. White yam (‘Pona’, ‘Lilii’ and ‘Dente’) tubers are long cylindrical and tapering in shape with rough scaly brown, firm exterior texture and white flesh. White yam (Dioscorea rotundata) is the most widely grown and preferred yam species in Ghana, especially the ‘Pona’ cultivar for both the domestic and export market. The other important cultivars are ‘Dente’ and ‘Lilii’. The fresh product is eaten when boiled or fried. The cooked yam is pounded into a dough-like paste called fufu is eaten with soup which is a delicacy in Ghana [2]. Fried yam involves frying after cutting yam chips in vegetable or palm oil and is usually consumed with pepper, fried fish and or stew. On the other hand, the differences in morphology, texture, functional, rheological and their effect on drying characteristics are yet to be given attention. Yam is highly perishable due to its high moisture content about 70% [3]. This makes fresh yams susceptible to microbial spoilage. This phenomenon has challenged scientists and product developers to engineer novel approaches to address the challenge. Notable among them is drying technology [4].
Solar energy which is free, abundant and safe will not only help meet the energy needs of the farmer but will also help remove potential roadblocks for processing agricultural products. Energy from the sun has been used in the drying and preservation of agricultural products for a long time. According to Berinyuy et al. [5], most agricultural surpluses are preserved using energy from the sun. Arinze et al. [6] reported that in developing countries over 90% of agricultural products are sun dried. Although open sun drying requires little capital and work force, it is associated with many problems and shortcomings. Besides longer drying periods and the possibility of contact with contaminants such as stones and dirt, the crops dried along roadsides stand the risk of contamination with exhaust gases from traffic or moving vehicles, which denatures their nutritional value [7]. El-Beltagy et al. [8] reported that vitamin C has a high sensitivity to light and, therefore, the exposure to solar radiation increased the vitamin C loss during drying. In order to minimize or prevent the shortcomings of open-air drying, the use of dryer equipment driven by solar energy has been investigated and proven to be a better alternative.
A reliable supply of energy is one of the important prerequisites for the growth of Africa’s agricultural industry. Access to fossil fuels such as coal and petroleum or electricity for farm operations or crop processing is expensive and mostly unreliable, while that of fuel wood is not sustainable. Solar energy is an alternative source of energy which has an advantage over other alternative sources of energy such as wind and shale because of its abundant, inexhaustible, renewable and non-polluting nature. The method of drying affects the rate of drying and the quality of the product. Air drying in general enhances the drying rate, while direct exposure to the sun can have a deleterious effect on the quality of the dried product. Changes of vitamin C content during drying have been affected by drying time, drying air temperature and moisture content [9,10]. Yam contains vitamin C as a bioactive compound, which has strong antioxidant activity. It plays an important role in human nutrition due to free radical scavenging activities [11,12]. Vitamin C is degraded by irreversible oxidative reactions during air drying [13]. Santos and Silva [14] mentioned that a high oxygen concentration around the drying environment may lead to an increase in vitamin C degradation in the dried product. It has been reported that drying methods effect the final moisture content, but not other components of yam flours [15]. Maintaining the original color of food samples is a priority of the processor and the demand of the consumer. Yam contains phenolic compounds, which are associated with oxidative browning by enzymes and oxidative browning [16]. Thus, any processing method that is consumer-acceptability driven by maintaining either the whitish or creamer color of yam meets great demand.
Solar drying systems, where either the product is directly dried in a glass covered chamber or indirectly by channeling hot air into a drying chamber by first heating ambient air through a solar collector system, improves the rate of drying as well as the food quality [17]. In both systems, drying results in a reduced drying time and is an improvement over the open-air drying method. Moreover, contamination of the final product is reduced in the solar dryer drying systems [18]. Solar systems are not full proof since the sun’s energy is limited to between six to eight hours a day in the tropics. During the night, rewetting of the products may occur. A solar dryer system with thermal storage was designed and constructed by Madhlopa et al. [19], which enabled and extended drying to continue after sunset. However, the intensity of the solar radiation is not always enough to sufficiently heat the thermal mass. Thus, with this system, the continuity of drying is not warranted.
An improved method is Solar Adsorption Drying (SAD) (see Figure 1), which is a combination of solar collector and adsorption systems. In this system, night drying is made possible by utilizing dehumidified air as a result of passing ambient air through a chamber filled (packed bed) with adsorbents, while releasing adsorbent energy (latent heat) due to a phase change. The saturated adsorbent is regenerated during the day time by using a separate solar collector.
The first aim of this work is to quantify the yam drying performance in a Solar Adsorption Drying system (SAD) compared to a common solar dryer (SD) and open sun drying (OSD) and to compare the effect on vitamin C retention in these three systems. The second aim is to quantify the drying performance, vitamin C retention, and the product color of different cultivars of yam for the three different drying methods. To this end, an experimental system was designed and realized according to the schematic diagram shown in Figure 1 [20].

2. Materials and Methods

2.1. Source of Material and Sample Preparation

Fresh yam varieties (‘Pona’, ‘Lilii’, ‘Dente’) were obtained from Ejura in collaboration with the Crop Research Institute at Fumesua, a suburb of Kumasi in the Ashanti Region of Ghana. The tubers were stored in a barn for two weeks with adequate ventilation (ambient) after transportation from the farm before they were bought. The bought tubers were store in the Food Science and Technology Laboratory. Tubers were randomly selected and weighed with Mettler-Toledo (SNR 2115396217 balance, Greifensee, Switzerland). The middle part of the tuber was first cut into dimensions of 1 cm thick and further cut to 3 × 3 cm using stainless steel knife, employing a veneer caliper. The cut samples were stored in the fridge at a temperature of 8 ℃ overnight. Before drying the samples were allowed to equilibrate with the environment before placing in the solar dryer. Before then 2 g of three replicates had been placed in the oven at 105 ℃ overnight for initial moisture analysis.

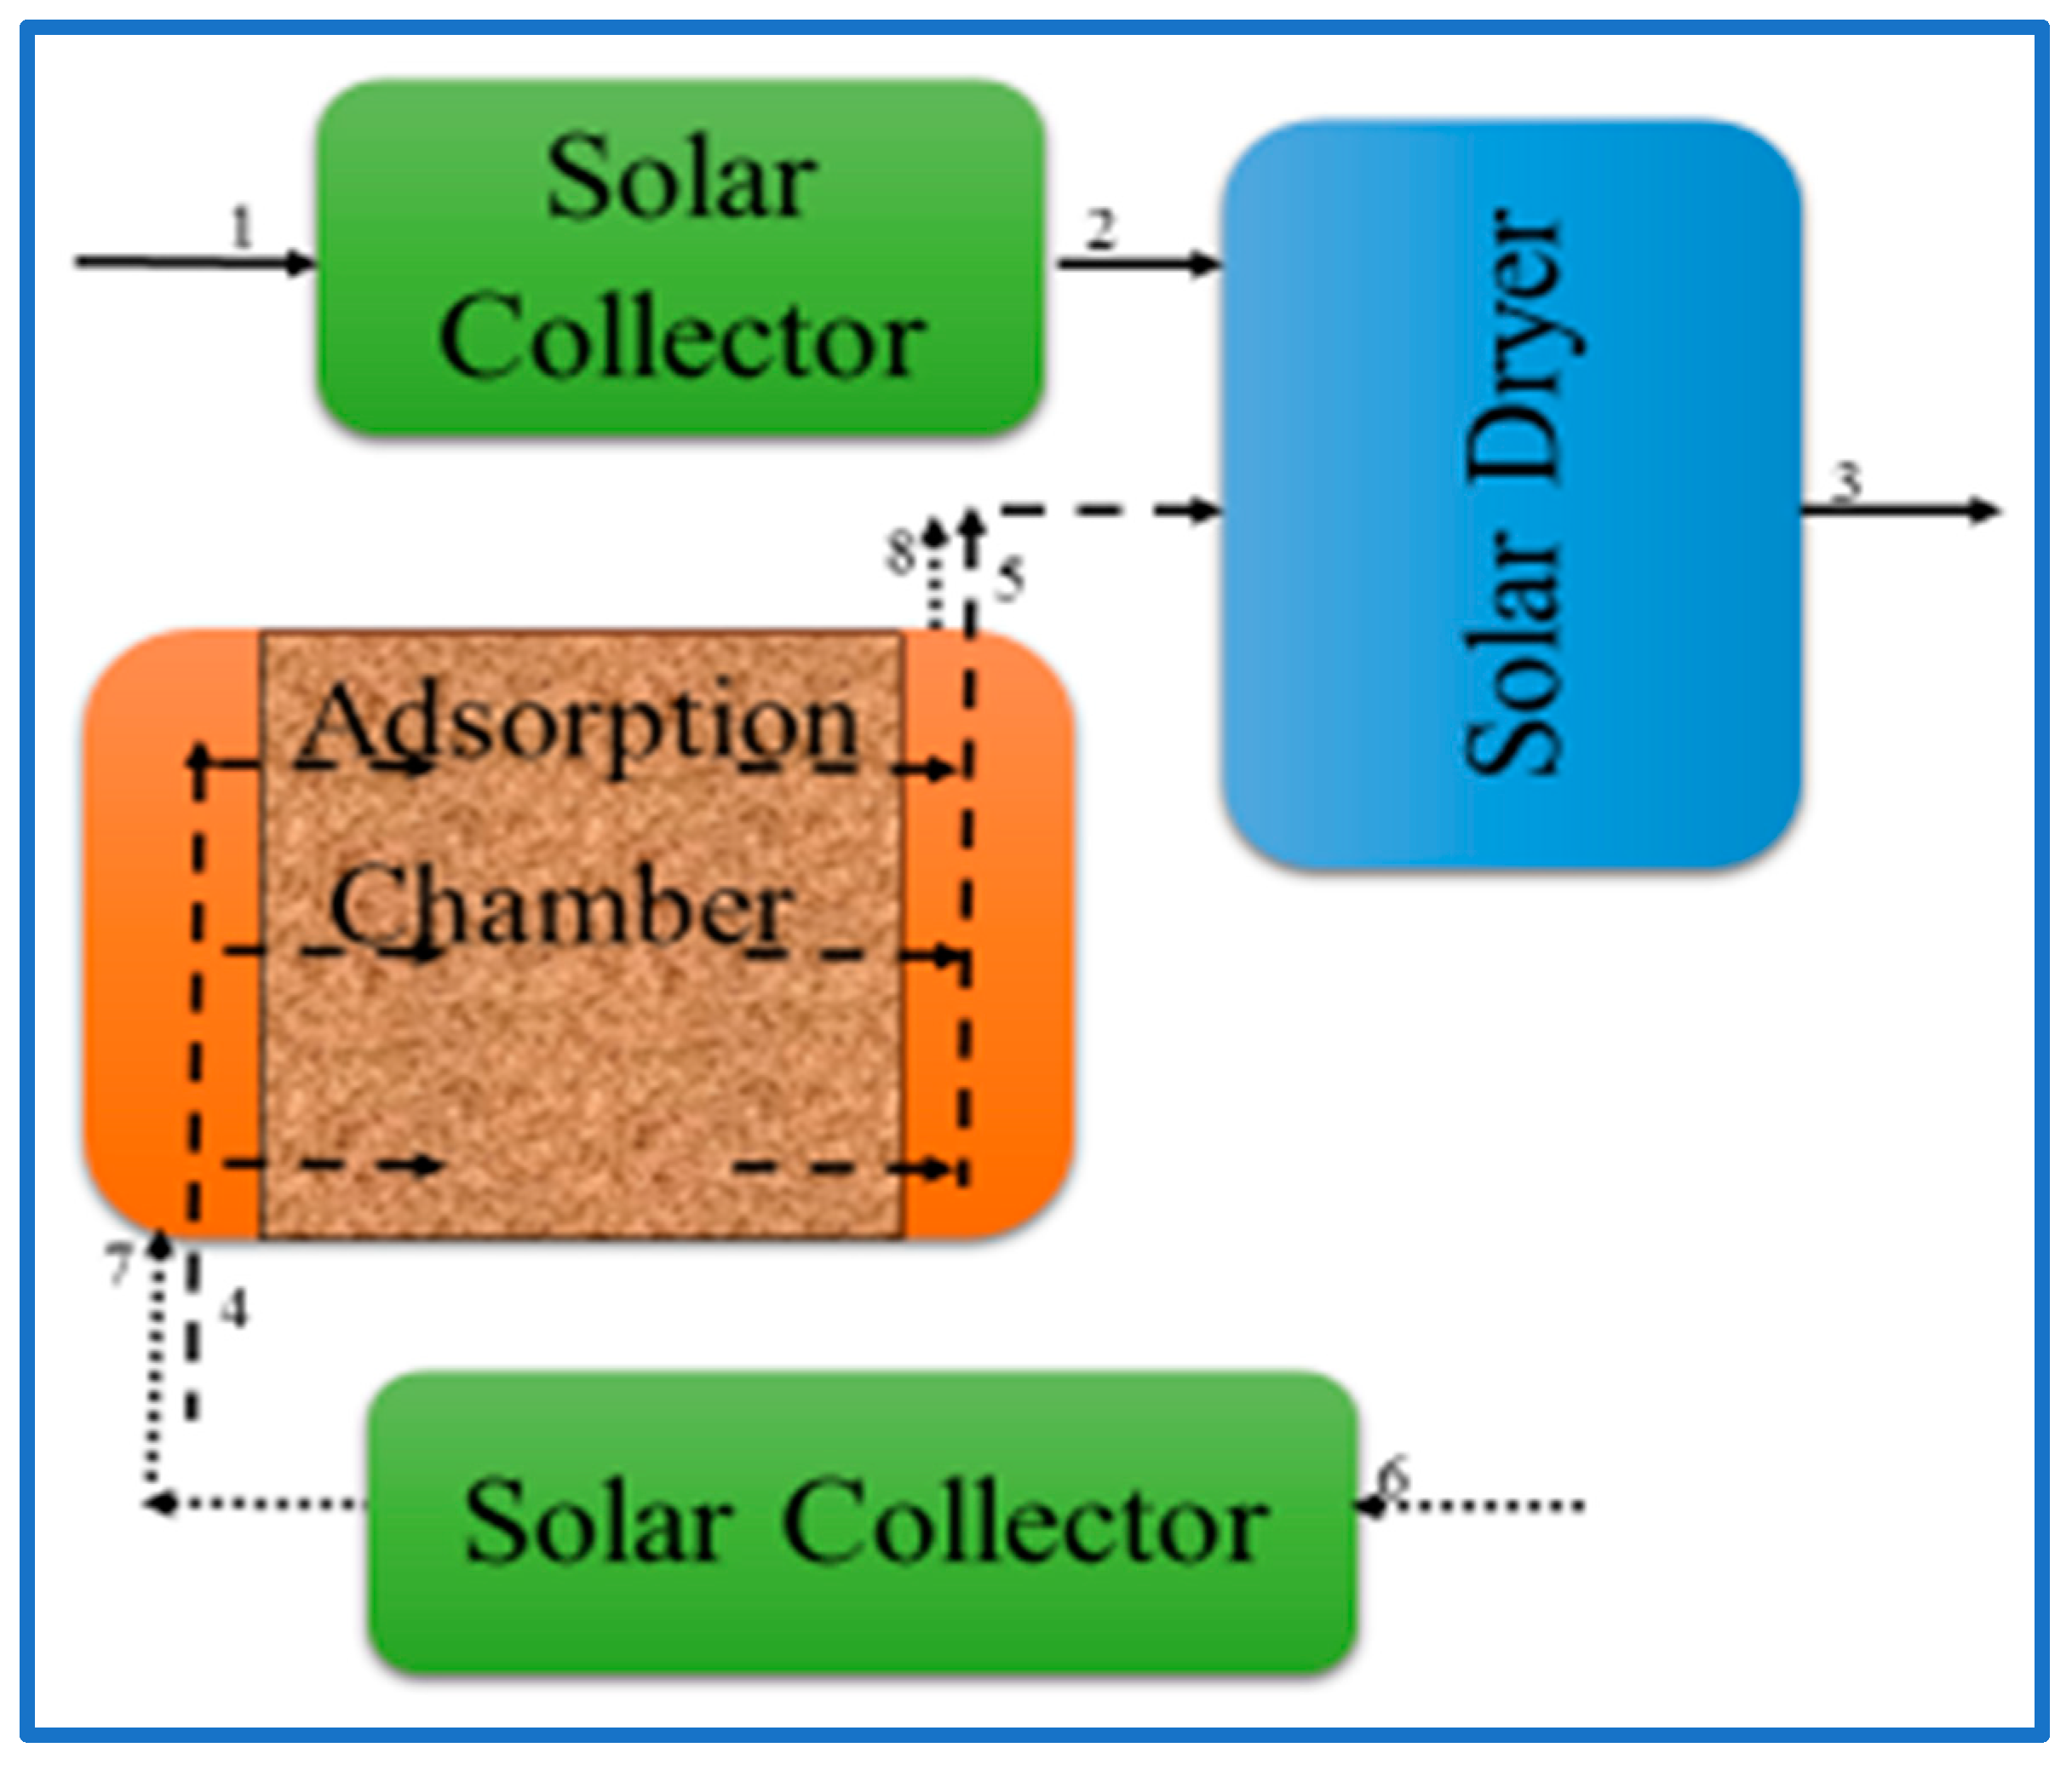
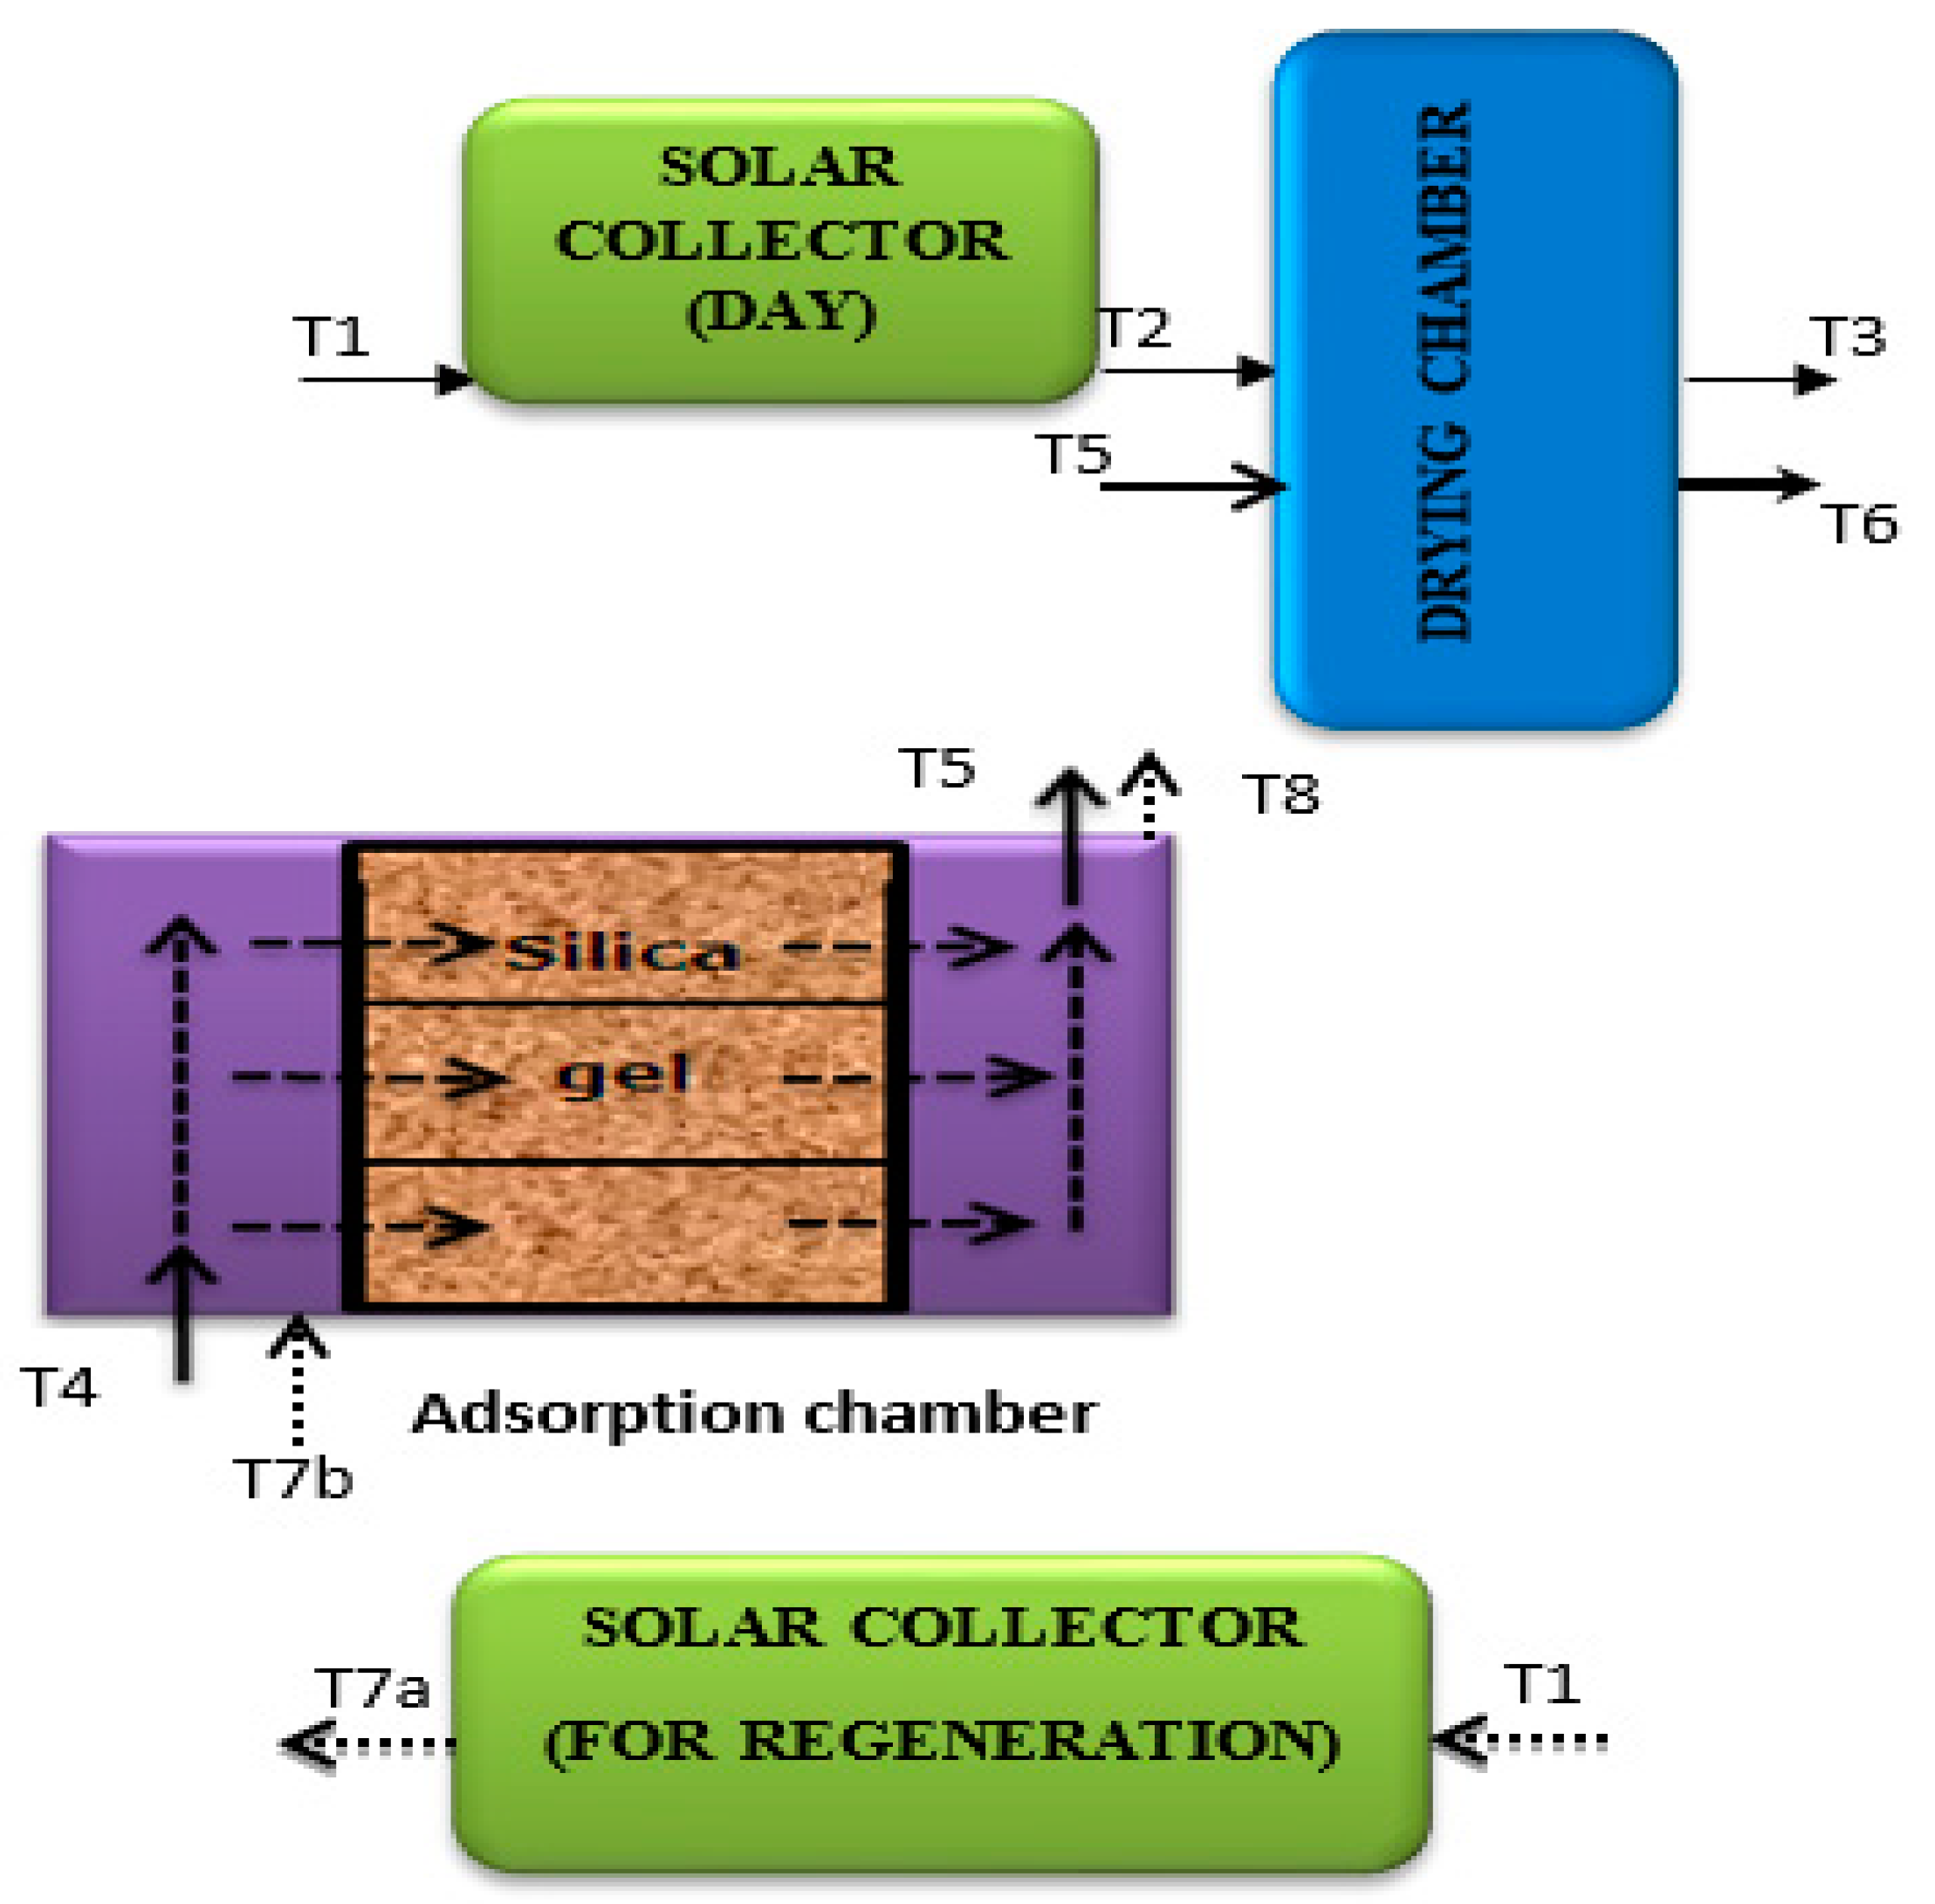
2.2. Description of Dryer Systems

Three experimental drying methods were employed in this study: traditional open sun drying (OSD), solar drying (SD), and the solar adsorption dryer (SAD) as described in Figure 1. OSD and SD were applied during the daytime, while the SAD is also applied during part of the night. The experiments on the three systems were performed in parallel in an open space near the Agricultural Engineering Department, KNUST, Kumasi, Ghana. For OSD, samples were placed in three trays next to each other in the open sun with air passing through freely. Drying for this system depends on the solar radiation, ambient temperature, humidity,, and air circulation along and around the trays. These conditions were subject to natural and uncontrolled variations. The SD system is made up of a solar collector system and a dryer chamber (i.e., equivalent to path 1→2→3 in Figure 1). The collector system consisted of glass cover, air gap, absorber plate and insulation material at the backside. The collector can achieve air temperatures up to 60 ℃. Amankwah et al. provide details of the collector design and the performance. [20].
The SAD was organized as presented in Figure 1. During the day-time, the SAD was operated as a SD, while, during night drying, the air passed through a bed of silica gel, which was used as adsorbent. The applied solar collector was designed to reach air temperatures up to 60 ℃ under Ghanaian radiation conditions. For adsorbent regeneration, another solar collector is used. This collector was larger and could reach air temperatures between 80 to 85 ℃. Details about the design and performance are given by Amankwah et al. [20]. In the drying cabinet, the air flowed freely along the product particles at the wired trays by natural (OSD) or forced convection (SD and SAD).

2.3. Temperature, Air Velocity and Weight Measurements

Calibrated K-type thermocouples were used to measure the inlet and outlet air temperature of all the units in Figure 2, logged by an Agilent 34970A data logger (Agilent, Santa Clara, CA, USA). An analytical balance (Ohaus, Model PA-2102, Parsippany, NJ, USA) with precision 0.01 g was used to weigh the drying samples. This was done manually with a 30 minute-interval for the first two hours and one-hour interval until the end of drying by removing the samples from the drying chamber. The samples were placed back into the drying chamber no later than five minutes to ensure continuity of the drying process. The air velocity was measured from time to time to ensure it had an average constant with a thermal anemometer (Testo, model 425, Lenzkirch, Germany, accuracy ± 0.05 m/s) by placing the rod housing the sensor perpendicular across the direction of the airflow for both SD and SAD. Each time, three measurements were performed and the values were averaged. The location of temperature measurements is shown in Figure 2. For the comparison of the drying behavior of different cultivars the moisture ratio is used:
M R ( t ) = M ( t ) M s t a r t
where M R ( t ) is the moisture ratio at time, t , M ( t ) is the moisture content at time t , and M s t a r t is the initial moisture content.

2.4. Chemical Analysis

The AOAC (Association of Official Agricultural Chemists) protocol [21] was followed to determine crude fat and fiber. Nitrogen was determined by the Kjeldahl digestion and fat by the Soxhlet method [21]. Crude protein content was calculated using a factor of 6.25. Moisture and ash content were determined gravimetrically in accordance with AACC methods 44–17 [22]. Crude fiber content was determined by the digestion method [22]. Total percentage carbohydrate was determined by the difference method. This method involves adding the total value of moisture, ash, crude protein, crude fiber component of the sample, and subtracting it from 100. The values determined were converted to a dry basis (kg/kg dry matter).

2.5. Vitamin C Content

The vitamin C was determined by visual titration of ascorbic acid with 2,6 dichlorophenolindophenol as an indicator in a pH range of 1–3.5 [23,24]. The values were determined in triplicates and reported on a dry basis (mg/g dry matter).

2.6. Instrumental Determination of Color

Color, an important quality parameter of dried foods, influences consumer acceptability decisions of finished products [25,26]. The color of fresh and dried yam slices was determined in terms of the tristimulus color values L*, a*, and b* using Minolta Chromameter, CR-300 (Minolta Co., Osaka, Japan). Where, L* indicates lightness or darkness of the material, L* = 0 is completely black, and L* = 100 is completely bright. The a* is the color coordinate in a red-green axis. A positive a* value for redness and negative for greenness. b* is the color coordinate in a yellow-blue axis. A positive for yellowness and a negative for blueness. The color of the yam slices was measured after calibrating the instrument with a white tile (L* 93.3, a* 0.32 and b* 0.33). Yam slices were put into a transparent petri dish and the measuring head of the meter was carefully placed on three different locations on the petri dish. The measurements were determined in triplicates and their mean was determined.
The total color difference of the dried plantain foam ( Δ E ) was calculated using the color of the fresh yam as a reference point as shown in equation 2:
Δ E = ( L 0 * L * ) 2 + ( a 0 * a * ) 2 + ( b 0 * b * ) 2  
where L 0 * a 0 * and b 0 * are the initial values.

2.7. Experimental Procedure

Two collector systems of the same dimension were separately used for the SAD and SD drying processes. The first experiment, hereafter called ‘Performance of SAD drying,’ concerns the comparison of the required drying times and vitamin C retention of SAD relative to SD and OSD. For this experiment, OSD and SD were carried out during the day time between 9:00 a.m.–5:00 p.m. when enough solar radiation was available. The SAD was applied for five additional hours in the evening until 10:00 p.m., with the adsorption system in use. Full night experiments were not feasible in view of safety regulations. Before each experiment, the SD and SAD were allowed to run for 30 minutes to reach a steady state before loading the trays that contain the yam cubicles to be dried each day.
About 200 grams of yam (‘Dente’) cut (3 × 3 × 1 cm) with initial moisture content between 1.63–2.13 kg water/kg dry matter was placed on each of the three successive trays stacked in the same chamber of external and internal dimensions 70 × 45 × 50 cm and 60 × 45 × 40 cm, respectively. The air flow was in the upward direction from the bottom part of the drying chamber beneath the trays made of wire mesh. At the end of each day, the yam samples were cooled and placed in zip-lock polyethylene bags and stored at room temperature. The next day, the samples were unpacked and placed in the trays to continue drying. This process was repeated on subsequent days until the product was sufficiently dried. At low moisture contents, the benefit of air dehumidification at night becomes minor. Hence, in one experiment, after two day-night cycles, the drying was continued by the solar system only. The vitamin C content was measured for the dried samples.
The next experiment, called the ‘Drying different yam cultivars’ experiment, concerned the drying behavior of different cultivars and the effect of different drying methods on the composition, color, and vitamin C. The procedure is similar to the one described for the first experiment. One hundred grams (100 g) each of yam cultivar cut (3 × 3 × 1 cm) with an initial moisture content between 1.55–2.06 kg water/kg dry matter depending on the variety were all loaded on one tray and the same was loaded on the tray stacked below it as a replicate. Yam samples from tree cultivars (‘Pona’, ‘Lilii’, and ‘Dente’) of D. rotundata were bought from a yam farm.

2.8. Experimental Design and Statistical Analysis

A completely randomized design was adopted for the study. MATLAB and Microsoft excel were used to show the graphical representation. Minitab (version 16) software was used for statistical Analysis. Fischer’s Least Significant was used for the statistical differences between means. All means were reported in three replications. Table 1 gives a summarizing overview of the experiments.

3. Results

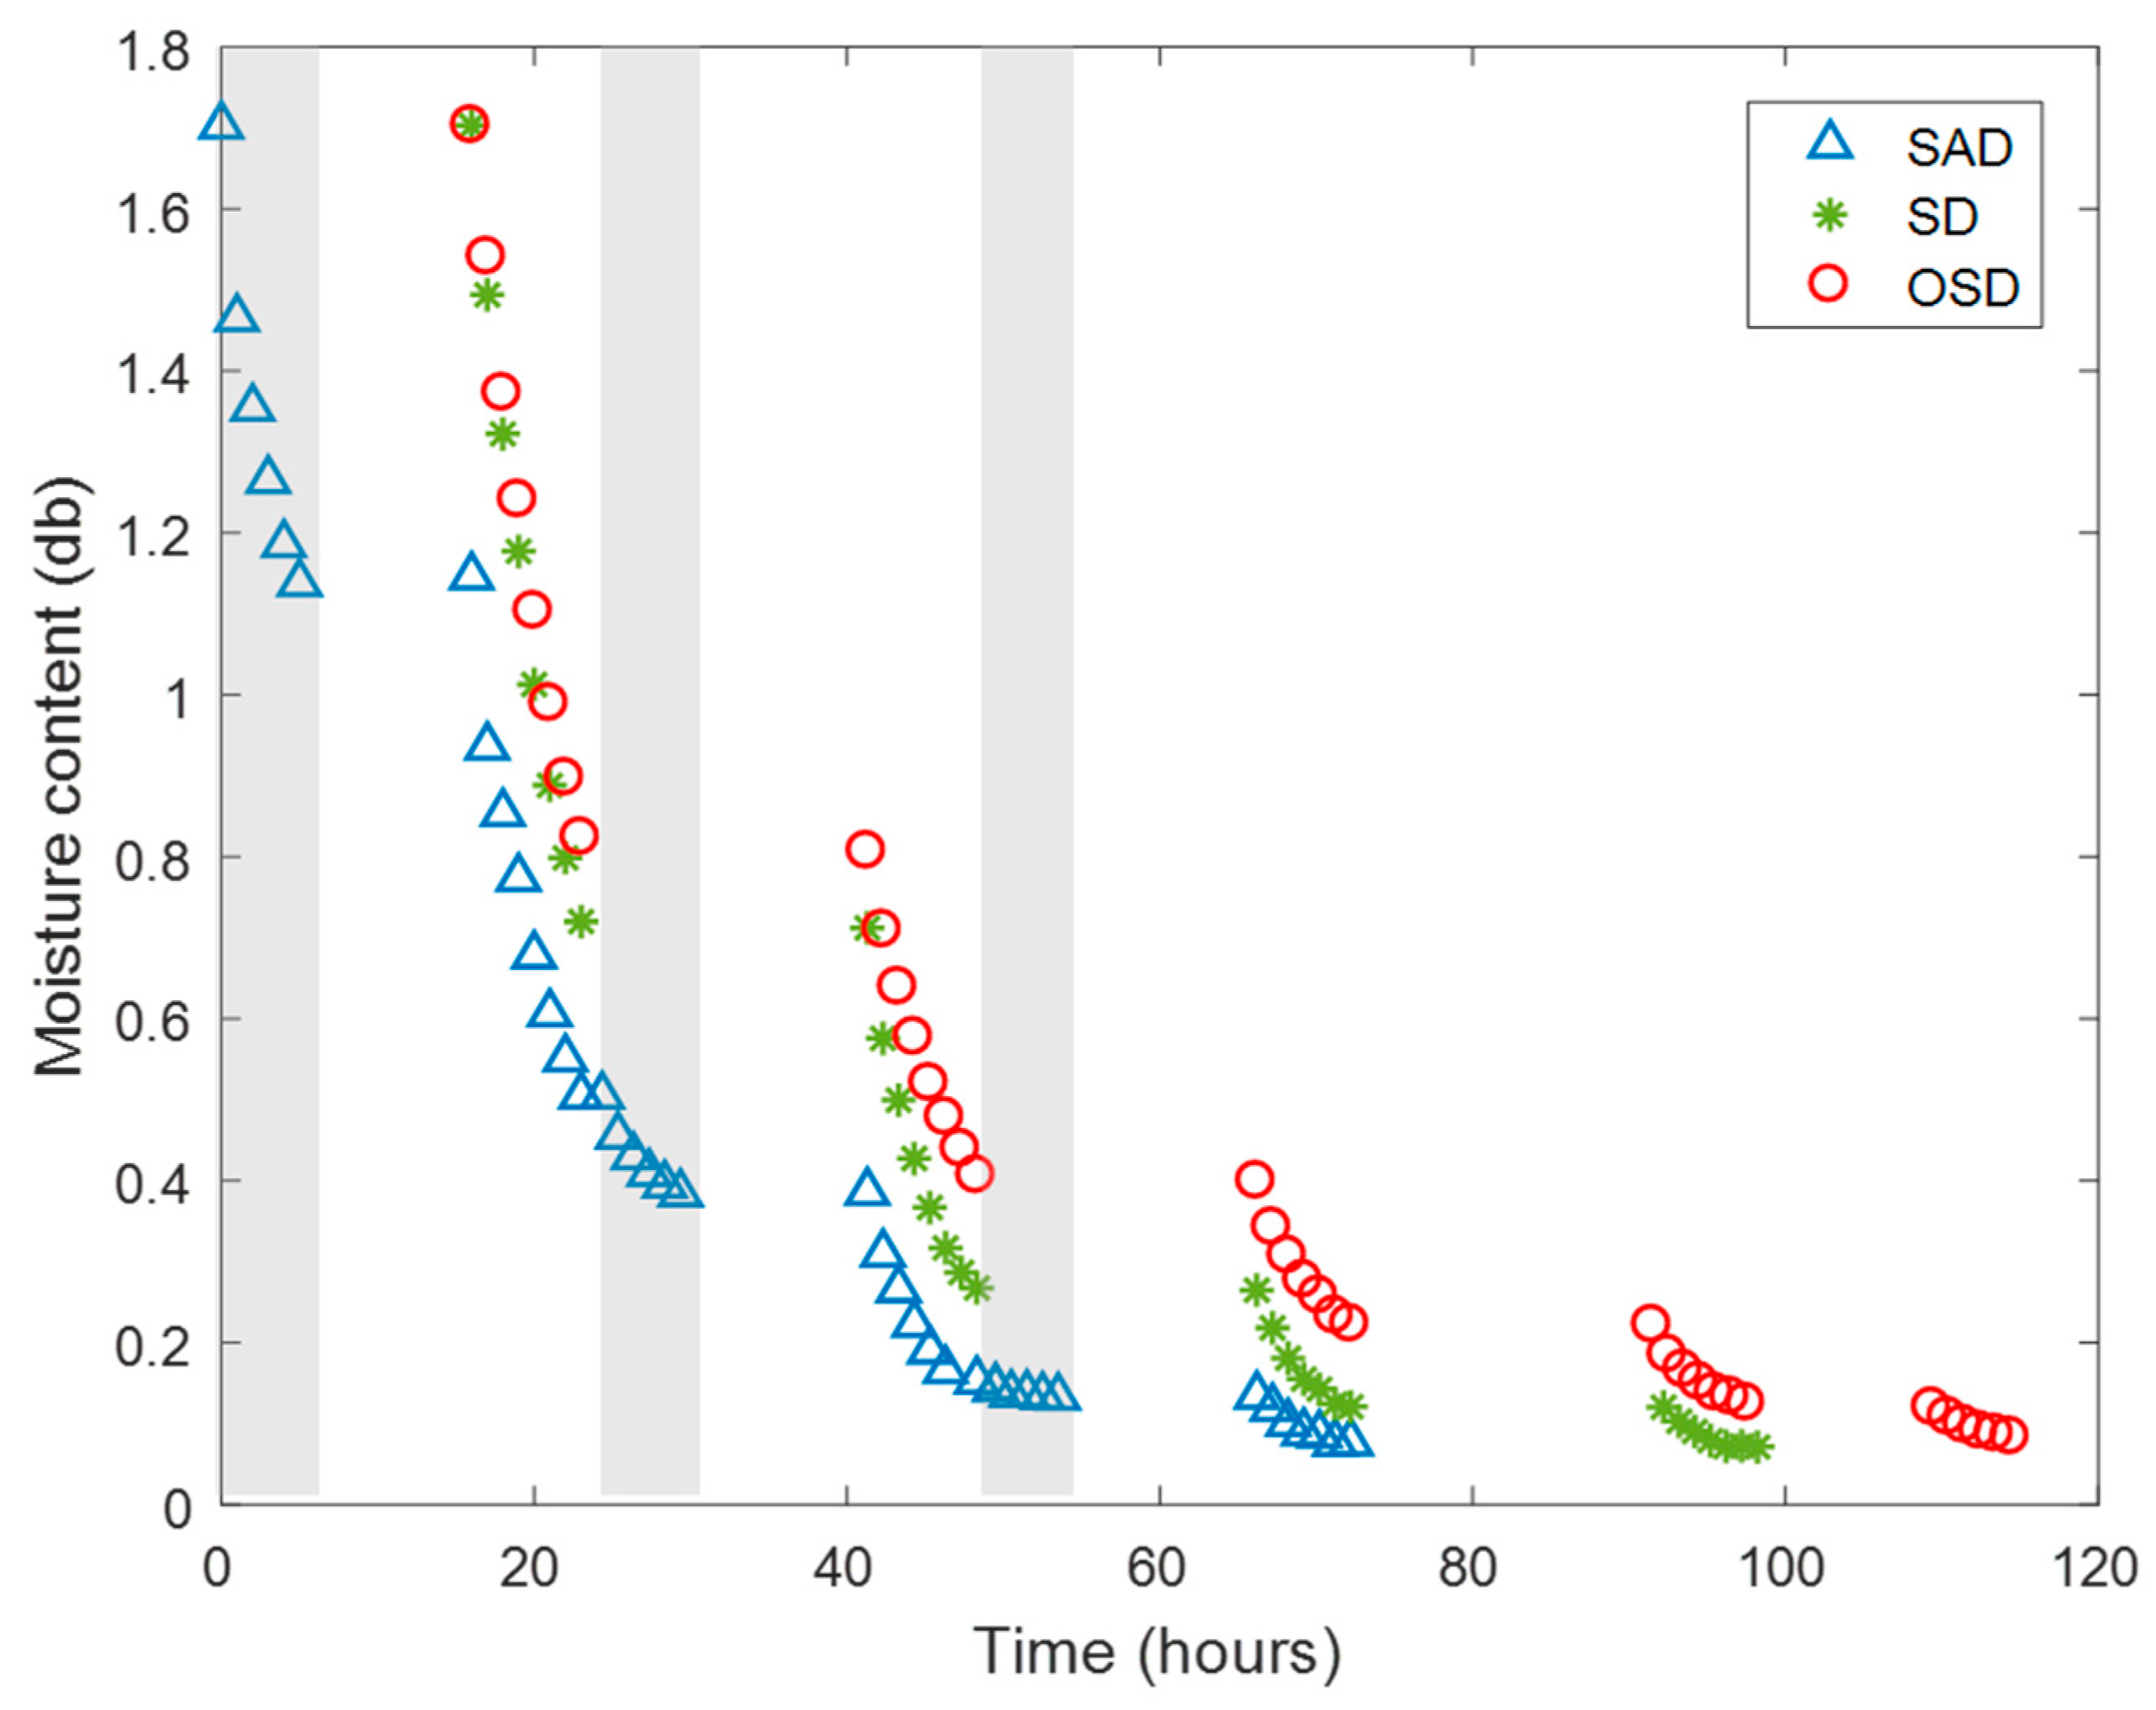
3.1. Performance of SAD Drying

As the driving force for night drying is the strongest for a wet product, this experiment started with night drying using dried silica gel as an adsorbent. The adsorbent was used on the first night for 5 h and hermetically sealed for assessing whether the drying site was up. On the second and third night, the adsorbent was used again. The adsorbent was then stored for regeneration. The performance of the system was monitored by recording the air inlet and outlet temperatures. During the night the temperature increased by 5.2 °C through the release of latent heat of adsorption and the rise of temperature indicates active dehumidification by the adsorbent.
The SD and OSD started in the next morning. The operational conditions: radiation, ambient temperature, input and outlet air temperatures for SAD, SD, and OSD drying systems are shown in Figure 3. The air temperatures that enter the drying units were significantly higher during the day than the nights, whereas the outlet temperatures were slightly lower. During the day, air temperatures increased from the morning, peaked in the afternoon, and dropped towards the evening. The night temperature increased initially due to adsorption energy (see grey portion of Figure 3). Meanwhile, the air temperature related well with solar radiation.
The moisture content of yam particles, averaged over the three trays, is given in Figure 4. The product in the SAD dries immediately in the first night and the water content falls from 1.70 to 1.15 kg water/kg dry matter over the first 5 h of night drying with dehumidified air. SAD is continued the following mornings (day 1). During night 2, SAD is still effective, but, at day 3, the effectivity is no longer significant. The low drying rate during night 3 is a result of the low driving force between the nearly dried the product at the temperatures realized by the dehumidification system. Therefore, adsorption drying during the night is most effective at the early stages of drying after which elevated temperatures are required to remove water when the moisture content of the samples are low.
By the end of the second day 90.3%, 84.3% and 76.2% of water was removed for SAD, SD and OSD, respectively. The total time needed for SAD to reach a final moisture content of 0.07–0.08 kg water/kg dry matter is within three evenings and three days compared to four and five days for the SD and OSD, respectively (Figure 4). This result implies that the capacity of a solar adsorption system increases by a 20%–25% shorter time line compared to a standard solar dryer. Extension to full night drying with an adsorption system, which was not possible in this experimental setting, can further reduce the drying cycle.
The moisture content of yam particles at various locations of the drying chamber, as a function of time for various drying methods is shown in Figure 5. The trays were categorized as Top tray, Middle tray and Bottom tray with air flowing from below the drying chamber for the SAD and SD systems, while that of the OSD are noted as Tray 1–3. For OSD drying, the trays are not stacked in a drying chamber and, therefore, there is no influence between the trays. The SAD system shows differences in moisture content for the three trays especially in the first night under low temperature drying with dehumidified air, while there are only minor differences for the trays in the SD dryer as corroborated by Dissa et al. [27]. The differences between the trays in SAD that arise during the first night propagate over the next days and nights.
Figure 6 shows the effect of different drying methods on vitamin C at the end of drying in ‘Dente’. The figure shows that, for each drying method, vitamin C content was reduced. There was no statistical difference in vitamin C retention between Solar drying (SD) and solar adsorption drying (SAD) samples. The open sun (OSD) dried samples retained the least vitamin C. Though adsorption drying involves low temperatures, because it is an addition to solar drying, the longer exposure of the food samples (44 h for SAD and 32 h for SD) to air flow might have contributed to vitamin C loss in comparison with the SD system [14,28]. Additionally, the loss of vitamin C might also be attributed to higher temperatures for both SAD and SD while higher rates of moisture removal by SAD than SD cause a difference between them. The open sun (OSD) dried samples retained less vitamin C due to exposure of food to direct sunlight [8] in addition to moisture removal. This explains why the SAD and SD samples retained higher concentrations of vitamin C compared to the OSD samples.

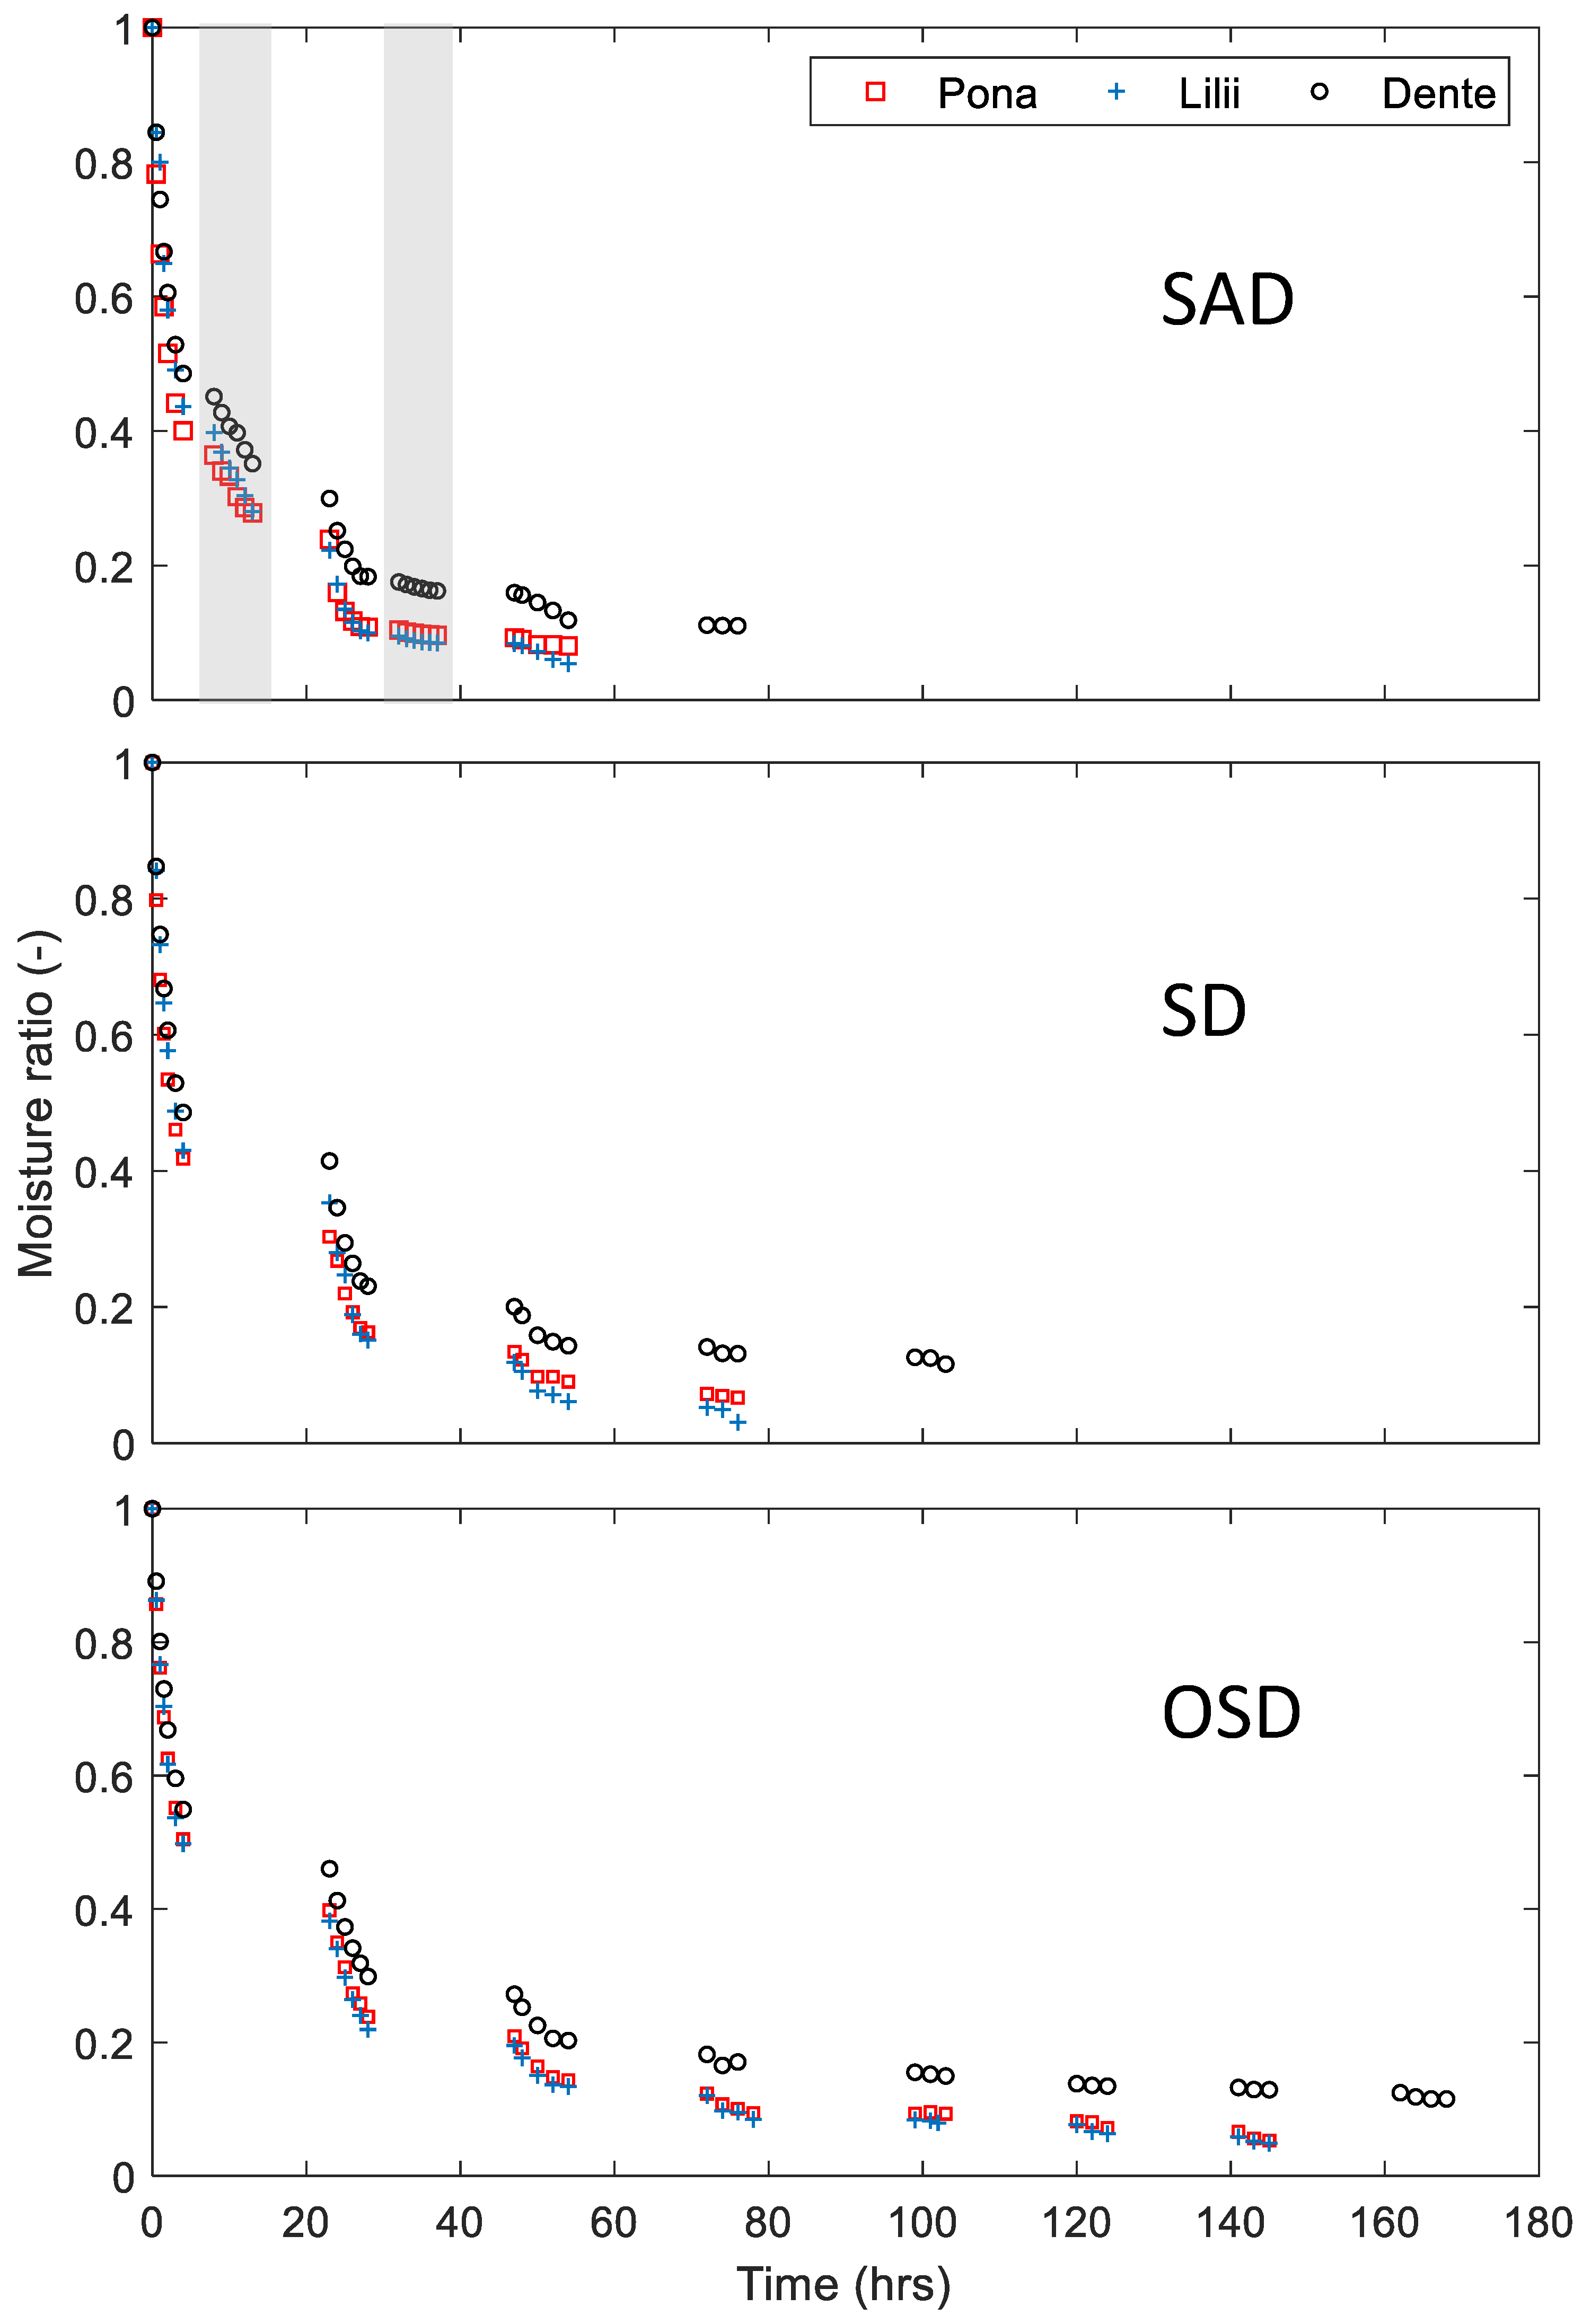
3.2. Drying Different Yam Cultivars

3.2.1. Operational Conditions

The operational conditions are shown in Figure 7. Just as in Figure 3, the input and output air temperatures increased from the morning and peaked in the afternoon and dropped toward the evening. Again, during the night drying period, the output air temperature from the dryer cabinet were below that of the input temperature due to the yam sample absorbing energy in the course of drying. The dryer input and output temperatures and ambient temperatures in this experiment were below those in the previous experiment (Figure 3). As a result of the lower radiation and temperatures, it took nine days to dry the ‘Dente’ cultivar to a storable moisture content.

3.2.2. Drying Effect on Cultivars and Composition

Figure 8 shows the drying behavior of three yam cultivars (‘Pona’, ‘Lilii’, and ‘Dente’) subjected to SAD, SD and OSD. While it took 3–4 days to dry ‘Pona’ and ‘Lilii’ to a specified moisture content, it took 7 to 9 days to dry ‘Dente’ to a moisture content below 10% (wb). ‘Lilii’ and ‘Pona’ have large granules which lead to a lower water binding affinity, whereas ‘Dente’, has smaller granules that result in higher water binding. For all varieties SAD, which involves night drying, reduced the drying cycle as compared to the SD. The OSD was less effective in terms of moisture removal and subsequently final moisture content.
By the end of the third day the moisture ratio of ‘Lilii’ was between 0.0606–0.203 for the three methods while that of ‘Dente’ was between 0.133–0.224. SAD recorded the lowest moisture ratio and the OSD recorded the highest. It took 4 days for SD to bring the moisture ratio of ‘Lilii’ to or below 0.06 while SAD needed three days. SAD had, thus, the shortest drying cycle compared to the other drying methods. Meanwhile, final moisture ratios of 0.111, 0.116, and 0.119 were reached after 4, 5, and 9 days using SAD, SD, and OSD respectively in drying ‘Dente’. These different drying times are only partly as a consequence of the difference in initial moisture content, but mainly due to the differences in the food matrix. It is possible that ‘Lilii’ and ‘Pona’ may have large granules that lead to lower water binding affinity, whereas the converse holds for ‘Dente’.
Table 2 shows the composition of fresh and dried yam per dry weight basis. The moisture content of fresh yam ranged between 1.55 to 2.06 kg/kg dry matter with ‘Pona’ recording the least and ‘Dente’ recording the highest. The final moisture content values of the samples using various drying methods range between 0.05 to 0.09 kg/kg dry matter. The differences between the cultivars are reflected in the granules of the dried powder. The granules of ’Pona’ are triangular, oval and irregular, those of ’Lilii’ oval, elliptical and rounded while ’Dente’ had predominantly cylindrical, oval and elliptical or triangular granule shapes. These shapes regimes have effect on the extent of water removal from the sample.
Table 2 shows that, generally, the drying methods do not affect the proximate composition of samples but rather the final moisture content as mentioned by Hsu et al. [15]. Though generally there is marginal increase in fiber and decrease in protein composition between fresh and dried samples, there is no obvious trend in variability among the values of cultivars. Effect of drying on protein is as a result of decrease in its digestibility and biological value as mentioned by Karel [28]. Heating does not generally affect total dietary fiber content [29], however, it causes the increase of the insoluble dietary fiber content as a result of complexing of its components with protein and amino acids [30].

3.3. Vitamin C and Color of Dried Yam

Vitamin C content, expressed in mg/g dry matter, of the fresh and dried samples is presented in Table 3. All drying methods significantly affected the vitamin C content with the highest effect by OSD due to the direct exposure of the food to the sun. Similar to the previous experiment vitamin C loss for SAD is a bit higher than that for SD due to the additional drying of samples at night. Moreover, the vitamin C content of ‘Dente’ is about half to that of the previous experiment as a result of more drying days. Thus, extra drying days, further degrades vitamin C. It is also clear that the loss in vitamin C after drying varies for the different cultivars. The loss in vitamin C content after drying is in line with what has been reported by Hassan et al. [14] who mentioned that drying methods greatly affect micronutrients, as corroborated by Jin et al. [31]. Hodali and Bougard [32] reported improved quality and a more economical process as a result of reduced time of drying of the apricot by using a solar adsorbent integrated system.
The measured L* values for fresh yam ranged between 81.83 and 83.68. The L* values (whiteness) for the dried samples decreased and ranged between 52.14 and 78.41 (see Table 4). The change in color is attributed to enzymatic browning [14] as a result of differences in phenolic compounds, which are associated with oxidative browning of yam. SD and SAD dried samples are close in the L* value, but despite the night drying periods the average values of the SAD dried samples show a lower change of whiteness than those for the SD dried samples. This makes the SAD system superior in terms of maintaining the white color of dried samples. The a* values show a slight change due to drying, while the b* values move toward less yellowness.
The total color difference ( Δ E ) is an indication of the variation of color of fresh and the dried yam samples. The variation in the total colour difference for all drying methods of cultivars were significant (p > 0.05). The total color difference for all SAD dried samples were lower compared to OSD samples. For ‘Pona’ the SD samples had lower values which was largely contributed by the a* value, and for ‘Dente’ the color differences are comparable.

4. Conclusions

This work sought to quantify the yam drying performance in a solar adsorption dryer (SAD) compared to a solar dryer (SD) and open sun drying (OSD) and to validate the effect on vitamin C and composition retention in these three systems. The dryer performance, vitamin C retention, and product color of different cultivars were investigated.
The SAD drying works the best in the initial period of drying. In this period, the night contributes to drying and reduces the total drying cycle in terms of days due to the application of night drying. At the end of drying, the benefit of night drying is minor due to the low driving force for water transfer. At this stage, dehumidification of the air hardly helps the drying at night. In this period, an elevated temperature is more effective. The drying time in the SAD is affected by seasonal variations and weather conditions.
For three cultivars, ‘Lilii’ dried faster than ‘Pona’ and ‘Dente’ with ‘Dente’ drying slowest, which results in differences in granule shape and sizes of these cultivars. The changes in color are for two cultivars of yam comparable for SAD and SD drying and for the third cultivar the SAD dried product was closer to the original whitish color than with SD drying. Long exposure of yam to drying conditions had more influence on the deterioration of vitamin C, but did not affect the composition. The deterioration of vitamin C is the strongest for OSD, and is close for SD and SAD drying with a preference for SD.

Author Contributions

Conceptualization, E.A. and A.v.B.; methodology, E.A. and A.v.B.; software, G.K.and Herbert Kyeremeteng; validation, G.K. and H.K.; formal analysis, E.A; investigation, G.K. and H.K.; resources, E.A; data E.A. and A.v.B.; writing—original draft preparation, E.A; writing—review and editing, A.v.B.; visualization, E.A.; supervision, A.v.B.; project administration, E.A.; funding acquisition, E.A. and A.v.B.

Funding

The APC was funded by Wageningen University Research and experimental support from Kwame Nkrumah University of Science and Technology, Ghana.

Acknowledgments

We acknowledge the Wageningen University and Research, The Netherlands and The University of Science and Technology, Kumasi, Ghana for their financial support of this work.

Conflicts of Interest

The authors declare no conflict of interest.

References

  1. International Institute of Tropical Agriculture. Operation Manual for the Series 3 Root Tubers Processing; Newport Scientific property Ltd.: Warriewood, Australia; Standard University Press: Stanford, CA, USA, 2007; p. 315. [Google Scholar]
  2. Ferede, R.; Maziya-Dixon, B.; Alamu, E.O.; Asiedu, R. Identification and quantification of major carotenoids of deep yellow flagled yam (tropical Dioscorea dumentorum). J. Food Agric. Environ. 2010, 13, 703–706. [Google Scholar]
  3. Fioreze, R.; Morini, B. Yam (Dioscorea sp.) Drying with different cuts andtemperatures: experimental and simulated results. Ciênc. Tecnol. Aliment. 2000, 20, 262–266. [Google Scholar] [CrossRef]
  4. Xiao, H.W.; Pang, C.L.; Wang, L.H.; Bai, J.W.; Yang, W.X.; Gao, Z.J. Drying kinetics and quality of monkka seedless grapes dried in an air impingement jet dryer. Biosyst. Eng. 2010, 105, 233–240. [Google Scholar] [CrossRef]
  5. Berinyuy, J.E.; Tangka, J.K.; Fotso, G.M. Enhancing natural convection solar drying of high moisture vegetables with heat storage. Agric. Eng. Int. CIGR J. 2012, 14, 141–148. [Google Scholar]
  6. Arinze, E.A.; Adefila, S.S.; Eke, B.A. Experimental evaluation of various designs of free-convection solar crop dryer with and without thermal storage. In Proceedings of the National Conference of Nigerian Society of Agricultural Engineers, Makurdi, Nigeria, 30–31 October 1990; pp. 15–19. [Google Scholar]
  7. Basuinia, M.A.; Abe, T. Design and construction of simple three shelf solar rough rice dryer. J. Agric. Mech. Asia Afr. Lat. Am. 2001, 32, 54–55. [Google Scholar]
  8. El-Beltagy, A.; Gamea, G.R.; Essa, A.H.A. Solar drying characteristics of strawberry. J. Food Eng. 2007, 78, 456–464. [Google Scholar] [CrossRef]
  9. Erenturk, S.; Gulaboglu, M.S.; Gultekin, S. The effects of cutting and drying medium on the vitamin C content of rosehip during drying. J. Food Eng. 2005, 68, 513–518. [Google Scholar] [CrossRef]
  10. Davey, M.W.; Montagu, M.; Inze, D.; Sanmartin, M.; Benzie, J.J. Plant L-ascorbic acid: Chemistry, function, metabolism, bioavailability and effects of processing. J. Sci. Food Agric. 2000, 80, 825–860. [Google Scholar] [CrossRef]
  11. Skrede, G.; Wrolstad, R.E.; Durst, R.W. Changes in Anthocyanins and Polyphenolics during juice processing of highbush blueberries (Vaccinium corymbosum L.). J. Food Sci. Sens. Nutr. Qual. Food 2000, 65, 357–364. [Google Scholar] [CrossRef]
  12. Giovanelli, G.; Buratti, S. Comparison of polyphenolic composition and antioxidant activity of wild Italian blueberries and some cultivated varieties. Food Chem. 2009, 112, 903–908. [Google Scholar] [CrossRef]
  13. Vega-Gálvez, A.; Lemus-Mondaca, R.; Tello-Ireland, C.; Miranda, M.; Yagnam, F. Kinetic study of convective drying of blueberry variety O’Neil (Vaccinium corymbosum). Chil. J. Agric. Res. 2009, 69, 171–178. [Google Scholar] [CrossRef]
  14. Santos, P.H.S.; Silva, M.A. Retention of vitamin C in drying process of fruits and Vegetables—A review. Dry. Technol. 2008, 26, 1421–1437. [Google Scholar]
  15. Hsu, C.L.; Chen, W.; Weng, Y.M.; Tseng, C.Y. Chemical composition, physical properties, and antioxidant activities of yam flours as affected by different drying methods. Food Chem. 2003, 83, 85–92. [Google Scholar] [CrossRef]
  16. Okaka, J.C.; Okaka, A.N.C. Food: Composition, Spoilage, Shelf-life Extension; OCJANKO Academic Publishers: Enugu, Nigeria, 2001. [Google Scholar]
  17. Oguntola, J.A.; Collins, N.N.; Olayinka, A. Design and construction of a domestic passive solar food dryer. Leonardo J. Sci. 2010, 16, 71–82. [Google Scholar]
  18. Hassan, S.W.; Umar, R.A.; Maishanu, H.N.; Matuza, I.K.; Faruk, U.Z.; Sani, A.A. The effect of drying method on nutrients and non-nutrients composition of leaves of Gynandropsis gynandra (Capparaceae). Asian J. Biochem. 2007, 2, 349–353. [Google Scholar]
  19. Madhlopa, A.; Jones, S.A.; Kalenga Saka, D.J. A solar air heater with composite–Absorber systems for food dehydration. Renew. Energy 2002, 27, 27–37. [Google Scholar] [CrossRef]
  20. Amankwah, E.A.Y.; Dzisi, K.A.; van Straten, G.; van Willigenburg, L.G.; van Boxtel, A.J.B. Distributed mathematical model supporting design and construction of solar collectors for drying. Dry. Technol. 2017, 35, 1675–1687. [Google Scholar] [CrossRef] [Green Version]
  21. AOAC. AOAC International Official methods of Analysis, 17th ed.; Method 985.14; AOAC: Gaithersburg, MD, USA, 1990. [Google Scholar]
  22. AACC. Approved Methods of the AACC, 10th ed.; Methods 44-17; American Association of Cereal Chemists: St. Paul, MN, USA, 2000. [Google Scholar]
  23. Ojukwu, U.P.; Nwobi, S.C. Determination of Ascorbic Acid Content of Some Local Fruits in Nigeria. Anal. Chem. Indian J. 2017, 17, 1–5. [Google Scholar]
  24. Arslan, D.; Özcan, M.M. Study the effect of sun, oven and microwave drying on quality of onion slices. LWT-Food Sci. and Technol. 2010, 43, 1121–1127. [Google Scholar] [CrossRef]
  25. Doymaz, İ. Drying kinetics, rehydration and colour characteristics of convective hot-air drying of carrot slices. Heat and Mass Transfer. 2016, 53, 25–35. [Google Scholar] [CrossRef]
  26. Dissa, A.O.; Desmoreux, H.; Bathiebo, J.; Koulidiatti, J. A comparative study of direct and indirect solar drying of mango. Glob. J. Pure Appl. Sci. 2011, 17, 273–294. [Google Scholar]
  27. Oyetade, O.A.; Oyeleke, G.O.; Adegoke, B.M.; Akintunde, A.O. Stability studies on Ascorbic acid (Vitamin C) from different sources. J. Appl. Chem. 2012, 2, 20–24. [Google Scholar]
  28. Karel, M. Control of lipid oxidation in dried food. In The Concentration and Drying of Foods; Richardson, J., Finley, J.W., Eds.; Elsevier Applied Science: Carlifornia, CA, USA, 1985; pp. 495–512. [Google Scholar]
  29. Jones, G.P.; Biggs, D.R.; Wahlqvist, M.L.; Flente, L.M.; Shiell, B.J. Dietary fibre content of Australian foods, Fruits and fruits products. Food Aust. 1990, 42, 143–145. [Google Scholar]
  30. Matalas, A.L.; Zampelas, A.; Stavrinos, J. The Mediterranean Diet; CRC Press ICC: Boca Raton, FL, USA, 2001. [Google Scholar]
  31. Jin, X.; van der Sman, R.G.M.; van Boxtel, A.J.B. Evaluation of the Free Volume Theory to predict moisture transport and quality changes during broccoli drying. Dry. Technol. 2011, 29, 1963–1971. [Google Scholar] [CrossRef]
  32. Hodali, R.; Bougard, J. Integration of a desiccant unit in crops solar drying installation: Optimization by numerical simulation. Energy Convers. Manag. 2001, 42, 1543–1558. [Google Scholar] [CrossRef]
Figure 1. Solar-adsorbent dryer (SAD). 1→2→3: air flow during drying, 4→5→3: air flow during night drying, 6→7→8: air flow for regeneration during day-time.
Applsci 09 03927 g001
Figure 2. Solar-adsorbent dryer system (SADS) showing locations of K-type thermocouple for the temperature measurement (T1-T8) at input and output of each unit.
Applsci 09 03927 g002
Figure 3. Drier cabinet input and output air temperatures T4 and T5 (night), T2 and T3 (day) for SAD (top graph), T2 and T3 (day) for SD (middle graph) and ambient temperature T1 for OSD (See Figure 2) and radiation (bottom graph). The grey portions represent the night drying.
Applsci 09 03927 g003
Figure 4. Average moisture content over all trays of yam particles (‘Dente’) for different drying methods, SAD, SD and OSD. The grey portions represent night drying.
Applsci 09 03927 g004
Figure 5. Moisture content of yam particles (‘Dente’) at different positions in the dryers as a function of time for SAD, SD and OSD. The grey portions represent night drying.
Applsci 09 03927 g005
Figure 6. Effect of different drying methods on vitamin C retention in Dioscorea rotundata. Those bars with the same letters are not significantly different at p < 0.05.
Applsci 09 03927 g006
Figure 7. Drier cabinet input and output air temperatures T4 and T5 (night), T2 and T3 (day) for SAD (top graph), T2 and T3 (day) for SD (middle graph) and ambient temperature T1 for OSD (See Figure 2) and radiation (bottom graph). The grey portions represent the night drying.
Applsci 09 03927 g007
Figure 8. Comparison of drying methods on different varieties of yam. The grey portions represent night drying.
Applsci 09 03927 g008
Table 1. Major characteristics of experiments.
Objective of ExperimentStartDurationChemical AnalysisSensors/ProbeNo. of Cultivars
Performance of SADNight3–5 daysVitamin C in fresh and dried productK-type thermocouple1
Night 6 h
Day 9 h
Drying different yam cultivarsMorning4–9 daysVitamin C in fresh and dried product CompositionK-type thermocouple3
Table 2. Composition (kg/kg dry matter) of the three cultivars (fresh and dried) at different drying methods.
Method/CultivarMoistureAshCrude ProteinCrude FiberCrude FatCarbohydrate
‘Pona’
Fresh1.549 a0.020 b0.053 a0.010 b0.003 c0.915 a
SAD0.055 c0.038 a0.040 c0.011 a0.007 a0.906 b
SD0.054 c0.037 a0.041 c0.011 a0.007 a0.897 b
OSD0.075 b0.038 a0.046 b0.011 a0.006 b0.895 b
‘Lilii’
Fresh1.872 a0.027 b0.042 a0.013 b0.002 b0.863 a
SAD0.061 b0.036 a0.034 b0.027 a0.006 a0.882 a
SD0.062 b0.038 a0.036 b0.027 a0.006 a0.885 a
OSD0.073 c0.039 a0.041 a0.027 a0.006 a0.891 a
‘Dente’
Fresh2.063 a0.020 b0.043 a0.011 b0.002 b0.856 b
SAD0.054 c0.030 a0.042 b0.022 a0.006 a0.901 b
SD0.055 c0.032 a0.042 b0.022 a0.005 a0.906 b
OSD0.078 b0.032 a0.041 b0.023 a0.006 a0.926 a
The values with the same superscripts in the same column for each cultivar are not significantly different at p < 0.05.
Table 3. Vitamin C content (mg/g dry matter) of fresh and dried cultivars of yam at different drying methods.
Drying MethodVitamin C
‘Pona’
Fresh44.35 a
SAD6.83 b
SD7.06 b
OSD2.37 c
‘Lilii’
Fresh26.71 a
SAD4.77 b
SD4.99 b
OSD1.53 c
‘Dente’
Fresh60.76 a
SAD6.85 c
SD7.77 b
OSD2.32 d
The values with the same superscripts for each cultivar are not significantly different at p < 0.05.
Table 4. Color measurement results for both fresh and dried yam of different varieties.
METHOD/SAMPLEL*a*b*∆E
‘Pona’
Fresh81.83 a−0.34 b+14.36 a
SAD76.87 c−0.49 a+7.55 c8.81 b
SD78.41 b−0.22 c+8.38 b7.30 c
OSD65.79 d−0.06 d+7.83 c17.50 a
‘Lilii’
Fresh83.69 a−1.28 a+14.34 a
SAD76.01 b−0.26 c+5.75 c11.57 c
SD73.30 c−0.33 b+4.92 d14.06 b
OSD62.67 d−0.35 b+7.58 b22.10 a
‘Dente’
Fresh83.68 a−1.30 a+14.98 a
SAD76.22 b−0.08 d+6.08 d11.68 b
SD75.32 b−0.14 c+6.80 c11.75 b
OSD62.49 c−0.74 b+7.79 b22.38 a
The values with the same superscripts in the same column for each cultivar are not significantly different at p < 0.05.

