Article

Feasibility of the Detection of Carrageenan Adulteration in Chicken Meat Using Visible/Near-Infrared (Vis/NIR) Hyperspectral Imaging

1
Beijing Key Laboratory of Optimized Design for Modern Agricultural Equipment, College of Engineering, China Agricultural University, Beijing 100083, China
2
College of Mechanical and Electronic Engineering, Nanjing Forestry University, Nanjing 210037, China
*
Author to whom correspondence should be addressed.
Appl. Sci. 2019, 9(18), 3926; https://doi.org/10.3390/app9183926
Submission received: 18 August 2019 / Revised: 10 September 2019 / Accepted: 12 September 2019 / Published: 19 September 2019
(This article belongs to the Special Issue Applications of Hyperspectral Imaging for Food and Agriculture II)

Abstract

:
The detection of carrageenan adulteration in chicken meat using a hyperspectral imaging (HSI) technique associated with three spectroscopic transforms was investigated. Minced chicken was adulterated with carrageenan solution (2% w/v) in the volume range of 0–5 mL at an increment of 1 mL. Hyperspectral images of prepared samples were captured in a reflectance mode in a Visible/Near-Infrared (Vis/NIR, 400–1000 nm) region. The reflectance (R) spectra were first extracted from regions of interest (ROIs) by applying a mask that was built using band math combined with thresholding and were then transformed into two other spectral units, absorbance (A) and Kubelka-Munck (KM). Partial least squares regression (PLSR) models based on full raw and preprocessed spectra in the three profiles were established and A spectra were found to perform best with Rp2 = 0.92, root mean square error of prediction set (RMSEP) = 0.48, and residual predictive deviation (RPD) = 6.18. To simplify the models, several wavelengths were selected using regression coefficients (RC) based on all three spectral units, and 10 wavelengths selected from A spectra (409, 425, 444, 521, 582, 621, 763, 840, 893, and 939 nm) still performed best with the Rp2, RMSEP, and RPD of 0.85, 0.93, and 3.20, respectively. Thus, the preferred simplified RC-A-PLSR model was selected and transferred into each pixel to obtain the distribution maps and finally, the general different adulteration levels of different samples were readily discernible. The overall results ascertained that the HSI technique demonstrated to be an effective tool for detecting and visualizing carrageenan adulteration in authentic chicken meat, especially in the absorbance mode.

1. Introduction

Meat and meat products are high-quality sources of essential amino acids, protein, and many other nutritional compounds in human diets [1]. However, meat is susceptible to suffering adulteration, and incidences of commercial meat adulteration like mislabeling, undeclared ingredient additions, and species substitution are common [2]. Nowadays, consumers are paying more and more attention to meat authenticity and demanding higher protection from fraudulent meats. Therefore, rapid, reliable, and effective identification methods are urgently needed in the meat industry to provide efficient management for regulators and accurate information for consumers.
Compared to red meat, chicken meat is always considered as one of the most popular foods globally due to its affordability, low fat, and high protein content [3]. Poultry consumption has increased steadily in the last decade [4]. To date, several adulteration phenomena related to chicken meat have increased in China, such as water-injected or gel-injected chicken [5]. In particular, the injection of gel (carrageenan is most commonly used) is used to cover up water that is injected, which can help to hold more water and gain more weight to make profits. In addition, some unscrupulous chicken steak wholesalers used restructured meat by splicing minced chicken scraps together with hydrocolloids including carrageenan instead of intact chicken meat [6]. These arbitrary behaviors on one hand violate the interests and rights of consumers and on the other hand seriously increase their health risks, although the addition of carrageenan within permissible limits can improve the textural and rheological characteristics that are related to consumers’ sensory acceptance [7]. At present, there is still no particular method to discover injected carrageenan except by the naked eyes, however this transparent material is difficult to distinguish visually. Minced meat, which is one of the most versatile products, is a major ingredient in hamburgers, meatballs, patties, etc. Moreover, it removes the morphological characteristics of muscles, which makes it more difficult to identify adulteration by sight. Thus, the detection of adulterants has always been a challenge in the poultry industry, especially the identification of carrageenan adulteration in minced chicken meat.
Near-infrared (NIR) spectroscopy, as a rapid, non-destructive, and efficient tool for spectrochemical analysis, has been recognized as effective in meat adulteration detection [8,9,10]. However, spectroscopic assessments, with their relatively small point-source measurements, are not fully representative of the whole specimen, which may cause measuring error. In addition, spatial information of the adulteration cannot be provided by this conventional spectroscopic method. Recently, hyperspectral imaging (HSI), through integrating spectroscopic and computer vision techniques into one system to simultaneously capture spectral and spatial information of the tested object, has been widely used in detecting food quality and safety [11]. Different from titration, the colorimetric method, or chromatographic analyses, HSI overcomes disadvantages such as being tedious, time-consuming, and having destructive processes. In particular, HSI with chemometrics is nowadays gaining in importance for detecting meat adulteration, and some works have been successfully conducted including pork adulteration in lamb [12], horsemeat in beef [13,14], pork in beef [15,16], chicken in beef [17], and gelatin in prawn [18]. However, specifically, the utilization of HSI for estimating carrageenan adulteration in chicken meat is scarce. It was also noted that the majority of studies only used reflectance (R) spectra as inputs, however, absorbance (A) and Kubelka-Munck (KM) spectra are also effective as candidate spectral units in evaluating meat quality using HSI [17,19,20]. To improve the precision for detecting adulteration, comparing the performance of R, A, and KM spectra is also desirable.
The objective is to investigate the feasibility of HSI for detecting carrageenan adulteration in minced chicken meat. Specifically, the aims are to (1) acquire hyperspectral images of adulterated samples in different adulteration levels in the spectral range of 400–1000 nm; (2) extract spectral data from isolated regions of interest (ROIs), and transform R data into A and KM spectra; (3) build quantitative models between different adulteration levels and the R, A, and KM spectra, respectively, by using the partial least squares regression (PLSR) algorithm; (4) select key wavelengths related to adulteration by regression coefficients (RC) and then build the multispectral PLSR model for adulteration identification based on the spectral data at those selected wavelengths; (5) compare the three spectral units, i.e. R, A, and KM, to find out the optimal spectral unit to be employed, and (6) apply the preferred multispectral model to each pixel in the hyperspectral images and generate the visual distribution maps to indicate the adulteration levels.

2. Materials and Methods

2.1. Sample Preparation

Broiler breast fillets were purchased at a local supermarket in Beijing, China. In addition, K-carrageenan powder, which was most commonly used in meat products, was collected from Runying food additive company in Hebei province, China. The chemical structure of K-carrageenan is illustrated in Figure 1. Fillets were first cut into small pieces and ground using a meat-mincing machine (QSJ-Bo3H2, Guangdong Bear Electric Co. Ltd., Foshan, China) for 30 s. Samples were weighed individually with a total weight of 40 g and placed into round Petri dishes (90 mm in diameter × 14 mm deep). Carrageenan powder was well dissolved in hot water (about 80 °C) and the solution concentration was prepared with 2% (w/v). A syringe with a volume scale was used to adulterate the solution into minced meat at different levels of 1, 2, 3, 4, and 5 mL, respectively. After that, the samples were mixed well to gain an approximately homogenous sample with a flat surface. Then, 24 adulterated samples at each adulteration level were prepared and pure chicken (0 mL) samples were also prepared. As a result, a total of 144 tested samples were prepared, among which 96 samples (6 levels × 16 samples per level) were for the calibration set while the residual 48 samples were for the prediction set (6 levels × 8 samples per level). Prior to the image acquisition, all the samples were rested at room temperature (about 25 °C) for 10 minutes to completely solidify the solution in the meat.

2.2. Hyperspectral Images Acquisition and Calibration

The samples were scanned by a Vis/NIR HSI system with a wavelength ranging from 380 nm to 1012 nm. The system was mainly composed of a spectrometer (G Series Image-λ-V10-IM, Spectral Imaging Ltd., Oulu, Finland), a CCD detector (Bobcat 2.0, Imperx Ltd, FL, USA), a variable-focal-length lens (Schneider, XENOPLAN, Bad Kreuznach, Germany), a translation stage (WN500TA1000H, Beijing, China), a pair of 50 W Tungsten-Halogen lamps (Photoflex, Watsonville, CA, USA), and a computer to control the camera for acquiring images. Detailed parameters and its settings can be found in previous literature of Jiang et al. [21]. In this work, low signal-to-noise sub-images of the two ends were excluded and only the images in the wavelength ranging from 400 to 1000 nm (285 wavebands) were retained for the following data analysis. For a detailed explanation of the system correction and image acquisition, please refer to Wang et al. [22].

2.3. Image Processing and Spectral Data Extraction

On the basis of the calibrated images, due to the distinctive spectral difference between the meat sample and background, the meat portion can be easily separated from the background. In this work, the entire meat portion was isolated by subtracting the image at a wavelength of 405 nm (low reflectance value) from that at a wavelength of 700 nm (high reflectance value), followed by setting a constant value of 0.25 as the threshold. With these procedures, a mask that excluded the background and the edge of the Petri dishes to avoid any undesired spectral information was produced. From the mask, ROI was identified and average reflectance spectrum was extracted by calculating the mean spectral data of all the pixels within the ROI. These treatments were repeated in all the images to obtain the spectrum representing each sample. The ENVI software (ENVI 5.1, Research Systems Inc., Solutions, Boulder, CO, USA, 2014) was adopted to carry out the image preprocessing and spectra extraction. The reflectance spectra were transformed into A and KM units according to Equations (1) and (2), respectively.
A = log (1/R)
KM = (1−R2)/2R
where R is the reflectance spectra, A is the absorbance spectra, and KM is the Kubelka-Munck spectra.

2.4. Establishment and Evaluation of the Models

2.4.1. Data Preprocessing and Models Development

Prior to the modeling process, several correction preprocessing methods as well as their combinations were separately used in order to remove or reduce physical biases such as scattering effects in the spectra. The methods of standard normal variate (SNV), multiplicative scatter correction (MSC), detrend, and the first and second order derivatives (Der1 and Der2) were included in our study. For detailed information about the effect and parameter settings of the different preprocessing methods, please refer to Jiang et al. [21]. Performances of all the developed models based on spectra with or without (raw) preprocessing were compared. For further evaluation, only the optimal preprocessing technique was retained. Aforementioned spectral pretreatments were all performed using Unscrambler software (X10.1, CAMO, Trondheim, Norway).
PLSR is a linear and supervised chemometric algorithm for constructing models in spectral analysis [23]. In this study, the PLSR was adopted to establish the quantitative models between adulteration levels and the extracted spectra of the prepared samples. A leave-one-out cross-validation (LOOCV) approach was also used to minimize the risk of over-fitting. Cross-validation calculates the predictive ability of potential models to optimize the number of latent variables (LVs) in PLSR models. The models’ development was all conducted with the help of Matlab software (R2013b, The MathWorks Inc., Massachusetts, USA). Accordingly, three spectral calibration sets with different units, i.e., R, A, and KM, were separately used to establish PLSR models. The established models were indicated as R-PLSR, A-PLSR, and KM-PLSR, respectively.

2.4.2. Principal Component Analysis

Principal component analysis (PCA) is usually implemented as a dimensional reduction technique and is an efficient means to easily interpret differences among data points [24]. Scores of the selected principal components (PCs) could be used to create score plots to demonstrate relationships among data points. Data points of the same type of samples would tightly cluster and thus could be separated from others. In this study, based on the optimal spectral unit, a preliminary PCA was carried out to visually examine the distribution of the tested samples with different carrageenan adulteration levels in PC space. The aim was to present the effectiveness of spectra in detecting adulteration levels in minced chicken meat.

2.4.3. Optimal Wavelengths Selection

To remove irrelevant information or noise for adulteration detection, the selection of important wavelengths carrying the most useful information was recommended. The regression coefficients (RC), i.e., the β-coefficients of the optimal PLSR models, were considered as possible feature-related or important wavelengths for the respective component [25]. Coefficients with the highest absolute values are deemed to be key wavelengths for adulteration. Thus, RC was further utilized to select representative wavelengths in carrageenan adulteration levels determination in our study. With the limited key wavelengths, the PLSR models established using full wavelengths were simplified. All the wavelengths selection steps were executed in Matlab software (R2013b, The Mathworks Inc., Natick, MA, USA).

2.4.4. Modeling Performance Evaluation

To evaluate the performance of the developed models, several effective parameters including the coefficient of determination (Rc2, Rcv2, and Rp2 for calibration, cross-validation, and prediction set, respectively), and root mean squared error for calibration, cross-validation and prediction set (RMSEC, RMSECV, and RMSEP) were calculated. In particular, to calculate the practical utility of the prediction models, ratio of the standard deviation (SD) to RMSEP, i.e. residual predictive deviation (RPD), was also employed. If the value of RPD was lower than 1.5, the developed model was unacceptable [26]. On the contrary, a high RPD value (larger than 3) indicated that the model was good or excellent. According to the literature of Kapper et al. [27], models that achieved the performance of R2 ≥ 0.70 and RPD ≥ 2.00 would be treated as valid in determining meat quality.

2.5. Visualization of Adulteration Levels

As is known, the distribution of carrageenan solution adulterated in chicken meat cannot be completely even and may vary not only from sample to sample, but also from pixel to pixel within one identical sample. Visualization technology is an inherent and progressive advantage of the HSI technique, which can intuitively help to show the differences in carrageenan adulteration levels of different samples. In the present study, the preferred simplified PLSR model based on the optimal spectral unit was used to be transferred into each pixel of the hyperspectral images. After that, each pixel had its own predicted value of adulteration levels, and different values of pixels would display in different colors to achieve the final distribution map. Therefore, the spatially distributed visualization of the carrageenan adulteration was achieved with a linear color scale exhibiting the overall adulteration level within the sample. In this work, distribution maps formed steps were realized by a homemade procedure using the Matlab software.

3. Results and Discussion

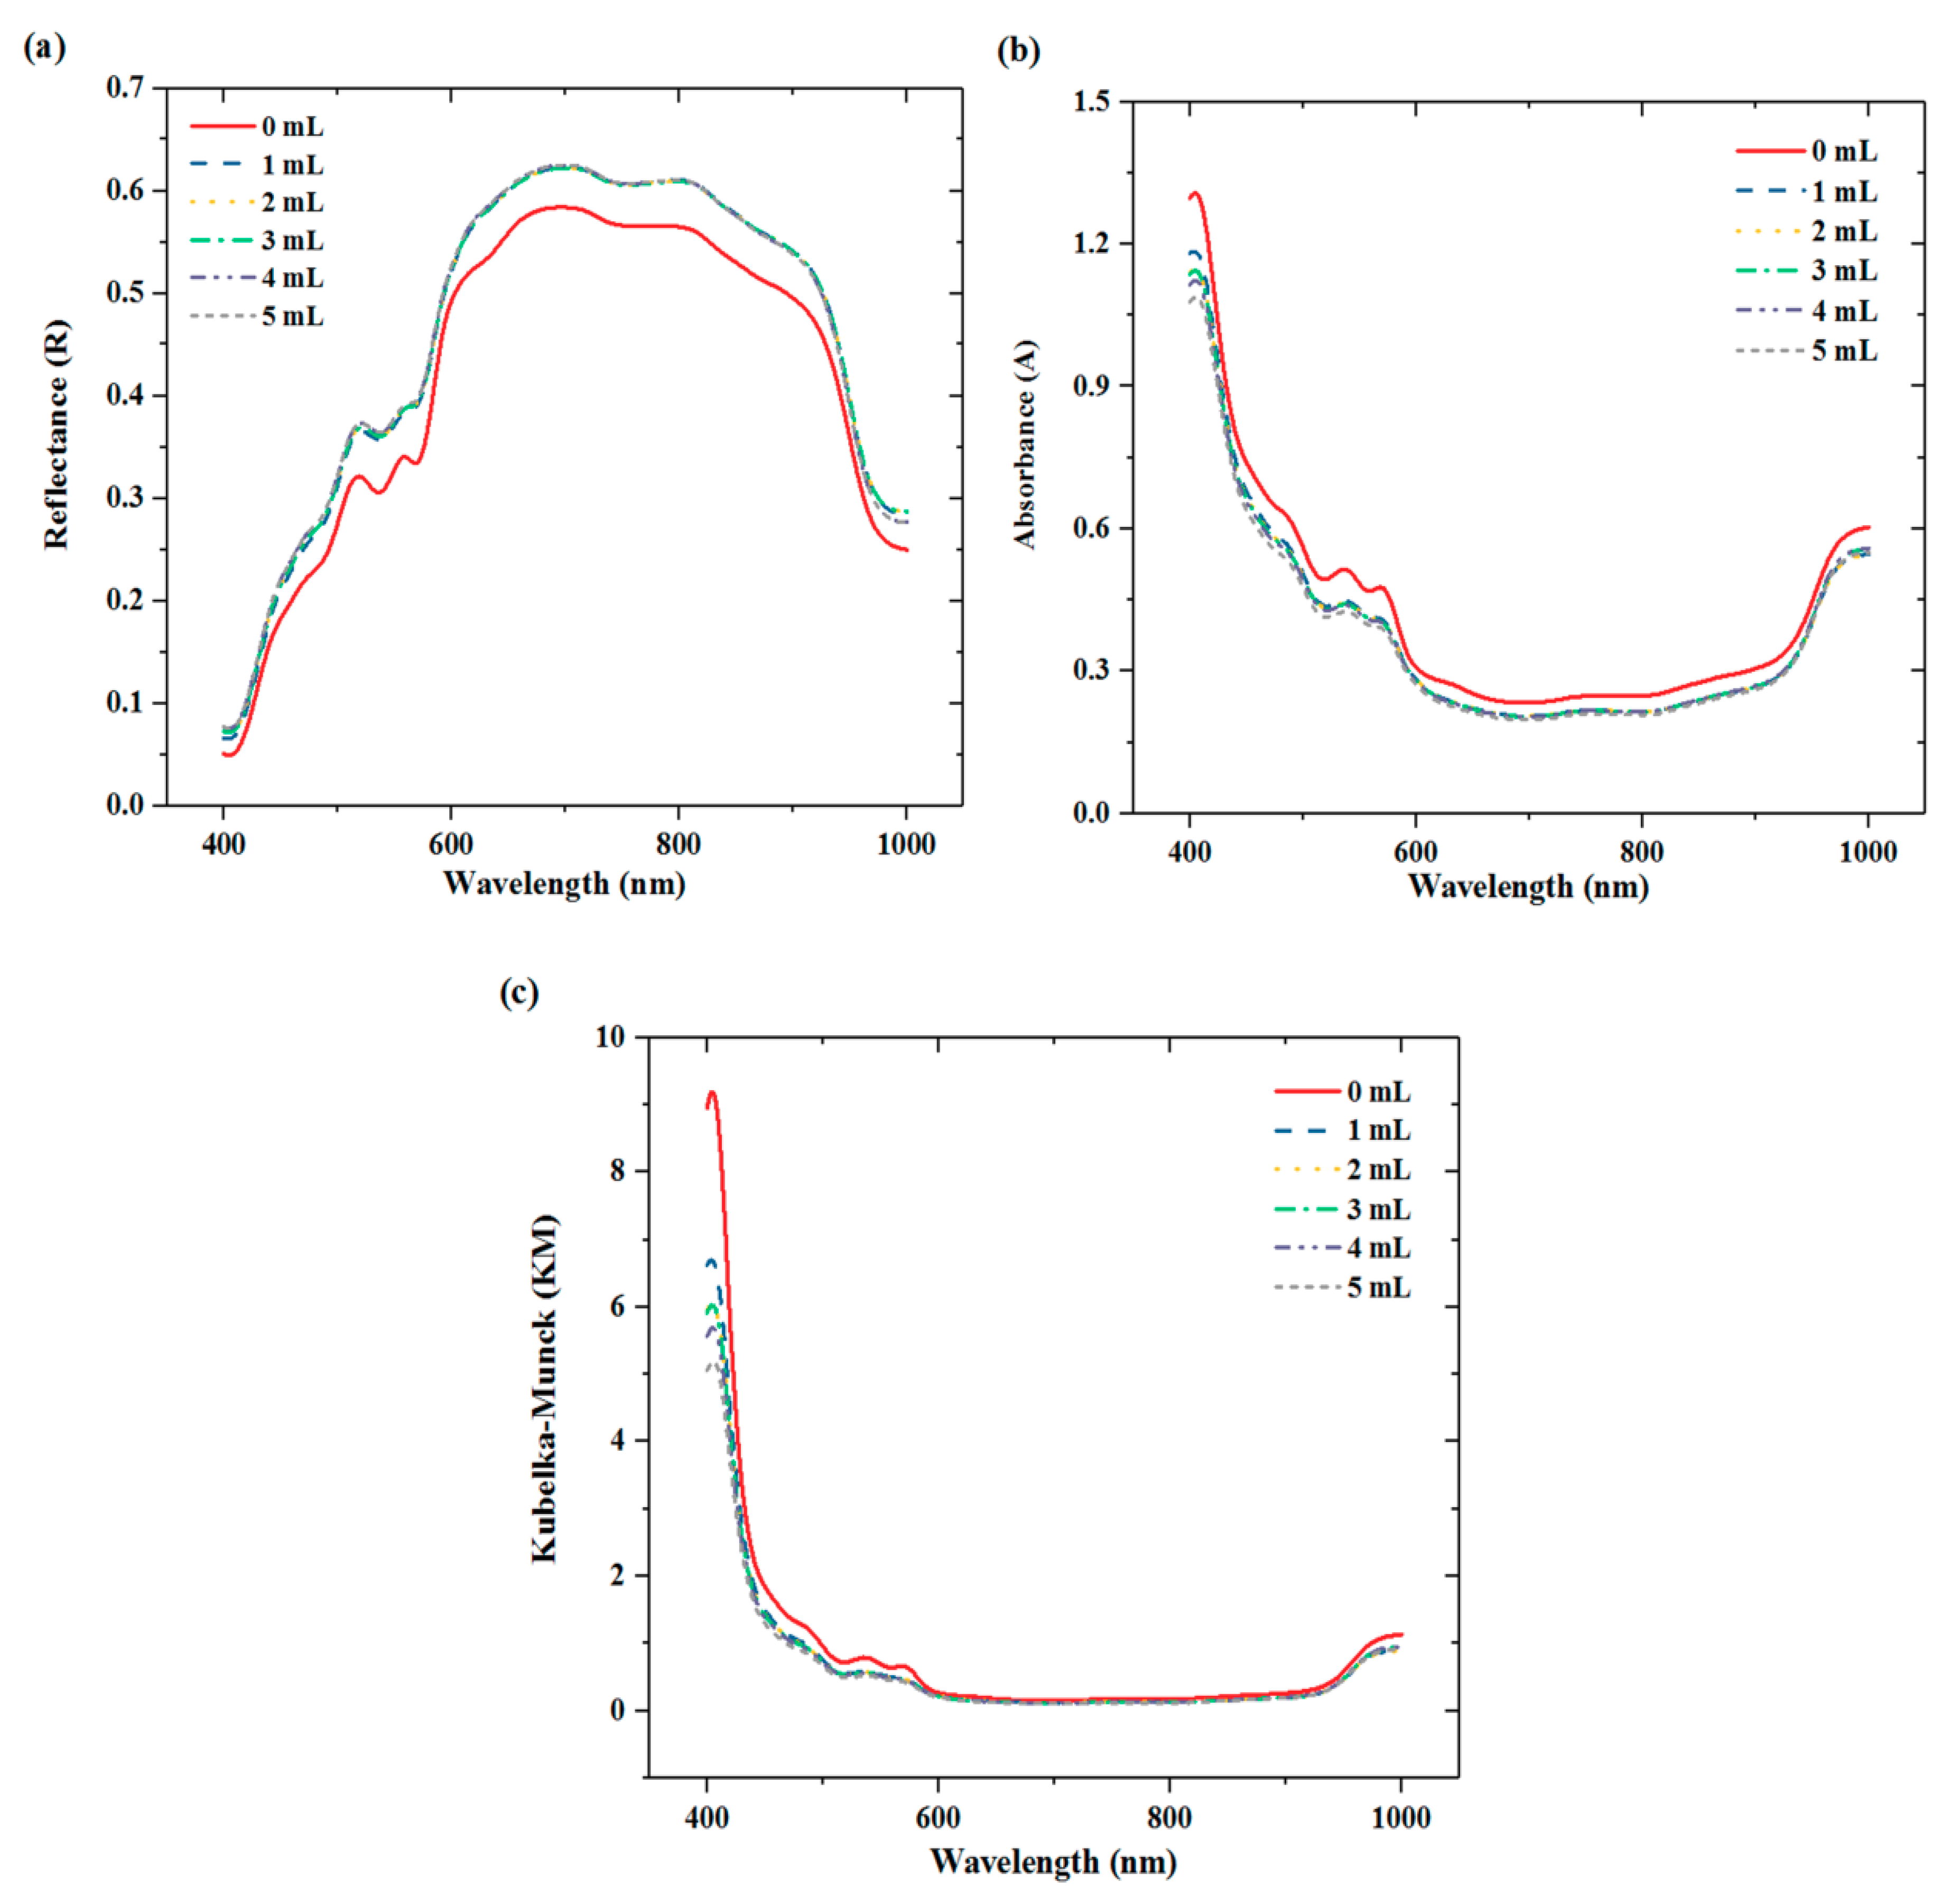
3.1. Spectral Features

The average R, A, and KM spectra of prepared samples with different adulteration levels (0–5 mL carrageenan solution) are displayed in Figure 2. Obviously, the spectral curves suggest a similar pattern, but slightly differed in values of intensity. In the visible spectral region (400–700 nm), curves showed a relatively low reflectance (i.e. high absorbance) in the green and blue regions (about 400–550 nm) and high reflectance in the yellow (about 550–600 nm) and red regions (about 600–700 nm). The above-mentioned regions could help to clarify the reason why adulterated chicken meat samples got their orange color. As can be seen in Figure 2a, there are four downwards peaks (absorbance bands) centered at 545 nm, 570 nm, 760 nm, and 980 nm. The bands at 545 nm and 570 nm can be attributed to the presence of deoxymyoglobin and oxymyoglobin, respectively [28]. These myoglobin contents are responsible for the meat’s color. The wavelengths of 980 nm and 760 nm were closely related to the second and third overtone of the O-H stretching mode of water presence in muscles [29,30]. However, no prominent peak of carrageenan can be observed among the different levels. Therefore, chemometrics would need to be further applied for mining hidden spectral differences to predict and visualize carrageenan adulteration levels in chicken meat. Similarly, the average spectral forms of A and KM spectra transformed from R spectra, respectively, are also shown in Figure 2b,c for comparison.

3.2. PLSR Models Based on Full Spectra

Three types of PLSR models were developed on the basis of full R, A, and KM spectra, respectively. A summary of the performance of 18 models established based on raw and preprocessed spectra is tabulated in Table 1. As shown, all the full-wavelength models gave acceptable performance in predicting adulteration levels of carrageenan in chicken meat. The R2 and RPD of all the models were beyond 0.86 and 4.26, respectively. However, regardless of preprocessing methods, it can be observed that A-PLSR generally performed best among the three with the highest R2 and RPD as well as the lowest RMSE. The R-PLSR and KM-PLSR models showed generally close performance to each other. The overall results indicated that full A spectra were the most suitable spectra in predicting carrageenan adulteration in chicken meat among the three used spectral units. As for different preprocessing methods, the best results were obtained when spectra were preprocessed with the Der1, SNV, and none for R, A, and KM spectra, respectively. Therefore, only the optimal preprocessed spectra were adopted for spectral inputs and are discussed in the subsequent analysis.

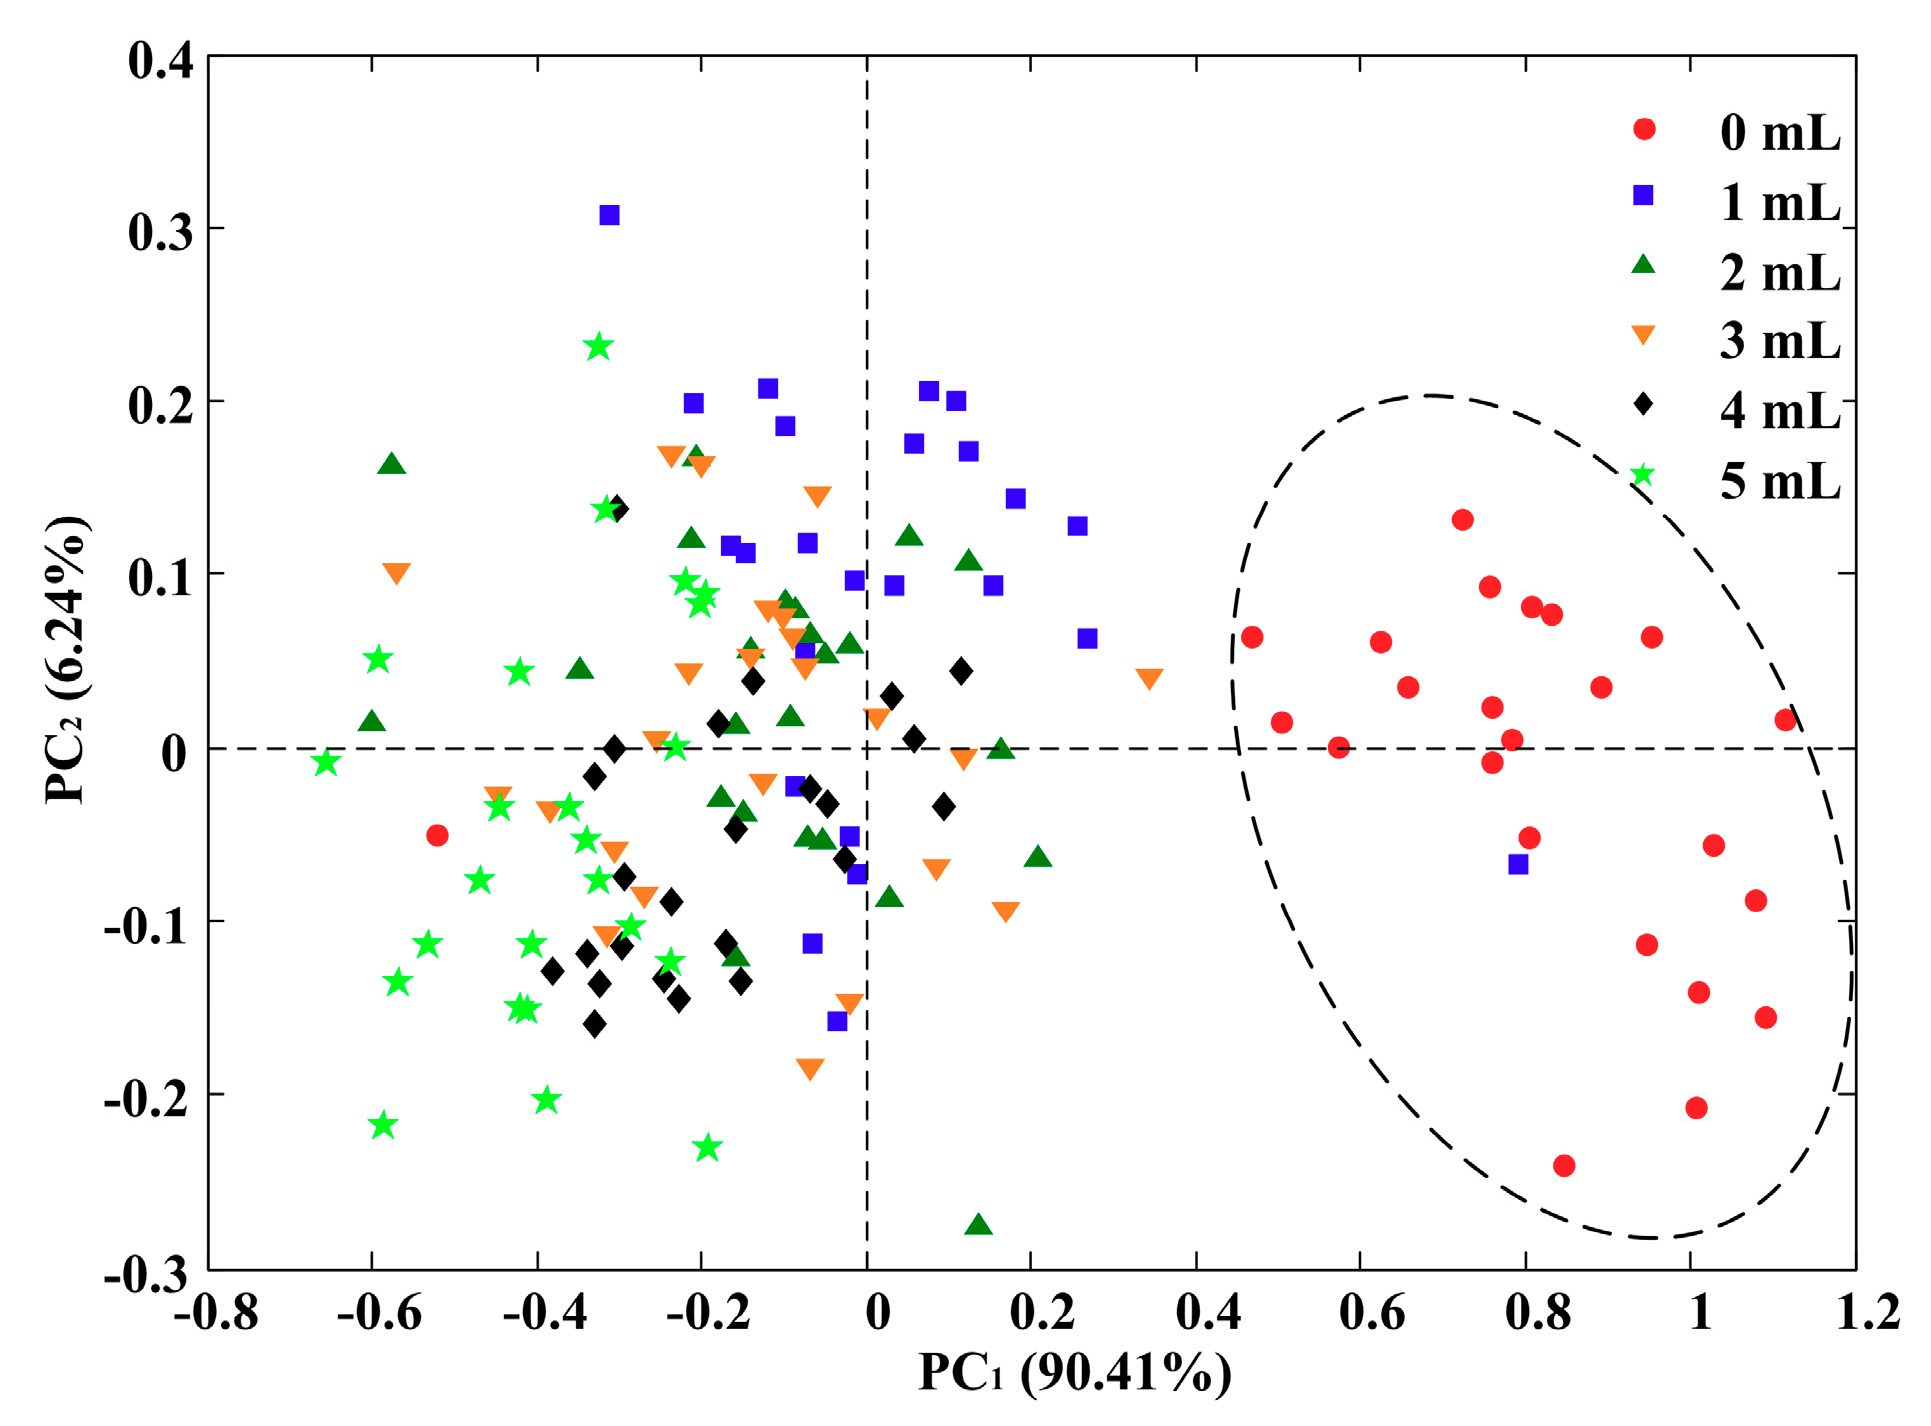
3.3. Principal Component Analysis

Dimension reduction methods, including PCA [31], independent component analysis (ICA) [32], and minimum noise fraction (MNF) [33], etc., were commonly used in hyperspectral imaging analysis to achieve a low-dimension database. However, PCA is one of the most popular methods in food quality detection due to its effectiveness and simplicity. PCA transformed the spectral data (X matrix) into a new coordinate system, producing uncorrelated orthogonal PCs (new X matrix). Most of the information was contained in PC1, then PC2, and so on, so that suitable PC numbers could be applied according to the research needs to retain useful information and eliminate noises [34].
In spectral analysis, PCA was commonly used to identify the major sources of variance and provided an explanatory analysis for the total dataset. It was a very effective way of exploring data to highlight groupings and differences. On the basis of full A spectra processed by SNV, a preliminary evaluation by PCA was carried out. Only the first two PCs, individually accounting for 90.41% and 6.24% of the total variance, were retained for analysis in this study. Although some outliers could be observed in the PC1 versus PC2 score plot (Figure 3), the ability of this method in distinguishing between pure chicken (0 mL) and adulterated samples (1–5 mL) was confirmed by showing a distinct separation. As shown, pure chicken samples were clustered and located on the bottom right of the plot. Furthermore, adulterated samples with different adulteration levels were not so easily distinguishable that adjacent categories overlapped to a certain degree. However, as the adulteration levels increased, the corresponding samples generally distributed along the PC1 negative axis. This explained why the spectra were effective in quantitatively detecting carrageenan adulteration in chicken meat.

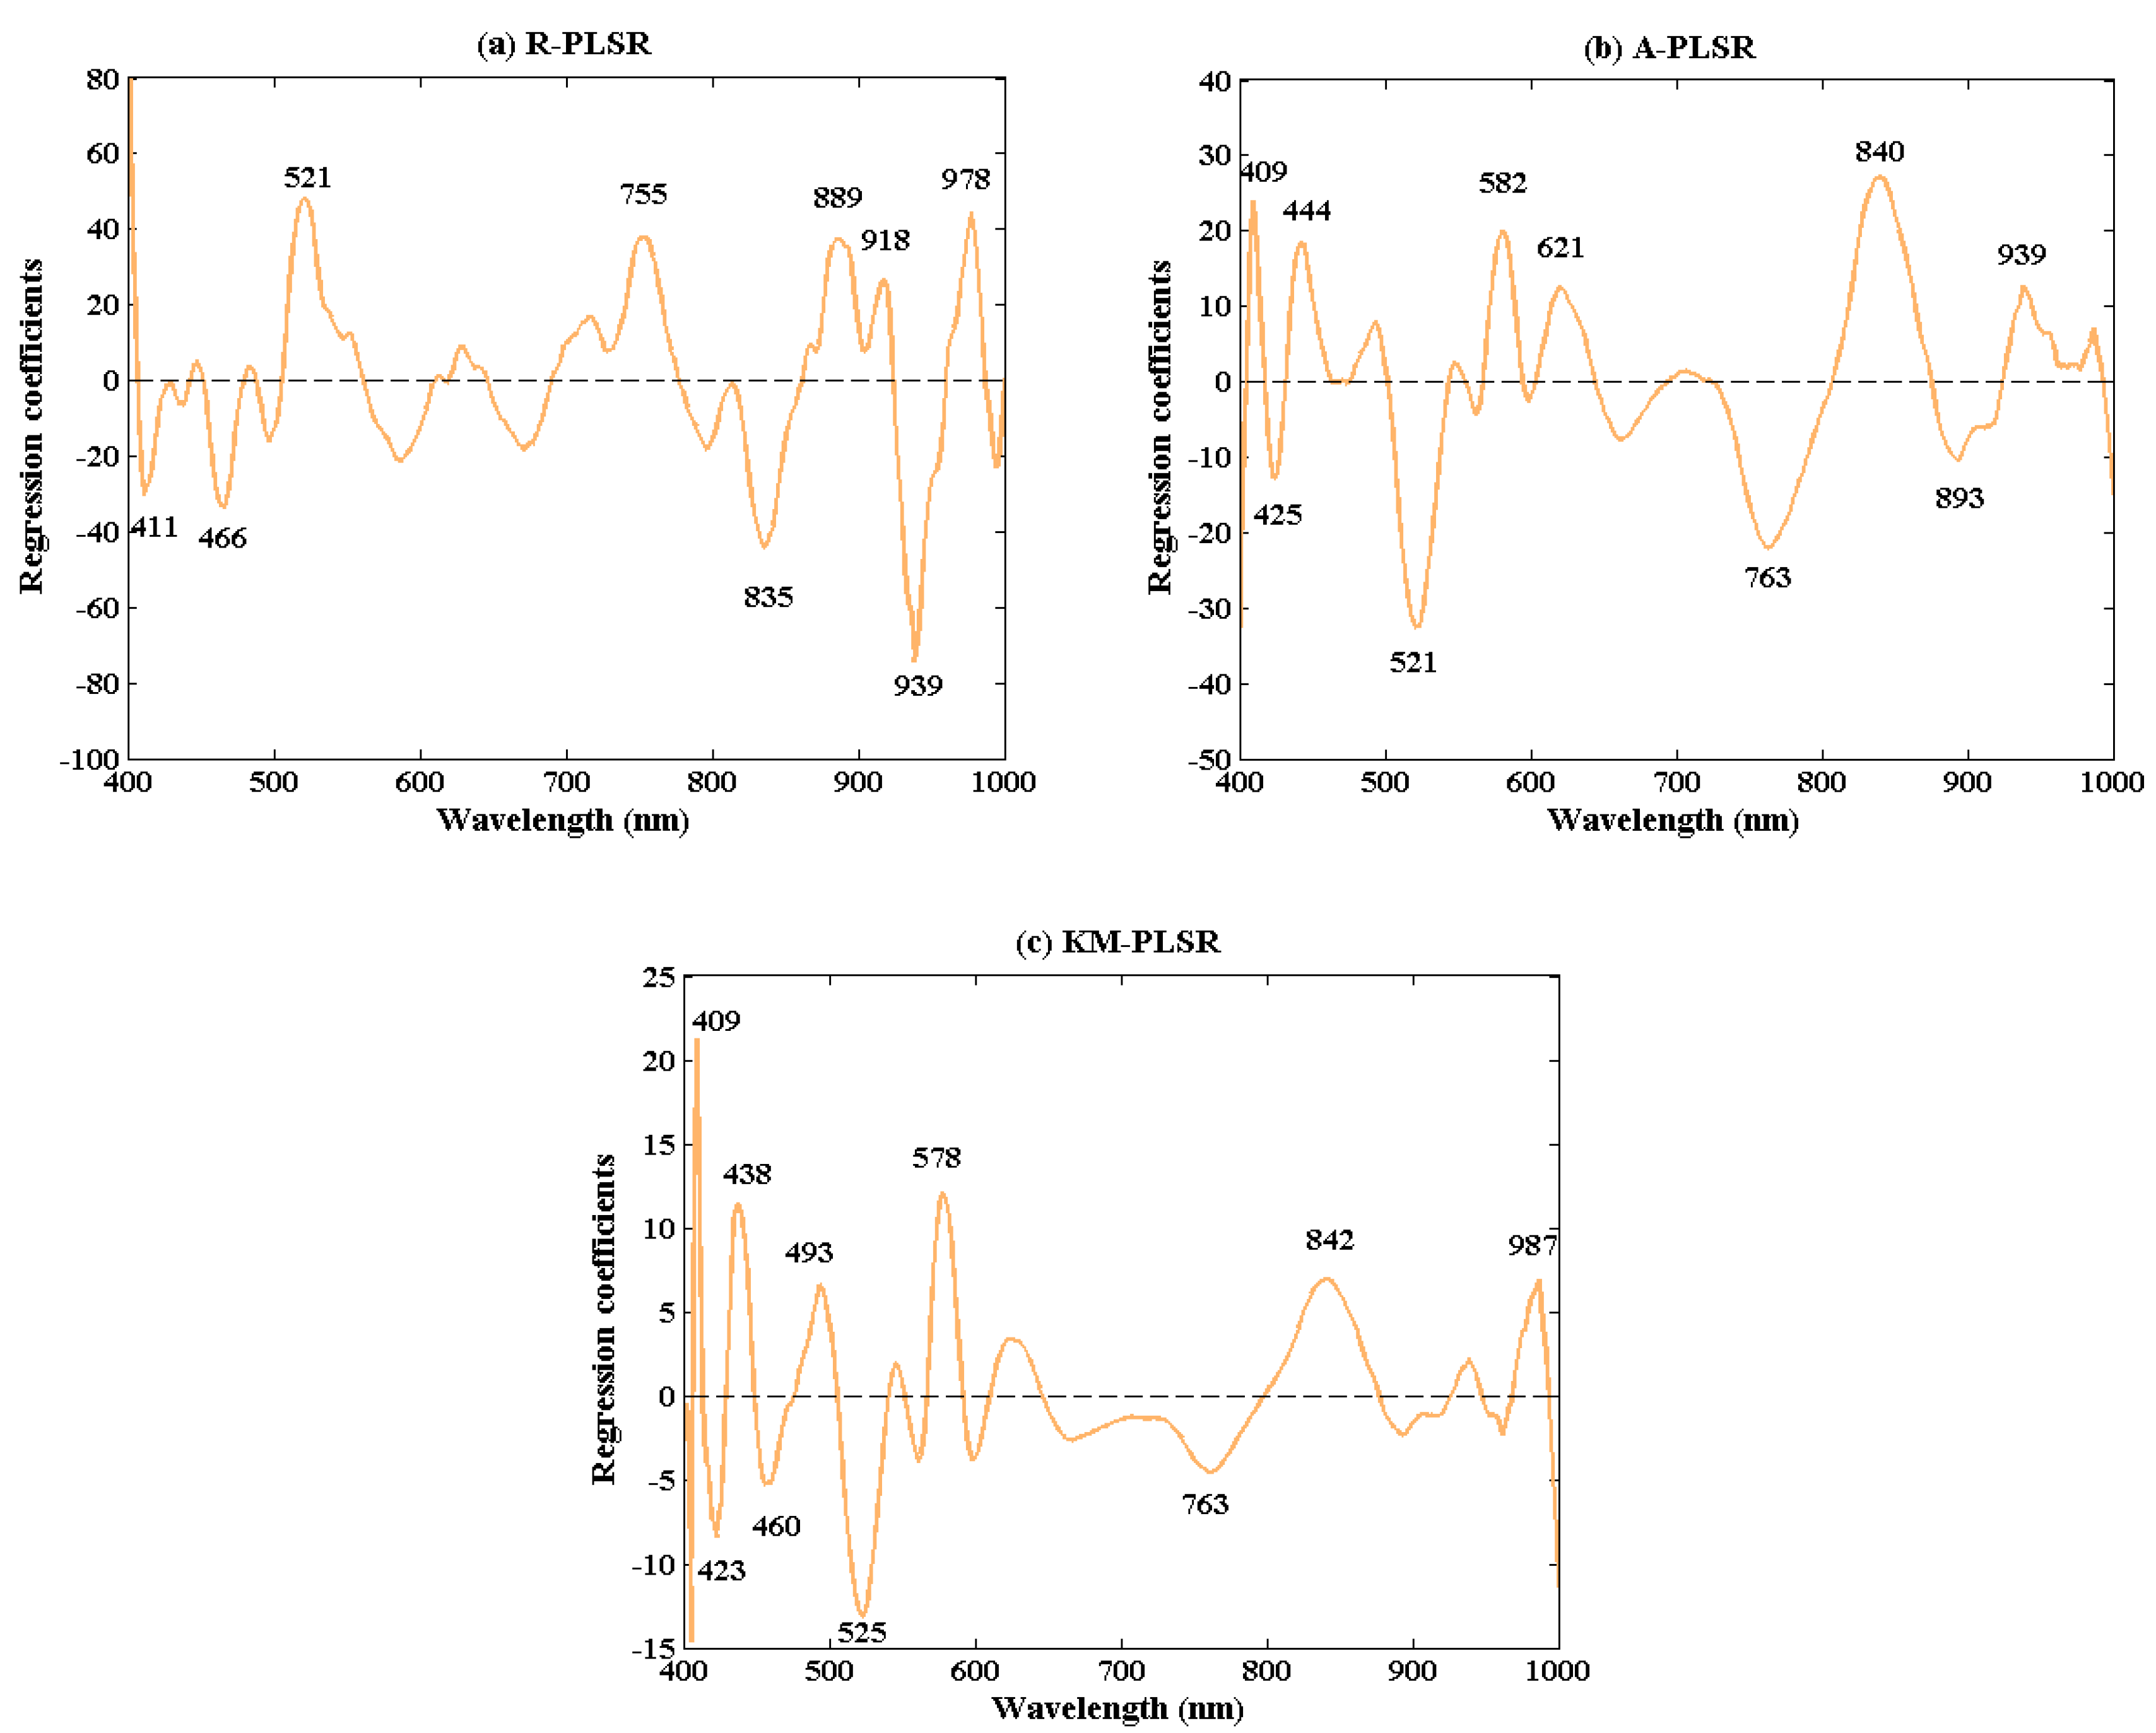
3.4. Wavelengths Selection

The selection of optimal wavelengths from the spectral data extracted from hyperspectral images is a task that aims to simplify models and is a precursor to the design of an informative multispectral imaging system [35]. The RC represents the contributions of the specific spectral variables to the PLSR calibration model. In this study, by analyzing RC resulting from the preferred multispectral PLSR models based on three spectral units, peaks and valleys attributed to high absolute values for adulteration levels were individually identified. Finally, a total of nine, 10, and 10 wavelengths for R, A, and KM spectra shown in Figure 4 were defined as the most relevant wavelengths in predicting adulteration levels of carrageenan adulteration in chicken meat. These identified wavelengths make it possible to obtain a simplified model and, further, to establish a simple and low-cost multispectral imaging system. All the three sets of selected effective wavelengths would be compared as a basis to develop the simplified PLSR models.

3.5. Multispectral Analysis

New multispectral PLSR models were established using the particular wavelengths identified by RC based on R, A, and KM spectra, respectively (Table 2). Compared with the preferred models built with full spectra (Rp2 = 0.89–0.92, RMSEP = 0.48–0.64, and RPD = 4.64–6.18), the models showed an overall performance of Rp2 = 0.84–0.85, RMSEP = 0.93–0.99, and RPD = 3.02–3.20. Although the number of wavelengths was essentially diminished from 285 to 9 or 10, the still satisfactory results shown in Table 2 indicate that the selected wavelengths contained enough information and the method for the wavelength selection using RC was efficient. In addition, it was also observed that the wavelengths selected from A spectra still performed the best among the three spectral units. The performance of the highest R2 and RPD as well as the lowest RMSE performed by the model developed using A spectra was in accordance with the results in the full-wavelength models performance comparison. Therefore, the RC-A-PLSR model was chosen to be subsequently applied in image visualization of the adulteration.

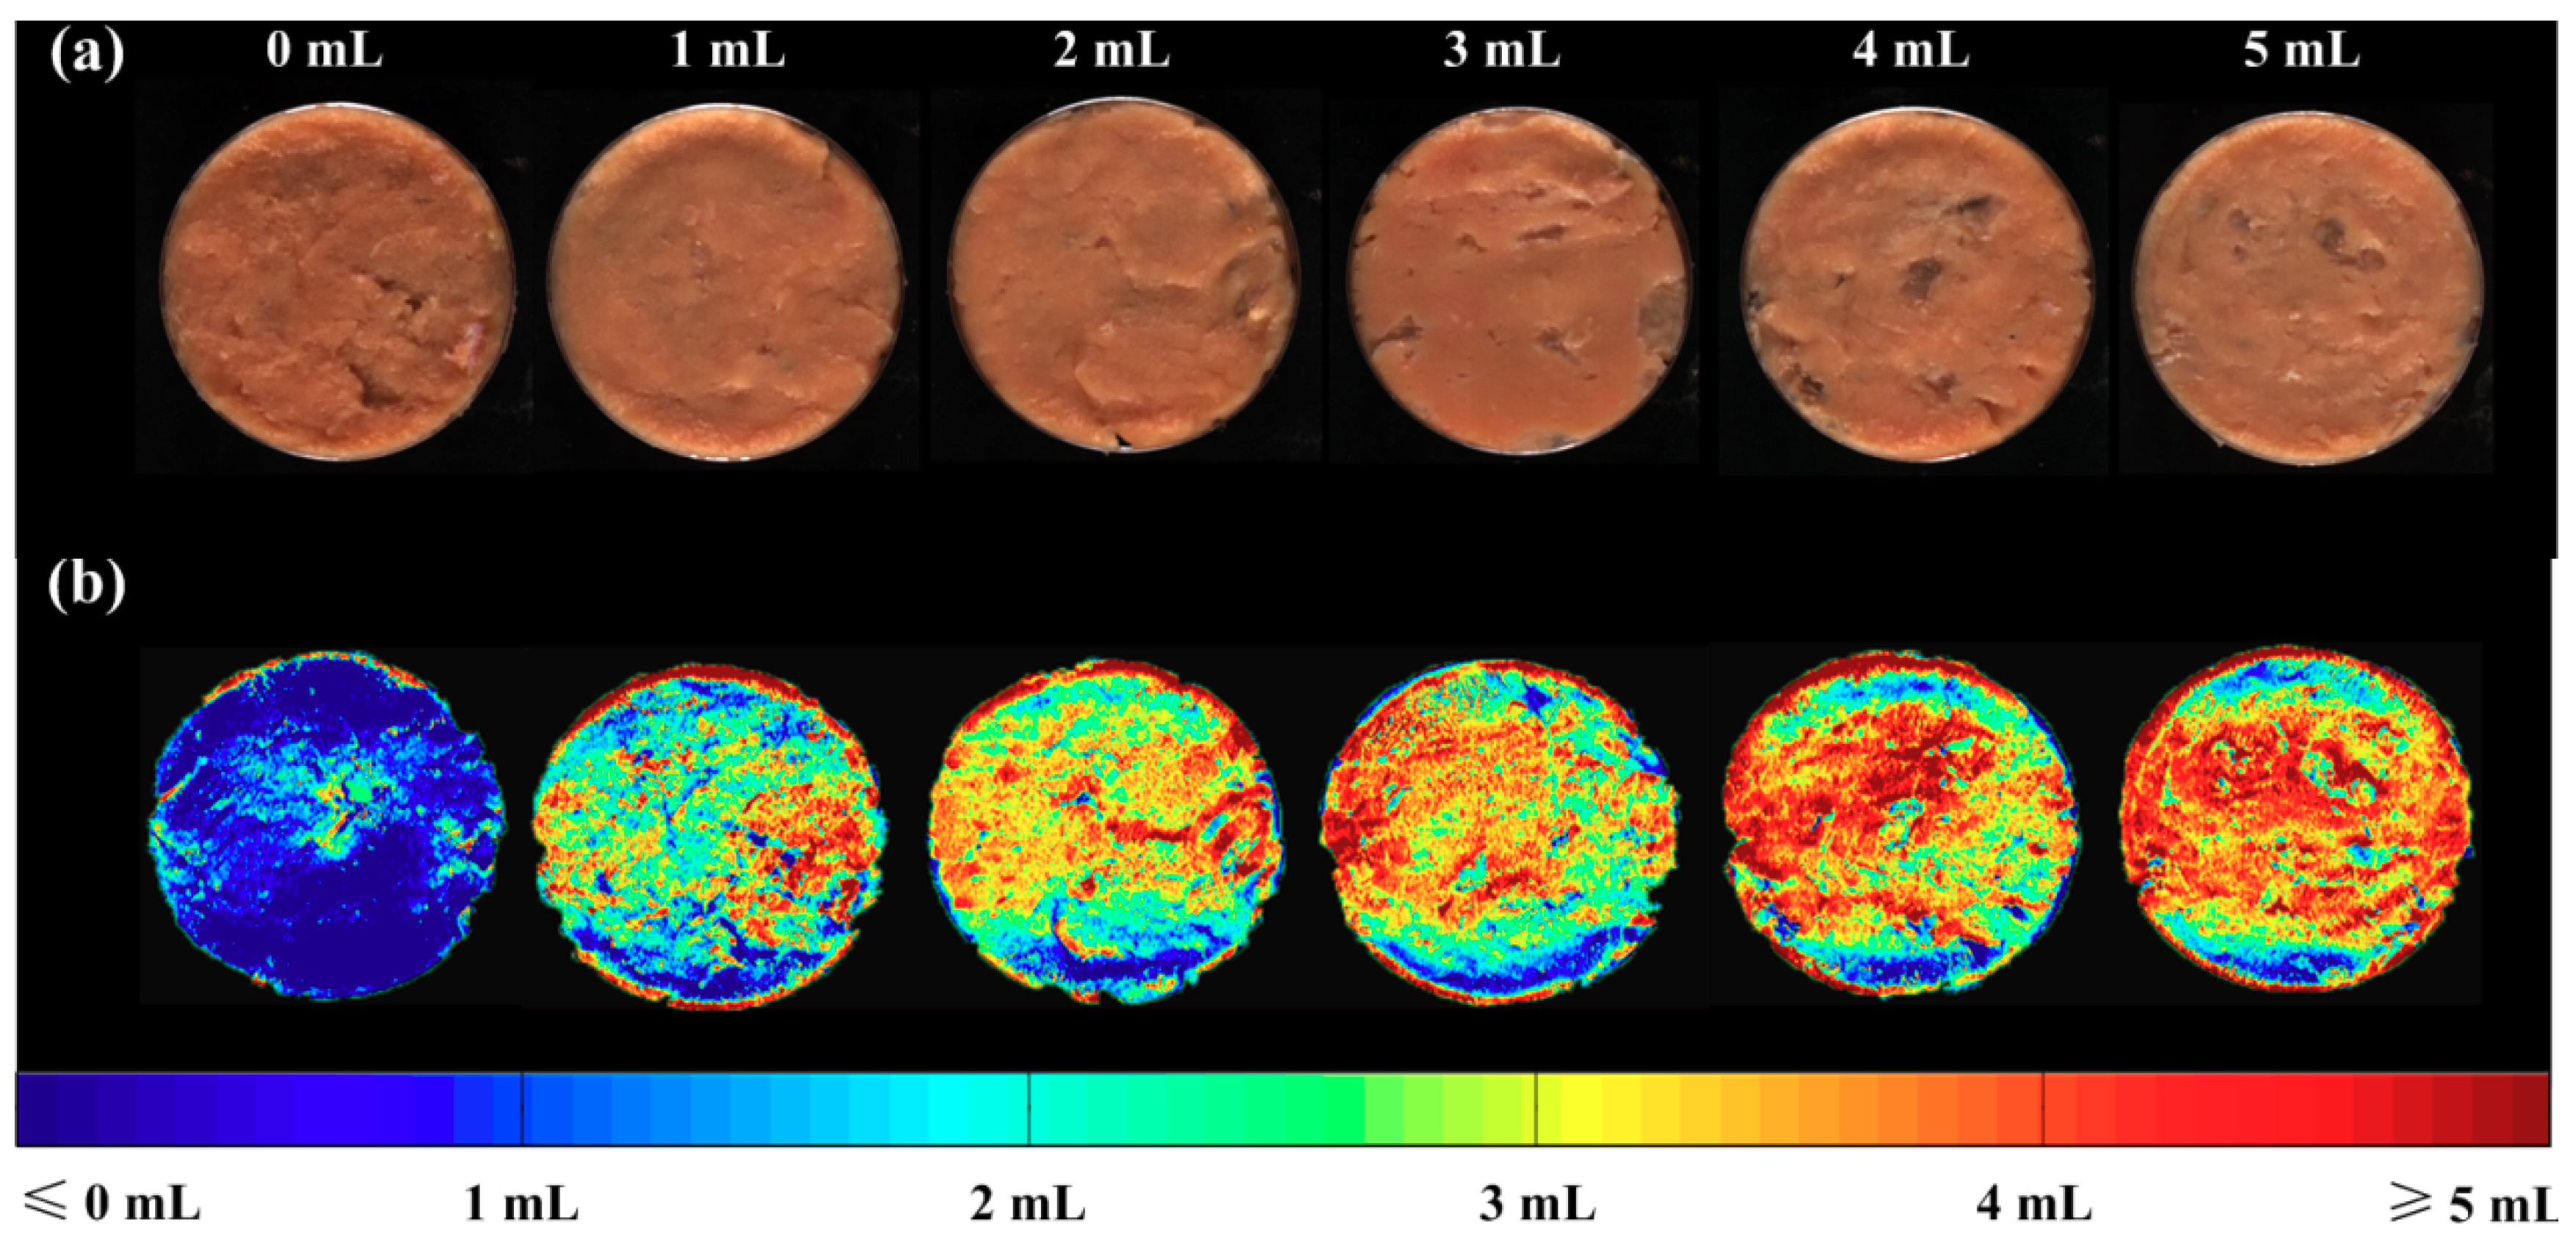
3.6. Visualization of Carrageenan Adulteration Levels

The benefits of the visualization process reside in the rapid and easy detection of the spatial distribution of carrageenan adulteration levels, which is impossible or difficult to be observed by the naked eye. As a popular post-processing method for hyperspectral images in food quality detection, the color maps generation could help to enhance the display of the results [36]. From the resulted visualization maps, not only the average value, but also the detailed spatial distribution of the non-homogeneous food samples could be observed. In the literature, there were three main approaches in constructing the visualization maps of the hyperspectral images. The simplest way was to directly visualize the grayscale image in the selected wavelengths or suitable PC score images [37,38]. As for the second way, this was to form a false color image composed of three different band images of selected wavelengths which acted as the RGB channels, respectively [39]. The above two ways were simple and were often used to distinguish defective or unreliable samples from normal ones. However, they could not accurately display the detailed differences among the different pixels within the sample. The third method was to develop a qualitative or quantitative model first, and then predict the categories or values of each pixel within the samples in a pixel-based manner so that the variation from sample to sample and even spot to spot could be easily interpretable [40,41,42,43,44,45]. Therefore, the third method was adopted to describe the procedure of creating visual images for quantitative spatial distribution of adulteration levels in chicken meat.
In this study, the preferred RC-A-PLSR model was applied to the hyperspectral images in the prediction set, providing adulteration levels for each pixel in the image. Specifically, prior to the distribution maps generation, the reflectance spectral data at each pixel were firstly transformed into an absorbance unit. Only images at selected wavelengths (409, 425, 444, 521, 582, 621, 763, 840, 893, 939 nm) were then retained and the reduced spectral data at each pixel was set as the inputs of the preferred RC-A-PLSR model. As shown in Figure 5, the first row (Figure 5a) was the pseudo-color images (R = 640 nm, G = 550 nm, B = 460 nm), while the second row (Figure 5b) gave the corresponding predicted distribution by the RC-A-PLSR model. There was also a color scale at the bottom of the visualization maps to clarify the meanings of different colors in the image, where different colors represented different carrageenan adulteration levels in chicken meat. Specifically, the blue color at the end of the color bar indicated a low adulteration level of 0 mL, while the red color designated a high adulteration level of 5 mL. Differences in adulteration level from sample to sample and even from spot to spot were very noticeable. All visualization maps acquired in this study revealed advantages of HSI that cannot be achieved by computer vision or conventional spectroscopy. Consequently, the HSI technique combined with multispectral analysis provided a reliable and automatic method for detecting chicken meat adulteration with carrageenan.

4. Conclusions

Carrageenan is one of the commonly used adulterations in meat or meat products. Our work demonstrates that the non-destructive HSI technique, together with different spectra transforms, has the potential to detect and visualize carrangeenan in chicken meat. On the basis of full spectra, PLSR models resulted in satisfactory results. In further steps, key wavelengths selected by the RC approach were also found to be efficient in the prediction of adulteration levels. In particular, we confirmed that the model developed by absorbance spectra exhibited superior performance to those using reflectance and Kubelka-Munck spectra regardless of full spectra or selected wavelengths. Finally, the multispectral PLSR model developed by wavelengths selected from absorbance spectra (Rp2 = 0.85, RMSEP = 0.93, and RPD = 3.20) were successfully used to visualize the carrageenan distribution in chicken meat which could facilitate the understanding of adulteration. It needs to be noted that this step cannot be accomplished by only utilizing either spectroscopy techniques or conventional imaging. In conclusion, HSI can be treated as an efficient and non-destructive tool in screening carrageenan adulteration in chicken meat.

Author Contributions

The experiment was designed and directed by W.W. and conducted by H.J. and Y.Z. The data were analyzed and the first draft of the manuscript was prepared by Y.Z. and H.J..The manuscript was revised by W.W.

Funding

This work was supported by the National Natural Science Foundation of China (No.31772062) and the URP Scientific Research Innovation Program for Undergraduates of China Agricultural University.

Conflicts of Interest

The authors declare no conflict of interest.

References

  1. Rahmati, S.; Julkapli, N.M.; Yehye, W.A.; Wan, J.B. Identification of meat origin in food products—A review. Food Control. 2016, 68, 379–390. [Google Scholar] [CrossRef]
  2. Ballin, N.Z. Authentication of meat and meat products. Meat Sci. 2010, 86, 577–587. [Google Scholar] [CrossRef] [PubMed]
  3. Davis, D.E.; Stewart, H. Changing consumer demands create opportunities for U.S. food system. Food Rev. 2002, 25, 18–23. [Google Scholar]
  4. Barbut, S. Poultry Products Processing: An Industry Guide; CRC Press, Taylor & Francis Group, LLC: Boca Raton, FL, USA, 2016. [Google Scholar]
  5. Chicken Seller Injecting Water into Poultry to Profit More. Available online: https://rumble.com/v31p57-chicken-seller-injecting-water-into-poultry-to-profit-more.html (accessed on 14 September 2016).
  6. Yang, S.; Wang, L.; Zhang, H.; Fu, Q. Strengthening market supervision and management, resolutely banning the illegal business phenomenon of selling “gel-injected chicken”. Meat Hyg. 2002, 10, 3–23. (In Chinese) [Google Scholar]
  7. Yasin, H.; Babji, A.S.; Ismail, H. Optimization and rheological properties of chicken ball as affected by κ-carrageenan, fish gelatin and chicken meat. LWT Food Sci. Technol. 2016, 66, 79–85. [Google Scholar] [CrossRef]
  8. Gayo, J.; Hale, S.A.; Blanchard, S.M. Quantitative analysis and detection of adulteration in crab meat usingvisible and near-infrared spectroscopy. J. Agric. Food Chem. 2006, 54, 1130–1136. [Google Scholar] [CrossRef] [PubMed]
  9. Schmutzler, M.; Beganovic, A.; Böhler, G.; Huck, C.W. Methods for detection of pork adulteration in veal product based on FT-NIR spectroscopy for laboratory, industrial and on-site analysis. Food Control 2015, 57, 258–267. [Google Scholar] [CrossRef]
  10. Jiang, H.; Zhuang, H.; Sohn, M.; Wang, W. Measurement of soy contents in ground beef using near-infrared spectroscopy. Appl. Sci. 2017, 7, 97. [Google Scholar] [CrossRef]
  11. Wu, D.; Sun, D.W. Advanced applications of hyperspectral imaging technology for food quality and safety analysis and assessment: A review—Part I: Fundamentals. Innov. Food Sci. Emerg. Technol. 2013, 19, 1–14. [Google Scholar] [CrossRef]
  12. Kamruzzaman, M.; Sun, D.W.; Elmasry, G.; Allen, P. Fast detection and visualization of minced lamb meat adulteration using NIR hyperspectral imaging and multivariate image analysis. Talanta 2013, 103, 130–136. [Google Scholar] [CrossRef]
  13. Kamruzzaman, M.; Makino, Y.; Oshita, S.; Liu, S. Assessment of visible near-infrared hyperspectral imaging as a tool for detection of horsemeat adulteration in minced beef. Food Bioprocess. Technol. 2015, 8, 1054–1062. [Google Scholar] [CrossRef]
  14. Ropodi, A.I.; Panagou, E.Z.; Nychas, G.J.E. Multispectral imaging (MSI): A promising method for the detection of minced beef adulteration with horsemeat. Food Control 2017, 73, 57–63. [Google Scholar] [CrossRef]
  15. Kamruzzaman, M.; Makino, Y.; Oshita, S. Hyperspectral imaging in tandem with multivariate analysis and image processing for non-invasive detection and visualization of pork adulteration in minced beef. Anal. Methods 2015, 7, 7496–7502. [Google Scholar] [CrossRef]
  16. Ropodi, A.I.; Pavlidis, D.E.; Mohareb, F.; Panagou, E.Z.; Nychas, G.J.E. Multispectral image analysis approach to detect adulteration of beef and pork in raw meats. Food Res. Int. 2015, 67, 12–18. [Google Scholar] [CrossRef]
  17. Kamruzzaman, M.; Makino, Y.; Oshita, S. Rapid and non-destructive detection of chicken adulteration in minced beef using visible near-infrared hyperspectral imaging and machine learning. J. Food Eng. 2016, 170, 8–15. [Google Scholar] [CrossRef]
  18. Wu, D.; Shi, H.; He, Y.; Yu, X.; Bao, Y. Potential of hyperspectral imaging and multivariate analysis for rapid and non-invasive detection of gelatin adulteration in prawn. J. Food Eng. 2013, 119, 680–686. [Google Scholar] [CrossRef]
  19. Feng, Y.Z.; Sun, D.W. Determination of total viable count (TVC) in chicken breast fillets by near-infrared hyperspectral imaging and spectroscopic transforms. Talanta 2013, 105, 244–249. [Google Scholar] [CrossRef] [PubMed]
  20. He, H.J.; Sun, D.W. Inspection of harmful microbial contamination occurred in edible salmon flesh using imaging technology. J. Food Eng. 2015, 150, 82–89. [Google Scholar] [CrossRef]
  21. Jiang, H.; Wang, W.; Zhuang, H.; Yoon, S.Y.; Yang, Y.; Zhao, X. Hyperspectral imaging for a rapid detection and visualization of duck meat adulteration in beef. Food Anal. Methods 2019, 12, 2205–2215. [Google Scholar] [CrossRef]
  22. Wang, W.; Heitschmidt, G.W.; Ni, X.; Windham, W.R.; Hawkins, S.; Chu, X. Identification of aflatoxin B1 on maize kernel surfaces using hyperspectral imaging. Food Control 2014, 42, 78–86. [Google Scholar] [CrossRef]
  23. Menesatti, P.; Zanella, A.; D’Andrea, S.; Costa, C.; Paglia, G.; Pallottino, F. Supervised multivariate analysis of hyper-spectral NIR images to evaluate the starch index of apples. Food Bioprocess. Technol. 2009, 2, 308–314. [Google Scholar] [CrossRef]
  24. Qin, J.; Burks, T.F.; Kim, M.S.; Chao, K.; Ritenour, M.A. Citrus canker detection using hyperspectral reflectance imaging and PCA-based image classification method. Sens. Instrum. Food Qual. 2008, 2, 168–177. [Google Scholar] [CrossRef]
  25. He, H.J.; Wu, D.; Sun, D.W. Potential of hyperspectral imaging combined with chemometric analysis for assessing and visualising tenderness distribution in raw farmed salmon fillets. J. Food Eng. 2014, 126, 156–164. [Google Scholar] [CrossRef]
  26. Alexandrakis, D.; Downey, G.; Scannell, A.G.M. Rapid non-destructive detection of spoilage of intact chicken breast muscle using near-infrared and Fourier transform mid-infrared spectroscopy and multivariate statistics. Food Bioprocess. Technol. 2012, 5, 338–347. [Google Scholar] [CrossRef]
  27. Kapper, C.; Klont, R.E.; Verdonk, J.; Urlings, H. Prediction of pork quality with near infrared spectroscopy (NIRS): 1. Feasibility and robustness of NIRS measurements at laboratory scale. Meat Sci. 2012, 91, 294–299. [Google Scholar] [CrossRef] [PubMed]
  28. Liu, Y.L.; Chen, Y.R. Two-dimensional correlation spectroscopy study of visible and near-infrared spectral variations of chicken meats in cold storage. Appl. Spectrosc. 2000, 54, 1458–1470. [Google Scholar] [CrossRef]
  29. Wu, D.; Sun, D.W. Application of visible and near infrared hyperspectral imaging for non-invasively measuring distribution of water-holding capacity in salmon flesh. Talanta 2013, 116, 266–276. [Google Scholar] [CrossRef] [PubMed]
  30. Bowker, B.; Hawkins, S.; Zhuang, H. Measurement of water-holding capacity in raw and freeze-dried broiler breast meat with visible and near-infrared spectroscopy. Poult. Sci. 2014, 93, 1834–1841. [Google Scholar] [CrossRef]
  31. Yousefi, B.; Sojasi, S.; Castanedo, C.I.; Maldague, X.P.; Beaudoin, G.; Chamberland, M. Comparison assessment of low rank sparse-PCA based-clustering/classification for automatic mineral identification in long wave infrared hyperspectral imagery. Infrared Phys. Technol. 2018, 93, 103–111. [Google Scholar] [CrossRef]
  32. Shah, C.A.; Arora, M.K.; Varshney, P.K. Unsupervised classification of hyperspectral data: An ICA mixture model based approach. Int. J. Remote Sens. 2004, 25, 481–487. [Google Scholar] [CrossRef]
  33. Buddenbaum, H.; Schlerf, M.; Hill, J. Classification of coniferous tree species and age classes using hyperspectral data and geostatistical methods. Int. J. Remote Sens. 2005, 26, 5453–5465. [Google Scholar] [CrossRef]
  34. Jiang, H.; Yoon, S.C.; Zhuang, H.; Wang, W.; Li, Y.; Yang, Y. Integration of spectral and textural features of visible and near-infrared hyperspectral imaging for differentiating between normal and white striping broiler breast meat. Spectrochim. Acta Part A 2019, 213, 118–126. [Google Scholar] [CrossRef] [PubMed]
  35. Pu, H.; Kamruzzaman, M.; Sun, D.W. Selection of feature wavelengths for developing multispectral imaging systems for quality, safety and authenticity of muscle foods-a review. Trends Food Sci. Technol. 2015, 45, 86–104. [Google Scholar] [CrossRef]
  36. Moghaddam, T.M.; Razavi, S.M.A.; Taghizadeh, M. Applications of hyperspectral imaging in grains and nuts quality and safety assessment: A review. J. Food Meas. Charact. 2013, 7, 129–140. [Google Scholar] [CrossRef]
  37. Achata, E.M.; Inguglia, E.S.; Esquerre, C.A.; Tiwari, B.K.; O’Donnell, C.P. Evaluation of Vis-NIR hyperspectral imaging as a process analytical tool to classify brined pork samples and predict brining salt concentration. J. Food Eng. 2019, 246, 134–140. [Google Scholar] [CrossRef]
  38. Singh, C.B.; Jayas, D.S.; Paliwal, J.; White, N.D.G. Detection of insect-damaged wheat kernels using near-infrared hyperspectral imaging. J. Stored Prod. Res. 2009, 45, 151–158. [Google Scholar] [CrossRef]
  39. Sun, Y.; Wang, Y.; Xiao, H.; Gu, X.; Pan, L.; Tu, K. Hyperspectral imaging detection of decayed honey peaches based on their chlorophyll content. Food Chem. 2017, 235, 194–202. [Google Scholar] [CrossRef] [PubMed]
  40. Jiang, H.; Yoon, S.C.; Zhuang, H.; Wang, W.; Lawrence, K.C.; Yang, Y. Tenderness classification of fresh broiler breast fillets using visible and near-infrared hyperspectral imaging. Meat Sci. 2018, 139, 82–90. [Google Scholar] [CrossRef]
  41. Barbin, D.; Elmasry, G.; Sun, D.W.; Allen, P. Near-infrared hyperspectral imaging for grading and classification of pork. Meat Sci. 2012, 90, 259–268. [Google Scholar] [CrossRef]
  42. Jiang, H.; Yoon, S.C.; Zhuang, H.; Wang, W.; Li, Y.; Lu, C.; Li, N. Non-destructive assessment of final color and pH attributes of broiler breast fillets using visible and near-infrared hyperspectral imaging: A preliminary study. Infrared Phys. Technol. 2018, 92, 309–317. [Google Scholar] [CrossRef]
  43. Li, W.; Chen, C.; Su, H.; Du, Q. Local binary patterns and extreme learning machine for hyperspectral imagery classification. IEEE Trans. Geosci. Electron. 2015, 53, 3681–3693. [Google Scholar] [CrossRef]
  44. Chen, Y.; Nasrabadi, N.M.; Tran, T.D. Hyperspectral image classification using dictionary-based sparse representation. IEEE Trans. Geosci. Electron. 2011, 49, 3973–3985. [Google Scholar] [CrossRef]
  45. Chen, Y.; Nasrabadi, N.M.; Tran, T.D. Sparse representation for target detection in hyperspectral imagery. IEEE J. Sel. Top. Signal. Process. 2011, 5, 629–640. [Google Scholar] [CrossRef]
Figure 1. Chemical structure of K-carrageenan.
Applsci 09 03926 g001
Figure 2. Average (a) reflectance (R), (b) absorbance (A), and (c) Kubelka-Munck(KM) spectra with different adulteration levels (0–5 mL).
Applsci 09 03926 g002
Figure 3. Principal component analysis (PCA) score plot of PC1 versus PC2 based on A spectral unit.
Applsci 09 03926 g003
Figure 4. Determination of informative wavelengths by regression coefficients (RC) of (a) R-PLSR, (b) A-PLSR, and (c) KM-PLSR models.
Applsci 09 03926 g004
Figure 5. Visualization of samples adulterated with different adulteration levels of carrageenan. (a) pseudo-color images and (b) visual distribution maps.
Applsci 09 03926 g005
Table 1. Summary of partial least squares regression (PLSR) model results based on raw and preprocessed full R, A, and KM spectra.
ModelPreprocessingsLVsCalibrationCross-validationPredictionRPD
Rc2RMSECRcv2RMSECVRp2RMSEP
R-PLSRNone120.930.460.890.570.870.684.37
MSC140.940.400.900.540.860.664.51
SNV150.950.370.910.520.860.644.66
SNV + Detrend140.940.400.900.540.860.654.56
Der1170.970.280.930.450.900.565.32
Der2130.980.250.930.440.900.575.30
A-PLSRNone160.960.350.920.490.910.525.70
MSC160.970.320.930.460.920.486.17
SNV160.970.320.930.470.920.486.18
SNV + Detrend160.960.320.930.470.920.496.11
Der1140.960.320.930.450.910.535.67
Der2140.970.290.920.490.930.496.11
KM-PLSRNone150.960.340.920.490.890.644.64
MSC150.960.340.920.490.880.644.64
SNV150.960.320.930.460.880.704.26
SNV + Detrend150.960.330.930.470.880.654.60
Der1150.960.350.920.490.890.664.50
Der2140.950.370.890.570.890.595.04
LVs: latent variables; RPD: residual predictive deviation; PLSR: partial least squares regression; MSC: multiplicative scatter correction; SNV: standard normal variate; RMSEC: root mean squared error for calibration set; RMSECV: root mean squared error for cross-validation set; RMSEP: root mean squared error for prediction set.
Table 2. Performance of multispectral PLSR models developed by wavelengths selected using three spectral units.
ModelWavelengths (nm)CalibrationCross-validationPredictionRPD
Rc2RMSECRcv2RMSECVRp2RMSEP
RC-R-PLSR411, 466, 521, 755, 835, 889, 918, 939, 9780.890.560.870.610.850.993.02
RC-A-PLSR409, 425, 444, 521, 582, 621, 763, 840, 893, 9390.890.550.870.620.850.933.20
RC-KM-PLSR409, 423, 438, 460, 493, 525, 578, 763, 842, 9870.890.570.850.650.840.993.02

