Article

Life-Cycle Assessment of the Substitution of Sand with Coal Bottom Ash in Concrete: Two Concrete Design Methods

Department of Civil Engineering, Ariel University, Ariel 40700, Israel, [email protected]
Appl. Sci. 2019, 9(17), 3620; https://doi.org/10.3390/app9173620
Submission received: 17 July 2019 / Revised: 29 August 2019 / Accepted: 30 August 2019 / Published: 3 September 2019
(This article belongs to the Section Civil Engineering)

Abstract

:
Life-cycle assessments (LCAs) were conducted to evaluate the replacement of sand with coal bottom ash (CBA) in concrete. CBA is a byproduct of coal-fueled electricity production. Sand was replaced with CBA at proportions of 0, 25, 50, 75, and 100 wt.%, and the resultant concretes were denoted as CBA0, CBA25, CBA50, CBA75, and CBA100, respectively. Two concrete mixture design methods (that resulted in different component qualities of concrete mixtures) were used: (i) Mixture with a fixed slump (MIX-fixed-SLUMP) and (ii) mixture with a fixed water/cement ratio (MIX-fixed-W/C). The ReCiPe2016 midpoint and single score (six methodological options) methods were followed to compare the environmental damage caused by the CBA-based concretes. The ReCiPe2016 results showed that replacing sand with CBA was environmentally (i) beneficial with the MIX-fixed-SLUMP design and (ii) harmful with the MIX-fixed-W/C design. Therefore, using CBA as a partial sand replacement in concrete production is a controversial issue as it highly depends on the concrete mixture design method.

1. Introduction

Every year, ten billion tons of concrete are produced in the world [1]. Conventional concrete production consumes high amounts of cement and aggregates and causes severe environmental damage due to the high greenhouse gas emissions and natural resource depletion [2]. This problem is further exacerbated in areas where natural resources such as sand are becoming scarce, for example, in Singapore [3] and India [4]. Therefore, to reduce the environmental damage caused by concrete production, a worldwide switch from conventional concrete to “byproduct-based” concrete should be made. Typically, in byproduct-based concrete, cement and/or natural aggregates are replaced with byproducts from other industries, such as fly ash (FA), coal bottom ash (CBA), granulated blast furnace slag (GBFS), quarry dust powder (QDP), and copper slag (CS), in addition to others [2,5].
This problem is also faced in Israel due to (i) the prevalence of concrete as a main building material under the current socioeconomic state [6], and (ii) the presence of polluting industries, such as coal-fueled electricity production [7]. The Israeli electric company uses two major sources of fuel, i.e., coal (50%–57%) and natural gas (40%–45%) [7], and coal combustion produces 85%–90% FA and 10%–15% CBA [8].
Recently, Lieberman et al. [9] conducted a study to partially replace sand with QDP and FA in the concrete produced in Israel (18 wt.% of the sand was replaced with FA, and 18 and 9 wt.% of the sand was replaced with FA and ODP, respectively). The authors reported improvements in the mechanical and chemical properties of the concrete, and in the leaching of contaminants [9].
However, the total life-cycle influence, from production to the end-of-life, of partial and/or full replacements of sand with byproducts is unknown. Life-cycle assessment (LCA) is an appropriate approach to elucidate the trade-offs of such replacements [10]. According to [11], in LCA studies, a functional unit (FU), to which all inputs and outputs of the raw materials, their embodied energies, and emissions, should be traced, must be shared by all the compared alternatives.
The compared concrete alternatives (conventional and byproduct-based) should be comparable, at least in terms of their (i) fresh properties (such as the consistency), (ii) hardened properties (such as the compressive strength), and (iii) durability (such as the penetration of water). To achieve this, two different concrete mixture design methods, i.e., (i) a mixture with a fixed slump range or (ii) a mixture with a fixed water/cement (W/C) ratio, have been used in previous LCA studies [12,13,14].
Turk et al. [12] used a fixed slump range of 185–205 mm in byproduct-based concretes that were designed using foundry sand or steel slag to partially replace the sand and FA as a mineral admixture, and they attempted to achieve comparable compressive strengths and water penetration. However, the range of the 28-day compressive strength was 30.1–45.3 MPa and the water penetration depth was 16–34 mm. Despite this relatively wide strength range, the FU was the production of 1 m3 of concrete without normalization to the 28-day compressive strength. It should be noted that Turk et al. [12] also conducted consequential LCA modeling for the byproducts, which allowed the prevention of byproduct disposal in landfill to be considered as a benefit of the byproduct-based concretes. As a result, the global warming potential (GWP), acidification potential, eutrophication potential, and photochemical ozone creation potential were lower for the byproduct-based concretes than those of conventional concrete [12].
Prem et al. [13] compared CS-based (100 vol.% of sand was replaced with CS) and conventional concretes for fixed W/C of 0.37, 0.47, and 0.57, and followed the absolute volume method when replacing sand with CS. This is because their method restricted the addition of any surplus water that can increase the W/C ratio and, in turn, reduce the strength of the concrete. As a result, CS-based concretes exhibited improved strength (compressive and flexural) and durability (chloride permeability and sorptivity) properties. In this case, a FU of 1 m3 of concrete without normalization to the concrete compressive strength is appropriate. However, it was also reported that the environmental performance of byproduct-based concretes was lower due to the increase in the embodied energy and GWP associated with their production. Prem et al. [13] conducted attributive LCA modeling and the environmental performance of CS-based concretes deteriorated as the environmental damage from CS production was attributed to these concretes.
Gursel and Ostertag [14] studied high-strength concretes with the replacement of sand by CS at an incremental rate of 20 wt.% (CS0:CS20:CS100) for a fixed W/C of 0.3. The FU of 1 m3 of concrete was normalized to its 28-day compressive strength, and the processing of washed CS (transportation of used CS to the reprocessing plant) as the sand replacement was considered. From CS0, through CS20, CS40, CS60, and CS80, to CS100, the concrete’s compressive strength significantly decreased (98–65 MPa). As a result, the LCAs of the FU normalized to the 28-day compressive strength of concrete exhibited a significant increase in the embodied energy, GWP, acidification potential, and particulate matter for CS60–CS100. Therefore, Gursel and Ostertag [14] recommended replacing up to 40% of sand with CS.
Based on these studies [12,13,14], it should be assumed that the environmental impacts of byproduct-based concrete may depend on the selected concrete design method due to the resulting different qualities of the concrete mix components. However, comparative LCAs with a normalized FU of byproduct-based concretes designed following different methods have not yet been conducted.
The aim of this study was to conduct LCAs of the FUs of concrete normalized to the 28-day compressive strength, where the natural material (sand) was replaced with byproducts (CBA) using two design methods: (i) MIX-fixed-SLUMP (concrete mixture designed with a fixed slump range of 60–80 mm) and (ii) MIX-fixed-W/C (concrete mixture designed with a fixed W/C of 0.52). For both design methods, the concrete mix and properties were based on those of Kou and Poon [15], while we conducted the LCAs.

2. Materials and Methods

2.1. Concrete Mixture Designs

We conducted LCAs of concrete with varying percentages of sand replacement with CBA. The concretes were denoted as CBA0, CBA25, CBA50, CBA75, and CBA100 for 0, 25, 50, 75, and 100 wt.% of sand replacement with CBA. The material properties, mix designs, and concrete properties were based on those of Kou and Poon [15], who designed concrete mixtures following two methods: (i) With a fixed slump range (MIX-fixed-SLUMP) and (ii) with a fixed W/C ratio (MIX-fixed-W/C), and evaluated the compressive strength, drying shrinkage, and chloride-ion penetration of the resultant concretes. The mixture designs and concrete properties are presented in Table 1 and Table 2 for MIX-fixed-SLUMP and MIX-fixed-W/C, respectively. The CBA and sand were sieved so that both materials used in the mixtures were <5 mm [15]. For testing the mechanical properties of the concretes, twelve 100 × 100 × 100 mm cubes, three 75 × 75 × 285 mm prisms, and two 100 × 200 cylindrical specimens were tested for the compressive strength, drying shrinkage, and resistance to chloride–ion penetration [15].

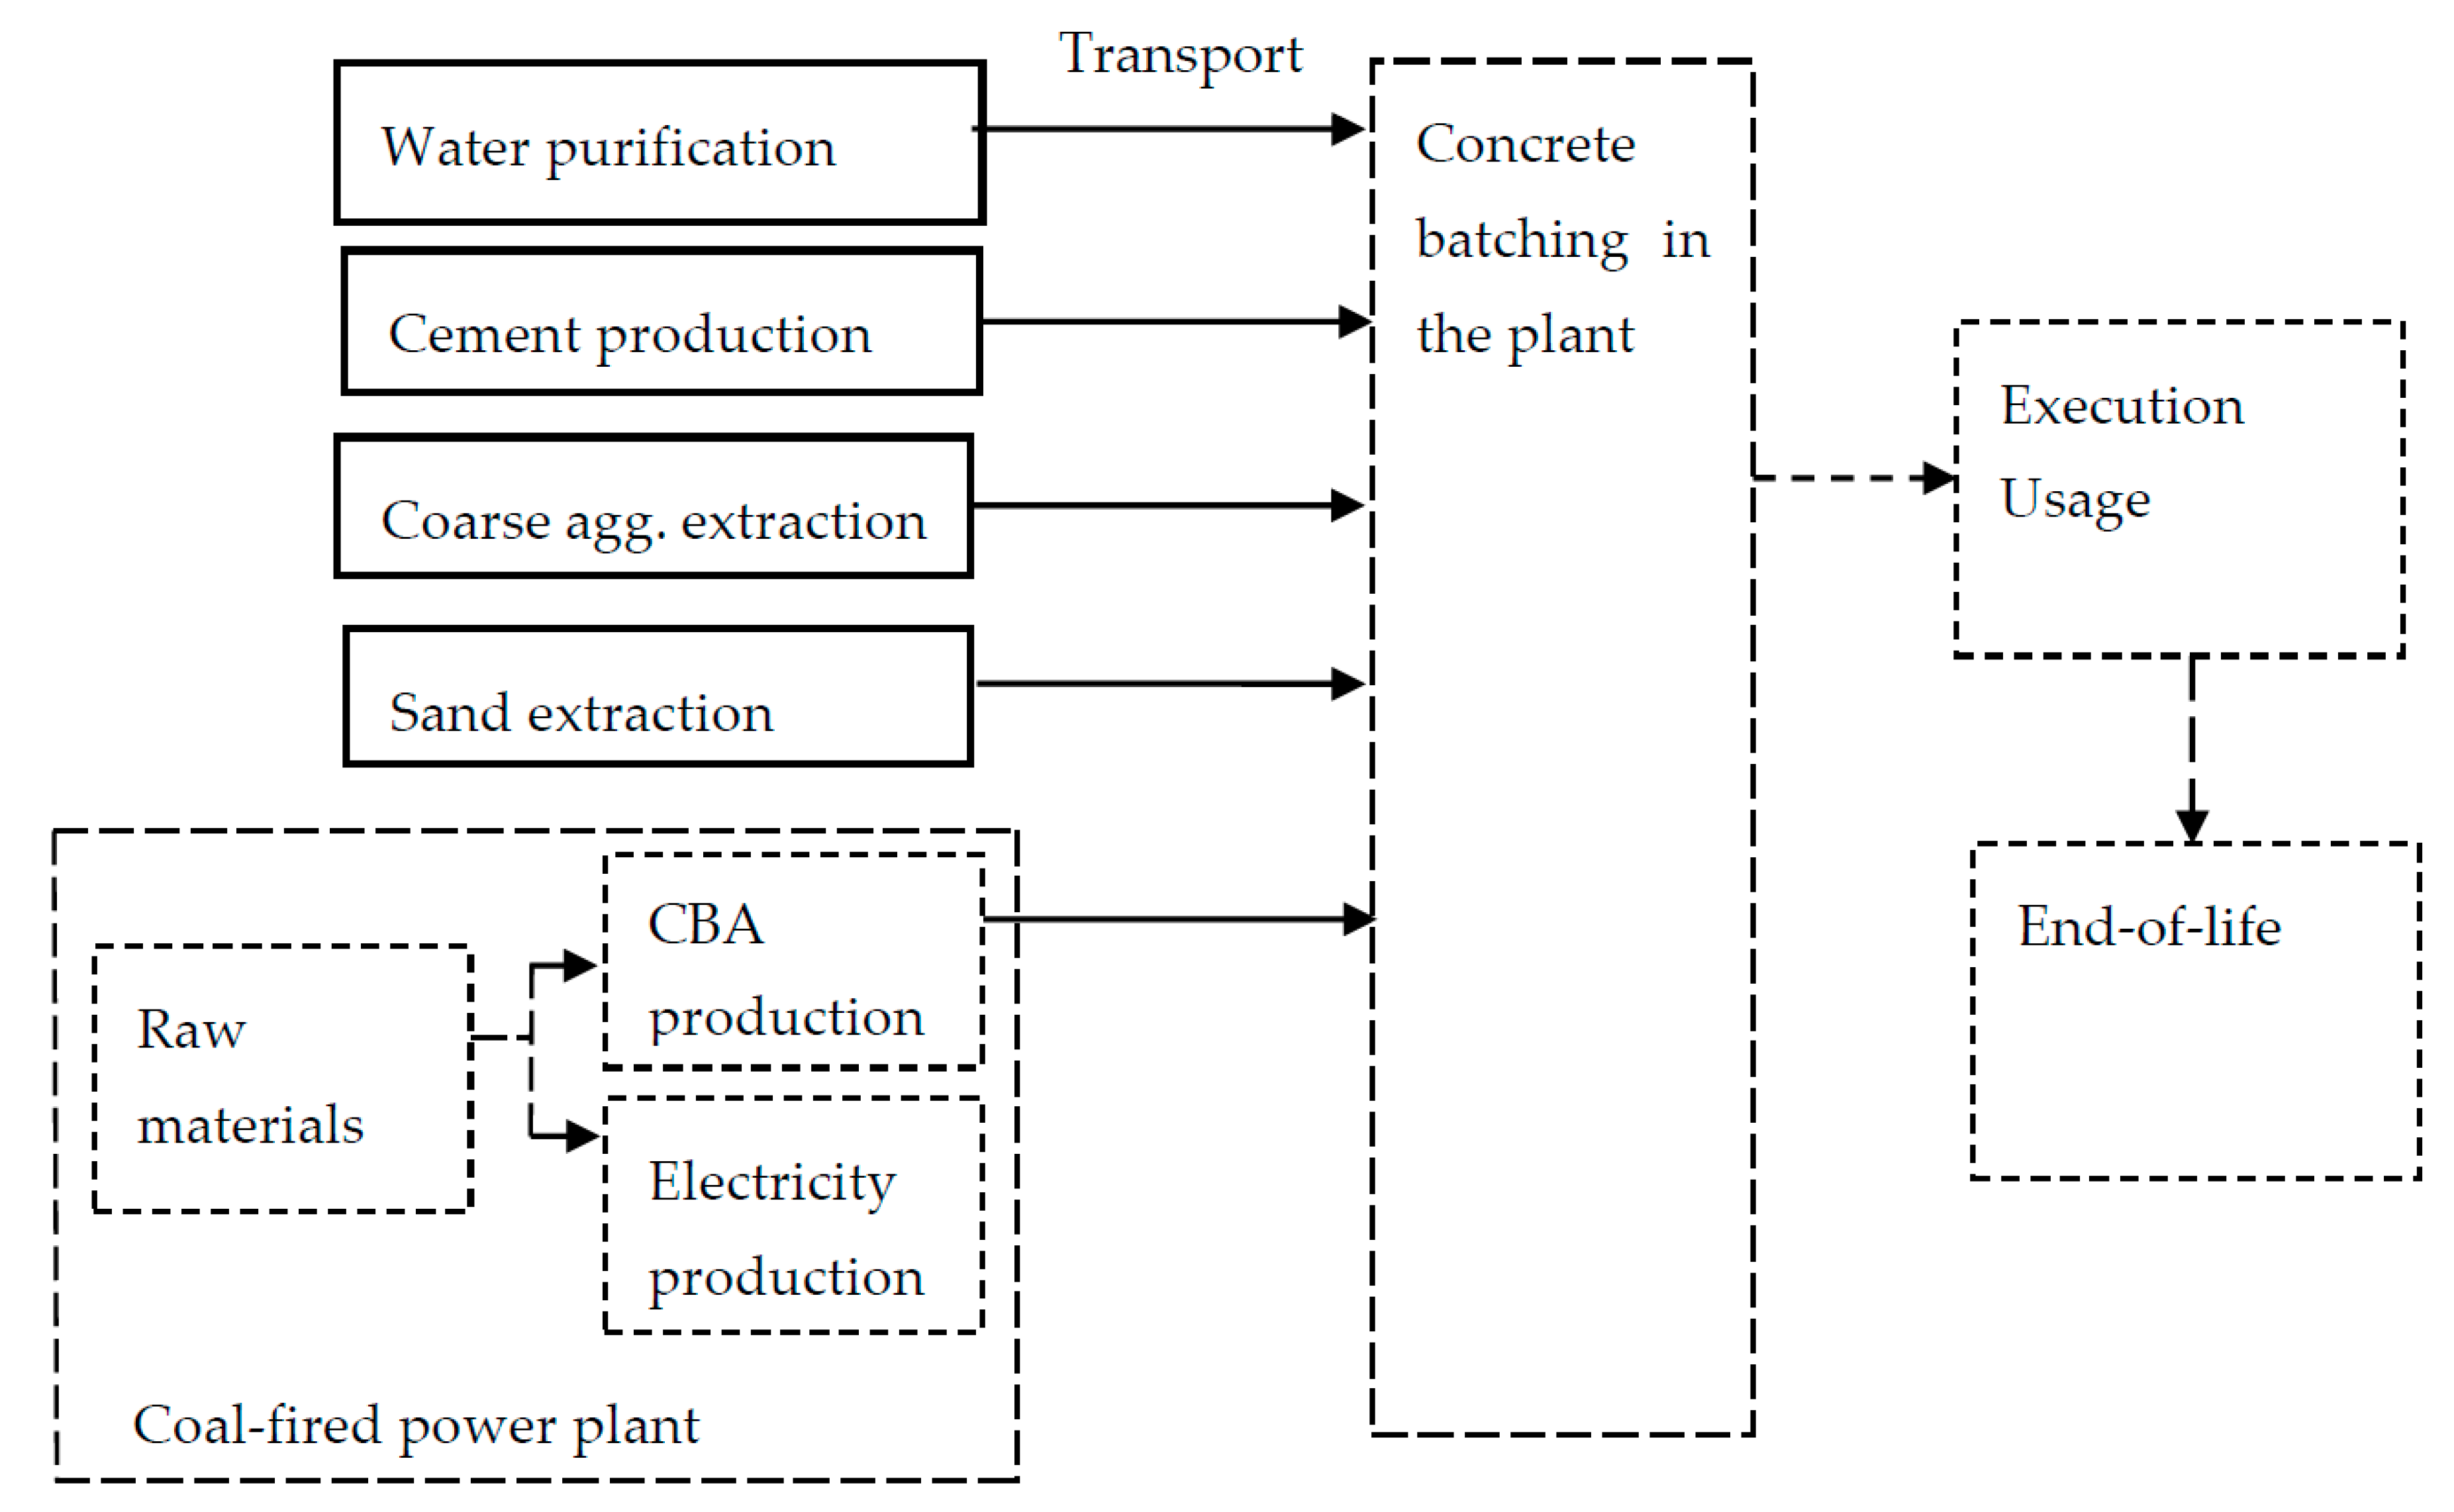
2.2. Life-Cycle Assessment

The LCA of concrete considers the following four stages: (i) Design, (ii) production/execution, (iii) usage phase, and (iv) end-of-life [16]. However, the execution of all these stages for concrete was not possible as different types of concrete are used for different specific building elements, such as columns, beams, walls, floors, and slabs [17]. Therefore, the usage phase could differ. For example, the concrete structure could serve as the foundation and load-bearing elements from 50 to 300 years, and the skin could serve as an exterior surface from 20 to 50 years [18]; thus, this stage is typically excluded from the LCA of concretes [19]. The LCA of the end-of-life stage is highly uncertain and influenced by the applied demolition and disposal practices [20]. Moreover, the environmental damage estimated from this stage was smaller than that of the production/execution stage [21]. Therefore, this study only conducted a “cradle-to-gate” LCA that evaluated the production of the concrete mixtures.
The FU is a reference unit, to which the inputs and outputs must be connected [11]. The production and use of 1 m3 of a concrete mixture with a designed 28-day compressive strength is an appropriate FU in the LCAs of concrete with the partial replacement of cement by byproduct additives [22]. However, the environmental performance of the compared structural concretes should be based on the same mechanical properties. Therefore, Gursel and Ostertag [14] normalized the FU by dividing the environmental assessment of 1 m3 of concrete according to the 28-day concrete compressive strength.
The concrete system boundaries studied here are presented in Figure 1. The production of concrete components, i.e., cement, water, and aggregates, was based on the Ecoinvent v3.5 [23] database (Table 3) owing to the absence of local Israeli data. According to the Ecoinvent v3.5 [23] database, cement production includes the production of mortar (raw material provision, raw material mixing, packing, and storage), transport to the plant, and infrastructure; the water processes included the infrastructure and energy used for water treatment and transportation to the end user; the extraction of gravel and sand included the whole manufacturing process involved in the digging of gravel and sand, transport, and infrastructure for operation; and transport included the extraction of crude oil and preparation for transportation to consumers in lorries fueled by diesel.
The analysis of secondary data was acceptable for the purposes of this study, which was restricted to comparing different methods of designing byproduct-based concretes. A truck was used to transport coarse aggregates and sand from a natural aggregate quarry to a concrete plant at a distance of 50 km, which is the distance between the quarry and concrete plant. A truck was also used to transport cement and CBA from the cement and coal-fired power plants, respectively, to the concrete batching plant at a distance of 100 km. For CBA processing, only the transportation of CBA from coal-fired power plants to concrete batching plants was evaluated. This is due to the uncertainties involved in the attributional and consequential modeling of byproducts [10]. In addition, changes in transport distances may contribute to the sensitivity of the LCAs of both the MIX-fixed-SLUMP and MIX-fixed-W/C concretes, namely, distances up to 50 km could bring environmental benefits, whereas distances more than 100 km could bring environmental damage.

2.3. ReCiPe2016: A Life-Cycle Impact Assessment (LCIA) Method

Goedkoop and Spriensma [24] introduced three perspectives from the cultural theory [25] for damage with proven effects: Individualist (I), (which considers the short-term effects, such as those within 100 years or less), egalitarian (E) (which considers all of the possible long-term damaging effects), and hierarchist (H) (where the short- and long-term damage are balanced based on a consensus regarding their effects). As mentioned earlier, these perspectives were adapted from the cultural theory framework of natural resources and perspectives on human nature: a hierarchy, which refers to the need to regulate nature; egalitarianism, which insists on resource depletion; individualism, which insists on self-expanding resources; fatalism, which supposes an infrequent abundance of resources; and autonomy, which involves living in a joyful involvement with nature [25].
Huijbregts et al. [26] updated the ReCiPe2008 method to the ReCiPe2016 and modified “the time horizon”: I, H, and E include 20, 100, 1000-year infinite time horizons. However, Huijbregts et al. [26] stated that “the time horizon for the third scenario [E] was not always infinite, as not all the environmental models provided sufficient information to model steady-state conditions.” These three scenario analyses (perspectives), I, H, and E, can be presented through the ReCiPe2016 midpoint and single-score methods [27]. In addition, the ReCiPe2016 single-score method includes two types of weighting procedures: Average and particular weighting sets. The average weighting set contains three methodological options, i.e., the individualist/average [I/A] hierarchicst/average [H/A], and egalitarian/average [E/A], and the particular weighting set contains another three methodological options, i.e., the individualist/individualist [I/I], hierarchist/hierarchist [H/H], and egalitarian/egalitarian [E/E] [28].
The use of the ReCiPe2016 midpoint method results in lower uncertainty in environmental evaluation and a more complex decision-making procedure when interpreting its results. In contrast, the use of the six methodological options of ReCiPe2016 single-score method results in higher uncertainty in environmental evaluation and a less complex decision-making procedure when interpreting the ReCiPe2016 single score results [28].
Therefore, both the MIX-fixed-W/C and MIX-fixed-SLUMP concretes were environmentally evaluated following two methods:
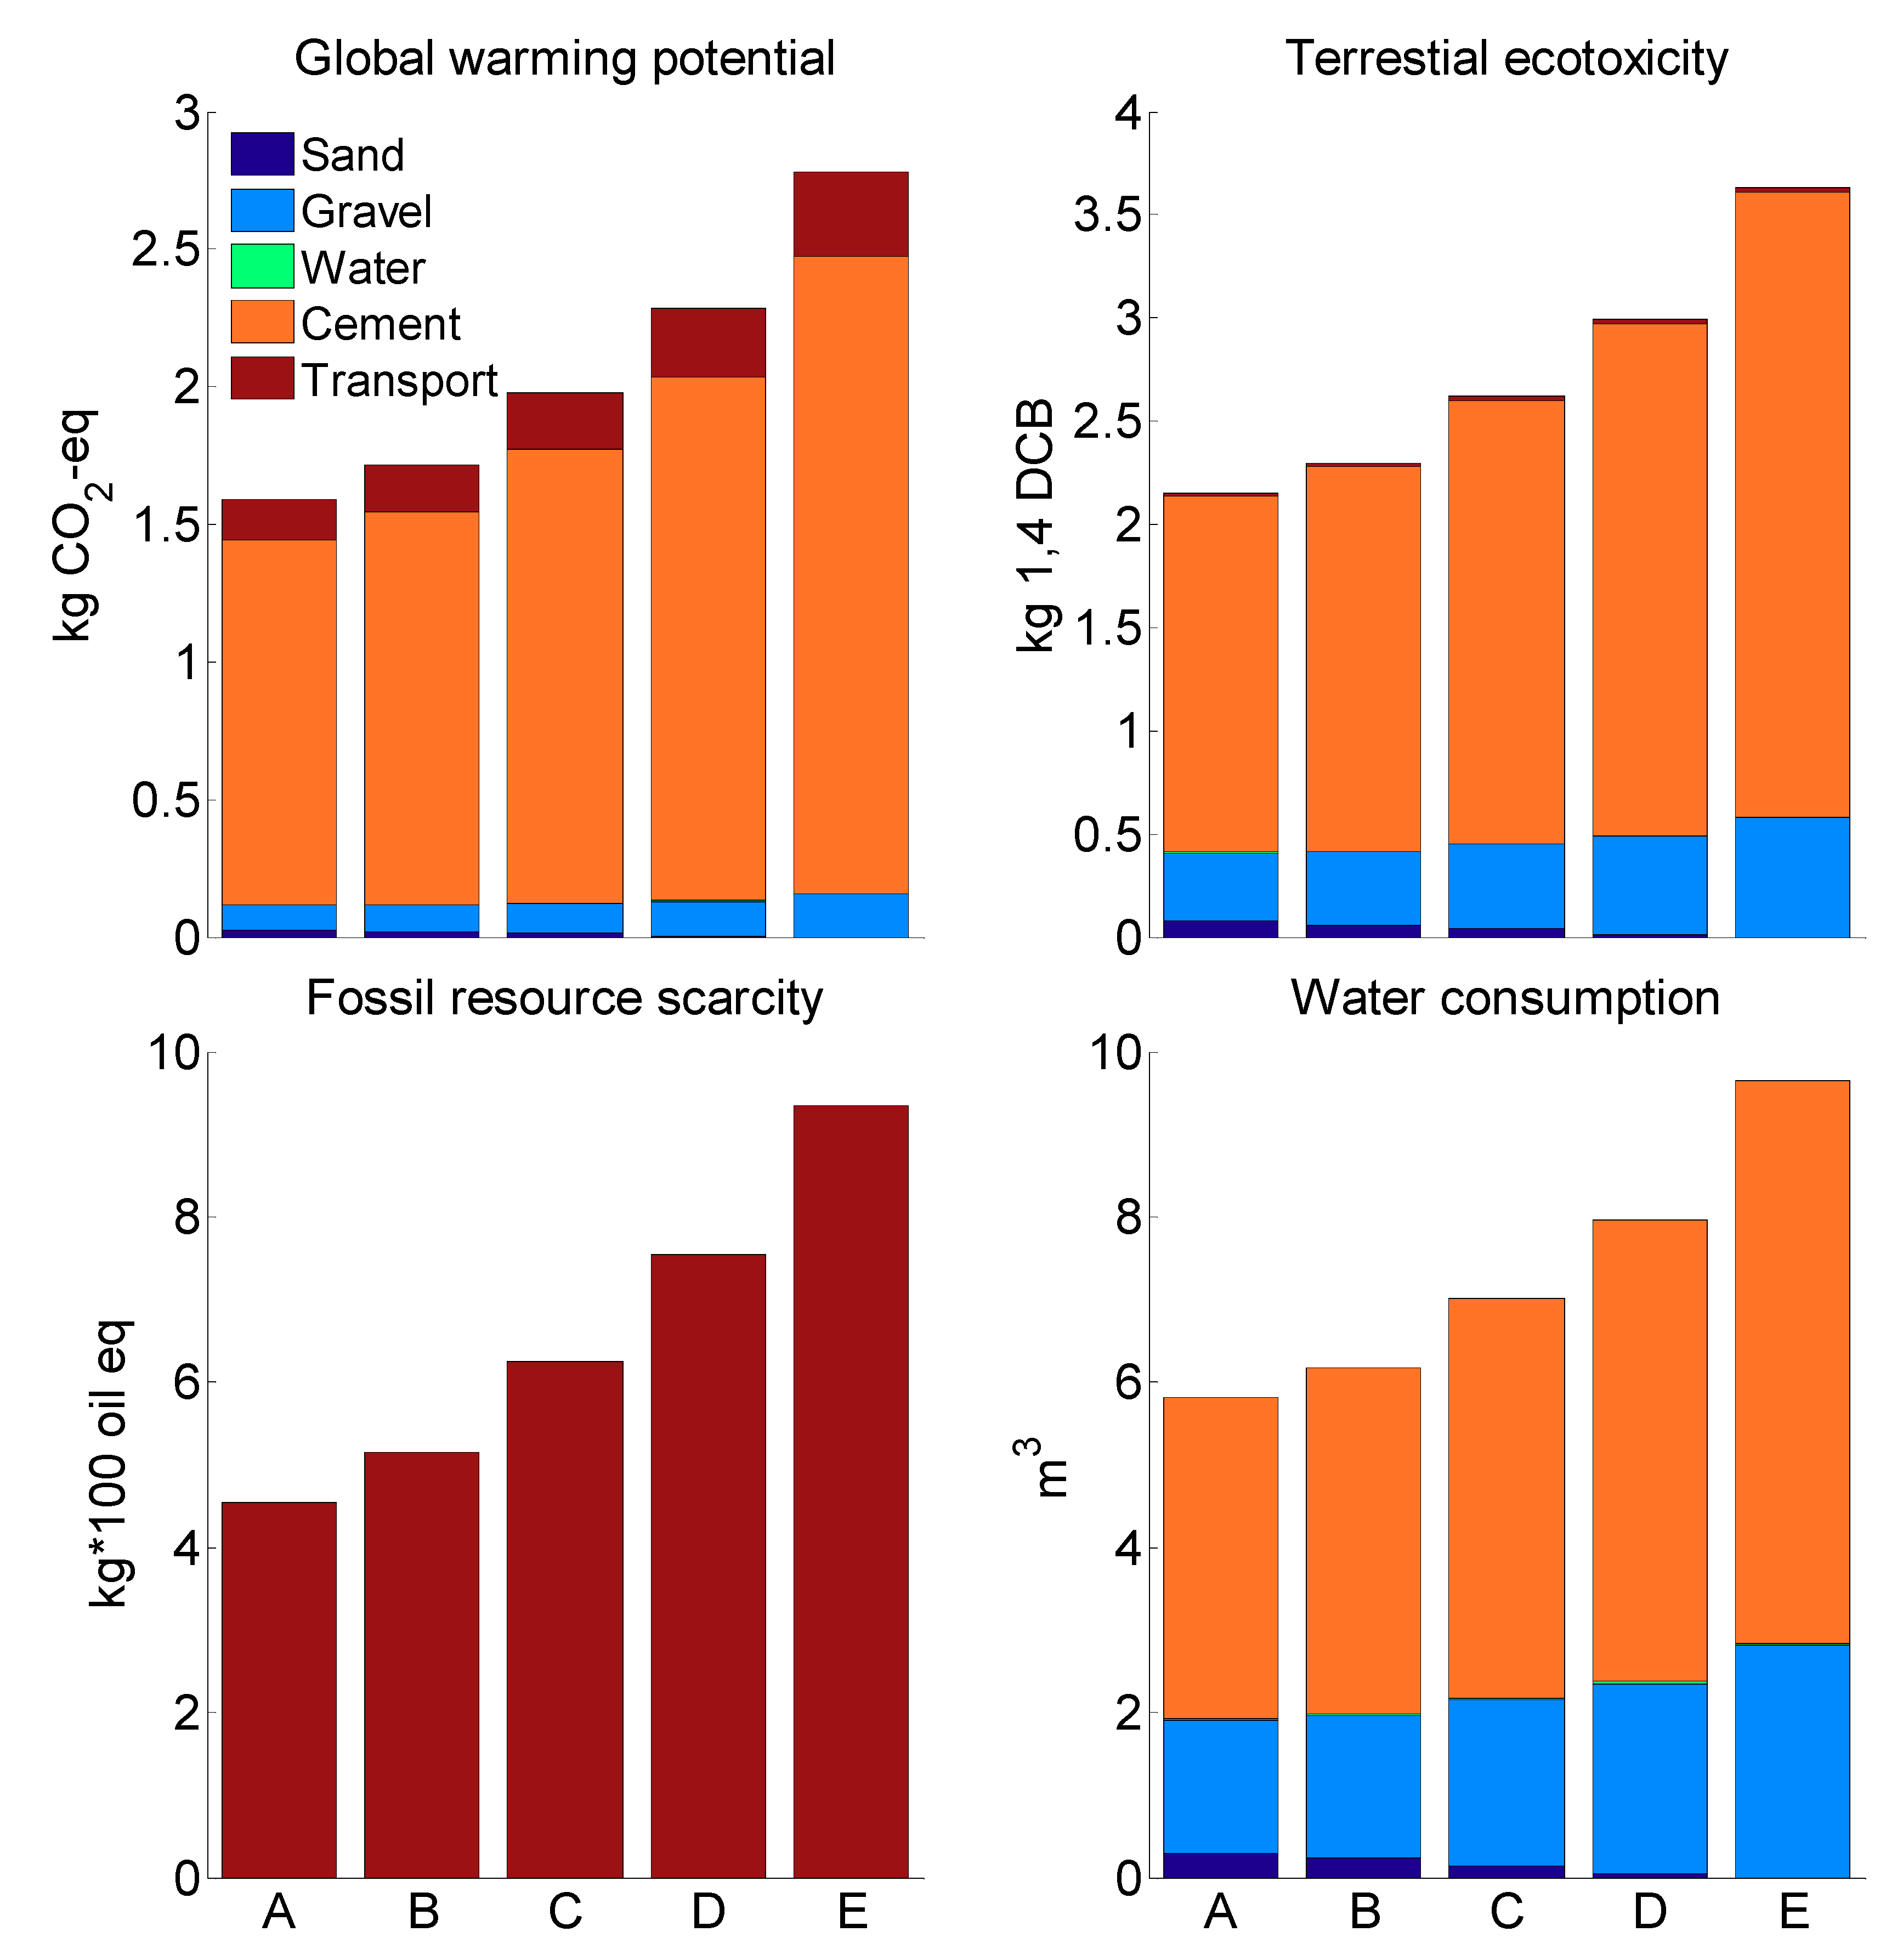
  • The ReCiPe2016 midpoint H method, evaluating the four most significant categories: GWP, terrestrial ecotoxicity (TE), fossil resources scarcity (FRS), and water consumption (WC).
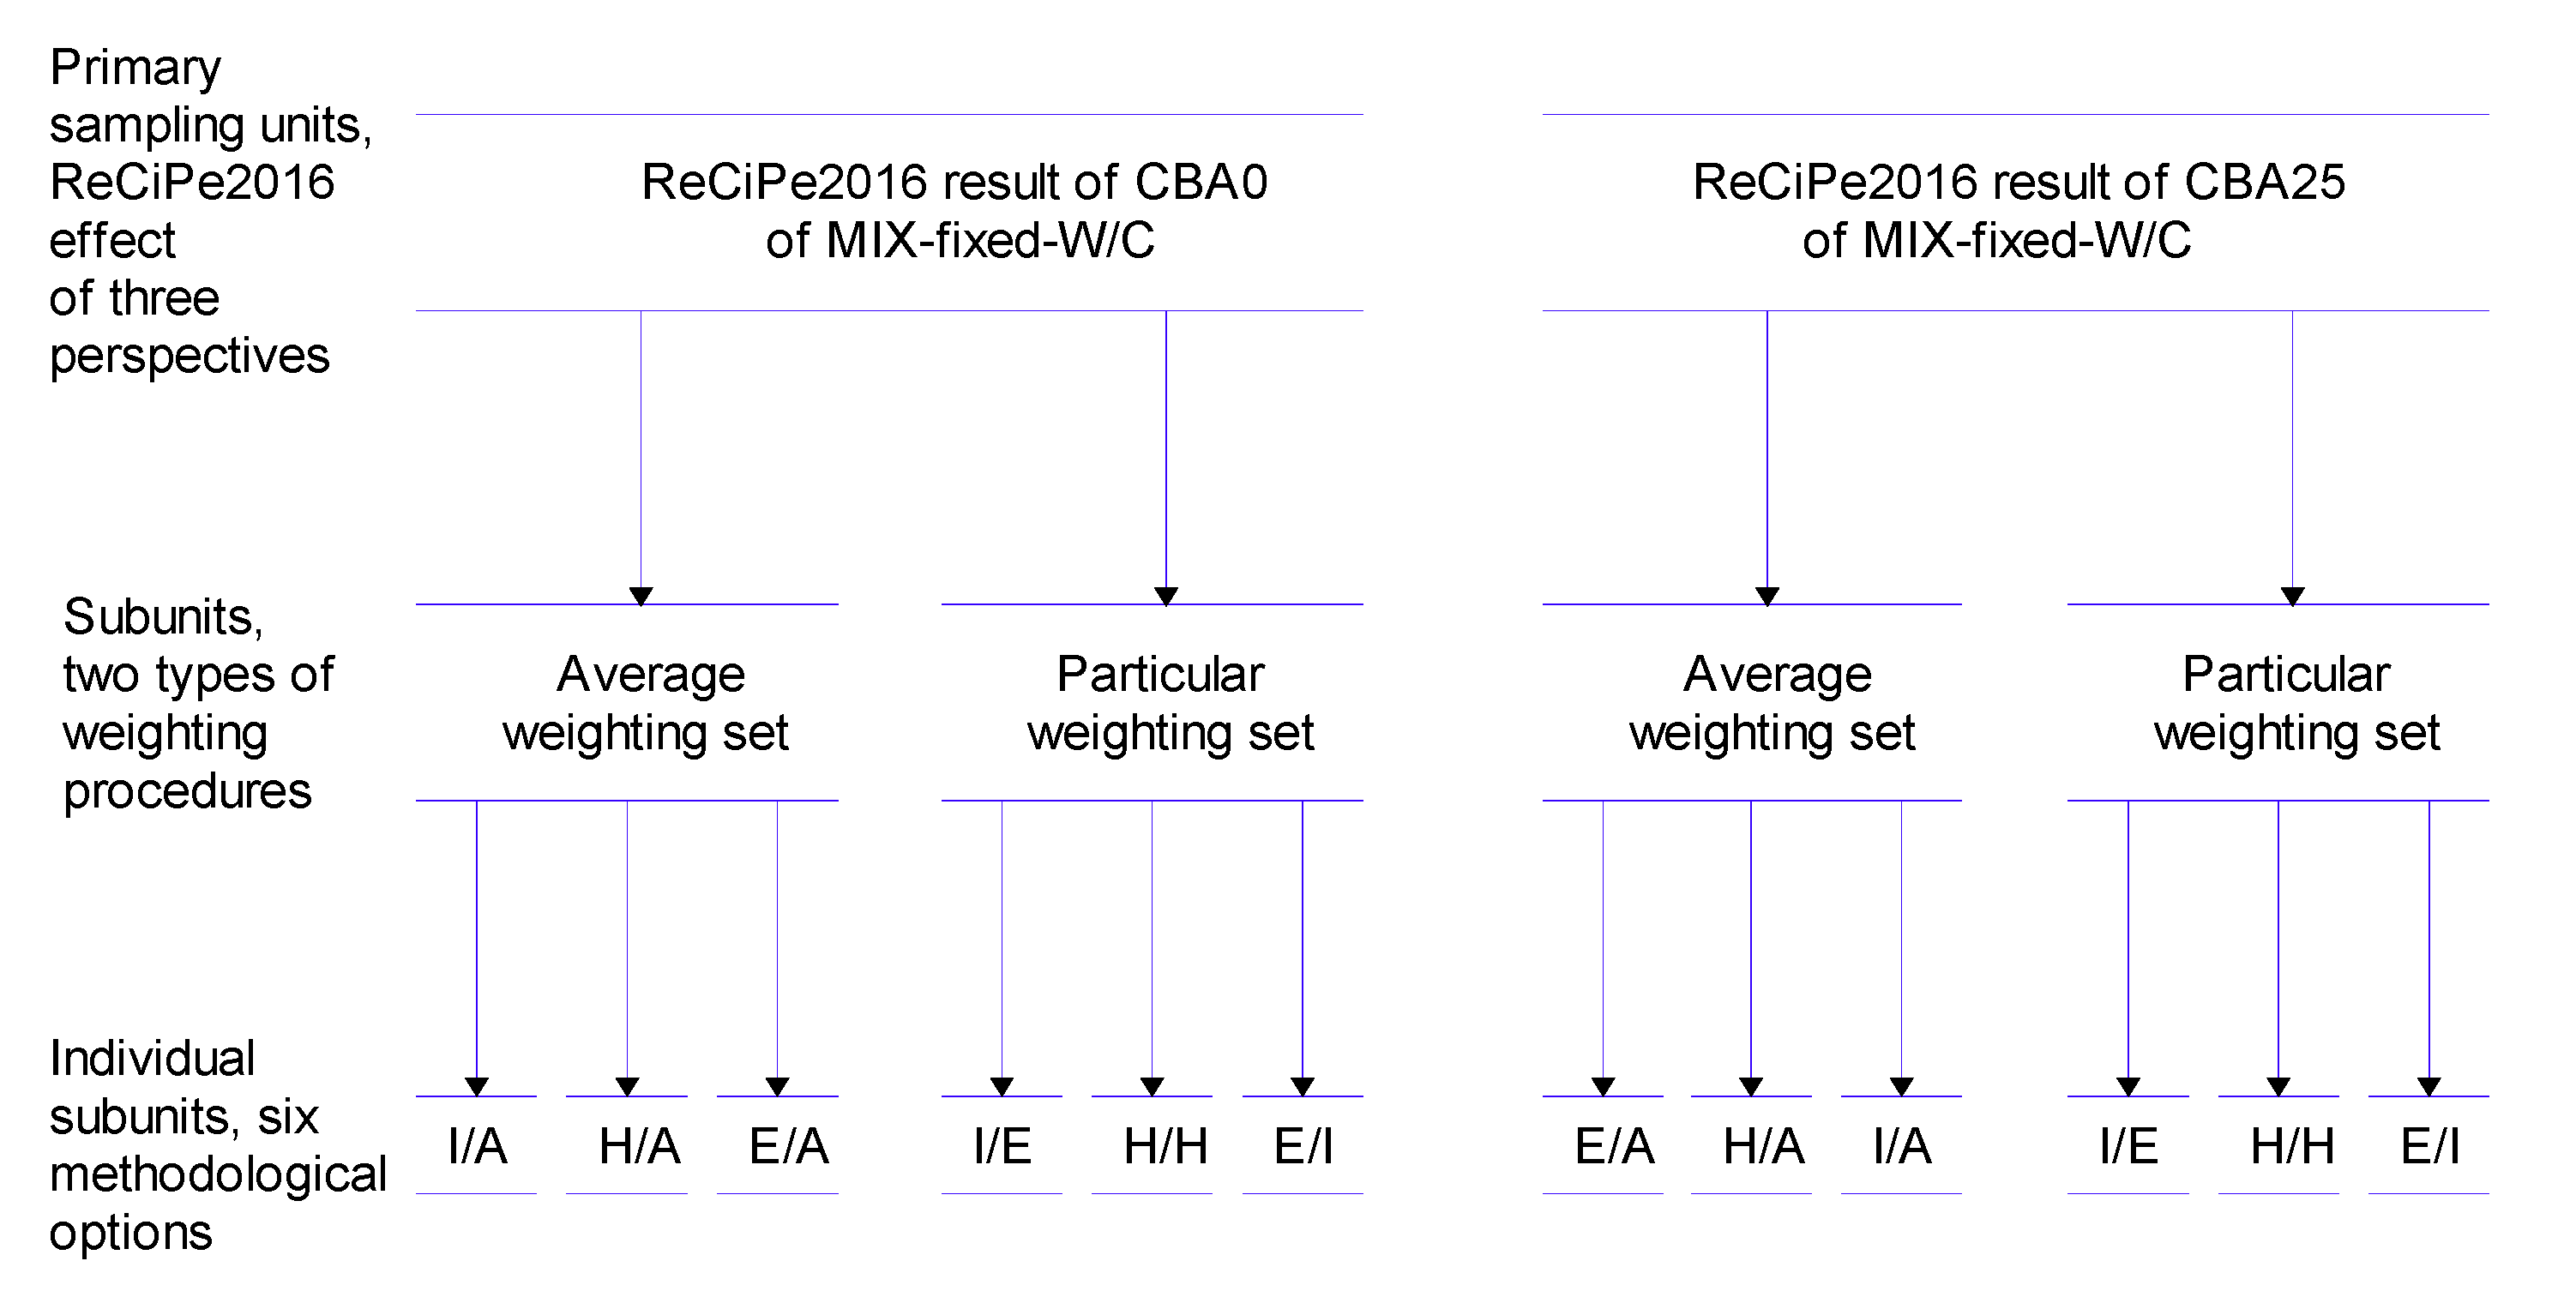
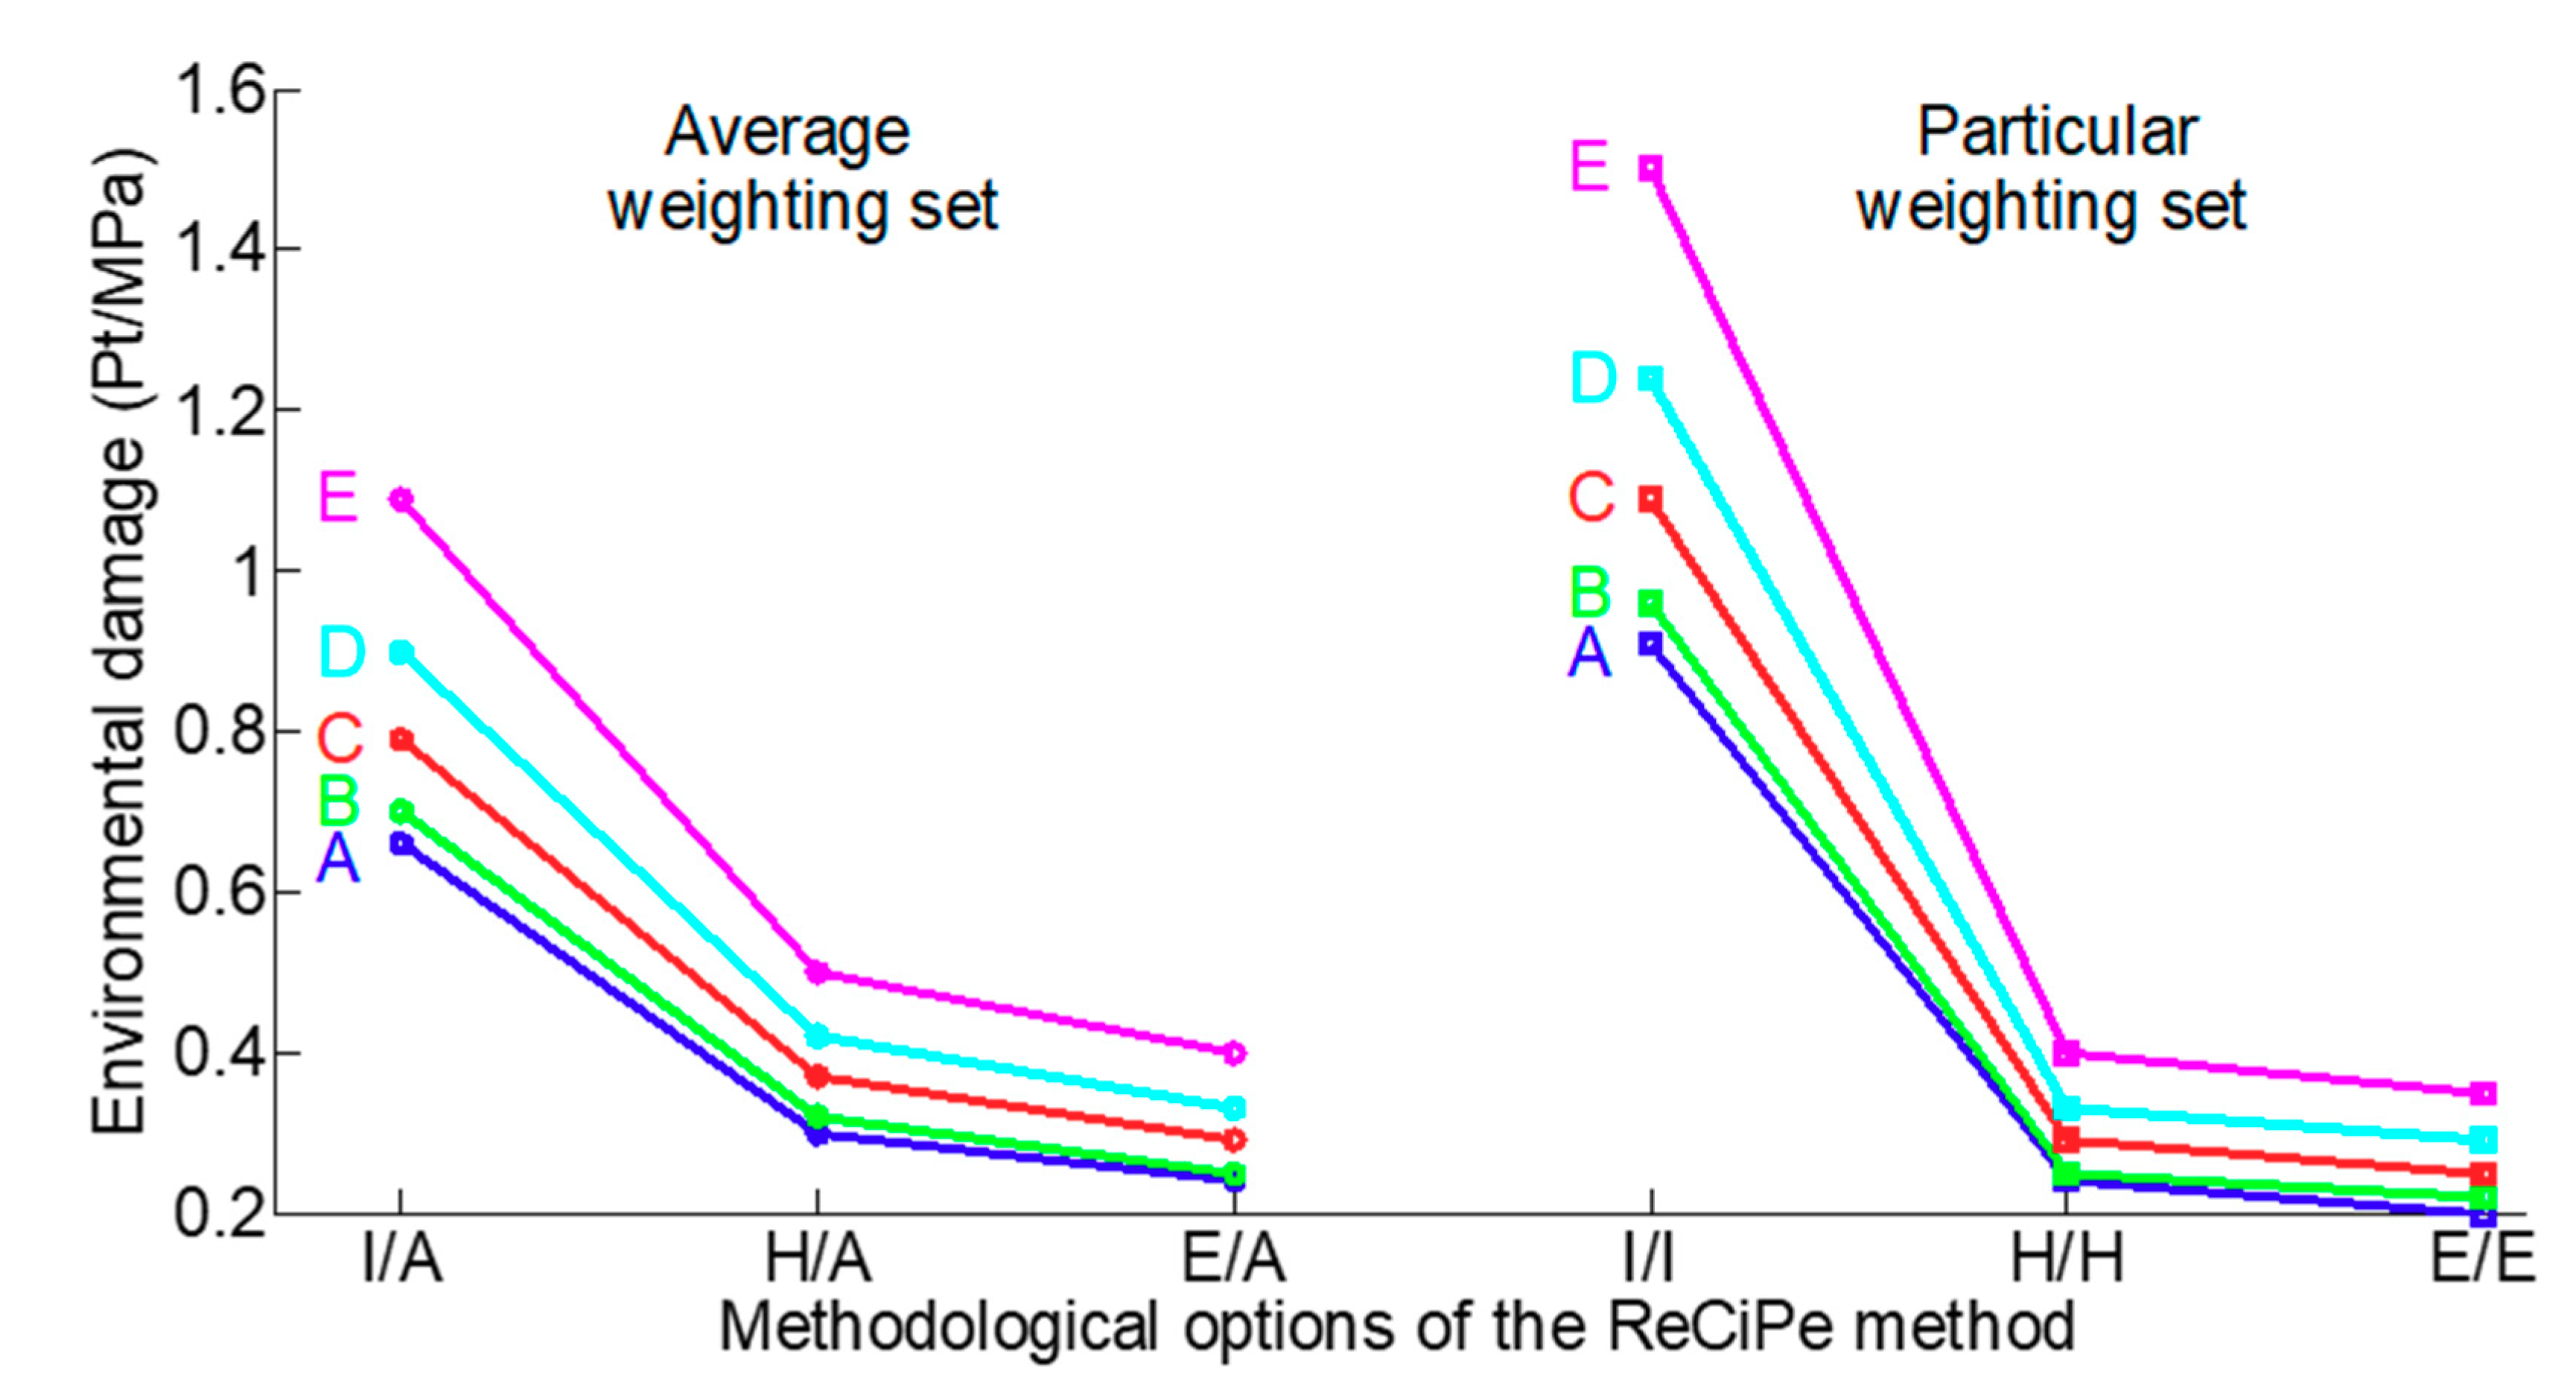
  • Six methodological options of the ReCiPe2016 single score method in combination with a two-stage nested (hierarchical) analysis of variance (ANOVA). The two-stage nested ANOVA was used to simultaneously evaluate the results of the six ReCiPe2016 single score methodological options [27].

2.4. Design Structure of Statistical Evaluations

The statistical evaluations were conducted in a two-step procedure: (i) The two-stage ANOVA model structure that was appropriate for the six methodological options of the ReCiPe2016 model was determined, and (ii) the ReCiPe2016 LCA results for the alternatives of the MIX-fixed-SLUMP and MIX-fixed-W/C concretes were statistically analyzed.

2.4.1. Design Structure of the Two-Stage ANOVA Model

To correctly use a two-stage nested ANOVA model, Picquelle and Mier [29] recommended a structure based on the following statistical terminology: Sampling frame, primary sampling unit, subunits, and individual subunits. The sampling frame was defined as the collection of all elements (primary sampling units) accessible for sampling in the population of interest. The primary sampling unit is an element within the sampling frame that is sampled and statistically independent of the other sampling units within the frame. A two-stage nested ANOVA model includes the primary unit, within which subunits are nested, and a subunit, within which individual subunits are nested. Measurements were collected from the individual subunits.
Two primary sampling units, i.e., the ReCiPe2016 result of a CBA0 mix and the ReCiPe2016 result of a CBA25 mix of MIX-fixed-W/C, are shown in Figure 2. The primary sampling unit included two subunits, i.e., the particular and average weighting sets, and each subunit included three individual subunits (a total of six methodological options). Measurements were collected from the individual subunits. Therefore, five alternatives (CBA0, CBA25, CBA50, CBA75, and CBA100) for each of the MIX-fixed-SLUMP and MIX-fixed-W/C concretes were compared in pairs.

2.4.2. Statistical Analysis

First, the ReCiPe2016 results were multiplied by 103 and log10-transformed. The differences between the two ReCiPe2016 results were then analyzed using a two-stage ANOVA with degrees of freedom (df) df1 = 1 df2 = 2. The p-values were evaluated according to the three-valued logic: “appears to be positive”, “appears to be negative”, and “judgment is suspended” [30]. Therefore, in this study, the logic values were “there appears to be a MIX-fixed-SLUMP or MIX-fixed-W/C alternative difference”, “there does not appear to be a MIX-fixed-SLUMP or MIX-fixed-W/C”, and “judgment was suspended with respect to the MIX-fixed-SLUMP or MIX-fixed-W/C”.

3. Results

3.1. MIX-Fixed-SLUMP

3.1.1. The ReCiPe2016 Midpoint

Pairwise comparisons between CBA0, CBA25, and CBA50 exhibited consistent decreases in the impacts of GWP, TE, and WC. However, there were no differences between CBA75 and CBA100 when the sand in the concrete was sequentially replaced with CBA, as shown in Figure 3. These results indicated the influence of two responsible and multidirectional factors. The first is the reduction in sand and water production, while the second is an increase in the transport load due to the transportation of CBA from the coal-fired power plant to the local concrete batching plant and gravel production. Consequently, the impacts of GWP, TE, and WC for concrete from CBA0 to CBA75 indicate that the effect of a decrease in the production of sand and water was greater than the increase in the traffic load and production of gravel. From CBA75 to CBA100, the magnitudes of the effects of the decrease in sand and water production and increase in traffic load on the GWP, TE, and WC were similar. In contrast, the impact of FRS gradually increased from CBA0 to CBA100 with the sequential replacement of sand with CBA in concrete (Figure 3). In this case, the transportation load of CBA is a responsible factor.
During the transition from CBA0 to CBA100, the 28-day compressive strength of concrete remained approximately the same, at 56–65 MP, as shown in Table 1. Therefore, the normalization of the FU relative to the 28-day compressive strength of concrete was not a responsible factor in the reduction of the impacts of GWP, TE, and WC, and the increase of the impact of FRS impact in CBA-based concretes.

3.1.2. Six ReCiPe2016 Single Score Methodological Options

The environmental damage caused by the different concretes decreased in the following order: CBA0 > CBA25 > CBA50 > CBA75 > CBA100 (Figure 4). This ranking was exhibited for almost all ReCiPe2016 single-score methodological options. However, for option E/E, the positions of CBA75 and CBA50 were switched.
According to the p-values, the differences between CBA0 and CBA75, CBA0 and CBA100, CBA25 and CBA750, and CBA25 and CBA100 appeared to be positive (0.0104 ≤ p ≤ 0.0142). Meanwhile, the differences between CBA0 and CBA25, CBA50 and CBA75, and CBA75 and CBA100 appeared to be negative (0.1203 ≤ p ≤ 0.4137). The judgment was suspended for the differences between all remaining pairs (0.0251 ≤ p ≤ 0.0904) (Table 4). Thus, according to the rankings (Figure 4) and p-value analysis (Table 4) of the LCA results for the five MIX-fixed-SLUMP concretes, CBA100, CBA75, and CBA50 were the best concretes causing the least environmental damage, while CBA25 and CBA0 were the worst concretes causing the most environmental damage.

3.2. MIX-Fixed-W/C

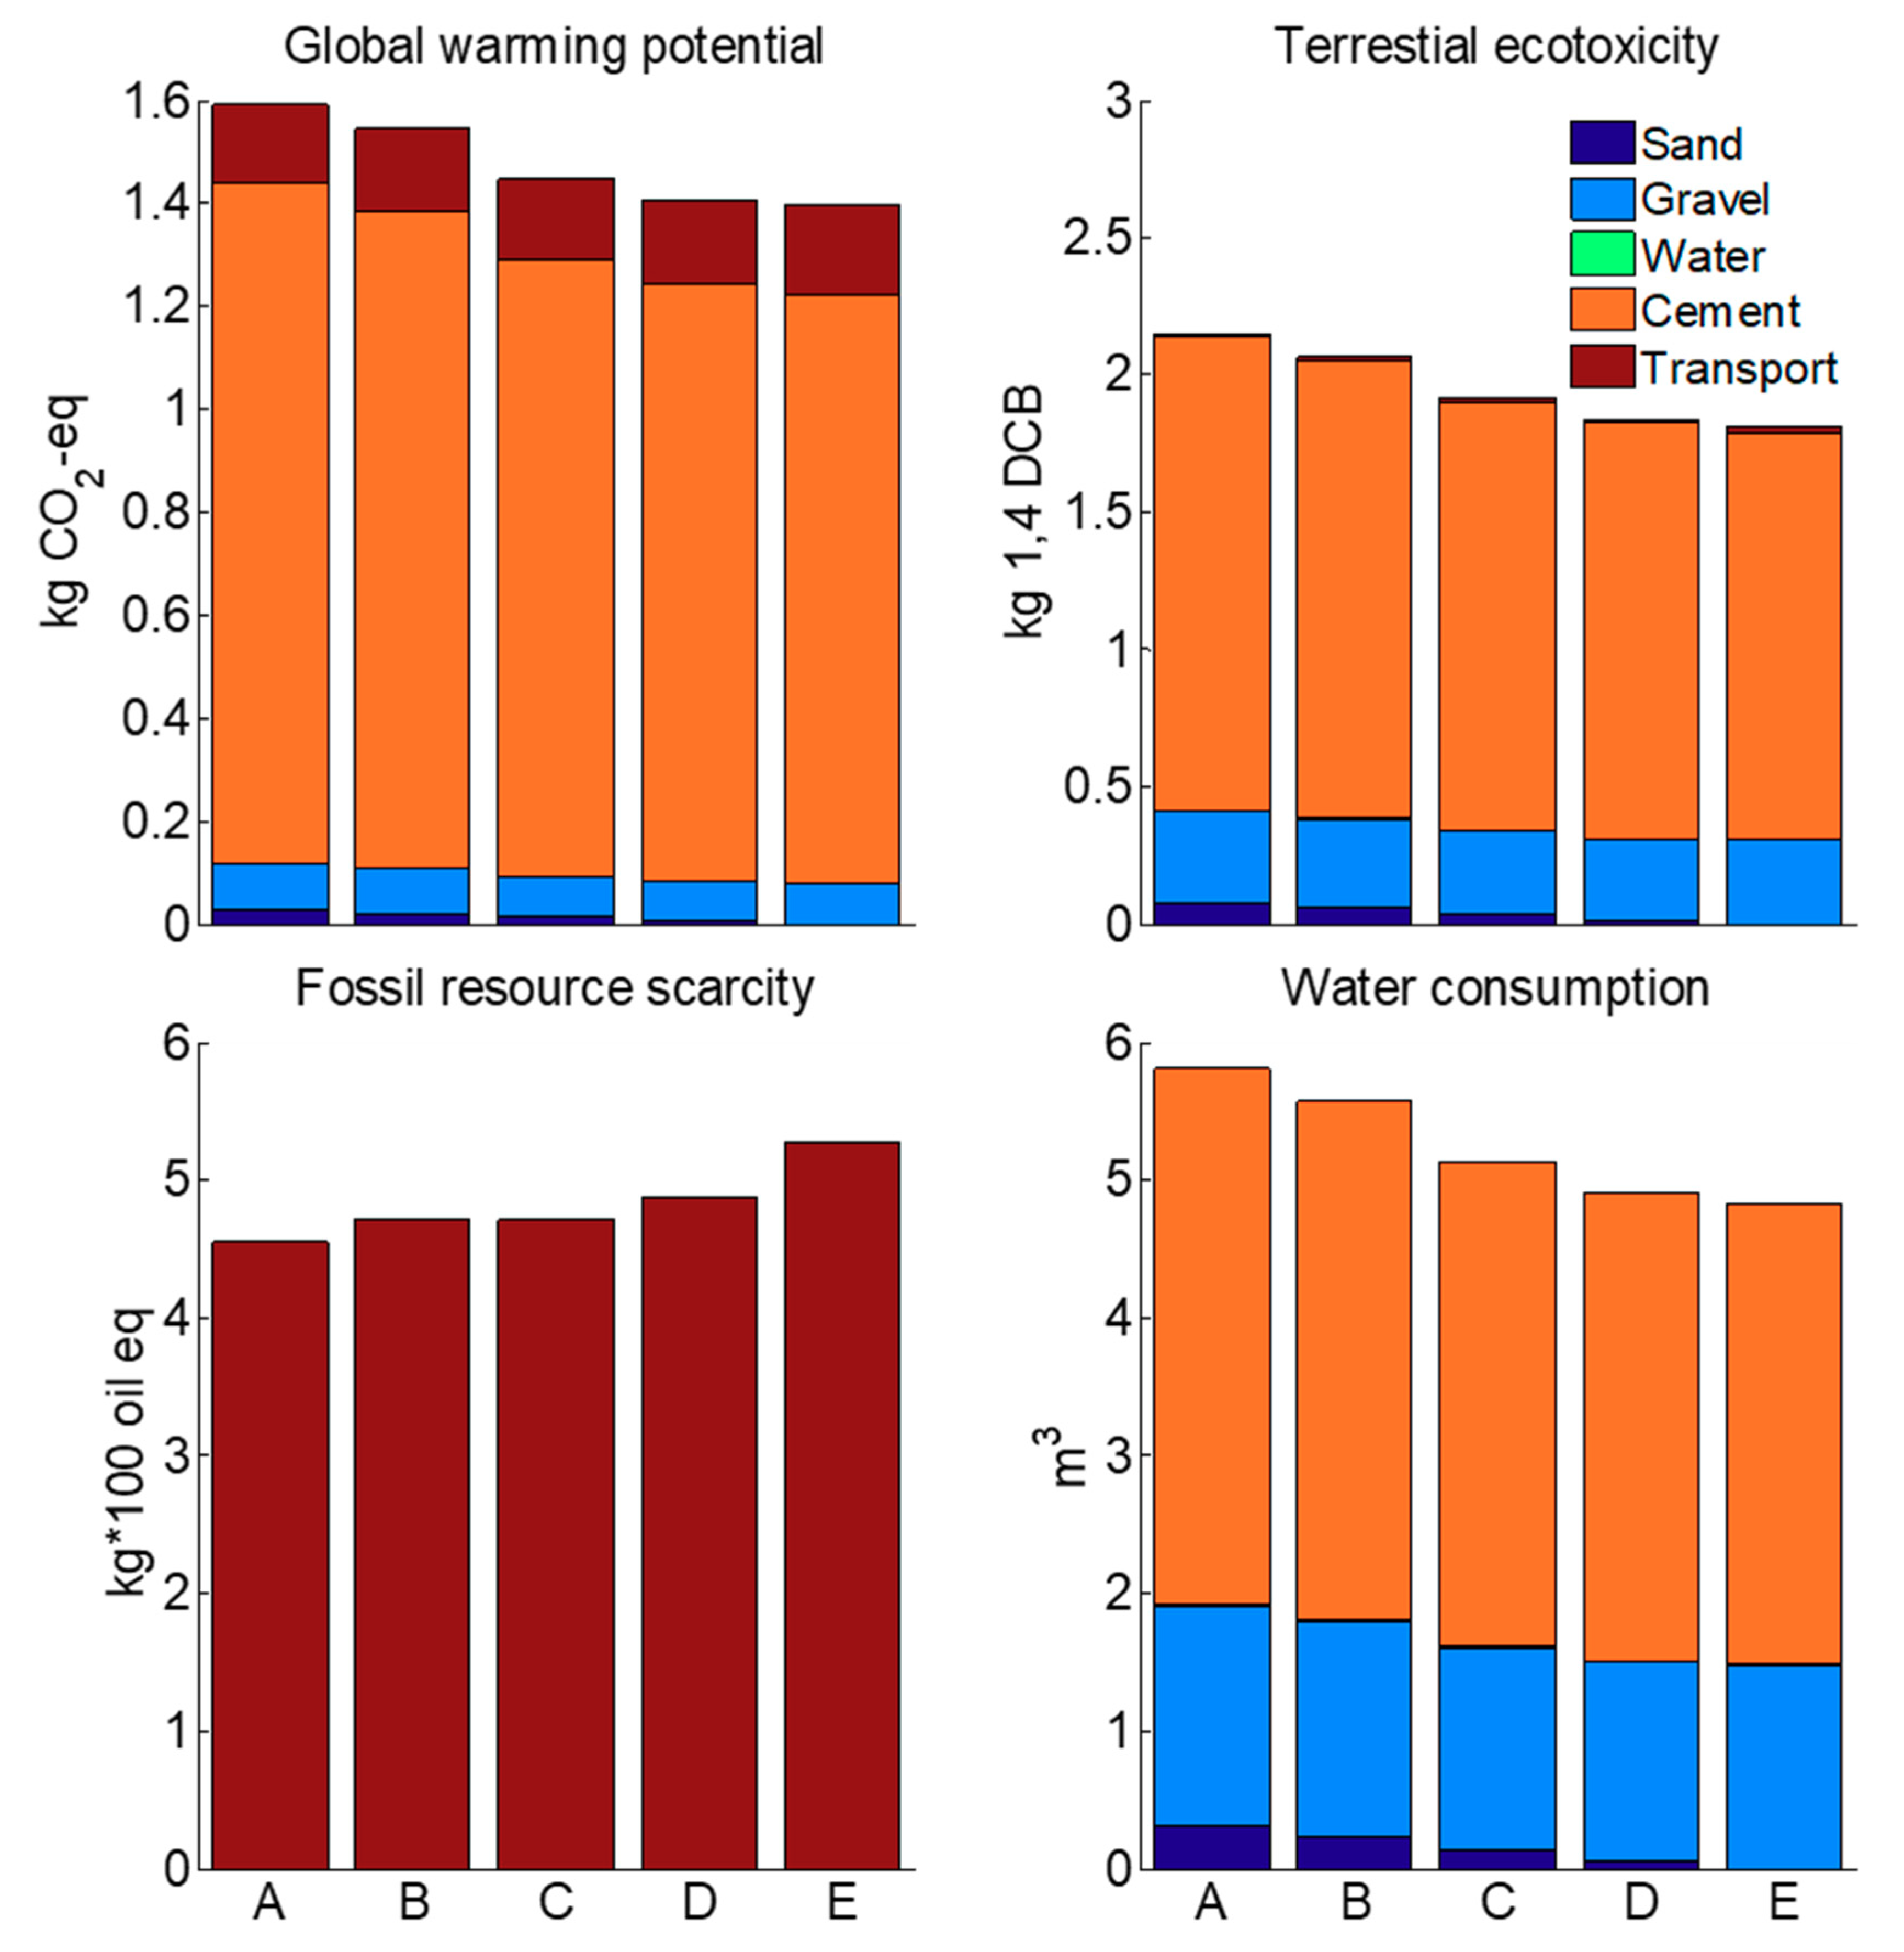
3.2.1. ReCiPe2016 Midpoint

Pairwise comparisons between CBA0, CBA25, CBA50, CBA75, and CBA100 exhibited a gradual increase in the impacts of GWP, TE, FRS, and WC, as shown in Figure 5. According to the analysis of three impacts, i.e., GWP, TE, and WC, there were two multidirectional and responsible factors: Sand production and the transportation of CBA from the coal-fired power plant to the local cement plant, the magnitudes of the influences of which were similar. However, from CBA0 to CBA100, the 28-day concrete’s compressive strength decreased considerably from 56 to 32 MPa, as shown in Table 2. The decrease in the 28-day compressive strength of concrete led to an increase in GWP, TE, WC, and FRS when the FU was normalized to the 28-day concrete compressive strength. The combination of the unidirectional responsible factors due to the transition from CBA0 to CBA100, the decreased 28-day compressive strength of the concrete, and the transportation of CBA from the coal-fired power plant to the local cement plant led to a significant increase in the impact of FRS.

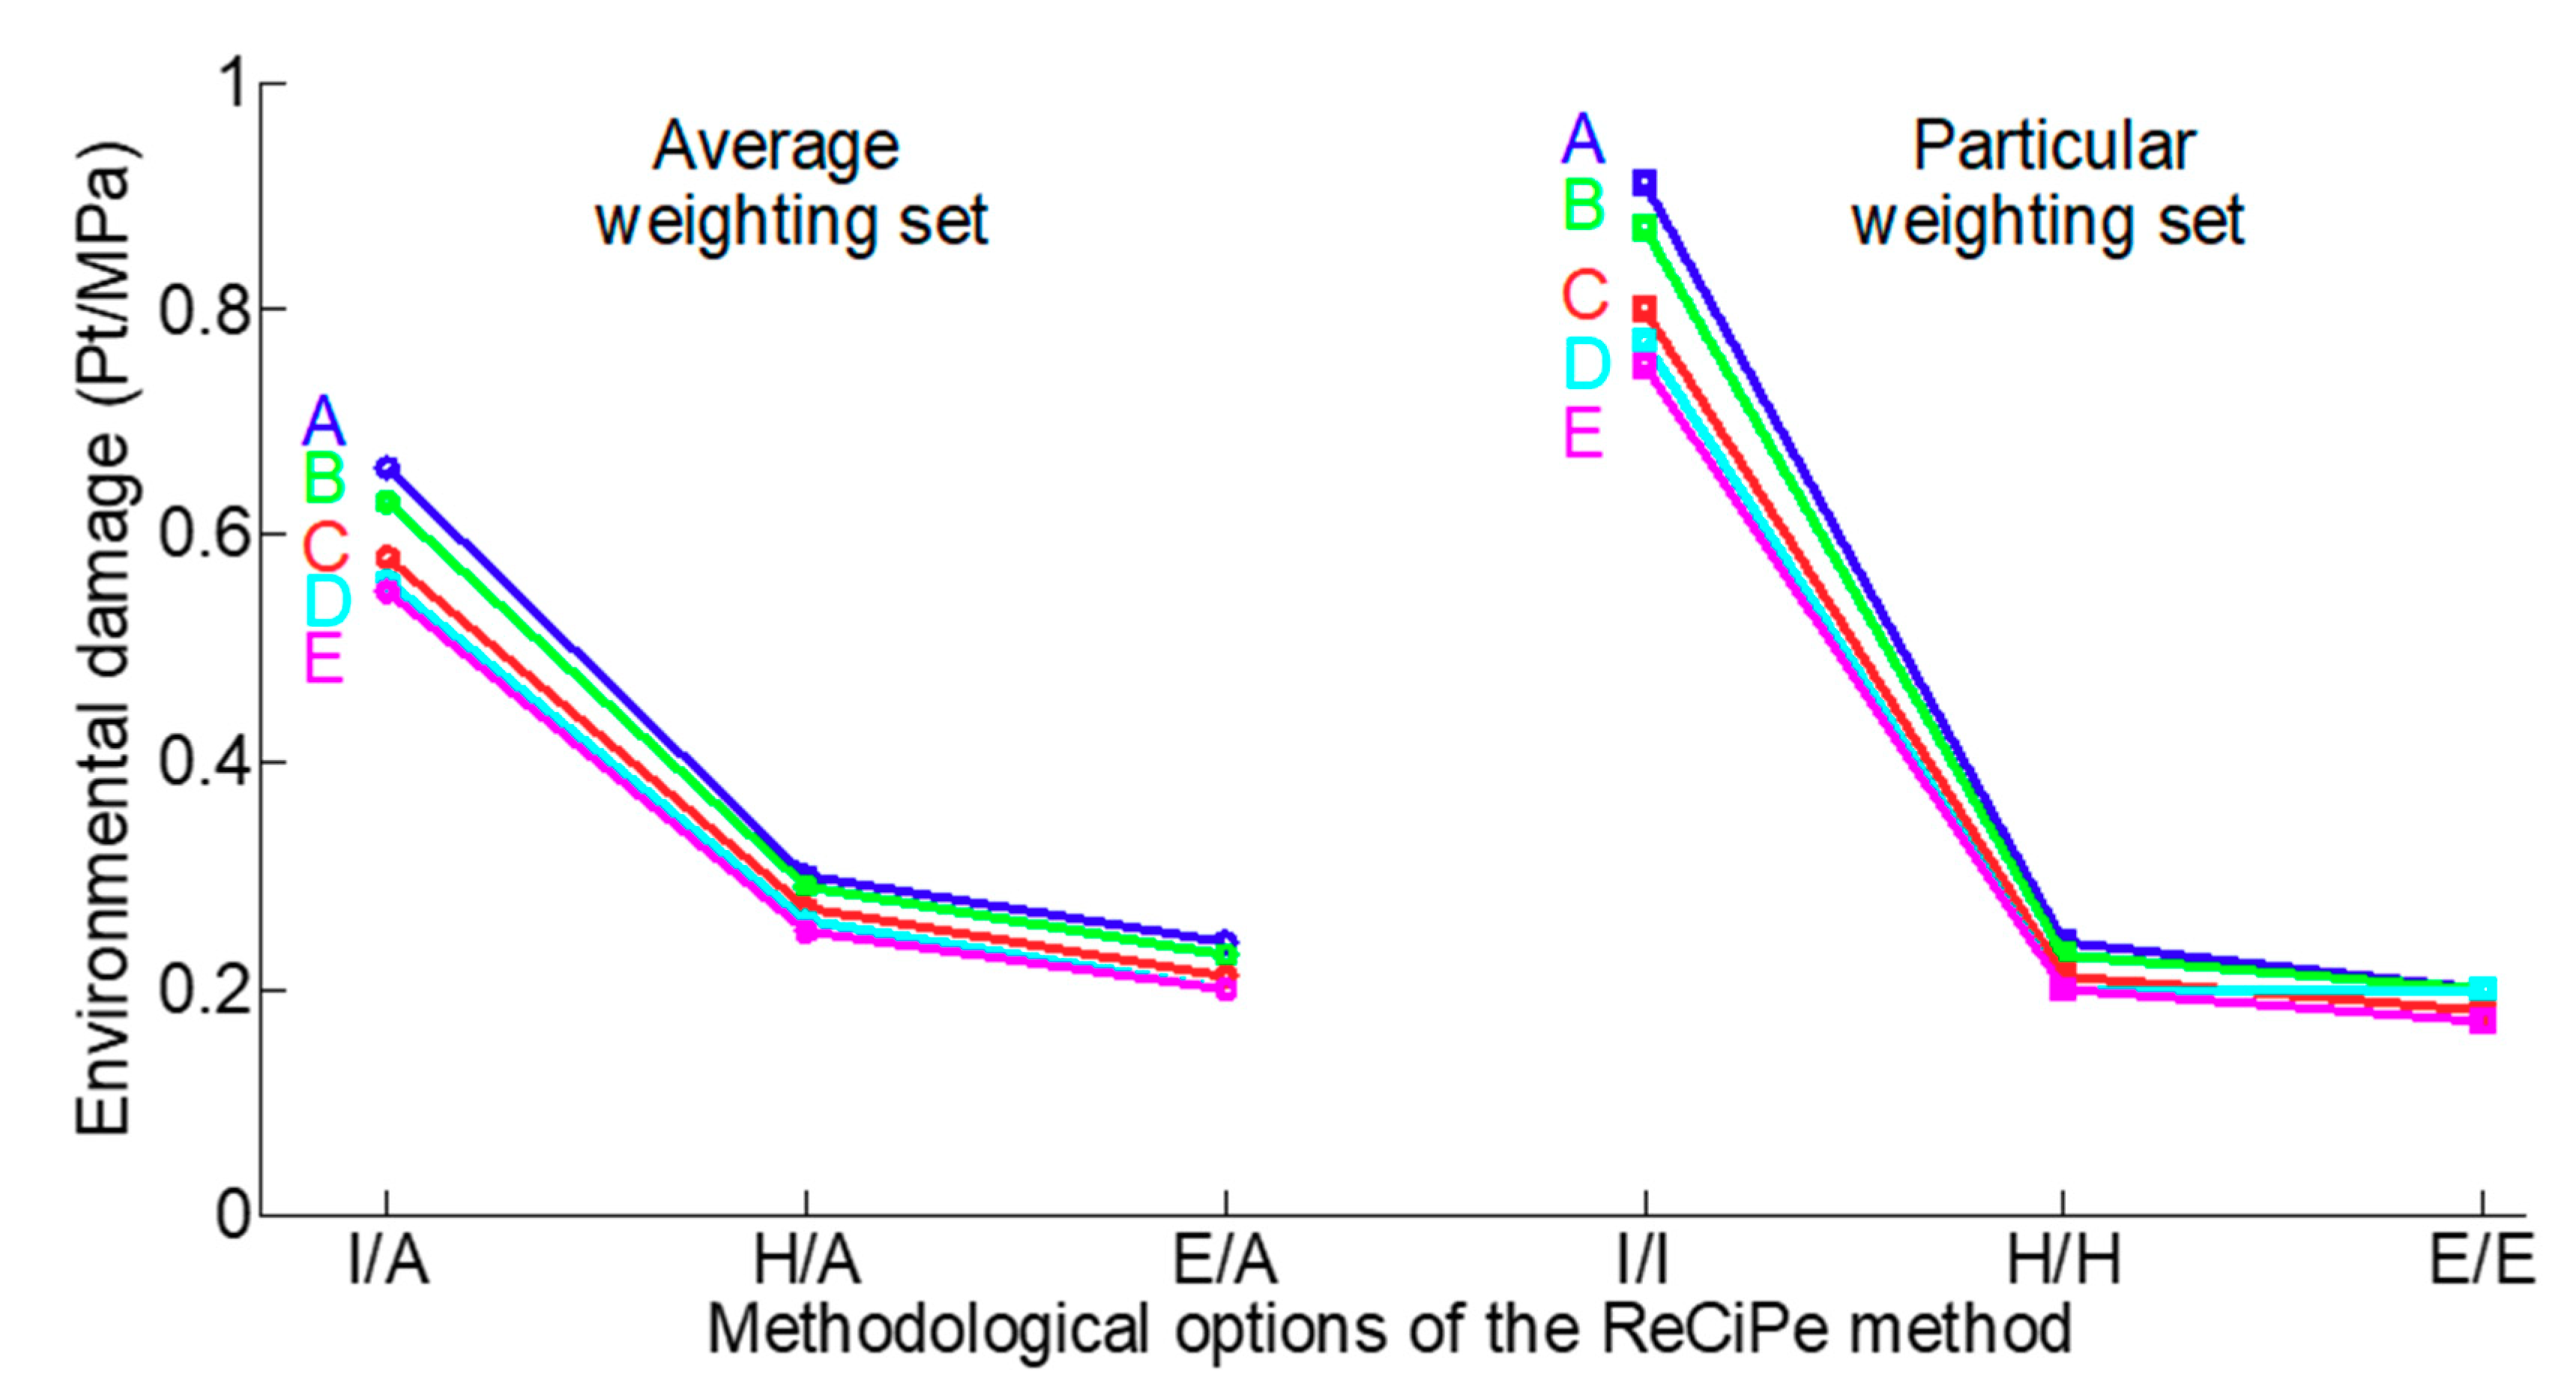
3.2.2. Six ReCiPe2016 Single Score Methodological Options

The environmental damage caused by the concretes increased in the following order: CBA0 < CBA25 < CBA50 < CBA75 < CBA100 (Figure 6). It should be noted that this ranking was held for all ReCiPe2016 single score methodological options.
However, in this case, additional information obtained from the p-values was available: Judgment was suspended for the difference between concretes CBA0 and CBA25 (p = 0.0750), while the difference between all the other pairs appeared to be positive (0.0009 ≤ p ≤ 0.0123) (Table 5). Thus, according to the ranking (Figure 6) and p-value analysis (Table 5) of the LCA results for the five MIX-fixed-W/C concretes, CBA0 and CBA25 were the best concretes, causing the least environmental damage, while CBA50, CBA75, and CBA100 (in ascending order of their environmental damage) were the worst, causing the most damage.

4. Discussion

A cradle-to-gate LCA of replacing sand in concrete with CBA was conducted. Five concrete alternatives, i.e., CBA0, CBA25, CBA50, CBA75, and CBA100, with 0, 25, 50, 75, and 100 wt.% of sand replacement, respectively, were considered. Two mixture design methods, i.e., MIX-fixed-SLUMP (concrete mixtures with a fixed slump range of 60–80 mm) and MIX-fixed-W/C (concrete mixtures with a fixed W/C of 0.52), which resulted in different component qualities of concrete mixtures, were used to environmentally evaluate the concrete production using two levels of ReCiPe2016 methods: (i) The ReCiPe2016 midpoint H method, which considers four of the most significant environmental impacts, namely GWP, TE, FRS, and WC, and (ii) the six methodological options of the ReCiPe2016 single-score method.
The results showed that the trends of the CBA-based concretes designed with the two concrete mix design methods were controversial. First, the environmental impacts/damages were reduced when sand was replaced with CBA for MIX-fixed-SLUMP concretes. Second, the environmental impacts/damages were increased by replacing sand with CBA for the MIX-fixed-W/C concretes. These controversial trends were confirmed via the ReCiPe2016 midpoint method (Figure 3 and Figure 5) and the six methodological options of the ReCiPe2016 single score method (Figure 4 and Figure 6).
The results of the MIX-fixed-W/C CBA-based concretes confirmed the results presented by Gursel and Ostertag [14] for CS-based concretes, which were also designed with a fixed W/C. In the CS-based study [14], the maximum recommended sand replacement percentage was 40 wt.%. In this study, we observed the same effect for CBA-based concretes that were designed with a fixed W/C. A maximum sand replacement percentage of 25 wt.% is recommended. However, for CBA-based concretes that were designed with a fixed slump range, a sand replacement rate of 50–100 wt.% with CBA is recommended.
In contrast to this controversial issue of replacing sand with byproducts, replacing cement with byproducts mainly provides environmental benefits. Crossin [31] replaced 30% of cement with GBFS and reported a reduction in the greenhouse gas emissions of 47.5% from that of conventional concrete. Additionally, Saade et al. [32] replaced 66% of cement with GBFS and reported a decrease in the environmental impacts, such as abiotic depletion, acidification, and eutrophication, of 40%–70%. Hossain et al. [2] replaced 25% of cement with FA and confirmed that the impacts of respiratory inorganics, global warming, nonrenewable energy, and acidification were approximately 20% lower than those of conventional concrete.
Such discrepancies in the benefits of replacing sand and cement with byproducts can be explained by the different damage contributions of sand and cement in the total LCA of concrete, which are 0.3%–2% and 74%–93%, respectively [33,34]. Consequently, owing to the relatively small contribution of sand production to the overall environmental damage caused by concrete production, whether the fixed slump or fixed W/C ratio method of designing concrete is better is a sensitive issue when aiming to elucidate the usefulness or harmfulness of byproduct-based concretes.
The different byproduct modeling approaches (attributional or consequential) and transportation distances (short or long) are also sensitive issues in the LCA of byproduct-based concretes. Therefore, Turk et al. [12] conducted the consequential modeling of the byproducts and reported the environmental sustainability of replacing sand with foundry sand or steel slag, while Prem et al. [13] conducted attributional modeling for byproducts and reported the environmental harmfulness of replacing sand with CS. Turk et al. [12] also investigated the sensitivity of the contribution of the byproduct transportation distance to the total LCA of byproduct-based concretes, and reported that long distances for the delivery of byproducts (100 km or more) mitigate the beneficial effects of replacing sand with byproducts.

5. Conclusions

Substituting sand in concrete with CBA via different mixture design methods (that can lead to different qualities of concrete mix components) is a sensitive issue:
  • ReCiPe2016 midpoint method. The increased substitution of sand with CBA lead to: (i) Decreases in the impacts of global warming potential, terrestrial ecotoxicity, water consumption, and increased fossil resources scarcity (MIX-fixed-SLUMP method) and (ii) increases in the impacts of global warming potential, terrestrial ecotoxicity, water consumption, and fossil resources scarcity (MIX-fixed-W/C method).
  • Six methodological options of the ReCiPe2016 single score method. With increasing substitution of sand with CBA: (i) CBA0 and CBA25 caused the most environmental damage, while CBA50-CBA100 caused the least environmental damage (MIX-fixed-SLUMP method), and (ii) CBA0 and CBA25 caused the least environmental damage, while CBA50, CBA75, and CBA100 caused the most environmental damage (MIX-fixed-W/C method).
Consequently, according to the LCA evaluated in this study, using CBA as a partial sand replacement in the concrete industry is a very controversial issue. Perhaps the use of certain design methods will make it possible to obtain concrete mixtures with the best environmental properties. The result of the LCA is highly dependent on the design method. For further clarification of the environmental effects of replacing sand in the concrete industry with CBA byproducts from electricity production, additional concrete mixtures should be considered in the future.

6. Contributions

By studying the issue of incorporating byproducts from other industries into the concrete industry instead of sand to improve the fresh and hardened concrete properties, the environmental influence of such replacements can no longer be ignored. This paper outlines the necessity of conducting environmental evaluation for each particular concrete design method (fixed slump range or W/C ratio) owing to the possible different environmentally beneficial effects of these mixtures.

7. Limitations

To better elucidate the environmental influences of the replacing sand in the concrete industry with byproducts from other industries, additional byproducts, such as granulated blast furnace slag, quarry dust powder, and phosphate waste, should be considered in further research. Moreover, in future research, sensitivity analysis of concretes with sand replacements to different transportation distances for delivering additives to the concrete plants should be conducted.

Funding

This research received no external funding.

Conflicts of Interest

The authors declare no conflict of interest.

References

  1. Meyer, C. The greening of the concrete industry. Cem. Concr. Compos. 2009, 31, 601–605. [Google Scholar] [CrossRef]
  2. Hossain, M.U.; Poon, C.S.; Dong, Y.H.; Xuan, D.X. Evaluation of environmental impact distribution methods for supplementary cementitious materials. Renew. Sustain. Energy Rev. 2018, 82, 597–608. [Google Scholar] [CrossRef]
  3. Kua, H.W. The consequences of substituting sand with used copper slag in construction. J. Ind. Ecol. 2013, 17, 869–879. [Google Scholar] [CrossRef]
  4. Yaragal, S.C.; Gowda, S.N.B.; Rajasekaran, C. Characterization and performance of processed lateritic fine aggregates in cement mortars and concretes. Construct. Build. Mater. 2019, 200, 10–25. [Google Scholar] [CrossRef]
  5. De Schepper, M.; Van den Heede, P.; Van Driessche, I.; De Belie, N. Life cycle assessment of completely recyclable concrete. Materials 2014, 7, 6010–6027. [Google Scholar] [CrossRef] [PubMed]
  6. Skalny, J.P. Questions to Arnon Bentur, head, National Building Research Institute, Technion, Israel Institute of Technology, Haifa. Adv. Cement Based Mater. 1996, 3, 81–85. [Google Scholar] [CrossRef]
  7. The Israel Electric Corporation Ltd. Financial Reports For The Nine and Three Months Ended September 30, 2016; The Israel Electric Corporation Ltd.: Haifa, Israel, 2016; pp. 1–191. Available online: https://www.iec.co.il/EN/IR/Documents/IECFinancialReportsSeptember_2016.pdf (accessed on 10 June 2019).
  8. NCAB, 2013. National Coal Ash Board, Israel, General Info. 2013. Available online: http://www.coal-ash.co.il/efer.html (accessed on 12 June 2019). (In Hebrew).
  9. Lieberman, R.N.; Knop, Y.; Querol, X.; Moreno, N.; Muñoz-Quirós, C.; Mastai, Y.; Anker, Y.; Cohen, H. Environmental impact and potential use of coal fly ash and sub-economical quarry fine aggregates in concrete. J. Hazard. Mater. 2018, 344, 1043–1056. [Google Scholar] [CrossRef]
  10. Heijungs, R.; Guinée, J.B. Allocation and ‘what-if’ scenarios in life cycle assessment of waste management systems. Waste Manag. 2007, 27, 997–1005. [Google Scholar] [CrossRef]
  11. ISO 14040 (International Organization for Standardization). Environmental Management Life Cycle Assessment Principles and Framework; International Organization for Standardization: Geneva, Switzerland, 2006. [Google Scholar]
  12. Turk, J.; Cotič, Z.; Mladenovič, A.; Šajna, A. Environmental evaluation of green concretes versus conventional concrete by means of LCA. Waste Manag. 2015, 45, 194–205. [Google Scholar] [CrossRef]
  13. Prem, P.R.; Verma, M.; Ambily, P.S. Sustainable cleaner production of concrete with high volume copper slag. J. Clean. Prod. 2018, 193, 43–58. [Google Scholar] [CrossRef]
  14. Gursel, A.P.; Ostertag, C. Life-Cycle Assessment of High-Strength Concrete Mixtures with Copper Slag as Sand Replacement. Adv. Civ. Eng. 2019, 2019, 6815348. [Google Scholar] [CrossRef]
  15. Kou, S.C.; Poon, C.S. Properties of concrete prepared with crushed fine stone, furnace bottom ash and fine recycled aggregate as fine aggregates. Construct. Build. Mater. 2009, 23, 2877–2886. [Google Scholar] [CrossRef]
  16. ISO 13315-1 (International Organization for Standardization). Environmental Management for Concrete and Concrete Structures 2012, Part 1: General Principles; International Organization for Standardization: Geneva, Switzerland, 2012. [Google Scholar]
  17. Habert, G.; de Lacaillerie, J.B.D.; Roussel, N. An environmental evaluation of geopolymer based concrete production: Reviewing current research trends. J. Clean. Prod. 2011, 19, 1229–1238. [Google Scholar] [CrossRef]
  18. Brand, S. How Buildings Learn; Viking Press: New York, NY, USA, 1994. [Google Scholar]
  19. Gursel, A.P.; Masanet, E.; Horvath, A.; Stadel, A. Life-cycle inventory analysis of concrete production: A critical review. Cement Concr. Compos. 2014, 51, 38–48. [Google Scholar] [CrossRef]
  20. Napolano, L.; Menna, C.; Asprone, D.; Prota, A.; Manfredi, G. Life cycle environmental impact of different replacement options for a typical old flat roof. Int. J. Life Cycle Assess. 2015, 20, 694–708. [Google Scholar] [CrossRef]
  21. Pushkar, S. Life cycle assessment of flat roof technologies for office buildings in Israel. Sustainability 2016, 8, 54. [Google Scholar] [CrossRef]
  22. Pushkar, S.; Verbitsky, O. Effects of different allocation approaches for modeling mineral additives in blended cements on environmental damage from five concrete mixtures in Israel. Mater. Struct. 2016, 49, 4401–4415. [Google Scholar] [CrossRef]
  23. Ecoinvent v3.5. Ecoinvent Database Swiss Center for Life Cycle Inventory. Available online: https://www.ecoinvent.org/database/database.html (accessed on 28 August 2019).
  24. Goedkoop, M.; Spriensma, R. The Eco-indicator 99—A damage oriented method for life cycle impact assessment, 2001; PRé Consultants: Amersfoort, The Netherlands, 2001; p. 3821. [Google Scholar]
  25. Thompson, M.; Ellis, R.; Wildavsky, A. Political Cultures. Cultural Theory; Westview Press: Boulder, CO, USA, 1990. [Google Scholar]
  26. Huijbregts, M.A.J.; Steinmann, Z.J.N.; Elshout, P.M.F.; Stam, G.; Verones, F.; Vieira, M.; Zijp, M.; Hollander, A.; van Zelm, R. ReCiPe2016: A harmonised life cycle impact assessment method at midpoint and endpoint level. Int. J. Life Cycle Assess. 2017, 22, 138–147. [Google Scholar] [CrossRef]
  27. Pushkar, S. Modeling the substitution of natural materials with industrial byproducts in green roofs using life cycle assessments. J. Clean. Prod. 2019, 227, 652–661. [Google Scholar] [CrossRef]
  28. SimaPro, v9.0.; PRé Consultants: Amersfoort, The Netherlands, 2019.
  29. Picquelle, S.J.; Mier, K.L. A practical guide to statistical methods for comparing means from two-stage sampling. Fish. Res. 2011, 107, 1–13. [Google Scholar] [CrossRef]
  30. Hurlbert, S.H.; Lombardi, C.M. Final collapse of the Neymane-Pearson decision theoretic framework and rise of the neoFisherian. An. Zool. Fennici 2009, 46, 311–349. [Google Scholar] [CrossRef]
  31. Crossin, E. The greenhouse gas implications of using ground granulated blast furnace slag as a cement substitute. J. Clean. Prod. 2015, 95, 101–108. [Google Scholar] [CrossRef]
  32. Saade, M.R.M.; da Silva, M.G.; Gomes, V. Appropriateness of environmental impact distribution methods to model blast furnace slag recycling in cement making. Resour. Conservat. Recycl. 2015, 99, 40–47. [Google Scholar] [CrossRef]
  33. Celik, K.; Meral, C.; Gursel, A.P.; Mehta, P.K.; Horvath, A.; Monteiro, P.J.M. Mechanical properties, durability, and life-cycle assessment of self-consolidating concrete mixtures made with blended portland cements containing fly ash and limestone powder. Cement Concr. Compos. 2015, 56, 59–72. [Google Scholar] [CrossRef] [Green Version]
  34. Gursel, A.P.; Ostertag, C.P. Impact of Singapore’s importers on life-cycle assessment of concrete. J. Clean. Prod. 2016, 118, 140–150. [Google Scholar] [CrossRef]
Figure 1. Cradle-to-gate life-cycle assessments (LCA): Studied concrete system boundaries (plain line—included processes; dashed line—excluded processes).
Applsci 09 03620 g001
Figure 2. Design structure of a two-stage nested hierarchical system for conducting the environmental evaluation of the mixture with a fixed water/cement ratio (MIX-fixed-W/C) alternatives: CBA0 vs. CBA20 (note: individualist/average [I/A], hierarchicst/average [H/A], egalitarian/average [E/A], individualist/individualist [I/I] hierarchist/hierarchist [H/H], and egalitarian/egalitarian [E/E] are the methodological options of the ReCiPe2016 single score results).
Applsci 09 03620 g002
Figure 3. Environmental impacts of replacing sand with coal bottom ash (CBA): A—CBA0, B—CBA25, C—CBA50, D—CBA75, and E—CBA100. The environmental impacts were evaluated following the ReCiPe2016 midpoint H method. The concrete mixtures were designed with a fixed slump range of 60–80 mm. The FU was normalized by dividing the environmental assessment of 1 m3 of concrete according to the 28-day concrete compressive strength.
Applsci 09 03620 g003
Figure 4. Environmental damage caused by replacing sand with coal bottom ash (CBA): A—CBA0, B—CBA25, C—CBA50, D—CBA75, and E—CBA100. The life-cycle assessments (LCAs) were evaluated via the six methodological options of the ReCiPe2016 single-score method: Individualist/average (I/A) hierarchist/average (H/A), egalitarian/average (E/A), individualist/individualist (I/I), hierarchist/hierarchist (H/H), and egalitarian/egalitarian (E/E). The concrete mixtures were designed with a fixed slump range of 60–80 mm. The FU was normalized by dividing the environmental assessment of 1 m3 of concrete according to the 28-day concrete compressive strength.
Applsci 09 03620 g004
Figure 5. Replacing sand with coal bottom ash (CBA): A—CBA0, B—CBA25, C—CBA50, D—CBA75, and E—CBA100. The environmental impacts were evaluated following the ReCiPe2016 midpoint H method. The concrete mixtures were designed with a fixed W/C of 0.52. The functional unit (FU) was normalized by dividing the environmental assessment of 1 m3 of concrete according to the 28-day concrete compressive strength.
Applsci 09 03620 g005
Figure 6. Environmental damage caused by replacing sand with coal bottom ash (CBA): A—CBA0, B—CBA25, C—CBA50, D—CBA75, and E—CBA100. The life-cycle assessments (LCAs) were evaluated via the six ReCiPe2016 single-score methodological options, i.e., individualist/average (I/A) hierarchist/average (H/A), egalitarian/average (E/A), individualist/individualist (I/I), hierarchist/hierarchist (H/H), and egalitarian/egalitarian (E/E). The concrete mixtures designed with a fixed W/C of 0.52; The FU was normalized by dividing the environmental assessment of 1 m3 of concrete according to the 28-day concrete compressive strength.
Applsci 09 03620 g006
Table 1. Mixture with a fixed slump range (MIX-fixed-SLUMP): Concrete mixture design with a fixed slump range of 60–80 mm and the concrete’s properties (based on [15]).
MaterialCBA0CBA25CBA50CBA75CBA100
Portland cement (kg/m3)386386386386386
water content (kg/m3)205190170150130
sand (kg/m3)6524943181380
Coal bottom ash (CBA) (kg/m3)0167343529725
coarse aggregate (kg/m3)11101127112611351184
water/cement ratio0.530.490.440.390.34
slump (mm)6565707567
28-day compressive strength (MPa)5665707567
Drying shrinkage (microstrain)690650590510420
Chloride–ion penetration (total charge passed in coulombs)56005200505047004300
Note: Sand-CBA replacements were performed by mass. Mix designs were based on saturated surface dried conditions.
Table 2. Mixture with a fixed water/cement ratio (MIX-fixed-W/C): Concrete mixture design with a fixed water-cement ratio of 0.53 and the concrete’s properties (based on [15]).
MaterialCBA0CBA25CBA50CBA75CBA100
Portland cement (kg/m3)386386386386386
water content (kg/m3)205205205205205
sand (kg/m3)652457262670
Coal bottom ash (CBA) (kg/m3)0163326489545
coarse aggregate (kg/m3)11101127112611351184
water/cement ratio0.530.530.530.530.53
slump (mm)6885120155195
28-day compressive strength (MPa)5652453932
Drying shrinkage (microstrain)690650640690720
Chloride–ion penetration (total charge passed in coulombs)56005800590060006200
Note: Sand-CBA replacements were performed by mass. Mix designs were based on saturated surface dried conditions.
Table 3. Processes included in the cradle-to-gate life-cycle assessment (LCA) of the concretes and the corresponding references in the EcoInvent v3.5 database [23].
ProcessReference in the EcoInvent Database
Water treatmenttap water, at user/CH U
CEM I 42.4N productioncement mortar, at plant/CH U
coarse aggregate extractiongravel, crushed, at mine, CH/U
sand extractionsand, at mine CH/U
transportLorry transport, Euro 0, 1,2, 3, 4 mix, 22 t total weight, 17.3 t
Table 4. p-values (p) of the paired differences in the life-cycle assessment (LCA) production stage of 1 m3 of concrete normalized according to the 28-day concrete compressive strength for the five concrete alternatives where sand was replaced with coal bottom ash (CBA). The concrete mixtures were designed with fixed a slump range of 60–80 mm.
ConcreteCBA0CBA25CBA50CBA75CBA100
CBA0X0.16320.02510.01420.0107
CBA25 X0.03250.01370.0104
CBA50 X0.41370.0904
CBA75 X0.1203
CBA100 X
Note: A—CBA0, B—CBA25, C—CBA50, D—CBA75, and E—CBA100. The LCAs were evaluated via the six ReCiPe2016 single score methodological options (I/A, H/A, E/A, I/I, H/H, and E/E). The p-values were evaluated according to three-valued logic: Bold font—appears to be positive, ordinal font size—appears to be negative, italic font—judgment is suspended.
Table 5. p-values (p) of the paired differences in the life-cycle assessment (LCA) production stage of 1 m3 of concrete normalized according to the 28-day concrete compressive strength for the five concrete alternatives with different percentages of coal bottom ash (CBA) replacing sand. The concrete mixtures were designed with a fixed W/C of 0.52.
ConcreteCBA0CBA25CBA50CBA75CBA100
CBA0X0.07500.00860.00250.0009
CBA25 X0.01230.00230.0006
CBA50 X0.01160.0017
CBA75 X0.0030
CBA100 X
Note: The LCAs were evaluated with the six ReCiPe2016 single score options (I/A, H/A, E/A, I/I, H/H, and E/E). The p-values were evaluated according to three-valued logic: Bold font—appears to be positive, ordinary font—appears to be negative, and italic font - judgment is suspended.

