Abstract
Agribusiness industries are among the most hazardous workplaces for non-fatal occupational injuries. The term “post-incident state” is used to describe the health status of an injured person when a non-fatal occupational injury has occurred, in the post-incident period when the worker returns to work, either immediately with zero days away from work (medical state) or after a disability period (disability state). An analysis of nearly 14,000 occupational incidents in agribusiness operations allowed for the classification of the post-incident state as medical or disability (77% and 23% of the cases, respectively). Due to substantial impacts of occupational incidents on labor-market outcomes, identifying factors that influence the severity of such incidents plays a significant role in improving workplace safety, protecting workers, and reducing costs of the post-incident state of an injury. In addition, the average costs of a disability state are significantly higher than those of a medical state. Therefore, this study aimed to identify the contributory factors to such post-incident states with logistic regression using information from workers’ compensation claims recorded between 2008 and 2016 in the Midwest region of the United States. The logistic regression equation was derived to calculate the odds of disability post-incident state. Results indicated that factors influencing the post-incident state included the injured body parts, injury nature, and worker’s age, experience, and occupation, as well as the industry, and were statistically significant predictors of post-incident states. Specific incidents predicting disability outcomes included being caught in/between/under, fall/slip/trip injury, and strain/injury by. The methodology and estimation results provide insightful understanding of the factors influencing medical/disability injuries, in addition to beneficial references for developing effective countermeasures for prevention of occupational incidents.
1. Introduction
Occupational safety incidents are among the leading challenges that most industries encounter [1]. Workplace injuries have direct impact on labor-market outcomes, including income reduction, job loss, and health of the injured workers [2]. Workplace incidents include medical and indemnity costs as well as indirect costs. The indirect costs are equipment damage and repair, incident investigation time, training new personnel for replacement of the injured ones, an increase in insurance premiums for the year following the incidents, a slowdown of production schedule, and damage to the company’s reputation, as well as lowering the workers’ motivation to return to work [3,4]. Workers’ compensation data are an important and valuable information source for understanding the extent of occupational injuries and deploying necessary interventions to protect workers. Workers’ compensation claims data sets often include information on the cause and nature of the injury, disability type, and costs for medical care, rehabilitation, and partial wage replacement. They also include demographic information (age, sex, job tenure, occupation) on the injured workers as well as their employer (industry, employee payroll, prior claim history) and a narrative description of the injury [5]. Analyses of injury statistics are useful in defining characteristics of occupational incidents [6,7,8]. The main purpose of incident analysis is the derivation and development of preventative measures from injury data. To meet that goal, analysis of injury reports can significantly improve the information about incidents [9]. Applying proper analytical tools aimed at discovering the causes of occupational incidents is essential to gain useful information that contributes to preventing these incidents in future [10].
Many studies have used descriptive statistical methods and regression analysis for classification of occupational injuries and extracting information for the improvement of occupational safety in various fields. Various studies applied descriptive statistical analysis to describe occupational injury distributions based on injured workers’ demographics and workplace conditions to identify high-risk industries and occupations [8,11,12,13,14,15,16,17]. Douphrate et al. [18] applied descriptive statistics methods to identify and describe tractor-related injuries, assess medical and indemnity costs associated with tractor-related injuries, and to determine contributing factors associated with those injuries. Chang and Tsai [19] extracted injury patterns (including severity, accident type, and source of injury) based on occupational injury records in manufacturing industries. Altunkaynak [1] identified the factors contributing to occupational incidents in manufacturing sector by examining the relationship between lost work days, post-accident state, and type of accident using descriptive analysis and chi-squared (χ2) test.
The choice of statistical analysis for any research primarily depends on the type of the dependent variable. The dependent variable (outcome) in most incident-related analyses is binary. Considering the binary classification of most injury outcomes, logistic regression (LR) is widely used in incident analysis research due to its capability in estimating and quantifying meaningful results in terms of odds ratio values [20]. Studies in occupational safety use LR to evaluate the relationship between the injury and predictor variables to make a meaningful interpretation about the measure of such effects (using odds ratios) and to identify statistically significant predictors of injury (using p-values). Wang et al. [21] determined the significance of the post-intervention reductions in risk of musculoskeletal and non-musculoskeletal disorders in a hospital setting using LR. Chen et al. [22] applied a hierarchical LR model to examine the significant factors at crash and vehicle/driver levels and their heterogeneous impacts on driver injury severity in rural interstate highway crashes. Rezapour et al. [20] applied LR for classification and prediction of occupational injury risk in the shipbuilding industry and proved its efficiency in estimating risk probability from working conditions predictors of incident type, situation, and condition involved in the incident.
Understanding injury patterns and the underlying mechanisms of incidents with respect to a specific industry may produce effective insights to boost policymaking, training, and incident/injury intervention and prevention efforts [19]. Agriculture-related industries are routinely among the most hazardous work environments [23] despite growing improvement in technology, coordinated prevention measures, improved training, and higher education of the workforce [9].
The focus of this study was to perform an injury analysis on agribusiness industries with the highest frequency of occupational incidents. The study specifically looked at occupational injury analysis in agribusiness industries, including grain elevator operations, refined fuels, feed milling for livestock, food distribution operations, fertilizer blending/distributions, poultry hatchery/grower/processor, and grain milling operations. Every year, thousands of occupational incidents occur in agribusiness industries [24]. Agribusiness is defined as the operations involved in manufacturing and distribution of farm supplies, production operations on the farm, and the storage, processing, and distribution of farm commodities [25]. Agribusiness industries refer to the organizations, business administrations, and industries engaged in agriculture and agriculture-related products and services [26]. In agribusiness industries, similar to other occupational factors, incidents happen through a combination of activities, causes, different machines, and equipment in diverse scenarios in which workers suffer injuries with various severity levels [9]. Despite the benefits of using workers’ compensation claims data to analyze and predict injuries, little research has effectively utilized such data to provide detailed information for the predictors of work-related injuries in agribusiness industries with high rates of occupational incidents. Using the records of occupational incidents between 2008 and 2016 in selected agribusiness industries, the objectives of this study were to:
- Evaluate the effectiveness of LR in identifying significant predictors of the post-incident state of occupational injuries.
- Determine the contribution of occupational incident factors to the likelihood of medical versus disability post-incident states.
- Discuss the application of results in reducing the incidence of injury in the agribusiness industry.
2. Material and Methods
This research utilized a data set with workers’ compensation claims between 2008 and 2016 from a leading insurance company in the Midwest of the United States. Among all occupational records, the agribusinesses with the highest frequencies of occupational incidents were extracted (13,867 claims). Statistical analysis was completed with JMP Pro statistical software (JMP®, Version 13.2, SAS Institute Inc., Cary, NC, USA, 1989–2007). Frequency distributions were used to categorize the variables. The descriptive analysis of the data showed that out of 13,867 incident records, 50% had occurred in grain elevator operations, 18% in refined fuel, 11% in feed mills for livestock operation, 8% in food distributors, 8% in fertilizer blending/distribution, 3% in poultry hatchery/grower/processor, and 2% in grain milling operations. Considering the injury nature group, 98% involved a specific injury and only 2% were occupational disease and multiple injuries. Table 1 shows the frequency and percentage of total cases of injured body group, type of incident (main cause of incident), and the injured occupations. The injured body part group refers to the main classification of an injury afflicting a specific part of the body and has seven levels. Each level has some detailed information. For example, the upper extremities body group includes elbow(s), lower arm, finger(s), shoulder(s), etc. Cause of injury group has ten categories, each including some specific cause. For example, the struck or injured by group includes specific causes of hand tool or machine in use, falling or flying objects, object being lifted or handled, etc. The nature of injury group has three levels, each consisting of a specific detail of the injury. For example, the specific injuries include a detailed nature of the injury, such as laceration, fracture, amputation, concussion, etc.

Table 1.
Distribution of individual predictors.
There are two numerical values in the data: age and experience. The average age of the injured at the incident date was 43 years old (min = 15, max = 84.5), and the average years of experience was 6 years (min = 0, max = 48).
Logistic Regression Model
Logistic regression is popular with data analysis dealing with describing the relationship between various explanatory input variables and a discrete outcome with two or more levels [27,28]. What distinguishes LR from linear regression models is that the output variable is binary [29]. LR is a powerful statistical method for analyzing categorical data and is used to predict the probability of a nominal response [30]. Nominal responses are analyzed with a straightforward extension of the logit model.
A linear regression model assumes that the expected value of Y for a given x is expressed as , for which the specific form of the LR model for calculating the probability of an outcome of interest was:
Extending the logic of simple regression to multiple input variables (x1, x2,..., xn), and with a nominal binary response, the logit function of the multiple LR was defined as a linear combination of input variables as in Equation (1) [28], and the LR model was used as in Equation (2).
Equation (1): Linear combination of individual predictors.
Equation (1): Probability of outcome of interest.
In this study, multiple LR was used to estimate the odd ratios of the post-incident state of a non-fatal occupational injury. The input variables used were injured body part group (x1), cause of injury group (x2), nature of injury group (x3), injured worker’s occupation (x4), agribusiness industry (x5), age of the injured worker (x6), and years of experience of the injured worker (x7). The binary output variable was post-incident state (medical vs disability). The outcome of interest is disability post-incident state. Therefore, the probability of post-incident state of disability is
and the probability of medical post-incident state is
To evaluate the effectiveness of the LR model formula in estimation and prediction of the outcome of interest, researchers should consider overall model evaluation statistics, statistical significance of the individual predictors, and validation of the predicted probabilities of the outcome of interest versus the actual outcomes from the data set using a classification table [28].
To examine the effects of the individual predictors on the probability of a disability versus medical post-incident state, the Wald chi-squared values and their correspondent observed significance (p) values are determined. The Wald chi-squared values are the Wald tests for the hypotheses that each of the parameters is zero and is computed as (estimate per independent variable/SE of estimate)2. If the p-value is less than 0.05 (α = 0.05 at the 95% confidence interval), the independent variable is statistically significant in the model and is likely to affect the probability of the target binary outcome.
Since each of the model individual predictors has several subcategories, the extent of each subcategory impact on the disability post-incident state should be measured to evaluate its effect on increasing or decreasing the probability of disability post-incident state. To meet that goal, the β coefficient is used as the typical designation for the extent of effect, with the odds ratio for each subcategory of each individual predictor. The value of the β coefficient determines the direction of the relationship between input variables and the logit function [28]. The odds ratio is an effect size measurement [31]. It is a measure of association between an individual predictor and an outcome [32]. For binary output variables, the odds ratio is equal to the natural logarithm raised to the exponent of the slope (Exp (β)) [28]. An odds ratio of 1 indicates no effect. An odds ratio greater than 1 indicates that the specific predictor increases the odds of the output, while an odds ratio less than 1 indicates the predictor decreases the odds of the outcome [33]. The 95% confidence interval (CI) around a coefficient (β) is used to estimate the precision of the odd ratio. A larger CI indicates a lower precision of the odd ratio, while a small CI indicates a higher precision. The 95% CI, unlike the p-value, does not report the statistical significance of the predictor. In practice, it is used as a proxy for the existence of statistical significance, if it does not overlap the null value (odd ratio of one indicating no effect). Considering the Exp (95% CI), if the odds ratio of a specific variable is greater than 1 with the odds ratio of the lower bound confidence interval not below 1, the variable in question is likely a significant risk in incident occurrence [32].
3. Results
The workers’ compensation claims data set was evaluated using nominal LR analysis for a detailed investigation of the factors that contribute to increasing or decreasing the probability of an occupational injury post-incident state of disability. This section includes a discussion of the results and their interpretations as per the research objective defined in Section 1.
3.1. Objective I
Using the independent variables from Table 1 as the individual predictors and the post-incident state binary levels of disability and medical state as the dependent (output) variable, a nominal LR model was fit to the data. In order to evaluate the effectiveness of the LR model in estimating the probability of a disability post-incident state, the overall model evaluation (Table 2), statistical significance of individual independent variables (Table 3), and predicted probabilities’ validation (Table 4) were extracted from the model outputs. A logistic model provides a better fit to the data if it demonstrates an improvement over the intercept-only model (reduced model). The whole model tests the difference between the complete model that includes the intercepts and all effects versus the reduced model, and is used to measure the significance of the repressors as a whole to the fit [34]. The whole model test chi-squared value of 1168.84 showed the significance of the LR model versus the intercept only model (p-value < 0.05). The likelihood ratio test also yielded the same result as the whole model test regarding the effectiveness of the LR model.
Table 2.
Model performance chi-squared values.
Table 3.
Estimates from the logistic regression (LR) model.
Table 4.
Classification table for the LR model.
The LR model is helpful in demonstrating the relationship between the input and output variables. To examine the effects of the independent variables on the probability of disability post-incident state versus medical, the Wald chi-squared and their corresponding p-values were measured. For a p-value less than 0.05 (α = 0.05 at 95% confidence interval), the independent variables were considered statistically significant in the model, which meant it was likely to affect the probability of the binary outcome [35]. Table 3 shows the Wald chi-squared values and their corresponding p-values for individual predictors in the model. It indicates that all model input variables are statistically significant on estimating the probability of post-incident state.
Using the LR model formula, the probability of disability vs medical post-incident state was calculated per case. Comparing the probability of medical vs disability post-incident state, the one with higher probability was labeled as the predicted class. The predicted post-incident states were compared with the actual post-incident states from the data. The degree to which the predicted probabilities agree with the observed outcomes from the original data is expressed as a classification table [28]. Using the LR output classifications, the frequency of actual versus predicted outcomes are given in Table 4. According to the percentage of correct predictions, the prediction of the medical post-incident state was more accurate than that of the disability state. This observation was also supported by the magnitude of sensitivity (2.04%) compared to that of specificity (99.08%). Sensitivity measures the proportion of correctly classified events (disability post-incident state in this study), whereas specificity measures the proportion of correctly specified nonevents (medical post-incident state in this study) [28]. The LR model could predict the post-incident state of similar occupational injuries with an accuracy rate of 77% (gained by dividing the total number of accurately classified outcomes over the total number of cases). The overall correct prediction of 77% is an improvement over the chance level [27].
3.2. Objective II
To evaluate the extent of the effect of each subcategory on increasing or decreasing the probability of a disability post-incident state (the target level), β coefficients and their 95% confidence interval were calculated, as shown in Table 5. In order to interpret the effect, the odd ratio values were calculated by transforming the coefficients and their 95% CI using the exponential function.
Table 5.
Detailed estimates from the LR model.
Considering the Exp (β), an odds ratio equal to 1 shows no effect; an odds ratio greater than 1 shows the variable in question increases the odds of the outcome target level; and an odds ratio less than 1 indicates the variable in question decreases the odds of the outcome target level [33]. From the odds ratio evaluation, the probability of a disability post-incident state for injuries in lower extremities, multiple parts, neck, and trunk are 1.63, 1.11, 1.09, and 1.07 times more likely compared to injuries in upper body parts, while injuries of the head and in the whole body group are less likely to lead to a disability when compared with injuries of the upper extremities. The groups of both the nature of multiple injuries and occupational disease are 1.23 and 1.16 times more likely than specific injuries to turn into disability. Among occupations, poultry/egg producers (1.62), gas/oil dealers (1.55), and grain elevator operations (1.38) have the highest likeliness of incidents leading to disability compared to occupations in stores (meat, fish, and poultry). Looking at the odds ratios for occupations, those incidents in sales are all less likely to end as disability and have a higher probability of having a medical state only. Industry-wise, food distributors, livestock feed mills, and grain milling plants are between 1.02 and 1.39 times more likely to cause a disability outcome.
Considering the Exp (95% CI), if the odds ratio of a specific variable is greater than 1 with the odds ratio of the lower bound confidence interval not being below 1, the variable in question is likely to pose a significant risk in incident occurrence. Among all incident causes, the highest risks of occupational incidents were found for the fall, slip, or trip injury category, with an odds ratio of 1.86 and a 95% CI of (1.70, 2.50), followed by “caught in/under/between” (odds ratio of 1.57 and 95% CI: (1.28, 1.92)) and the “strain or injury by” group (odds ratio of 1.49 and 95% CI: (1.35, 1.65)), respectively. These three categories could be identified as the most important risk indicators of incident cause. The highest risk occupations were gas/oil dealers and grain elevator operations (with odds ratio of 1.51 and 0.38 and 95% lower confidence interval of 1.28, and 1.20, respectively).
Considering the cause of incident group, Figure 1 shows that when an incident occurred due to a vehicle, strain or injury by, and slip, trip, or fall injury categories, the probability of the disability post-incident state increased. The lowest disability probability belonged to those incidents caused by a cut, puncture, or scrape. All other causes of incident showed an average probability of disability between 0.10 and 0.30. As shown in Figure 2, among all levels of the injured body part group, the highest probability of disability post-incident state belonged to lower and upper extremities, followed by multiple body parts, trunk, neck, and the whole body group. Injuries to the head had the lowest probability of turning into disability (less than 10% on average). Figure 3 revealed the average probability of disability with respect to the nature of incidents. The multiple injury category had the highest probability of turning into disability (>40%), followed by occupational disease and specific injuries. However, for some specific cases, the specific injuries had a disability probability of over 0.50 (50% chance).
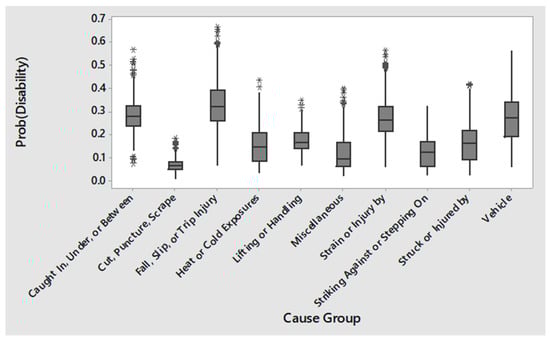
Figure 1.
Boxplot of disability post-incident state for each cause group. (* shows the outlier data points).
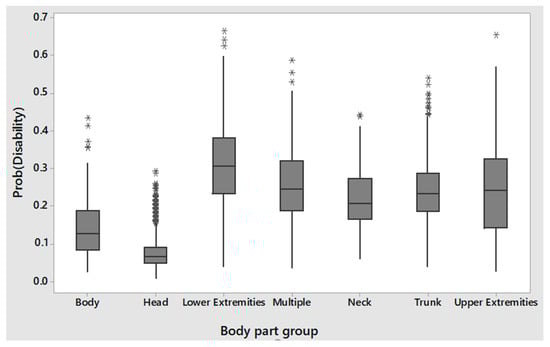
Figure 2.
Boxplot of disability post-incident state for each body part group. (* shows the outlier data points).
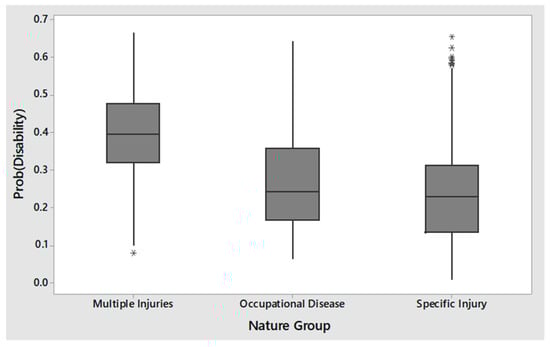
Figure 3.
Boxplot of disability post-incident state for each nature of injury group. (* shows the outlier data points).
Figure 4 and Figure 5 show the boxplots for the probability of a disability post-incident state with respect to industry and occupation. All industries showed similar probabilities for disability (less than 50%), with some injuries having over a 50% chance of turning into a disability for occupations in grain elevators, fuel refining, and feed mill for livestock and pet foods. The probability of disability varied among occupations from 10% to 20%.
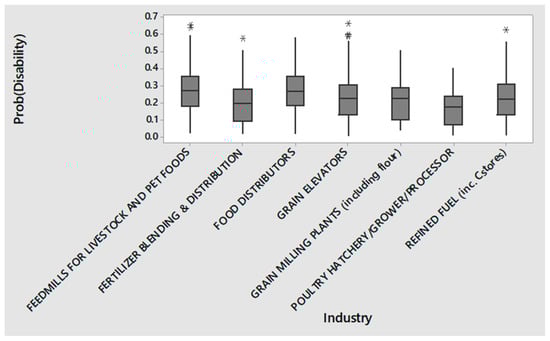
Figure 4.
Boxplot of disability post-incident state with respect to industry. (* shows the outlier data points).
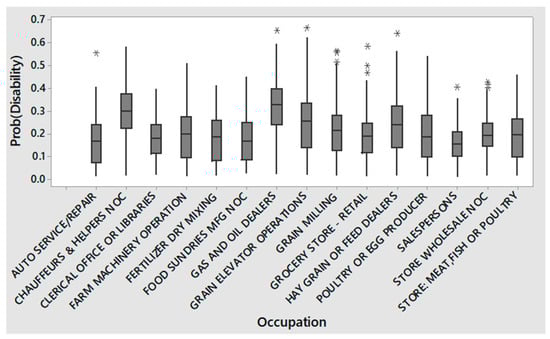
Figure 5.
Boxplot of disability post-incident state with respect to occupation. (* shows the outlier data points; NOC: not otherwise classified).
Looking at the effect of age and years of experience at the accident date on the post-incident state of the injured, the former showed an upward trend, while the latter showed a weak linear trend. The analysis showed that higher age of workers affects the probability of disability (corresponding with the positive coefficient β = 0.02 from the model). The trend in this study agreed with previous literature on the effect of older ages on higher frequency and severity level of incidents, specifically when the occupation includes manufacturing operations, due to the effect of age on the physical activity and attention of the workers [1,36,37,38,39]. Although the experience showed no specific upward or downward trend, workers with fewer years of experience were prone to higher frequencies (yet, with a lower probability β = −0.02) of a disability post-incident state. Lack of experience and overconfidence in younger employees could be reasons for the higher rate of incidents [40,41].
3.3. Objective III
The last objective of this study was to identify how various levels of individual predictors of an occupational injury can be used as an input to estimate the post-incident state, which elaborates the application of the LR model formula. Numerical values from Table 5 show that those specific variables that increased or decreased the odds of a disability post-incident state could be extracted. Considering all individual predictors and their levels, the ones that increased the odds of a disability post-incident state (i.e., these variables had positive coefficients) included:
- Injured body part groups of lower extremities, multiple, neck, and trunk;
- Cause of injury groups of caught in, under, or between; fall, slip, or trip injury; and strain or injury by;
- Nature of injury groups of occupational disease and multiple injuries;
- Occupations including chauffeurs and helpers, farm machinery operations, fertilizer dry mixing, gas and oil dealers, hay grain or feed dealers, grain elevator operations, and poultry/egg production;
- Industries of grain milling plants, feed mills for livestock/pet foods, and food distributors.
The formula for the LR model was written using the linear combination as in Equation (1) and the numerical values for coefficients β (Table 5) for all levels of individual factors.
This z value can be turned into a logit function using Equation (2) to estimate the probability of a disability post-incident state. For instance, for a 50-year-old injured worker with 5 years of experience working in fertilizer blending and distribution under the job category of fertilizer dry mixing operations, an occupational injury in lower extremities caused by a fall or trip and classified as multiple injuries will have a z value of:
The z-value of 0.11 and = 0.89 generated the probability of 1/(1 + 0.89) = 0.53. This injury was predicted to have a 53% chance of turning into a disability rather than a medical state. The same demographics with a head injury instead of an injury to lower extremities was predicted to have a 25% chance (z = −1.12, = 3.06, and 1/(1 + 3.06) = 0.25) of a disability post-incident state. The reason was that the coefficient of the head (β = −0.74) had a decreasing effect on the odds of the disability outcome. Similarly, the LR formula can be used to develop other incident conditions for the estimation and prediction of post-incident states. For example, an occupational incident in the grain elevator industry for a 65-year-old worker with 15 years of experience, whose injury was caused by the “strain or injury by” category and multiple injuries and occupational disease nature of injury groups, had an almost equal chance of turning into a medical (54%) or disability (46%) state, while specific injuries showed a lower probability of ending as a disability (32%). Considering the effect of body part group, the same worker showed a medical post-incident state (67–82%) if injured in upper extremities, trunk, neck, multiple body parts, whole body group, and head, respectively. However, the same injury had a 40% and 42% chance of turning into a disability if it occurred in the upper or lower extremities, respectively. When changing the age while keeping all other factors fixed, the model showed that the younger the injured worker, the lower the probabilities of a disability post-incident state. The years of experience showed an inverse relation to the post-incident state, meaning that fewer years showed a disability–medical state ratio of 0.29 to 0.71, compared to more years of experience, with the ratio ranging from 0.17 to 0.83.
The management of occupational safety risks is a significant component of any business [42]. Analysis of the incidents helps occupational risk managers identify which hazards have contributed and led to the most frequent occupational accidents, and thus determine appropriate preventative actions [43]. Understanding the relationships between individual predictors of occupational incidents contributes to the development of focused mitigation strategies to prevent workers’ injuries [39]. Analyzing empirical data to extract risk indicators adds predictivity to risk scenarios and helps to efficiently plan and modify loss approaches in the agribusiness industries [44].
The LR analysis approach of this study can assist safety practitioners for the purpose of identifying interactions between incident factors and estimating the probabilities of future potential post-incident states of occupational injuries in order to plan relevant strategies to remove the source risks of incidents. Relying on insights from empirical data analysis along with safety management knowledge contributes to informed decision-making regarding reduction of occupational incidents in the occupations and industries studied in this research. Integrating the analysis of empirical data with the knowledge of safety practitioners in safety regulations and the training and education of employees is expected to decrease the rate and alleviate the outcomes of severe injuries.
4. Conclusions
Approximately 14,000 instances of occupational incidents recorded in agribusiness operations between 2008 and 2016 in the Midwest of the United States were analyzed to identify the main factors influencing the odds of disability or medical post-incident states of the injured workers. This study identified injured body parts, nature of the injury, industry, and the age, years of experience, and occupations of the injured worker as statistically significant predictors of post-incident states of an occupational injury in agribusiness operations, based on workers’ compensation data recorded during this period. In addition, the results indicated that specific incidents predicting disability outcomes included being caught in/between/under, fall/slip/trip injury, and strain/injury by. Injuries to the lower extremities, trunk, and neck with the nature of occupational diseases or multiple injuries had a higher chance of turning into a disability for workers involved in occupations such as poultry/egg production, grain elevator operations, fertilizer dry mixing, farm machinery operations, and hay, grain or feed dealing. The results revealed that occupations involved in manufacturing/production operations had a higher likelihood of injuries leading to disability compared to in-store occupations. Furthermore, even though all industries in the study showed an almost equal likelihood of an incident turning into disability, specific incidents in grain elevators, fuel refining, and feed mills for livestock and pet foods as well as food distributors had a higher likelihood of leading to disability compared to other agribusiness operations.
Within the scope of this study, logistic regression was used due to its flexibility and suitability for statistical analysis of data that can be grouped categorically. Therefore, changing the factors will change the formula of the logistic regression model, and thus provide valuable information regarding the odds of the outcomes of interest. Such information may contribute to safety measures and provide information to enhance injury prevention policies to make them more effective. The main limitation of this study was that the data set did not include any variables to determine whether the incident was caused by human error or poor safety conditions. The other limitation was the lack of variables concerning physical conditions of the workplace and injured workers, which would provide a more thorough analysis of the injury sources and patterns. This study covered specific agribusiness operations with the highest frequencies of occupational incidents in the United States. Similar studies with the methodology followed in this study could be performed in other countries and sectors, such as manufacturing operations, to compare and validate the predictors of injury incidence. Although this study identified the factors that influenced the post-incident state of non-fatal occupational injuries, many other issues related to injury patterns remain to be explored and discussed in the research literature. Future studies can focus on comparing the post-incident state of injuries based on the diversity of operational activities with respect to sector/occupation.
Author Contributions
Conceptualization, F.D.K., S.A.F., and G.A.M.; Formal analysis, F.D.K.; Methodology, F.D.K., S.A.F., and G.A.M.; Resources, F.D.K., S.A.F., and G.A.M.; Writing—original draft, F.D.K.; Writing—review & editing, S.A.F. and G.A.M.
Conflicts of Interest
The authors declare no conflict of interest.
References
- Altunkaynak, B. A Statistical Study of Occupational Accidents in the Manufacturing Industry in Turkey. Int. J. Ind. Ergon. 2018, 66, 101–109. [Google Scholar] [CrossRef]
- Boden, L.I.; O’Leary, P.K.; Applebaum, K.M.; Tripodis, Y. The Impact of Non-Fatal Workplace Injuries and Illnesses on Mortality. Am. J. Ind. Med. 2016. [Google Scholar] [CrossRef]
- Gavious, A.; Mizrahi, S.; Shani, Y.; Minchuk, Y. The Costs of Industrial Accidents for the Organization: Developing Methods and Tools for Evaluation and Cost-Benefit Analysis of Investment in Safety. J. Loss Prev. Process Ind. 2009. [Google Scholar] [CrossRef]
- Tsoukalas, V.D.; Fragiadakis, N.G. Prediction of Occupational Risk in the Shipbuilding Industry Using Multivariable Linear Regression and Genetic Algorithm Analysis. Saf. Sci. 2016, 83, 12–22. [Google Scholar] [CrossRef]
- Wurzelbacher, S.J.; Al-Tarawneh, I.S.; Meyers, A.R.; Bushnell, P.T.; Lampl, M.P.; Robins, D.C.; Tseng, C.Y.; Wei, C.; Bertke, S.J.; Raudabaugh, J.A.; et al. Development of Methods for Using Workers’ Compensation Data for Surveillance and Prevention of Occupational Injuries among State-Insured Private Employers in Ohio. Am. J. Ind. Med. 2016. [Google Scholar] [CrossRef]
- Pietilä, J.; Räsänen, T.; Reiman, A.; Ratilainen, H.; Helander, E. Characteristics and Determinants of Recurrent Occupational Accidents. Saf. Sci. 2018. [Google Scholar] [CrossRef]
- Hovden, J.; Albrechtsen, E.; Herrera, I.A. Is There a Need for New Theories, Models and Approaches to Occupational Accident Prevention? Saf. Sci. 2010. [Google Scholar] [CrossRef]
- Ciarapica, F.E.; Giacchetta, G. Classification and Prediction of Occupational Injury Risk Using Soft Computing Techniques: An Italian Study. Saf. Sci. 2009. [Google Scholar] [CrossRef]
- Robert, K.; Elisabeth, Q.; Josef, B. Analysis of Occupational Accidents with Agricultural Machinery in the Period 2008–2010 in Austria. Saf. Sci. 2015. [Google Scholar] [CrossRef]
- Salguero-Caparros, F.; Suarez-Cebador, M.; Rubio-Romero, J.C. Analysis of Investigation Reports on Occupational Accidents. Saf. Sci. 2015. [Google Scholar] [CrossRef]
- Yorio, P.L.; Wachter, J.K. The Impact of Human Performance Focused Safety and Health Management Practices on Injury and Illness Rates: Do Size and Industry Matter? Saf. Sci. 2014, 62, 157–167. [Google Scholar] [CrossRef]
- Chi, S.; Han, S.; Kim, D.Y.; Salminen, S.; Seo, H.C.; Lee, Y.S.; Kim, J.J.; Jee, N.Y.; Siu, O.L.; Phillips, D.R.; et al. Relationship between Unsafe Working Conditions and Workers’ Behavior and Impact of Working Conditions on Injury Severity in U.S. Construction Industry. Accid. Anal. Prev. 2016, 139, 1999–2011. [Google Scholar] [CrossRef]
- Trontin, C.; Béjean, S. Prevention of Occupational Injuries: Moral Hazard and Complex Agency Relationships. Saf. Sci. 2004, 42, 121–141. [Google Scholar] [CrossRef]
- Smith, G.S.; Veazie, M.A.; Benjamin, K.L. The Use of Sentinel Injury Deaths to Evaluate the Quality of Multiple Source Reporting for Occupational Injuries. Ann. Epidemiol. 2005, 15, 219–227. [Google Scholar] [CrossRef]
- Thepaksorn, P.; Pongpanich, S. Occupational Injuries and Illnesses and Associated Costs in Thailand. Saf. Health Work 2014. [Google Scholar] [CrossRef]
- Soltanzadeh, A.; Mohammadfam, I.; Moghimbeygi, A.; Ghiasvand, R. Exploring Causal Factors on the Severity Rate of Occupational Accidents in Construction Worksites. Int. J. Civ. Eng. 2017, 15, 959–965. [Google Scholar] [CrossRef]
- Merryweather, A.S.; Thiese, M.S.; Kapellusch, J.M.; Garg, A.; Fix, D.J.; Hegmann, K.T. Occupational Factors Related to Slips, Trips and Falls among Home Healthcare Workers. Saf. Sci. 2018, 107, 155–160. [Google Scholar] [CrossRef]
- Douphrate, D.I.; Rosecrance, J.C.; Reynolds, S.J.; Stallones, L.; Gilkey, D.P. Tractor-Related Injuries: An Analysis of Workers’ Compensation Data. J. Agromedicine 2009, 14, 198–205. [Google Scholar] [CrossRef]
- Chang, D.S.; Tsai, Y.C. Investigating the Long-Term Change of Injury Pattern on Severity, Accident Types and Sources of Injury in Taiwan’s Manufacturing Sector between 1996 and 2012. Saf. Sci. 2014. [Google Scholar] [CrossRef]
- Rezapour, M.; Moomen, M.; Ksaibati, K. Ordered Logistic Models of Influencing Factors on Crash Injury Severity of Single and Multiple-Vehicle Downgrade Crashes: A Case Study in Wyoming. J. Saf. Res. 2019. [Google Scholar] [CrossRef]
- Wang, K.; Lee, A.H.; Yau, K.K.W.; Carrivick, P.J.W. A Bivariate Zero-Inflated Poisson Regression Model to Analyze Occupational Injuries. Accid. Anal. Prev. 2003, 35, 625–629. [Google Scholar] [CrossRef]
- Chen, C.; Zhang, G.; Liu, X.C.; Ci, Y.; Huang, H.; Ma, J.; Chen, Y.; Guan, H. Driver Injury Severity Outcome Analysis in Rural Interstate Highway Crashes: A Two-Level Bayesian Logistic Regression Interpretation. Accid. Anal. Prev. 2016, 97, 69–78. [Google Scholar] [CrossRef]
- Field, W.E.; Heber, D.J.; Riedel, S.M.; Wettschurack, S.W.; Roberts, M.J.; Grafft, L.M.J. Worker Hazards Associated with the Use of Grain Vacuum Systems. J. Agric. Saf. Health 2014. [Google Scholar] [CrossRef]
- Pawlak, H.; Nowakowicz-Dębek, B. Agriculture: Accident-Prone Working Environment. Agric. Agric. Sci. Procedia 2015. [Google Scholar] [CrossRef]
- Zylbersztajn, D. Agribusiness Systems Analysis: Origin, Evolution and Research Perspectives. Rev. Adm. 2016. [Google Scholar] [CrossRef]
- Van Fleet, D. What Is Agribusiness? A Visual Description. Amity J. Agribus. 2016, 1, 1–6. [Google Scholar]
- Scott, A.J.; Hosmer, D.W.; Lemeshow, S. Applied Logistic Regression. Biometrics 2006. [Google Scholar] [CrossRef]
- Peng, C.Y.J.; Lee, K.L.; Ingersoll, G.M. An Introduction to Logistic Regression Analysis and Reporting. J. Educ. Res. 2002. [Google Scholar] [CrossRef]
- Hosmer, D.W.; Lemeshow, S. Applied Logistic Regression, 2nd ed.; John Wiley & Sons, Inc.: Hoboken, NJ, USA, 2000. [Google Scholar]
- Whittaker, J.; Agresti, A. Analysis of Ordinal Categorical Data. J. R. Stat. Soc. Ser. A 2006. [Google Scholar] [CrossRef]
- Deeks, J.; Bracken, M.B.; Sinclair, J.C.; Davies, H.T.O.; Tavakoli, M.; Crombie, I.K. When Can Odds Ratios Mislead? BMJ. 1998. [Google Scholar] [CrossRef]
- Szumilas, M. A Comparison of Geothermal Activity in Iceland and the Mediterranean Area. J. Can. Acad. Child Adolesc. Psychiatry 2010, 19, 227–229. [Google Scholar] [PubMed]
- Garson, D.G. Logictic Resgression: Binary & Multinominal; Statistical Associates Publishers: Asheboro, NC, USA, 2013; pp. 1–52. [Google Scholar]
- Menard, S. Coefficients of Determination for Multiple Logistic Regression Analysis. Am. Stat. 2000. [Google Scholar] [CrossRef]
- Proust, M. JMP 11 Basic Analysis. Available online: https://www.jmp.com/support/help/14-2/logistic-regression-models.shtml (accessed on 1 June 2019).
- Yong Jeong, B. Comparisons of Variables between Fatal and Nonfatal Accidents in Manufacturing Industry. Int. J. Ind. Ergon. 1999. [Google Scholar] [CrossRef]
- Swaen, G.M.H. Fatigue as a Risk Factor for Being Injured in an Occupational Accident: Results from the Maastricht Cohort Study. Occup. Environ. Med. 2003. [Google Scholar] [CrossRef] [PubMed]
- Unsar, S.; Sut, N. General Assessment of the Occupational Accidents That Occurred in Turkey between the Years 2000 and 2005. Saf. Sci. 2009. [Google Scholar] [CrossRef]
- Ramaswamy, S.K.; Mosher, G.A. Using Workers’ Compensation Claims Data to Characterize Occupational Injuries in the Biofuels Industry. Saf. Sci. 2018. [Google Scholar] [CrossRef]
- Alizadeh, S.S.; Mortazavi, S.B.; Sepehri, M.M. Analysis of Occupational Accident Fatalities and Injuries Among Male Group in Iran Between 2008 and 2012. Iran. Red Crescent Med. J. 2015. [Google Scholar] [CrossRef]
- Mehrdad, R.; Seifmanesh, S.; Chavoshi, F.; Aminian, O.; Izadi, N. Epidemiology of Occupational Accidents in Iran Based on Social Security Organization Database. Iran. Red Crescent Med. J. 2014. [Google Scholar] [CrossRef]
- Kaassis, B.; Badri, A. Development of a Preliminary Model for Evaluating Occupational Health and Safety Risk Management Maturity in Small and Medium-Sized Enterprises. Safety 2018, 4, 5. [Google Scholar] [CrossRef]
- Comberti, L.; Demichela, M.; Baldissone, G.; Fois, G.; Luzzi, R. Large Occupational Accidents Data Analysis with a Coupled Unsupervised Algorithm: The S.O.M. K-Means Method. An Application to the Wood Industry. Safety 2018, 4, 51. [Google Scholar] [CrossRef]
- Davoudi Kakhki, F.; Freeman, S.; Mosher, G. Analyzing Large Workers’ Compensation Claims Using Generalized Linear Models and Monte Carlo Simulation. Safety 2018, 4, 57. [Google Scholar] [CrossRef]
© 2019 by the authors. Licensee MDPI, Basel, Switzerland. This article is an open access article distributed under the terms and conditions of the Creative Commons Attribution (CC BY) license (http://creativecommons.org/licenses/by/4.0/).