Abstract
Fused filament fabrication (FFF) is commonly employed in multiple domains to realize inexpensive and flexible material extrusion systems with thermoplastic materials. Among the several types of thermoplastic materials, polylactic acid (PLA), an environment-friendly bio-plastic, is commonly used for FFF for the sake of the safety of the manufacturing process. However, thermal degradation of three-dimensionally (3D)-printed PLA products is inevitable, and it is one of the failure mechanisms of thermoplastic products. The present study focuses on the thermal degradation of 3D-printed PLA specimens. A classification methodology using artificial neural networks (ANNs) based on Fourier transform infrared (FTIR) and was developed. Under the given experimental conditions, the ANN model could classify four levels of thermal degradation. Among the FTIR spectra recorded from 650 cm−1 to 4000 cm−1, the ANN model could suggest the best wavenumber ranges for classification.
1. Introduction
Additive manufacturing or three-dimensional (3D) printing is widely used in several industrial areas such as automotive, aerospace, mechanical, medicine, biological systems, and food supply chains [1]. Based on 3D CAD data, additive manufacturing can be used to fabricate complex geometries economically with a wide variety of materials. Polymers are the most commonly used materials in the 3D printing industry owing to their diversity and ease of adaptation to different 3D printing processes [2]. Typically, polymers are available in the following forms: thermoplastic filaments, reactive monomers, resin, and powder [3]. However, a major disadvantage associated with polymers is the generation of toxic materials, such as volatile organic compounds and ultrafine particles, during 3D printing. Wojtyla et al. [4] studied the toxicity of 3D printing. They investigated four thermoplastics, namely, acrylonitrile-butadiene-styrene (ABS), polylactic acid (PLA), polyethylene terephthalate (PET), and nylon. They reported that PLA is considerably less toxic than ABS. Polylactic acid is a bioplastic that is environment-friendly, bio-based, and biodegradable. Owing to environmental concerns, Copinet et al. [5] tried to estimate the biodegradation of a co-extruded starch/poly (lactic acid) polymeric material. Lanzotti et al. [6] studied the mechanical properties of virgin and recycled PLA. Currently, fused filament fabrication (FFF) using PLA is commonly used by the public [7].
However, PLA is characterized by poor toughness, brittleness, and low elongation at break in commercial applications. Tymrak et al. [8] measured the mechanical properties of 3D-printed PLA specimens in realistic environmental conditions. Kumar et al. [9] suggested a methodology to improve the mechanical, thermal, and degradation properties of PLA by blending it with lignin. Wittbrodt and Pearce [10] investigated the effects of the color of PLA on its material properties. To broaden the scope of application of PLA, the thermal degradation or aging of PLA must be understood because it is one of the failure mechanisms of polymer products [11].
Analysis of Fourier-transform infrared (FTIR) spectra is one of the best methods for understanding the degradation of PLA. FTIR spectroscopy is a non-destructive and quick technique to access molecular-level change of materials, so it is easy to generate big data. In order to observe changes in the molecular level, there are several other technologies such as Raman spectroscopy, mass spectrometry, nuclear magnetic resonance spectroscopy (NMR), and X-ray photoelectron spectroscopy [12]. Kumar et al. [9] used FTIR and differential scanning calorimetry (DSC) to verify the formation of PLA–TAIC–Lignin cross-linked structures. Liu et al. [13] employed thermogravimetry (TG)-FTIR to investigate the effects of PLA degradation with two additives, namely, starch and wood flour. Gonzalez et al. [14] studied PLA/TiO2 nanocomposites by using FT-NIR spectra. Leroy et al. [15] used FTIR to monitor PLA degradation in implantable medical devices. However, interpreting FTIR spectra is difficult. Therefore, this study uses artificial neural networks (ANNs), a deep-learning technique, in this study. Zhang [16] reported that the thermal degradation of 3D-printed ABS and PLA could be classified using ANNs based on FTIR. He found that the FTIR spectra of PLA are harder to distinguish than those of ABS. The present study focuses on the thermal degradation of 3D-printed PLA and classifies it by using ANNs based on FTIR. In addition, this study determines the best wavenumber range among the FTIR spectra for classifying the degree of PLA degradation.
2. Methodology
2.1. 3D Printed Specimen
A 3D printer (DP201, Shindoh) was used to fabricate the PLA specimens based on 3D CAD data, as shown in Figure 1. The specimen shape is based on ASTM D638 Type IV.
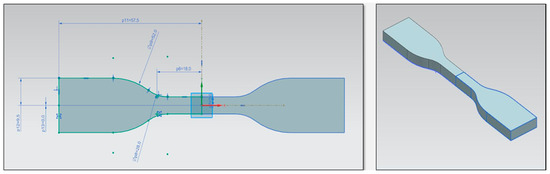
Figure 1.
ASTM D638 Type IV.
To print the specimens, layer thickness and infill density were set to 0.2 mm and 100%, respectively. Temperatures of the nozzle and the bed were set to 200 °C and 60 °C, respectively. Figure 2 shows the 3D-printed PLA specimen, on which three random measurement locations for FTIR spectroscopy are marked. Fifty FTIR spectra were recorded at each measurement location.
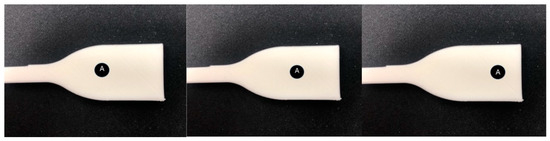
Figure 2.
Measurement locations for the Fourier transform infrared (FTIR) spectroscopy.
2.2. High-Temperature Storage Test for PLA Thermal Degradation
In this study, we performed a high-temperature storage test for realizing PLA degradation. A storage chamber with two control factors of time and temperature was employed (SH-662, ESPEC, Osaka, Japan). This study focuses on one control factor of the temperature. Eight temperature splits were defined: 20 °C, 40 °C, 60 °C, 80 °C, 100 °C, 120 °C, 140 °C, and 160 °C. For all temperature splits, the degradation time was set to 24 h.
2.3. Fourier-Transform Infrared Spectroscopy
An FTIR spectrometer (Nicolet iS10, ThermoFisher Scientific) was used to obtain the spectra of the PLA specimens. Each FTIR spectrum was obtained at the predefined measurement locations on the specimen. The total number of data points generated in each FTIR measurement was 6948. The number of repetitions was set to 150 per case. Figure 3 shows five repetitions per temperature split for all degradation cases. The x- and the y-axes represent wavenumber and absorbance, respectively.
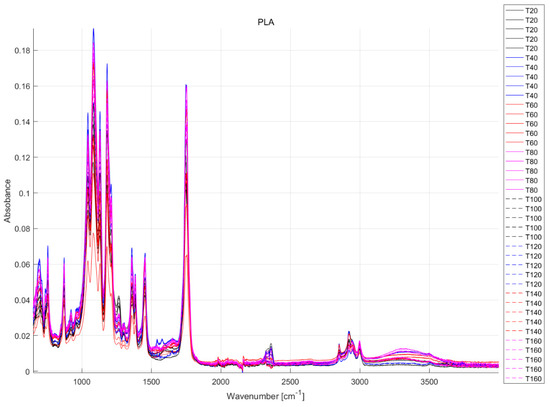
Figure 3.
Forty FTIR spectra for all degradation cases.
In total, 1200 FTIR datasets were input into the ANNs, as given in Table 1. Table 1 presents the names and descriptions of these datasets. Among all the datasets, this study used ten datasets per case to evaluate the ANN models; the study used the other datasets for training.

Table 1.
Description of Fourier transform infrared (FTIR) datasets.
2.4. Training Strategy for Artificial Neural Networks
Multi-layer perception (MLP), as artificial neural networks (ANNs), was used to classify the degree of thermal degradation of the PLA specimens used herein. The previous MLP model with nine hidden layers [16] was found to be unsuitable for this problem. So a new ANN model and a training strategy were required, as shown in Figure 4 and Figure 5.
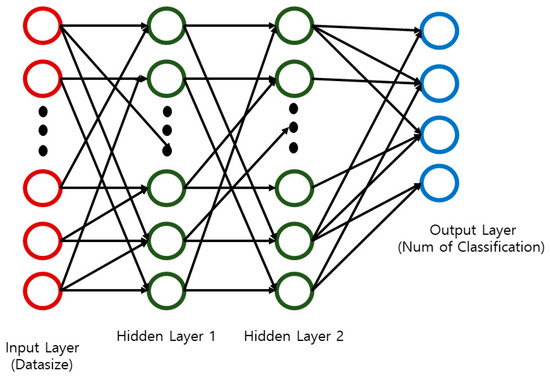
Figure 4.
An artificial neural networks (ANNs) model.
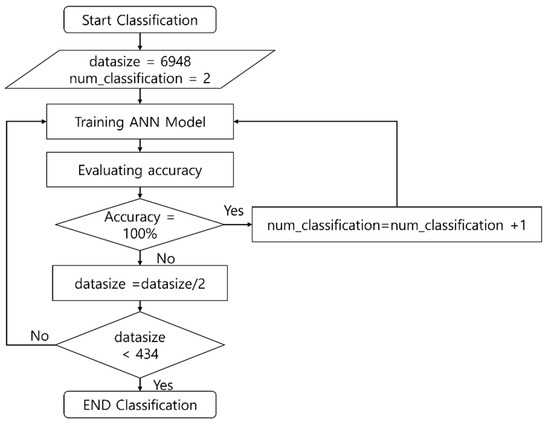
Figure 5.
Training strategy for ANNs.
The ANN model comprises one input layer, two hidden layers, and one output layer. Each layer includes several nodes called artificial neurons. The numbers of nodes for the input and output layers represent data size and number of classifications. In this study, an activation function for the nodes was the Rectified Linear Unit (ReLU) [17], which is currently known as the most successful and widely-used activation function [18].
The initial values of the data size and the number of classifications were set to 6948 and 2, respectively. The data size denotes the total data points per FTIR measurement. The number of classifications refers to the number of thermal degradation degrees classified by an ANN model. After training the ANN model, if its accuracy was 100%, the number of classification was increased by one. Otherwise, the data size was reduced by half. The ANN model was generated according to the following rules [19]:
- The number of hidden layers is fixed to two;
- The size of the hidden layers should be between the sizes of the input and the output layers;
- The number of hidden neurons should be half that, in case of the previous hidden layer.
3. Results and Discussion
3.1. Input Datasets for ANNs
The high-temperature storage test was performed to thermally degrade the 3D-printed PLA specimens, as shown in Figure 6. The color of the specimens changed according to the test conditions. When the chamber temperature was set to 160 °C, the color of the PLA specimens changed from white to brown. For the other temperature splits, the changes in specimen color were barely discernible.
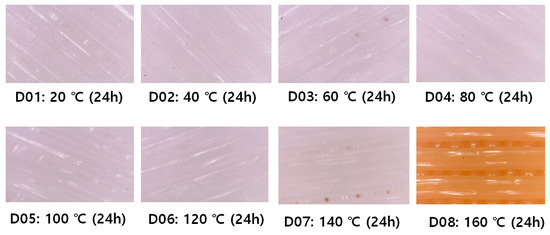
Figure 6.
3D printed polylactic acid (PLA) specimens according to the degree of thermal degradation.
The FTIR measurements were performed at the predefined locations. To precisely classify the degree of degradation, the data size was changed, as shown in Figure 7. As the data size decreased, the number of divisions in FTIR spectra increased. P1/2 refers to the wavenumber range of 650–2455 cm−1. P2/2 refers to the wavenumber range of 2456–4000 cm−1.
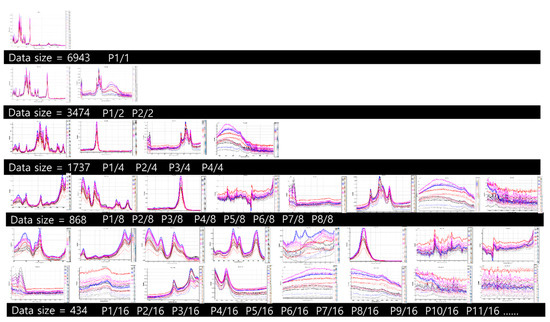
Figure 7.
The number of divisions for FTIR spectra as input datasets for ANNs.
3.2. Validation of ANN Models
This study trained and validated several ANN models with two hidden layers by using the training and the test sets, respectively. The number of classifications output by the ANN models depended on the input datasets. The maximum number of classifications was four under this study. The ANN models could only classify D01, D02, D07, and D08, when the number of divisions in FTIR spectra ranged between four and sixteen. More datasets and preprocessing of FTIR spectroscopy may increase the number of classifications; this will require further work. For the four datasets D01, D02, D07, and D08, the accuracy of the ANN models varied with data size and wavenumber range, as given in Table 2. Table 2 lists the names of the divisions and the corresponding wavenumber range, as well as the accuracy of the ANN model. The ANN model registered 100% accuracy for the seven divisions of P2/4, P3/8, P7/8, P1/16, P2/16, P3/16, and P4/16.
Table 2.
Accuracy of the artificial neural network (ANN) model according to the range of wavenumber.
Moreover, the last column presents several characteristic peaks of neat PLA, which are described in Table 3. When the number of divisions of the FTIR spectra is four or eight, the accuracies of the ANN models for the divisions P2/4, P3/8, and P7/8 are consistent with the characteristic peaks of 1184 cm−1, 1757 cm−1, and 3501 cm−1, respectively. When the number of divisions of the FTIR spectra is 16, the accuracies of the ANN models for the divisions P1/16, P2/16, and P3/16 correspond to the characteristic peaks of 757 cm−1, 870 cm−1, 956 cm−1, and 1184 cm−1. Therefore, (-C-C-) stretching in the crystalline and the amorphous phases, (C-CH3) stretching, (C-O-C) asymmetric stretching, carbonyl group (C=O) stretching, and stretching of the carboxylic acid terminal group appear to be good classifiers for the ANN models used in this study.
Table 3.
Description of diverse characteristic peaks for the neat PLA [9,20,21].
4. Conclusions
By using experimental data, this study demonstrated herein that thermal degradation of 3D-printed PLA could be classified using ANNs based on FTIR. Among the eight types of FTIR datasets, the ANN model could classify four levels of thermal degradation. As the wavenumber range varied, the accuracy of the ANN model changed. The ANN model could suggest the best wavenumber ranges. The ANN model was 100% accurate for the seven wavenumber divisions of P2/4, P3/8, P7/8, P1/16, P2/16, P3/16, and P4/16. The wavenumber ranges, including the characteristic peaks of 757 cm−1, 870 cm−1, 956 cm−1, 1184 cm−1, 1757 cm−1, and 3501 cm−1, correspond to a higher accuracy of the ANN model. In this study, the following classifiers for the thermal degradation of 3D-printed PLA were identified: (-C-C-) stretching in the crystalline and the amorphous phases, (C-CH3) stretching, (C-O-C) asymmetric stretching, carbonyl group (C=O) stretching, and stretching of the carboxylic acid terminal group.
Currently, this methodology has used FTIR datasets without any preprocessing such as normalization. This study assumed ANNs could classfy raw FTIR spectra. However, the preprecessing of the datasets may give better performance to ANNs so that it could be futher work.
Funding
This work was supported by the National Research Foundation of Korea (NRF) grant funded by the Korean government (MSIT) (No. NRF-2017R1C1B5074219) and the Korea Basic Science Institute(KBSI) National Research Facilities & Equipment Center (NFEC) grant funded by the Korea government (Ministry of Education) (No. 2019R1A6C1010045).
Conflicts of Interest
The author declare no conflict of interest.
References
- Gao, W.; Zhang, Y.; Ramanujan, D.; Ramani, K.; Chen, Y.; Williams, C.B.; Wang, C.C.; Shin, Y.C.; Zhang, S.; Zavattieri, P.D. The status, challenges, and future of additive manufacturing in engineering. Comput. Des. 2015, 69, 65–89. [Google Scholar] [CrossRef]
- Low, Z.X.; Chua, Y.T.; Ray, B.M.; Mattia, D.; Metcalfe, I.S.; Patterson, D.A. Perspective on 3D printing of separation membranes and comparison to related unconventional fabrication techniques. J. Membr. Sci. 2017, 523, 596–613. [Google Scholar] [CrossRef]
- Ngo, T.D.; Kashani, A.; Imbalzano, G.; Nguyen, K.T.; Hui, D. Additive manufacturing (3D printing): A review of materials, methods, applications and challenges. Compos. Part B Eng. 2018, 143, 172–196. [Google Scholar] [CrossRef]
- Wojtyła, S.; Klama, P.; Baran, T. Is 3D printing safe? Analysis of the thermal treatment of thermoplastics: ABS, PLA, PET, and nylon. J. Occup. Environ. Hyg. 2017, 14, D80–D85. [Google Scholar] [CrossRef] [PubMed]
- Copinet, A.; Legin-Copinet, E.; Erre, D. Compostability of Co-extruded starch/poly(lactic acid) polymeric material degradation in an activated inert solid medium. Materials (Basel) 2009, 2, 749–764. [Google Scholar] [CrossRef]
- Lanzotti, A.; Martorelli, M.; Maietta, S.; Gerbino, S.; Penta, F.; Gloria, A. A comparison between mechanical properties of specimens 3D printed with virgin and recycled PLA. Procedia CIRP 2019, 79, 143–146. [Google Scholar] [CrossRef]
- Brenken, B.; Barocio, E.; Favaloro, A.; Kunc, V.; Pipes, R.B. Fused filament fabrication of fiber-reinforced polymers: A review. Addit. Manuf. 2018, 21, 1–16. [Google Scholar] [CrossRef]
- Tymrak, B.M.; Kreiger, M.; Pearce, J.M. Mechanical properties of components fabricated with open-source 3-D printers under realistic environmental conditions. Mater. Des. 2014, 58, 242–246. [Google Scholar] [CrossRef]
- Kumar, A.; Tumu, V.R.; Chowdhury, S.R.; SVS, R.R. A green physical approach to compatibilize a bio-based poly (lactic acid)/lignin blend for better mechanical, thermal and degradation properties. Int. J. Biol. Macromol. 2019, 121, 588–600. [Google Scholar] [CrossRef] [PubMed]
- Wittbrodt, B.; Pearce, J.M. The effects of PLA color on material properties of 3-D printed components. Addit. Manuf. 2015, 8, 110–116. [Google Scholar] [CrossRef]
- Xu, H.; Tang, Y.; Liu, Z.; Cai, Y.; Wang, Y. The Study of Typical Failure Modes and Failure Mechanism of Polymer Materials. IOP Conf. Ser. Mater. Sci. Eng. 2017, 231, 1–6. [Google Scholar] [CrossRef]
- Faghihzadeh, F.; Anaya, N.M.; Schifman, L.A.; Oyanedel-Craver, V. Oyanedel-Craver.Fourier transform infrared spectroscopy to assess molecular-level changes in microorganisms exposed to nanoparticles. Nanotechnol. Environ. Eng. 2016, 1, 1–16. [Google Scholar] [CrossRef]
- Liu, X.; Khor, S.; Petinakis, E.; Yu, L.; Simon, G.; Dean, K.; Bateman, S. Effects of hydrophilic fillers on the thermal degradation of poly(lactic acid). Thermochim. Acta 2010, 509, 147–151. [Google Scholar] [CrossRef]
- González, E.A.S.; Teno, J.; González-Benito, J.; Olmos, D. Accurate Evaluation of Dynamics and Specific Interactions in PLA/TiO2 Nanocomposites. Sci. J. Mol. Phys. 2017, 1, 1–13. [Google Scholar]
- Leroy, A.; Ribeiro, S.; Grossiord, C.; Alves, A.; Vestberg, R.H.; Salles, V.; Brunon, C.; Gritsch, K.; Grosgogeat, B.; Bayon, Y. FTIR microscopy contribution for comprehension of degradation mechanisms in PLA-based implantable medical devices. J. Mater. Sci. Mater. Med. 2017, 28, 87. [Google Scholar] [CrossRef] [PubMed]
- Zhang, S.U. Degradation Classification of 3D Printing Thermoplastics Using Fourier Transform Infrared Spectroscopy and Artificial Neural Networks. Appl. Sci. 2018, 8, 1224. [Google Scholar] [CrossRef]
- Nair, V.; Hinton, G.E. Rectified Linear Units Improve Restricted Boltzmann Machines. In Proceedings of the ICML’10 27th International Conference on International Machine Learning, Haifa, Israe, 21–24 June 2010; pp. 807–814. [Google Scholar]
- Ramachandran, P.; Zoph, B.; Le, Q.V. Searching for Activation Functions. In Proceedings of the ICLR 2018 Conference Blind Submission, Vancouver, BC, Canada, 6 February 2018; pp. 1–13. [Google Scholar]
- Heaton, J. Introduction to Neural Networks for Java, 2nd ed.; Heaton Research: St. Louis, MO, USA, 2008. [Google Scholar]
- Kumar, A.; Rao, T.V.; Chowdhury, S.R.; Reddy, S.R. Compatibility confirmation and refinement of thermal and mechanical properties of poly (lactic acid)/poly (ethylene-co-glycidyl methacrylate) blend reinforced by hexagonal boron nitride. React. Funct. Polym. 2017, 117, 1–9. [Google Scholar] [CrossRef]
- Nanthananon, P.; Seadan, M.; Pivsa-Art, S.; Suttiruengwong, S. Enhanced crystallization of poly (lactic acid) through reactive aliphatic bisamide. IOP Conf. Ser. Mater. Sci. Eng. 2015, 87, 012067. [Google Scholar] [CrossRef]
© 2019 by the author. Licensee MDPI, Basel, Switzerland. This article is an open access article distributed under the terms and conditions of the Creative Commons Attribution (CC BY) license (http://creativecommons.org/licenses/by/4.0/).