Fine Exploration and Control of Subway Crossing Karst Area


Abstract
:Featured Application
Abstract
1. Introduction
- Shield machine pitch, jamming or water inrush (Figure 2);
- Karst cave collapse above the tunnel leading to the surface collapse;
- During the operation period, vehicle vibration causing surface collapse or karst cave collapse under the segment, which leads to risks in train operation;
- The existence of karst water leading to the continuous development of karst caves, which threatens the long-term operation of the metro.
2. Quantitative Exploration Method of Karst Cave Based on Three-Dimensional Laser Measurement
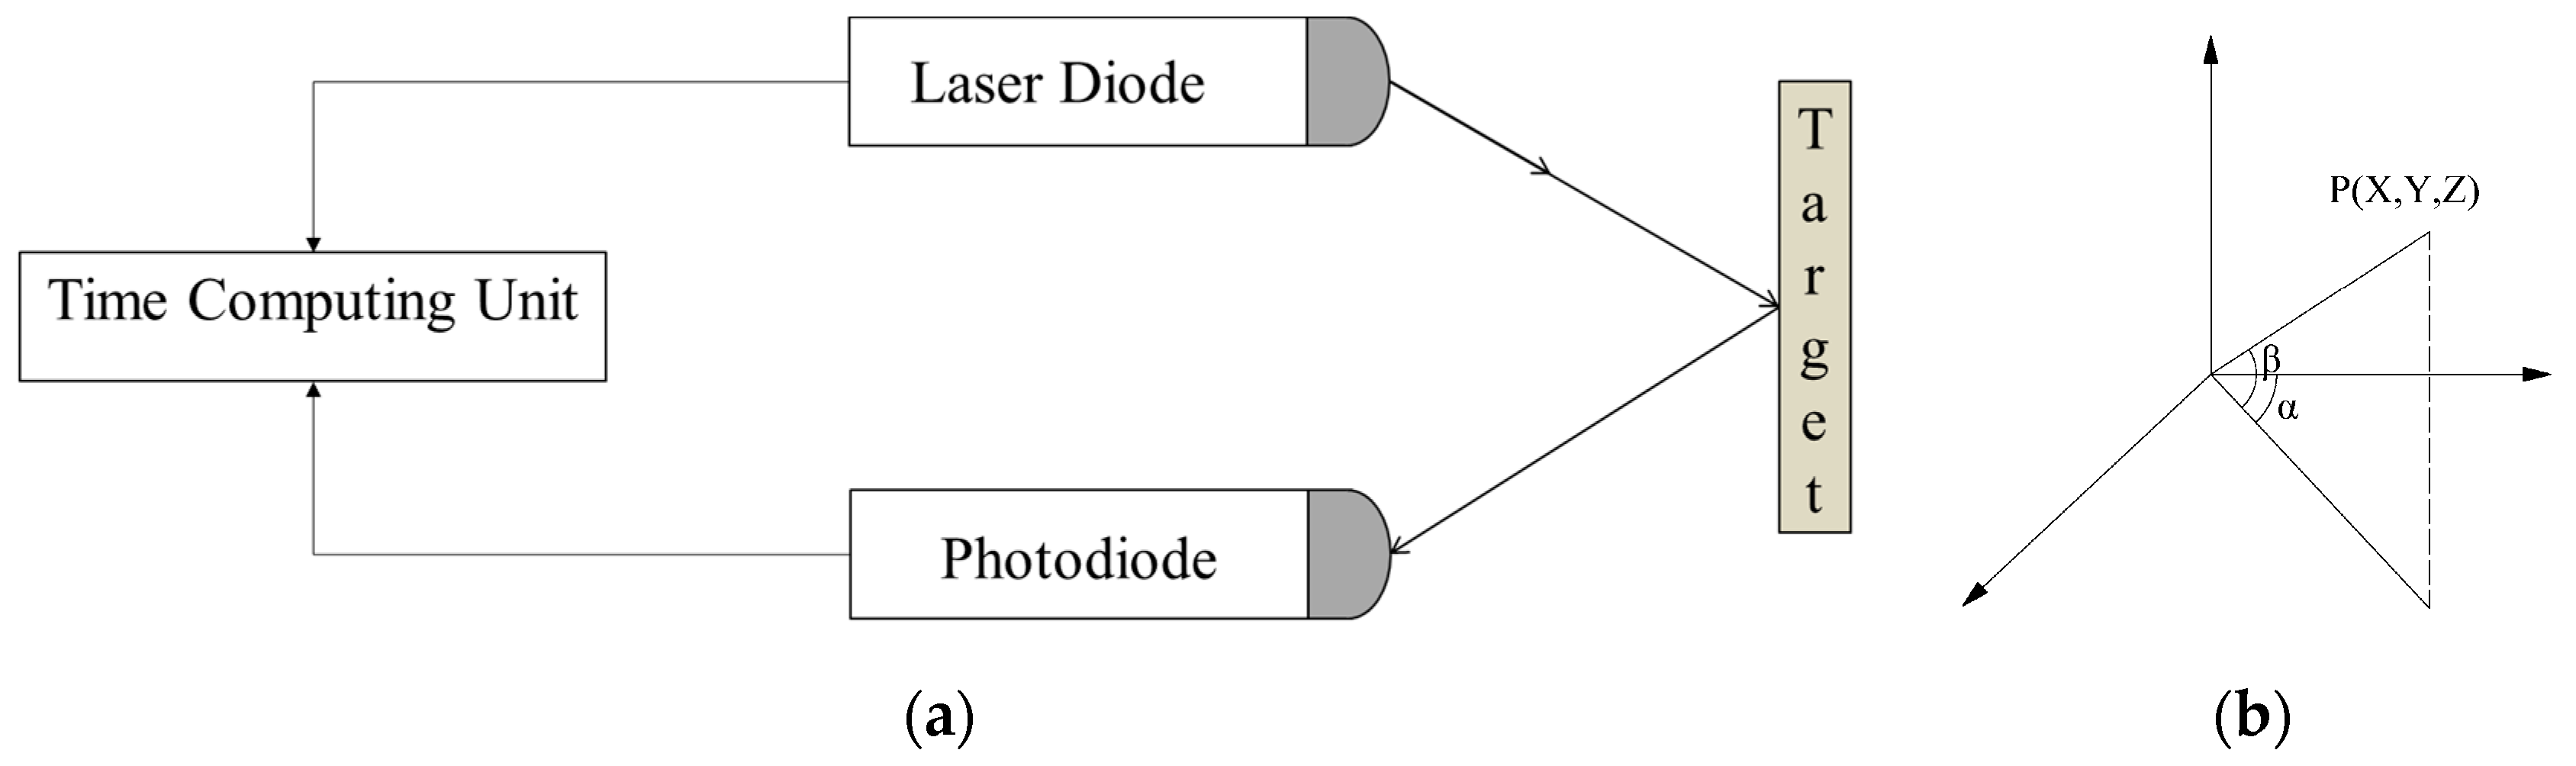
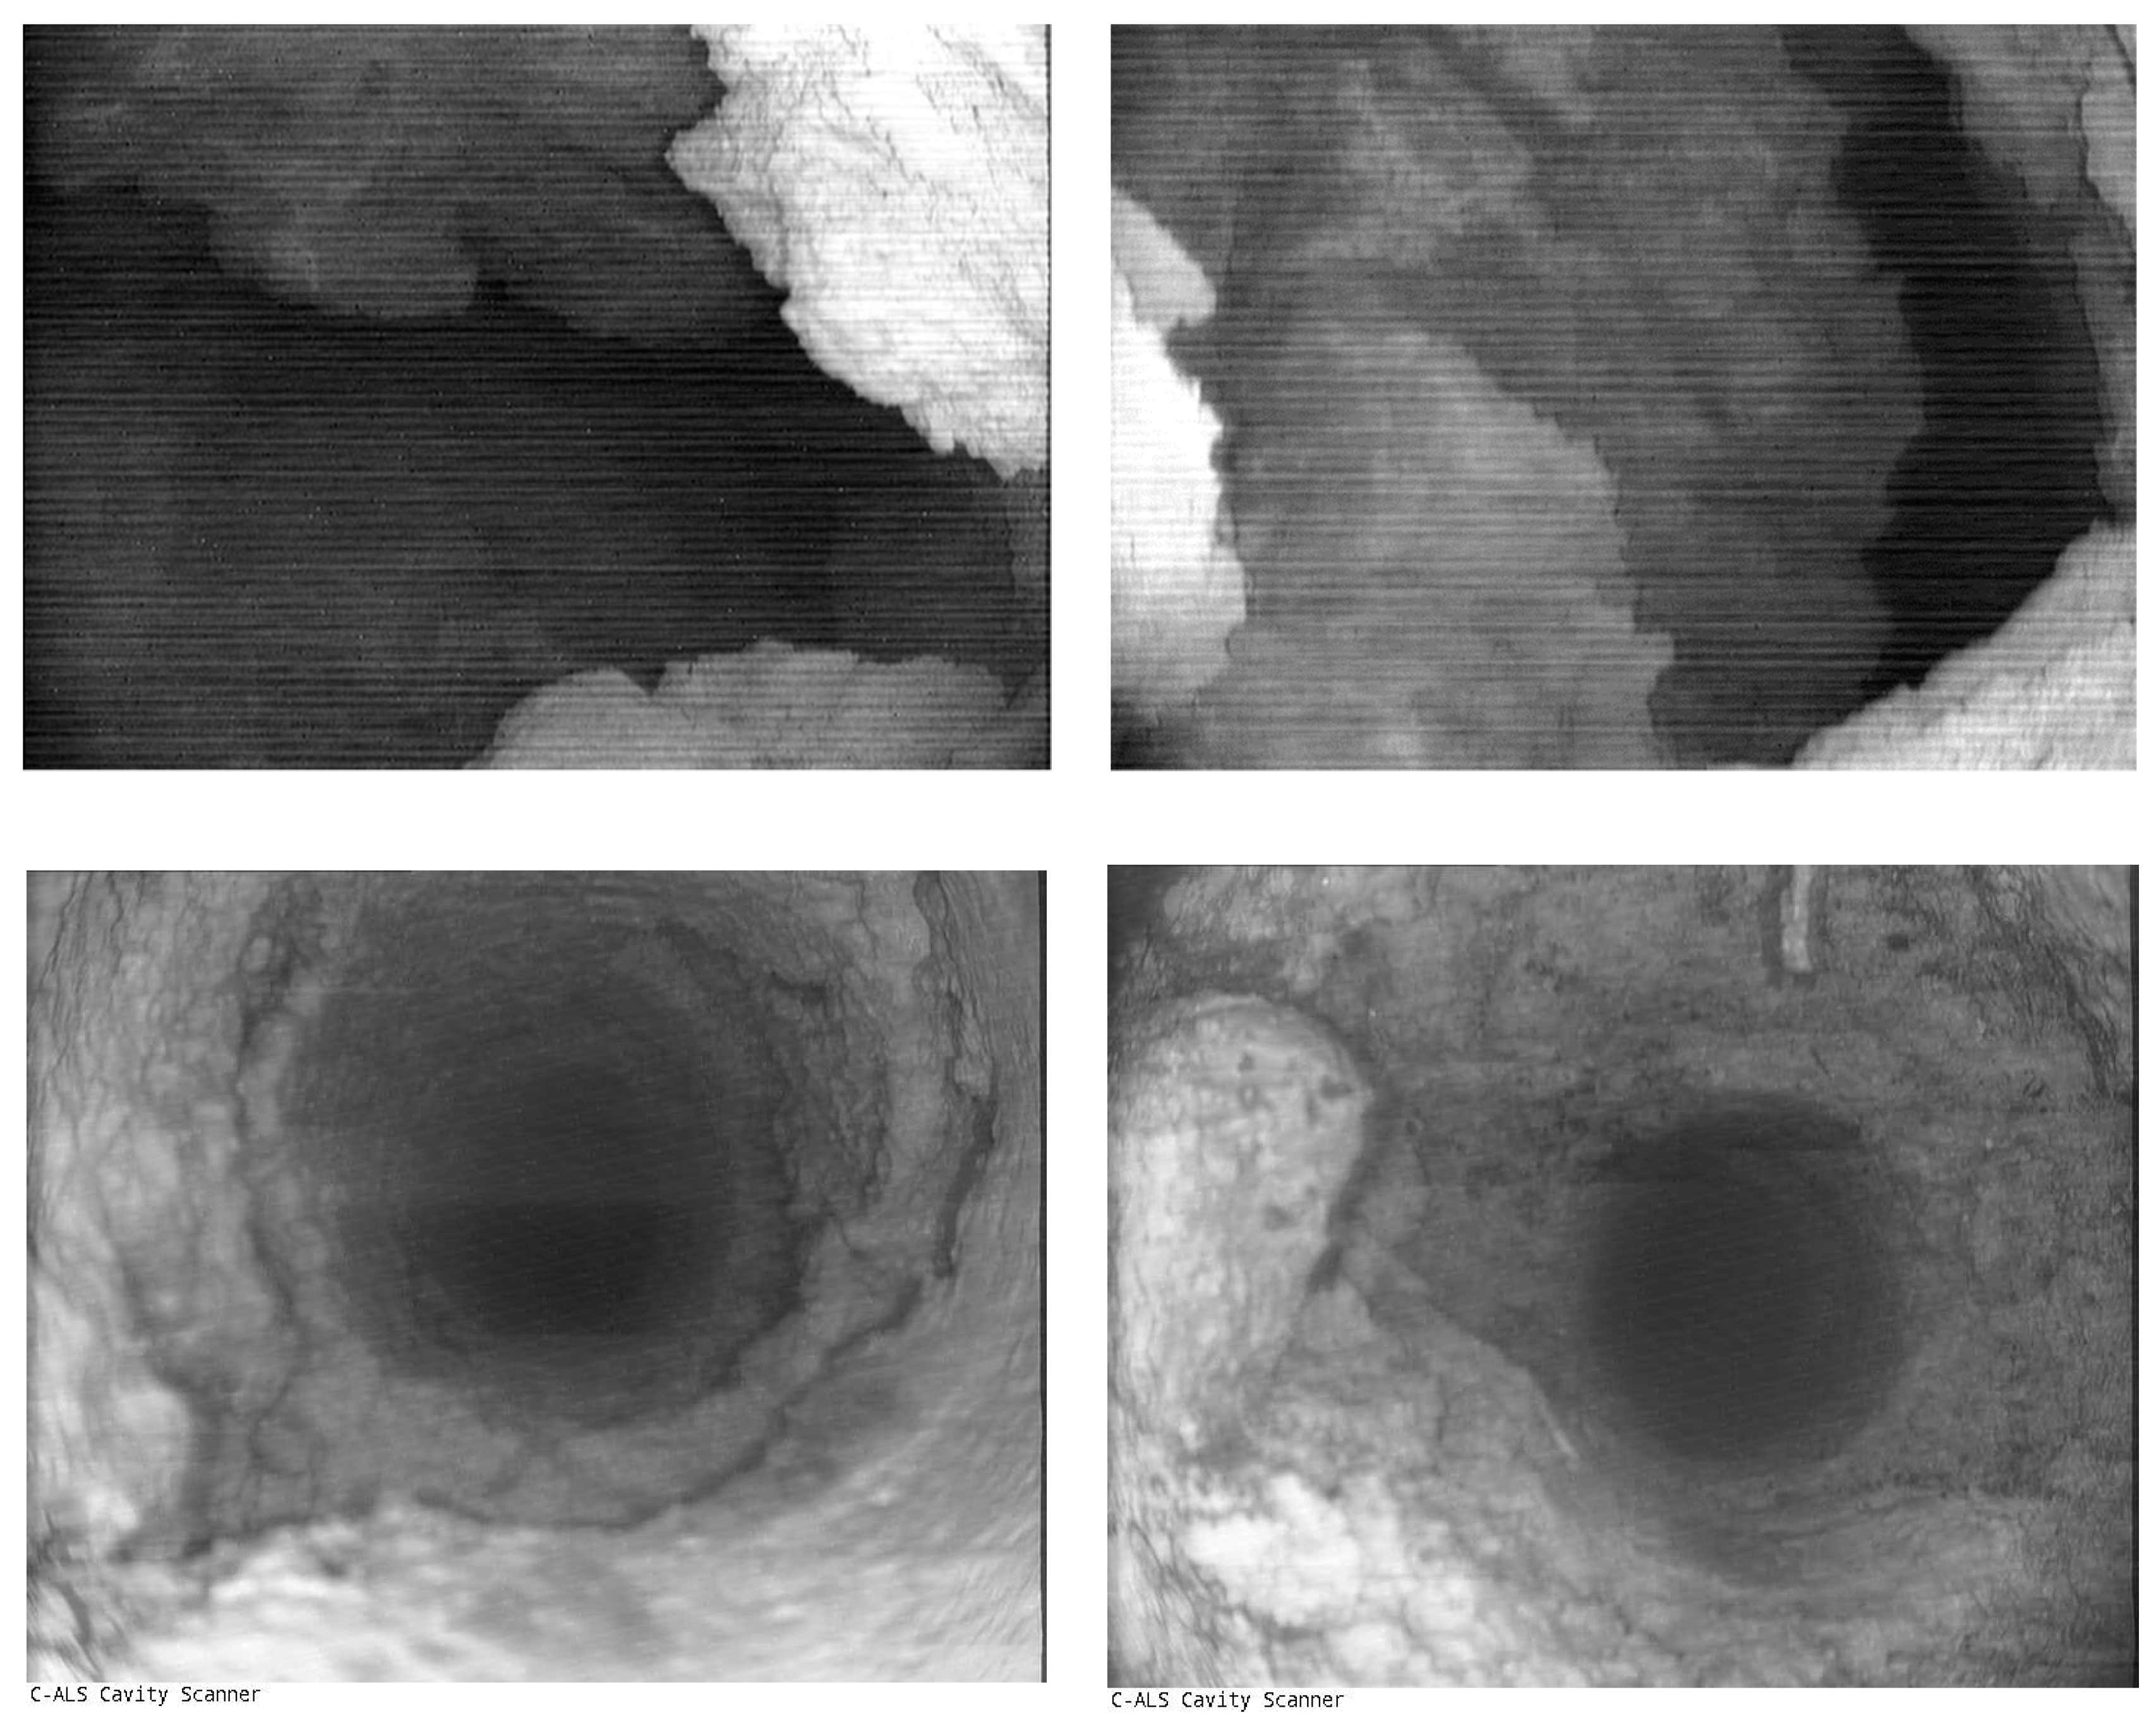
2.1. 3-D Automatic Laser Scanning Technology
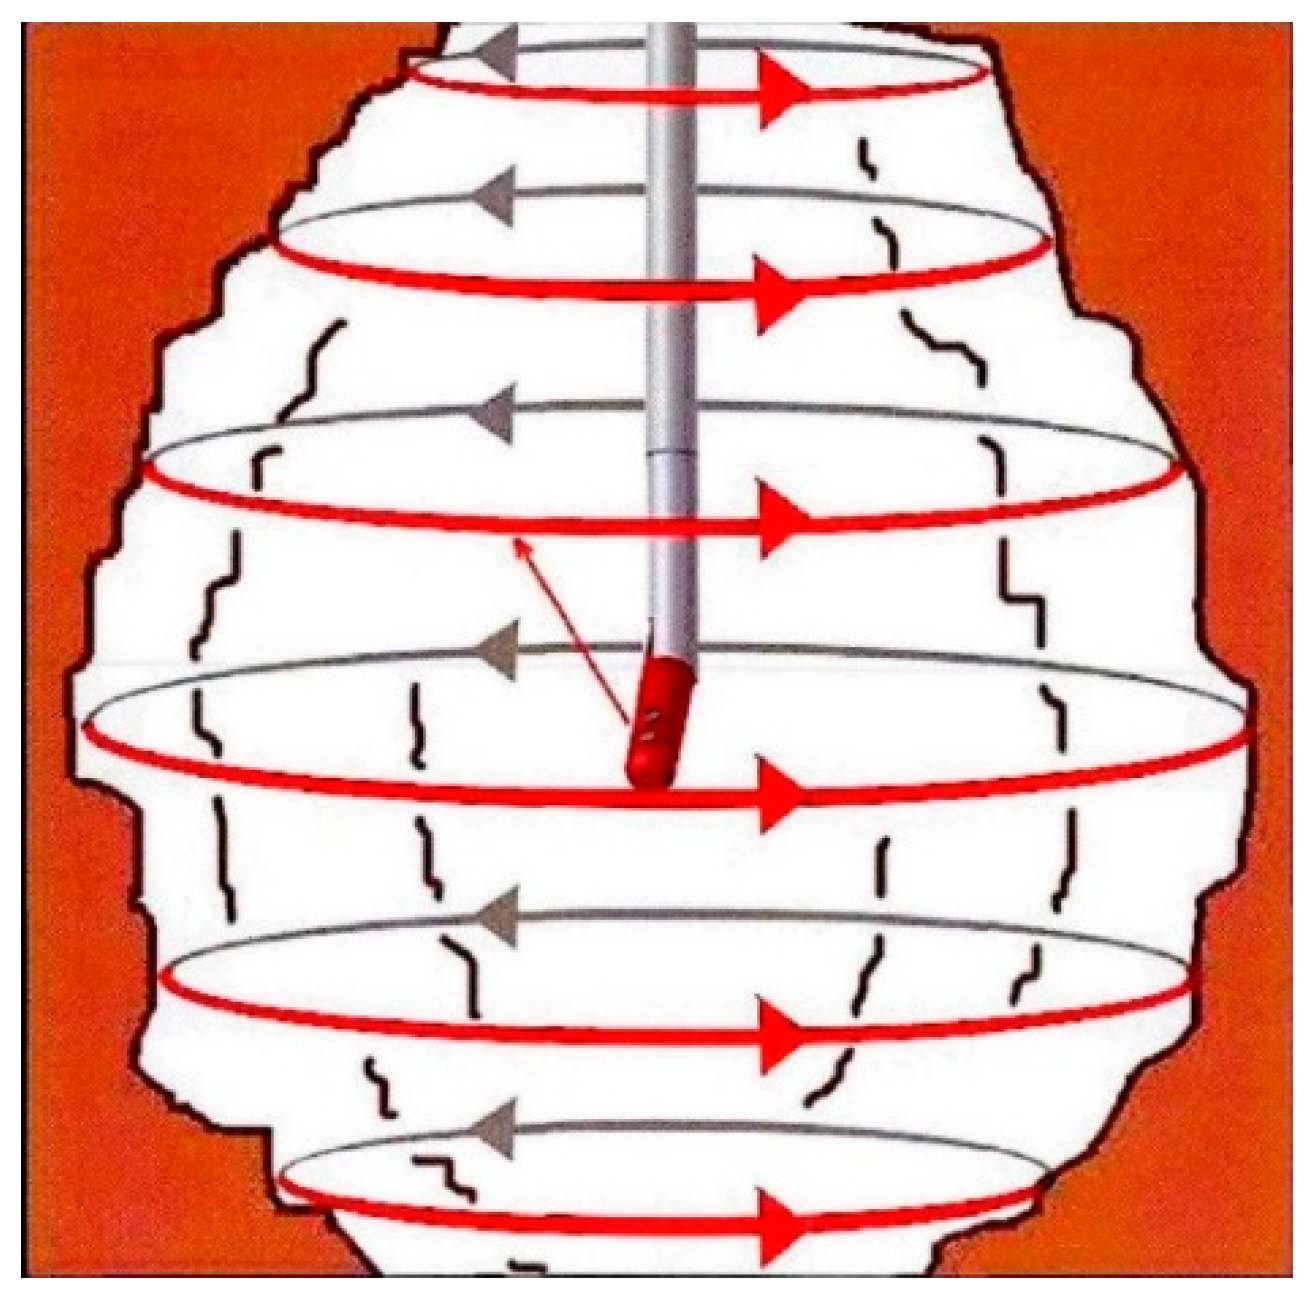
- Horizontal scanning mode: The most commonly used scanning mode. First, the scanning head rotates vertically to the position of vertical angle 0° (the upper part of the detector is straight) and begins the first round of complete 360° horizontal scanning. After each circle of horizontal scanning, the scanning head increases the increment of steps set by the user along the vertical direction and starts the next circle of horizontal scanning until the vertical axis rotates 180° in the vertical direction. During the last horizontal scan of the scanner head, the laser emission and receiving lens of the scanner head point in front of the detector (Figure 4).
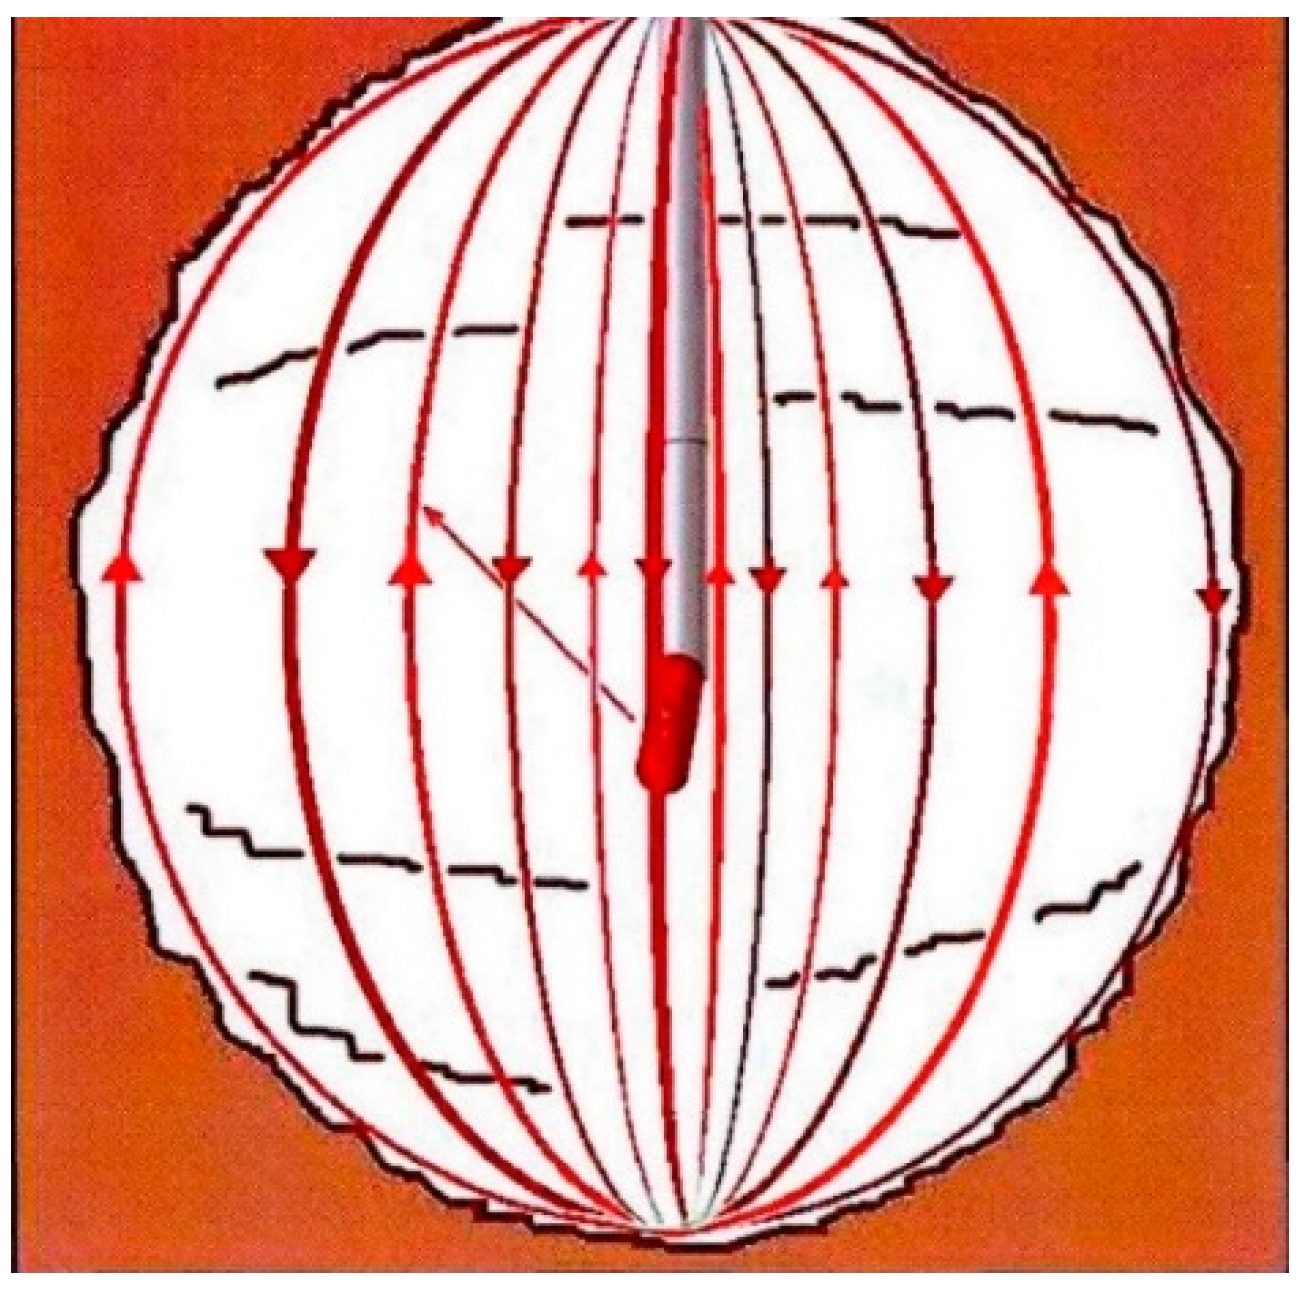
- Vertical scanning mode: Vertical scanning is suitable for scanning under some special conditions. Especially, the scanning line obtained is perpendicular to the horizontal characteristics of the scanning object so that more details that are comprehensive can be captured. As shown in the figure, in the vertical scanning process, the scanning head first rotates from vertical angle position 0 (the vertical direction behind the detector) to vertical angle position 180° (the laser-transmitting and -receiving lens of the scanning head points in front of the detector) along the vertical direction and completes the first vertical scanning. After each vertical scan, the scanning head increases a user-set increment along the horizontal direction and starts the next vertical scan until the horizontal axis rotates 360 degrees in the horizontal direction (Figure 5).
2.2. Data Processing of Laser Point Cloud
3. General Situation of Engineering Geology and Location and Quantitative Exploration Method of Jinan Metro’s Karst Cave
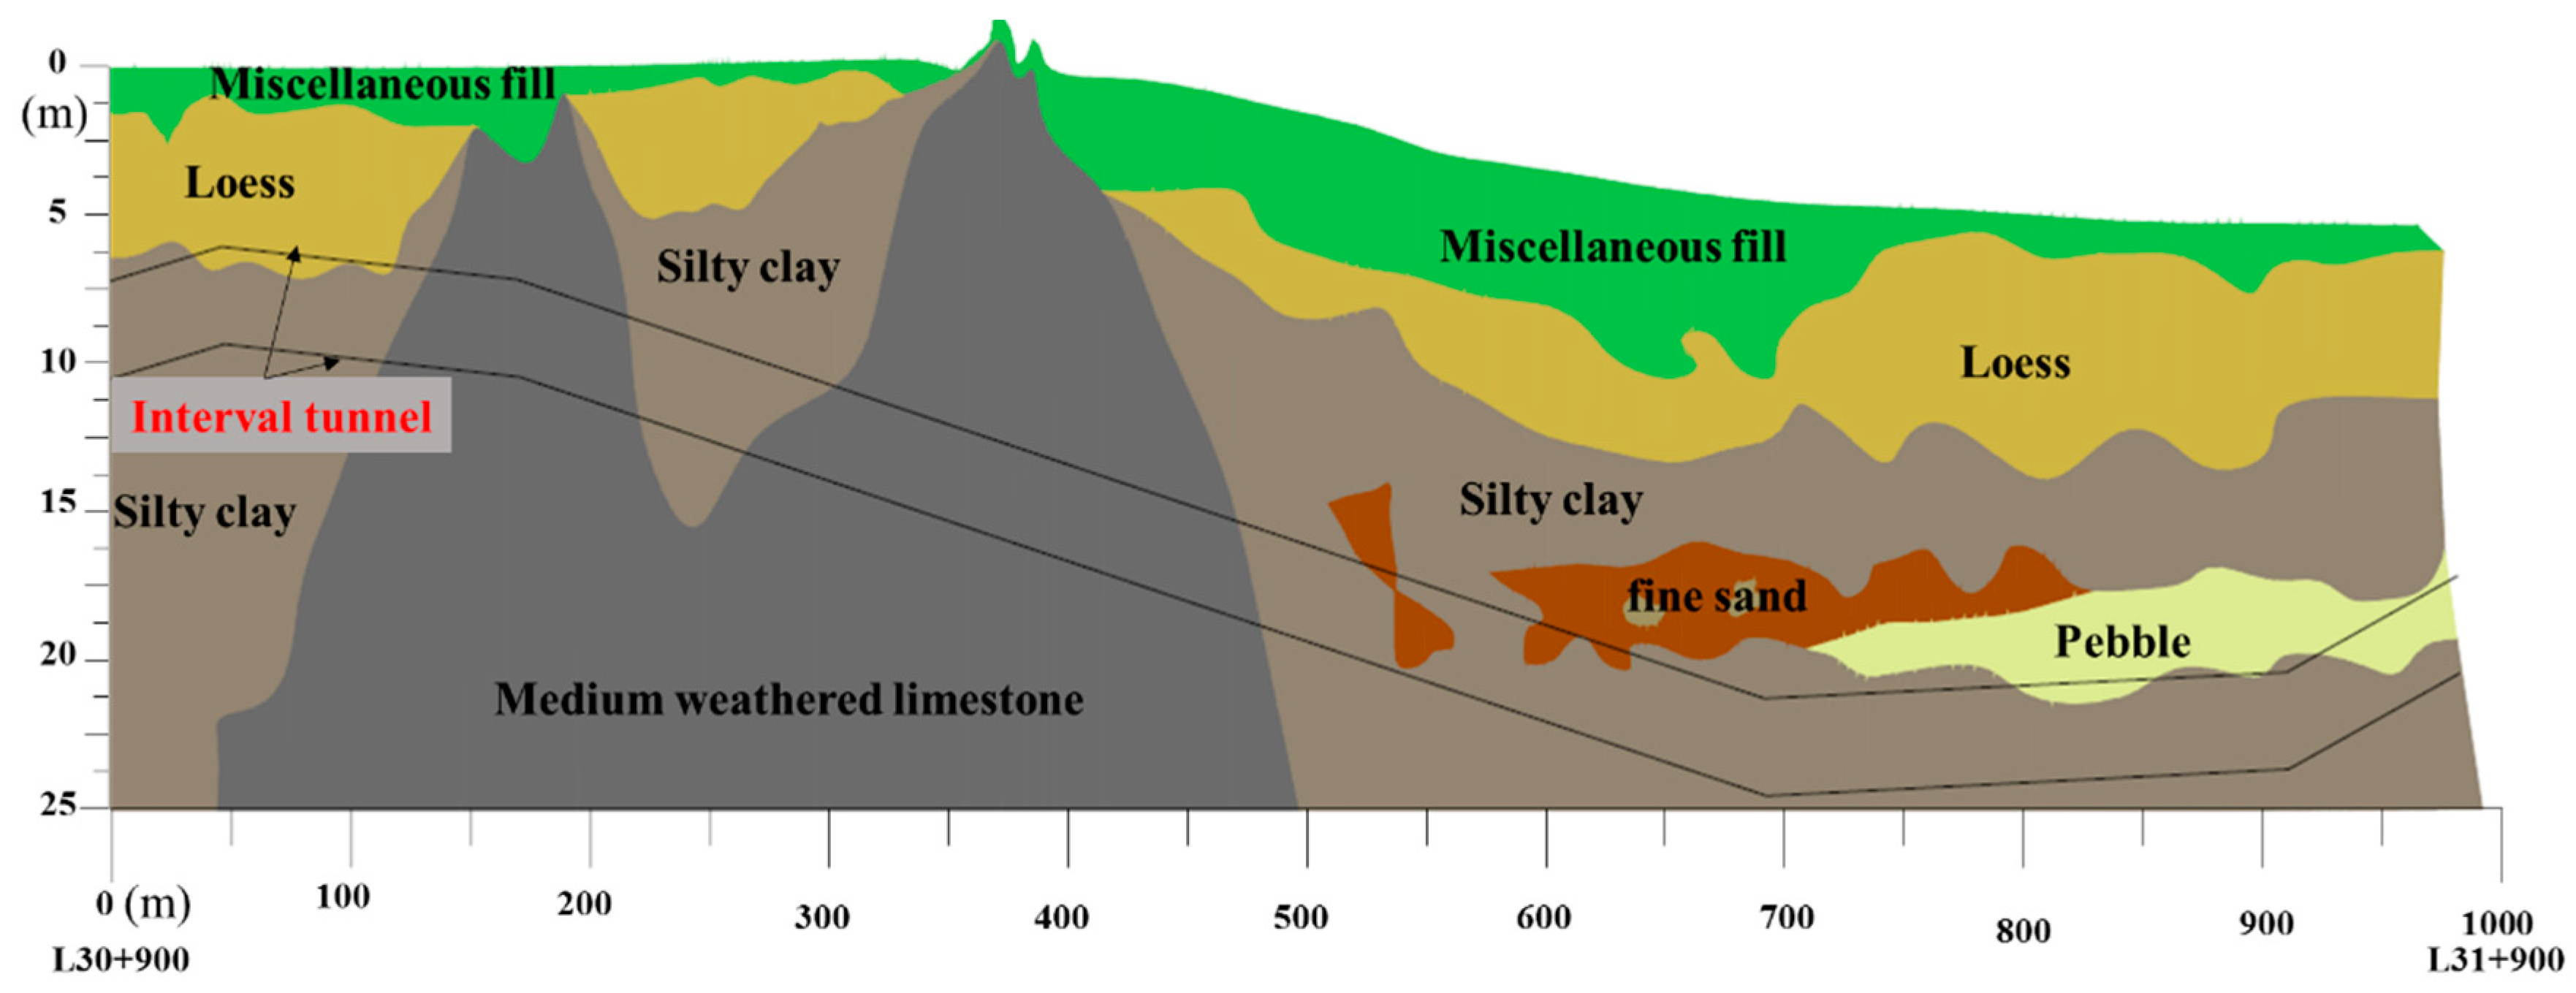
3.1. General Situation of Engineering Geology
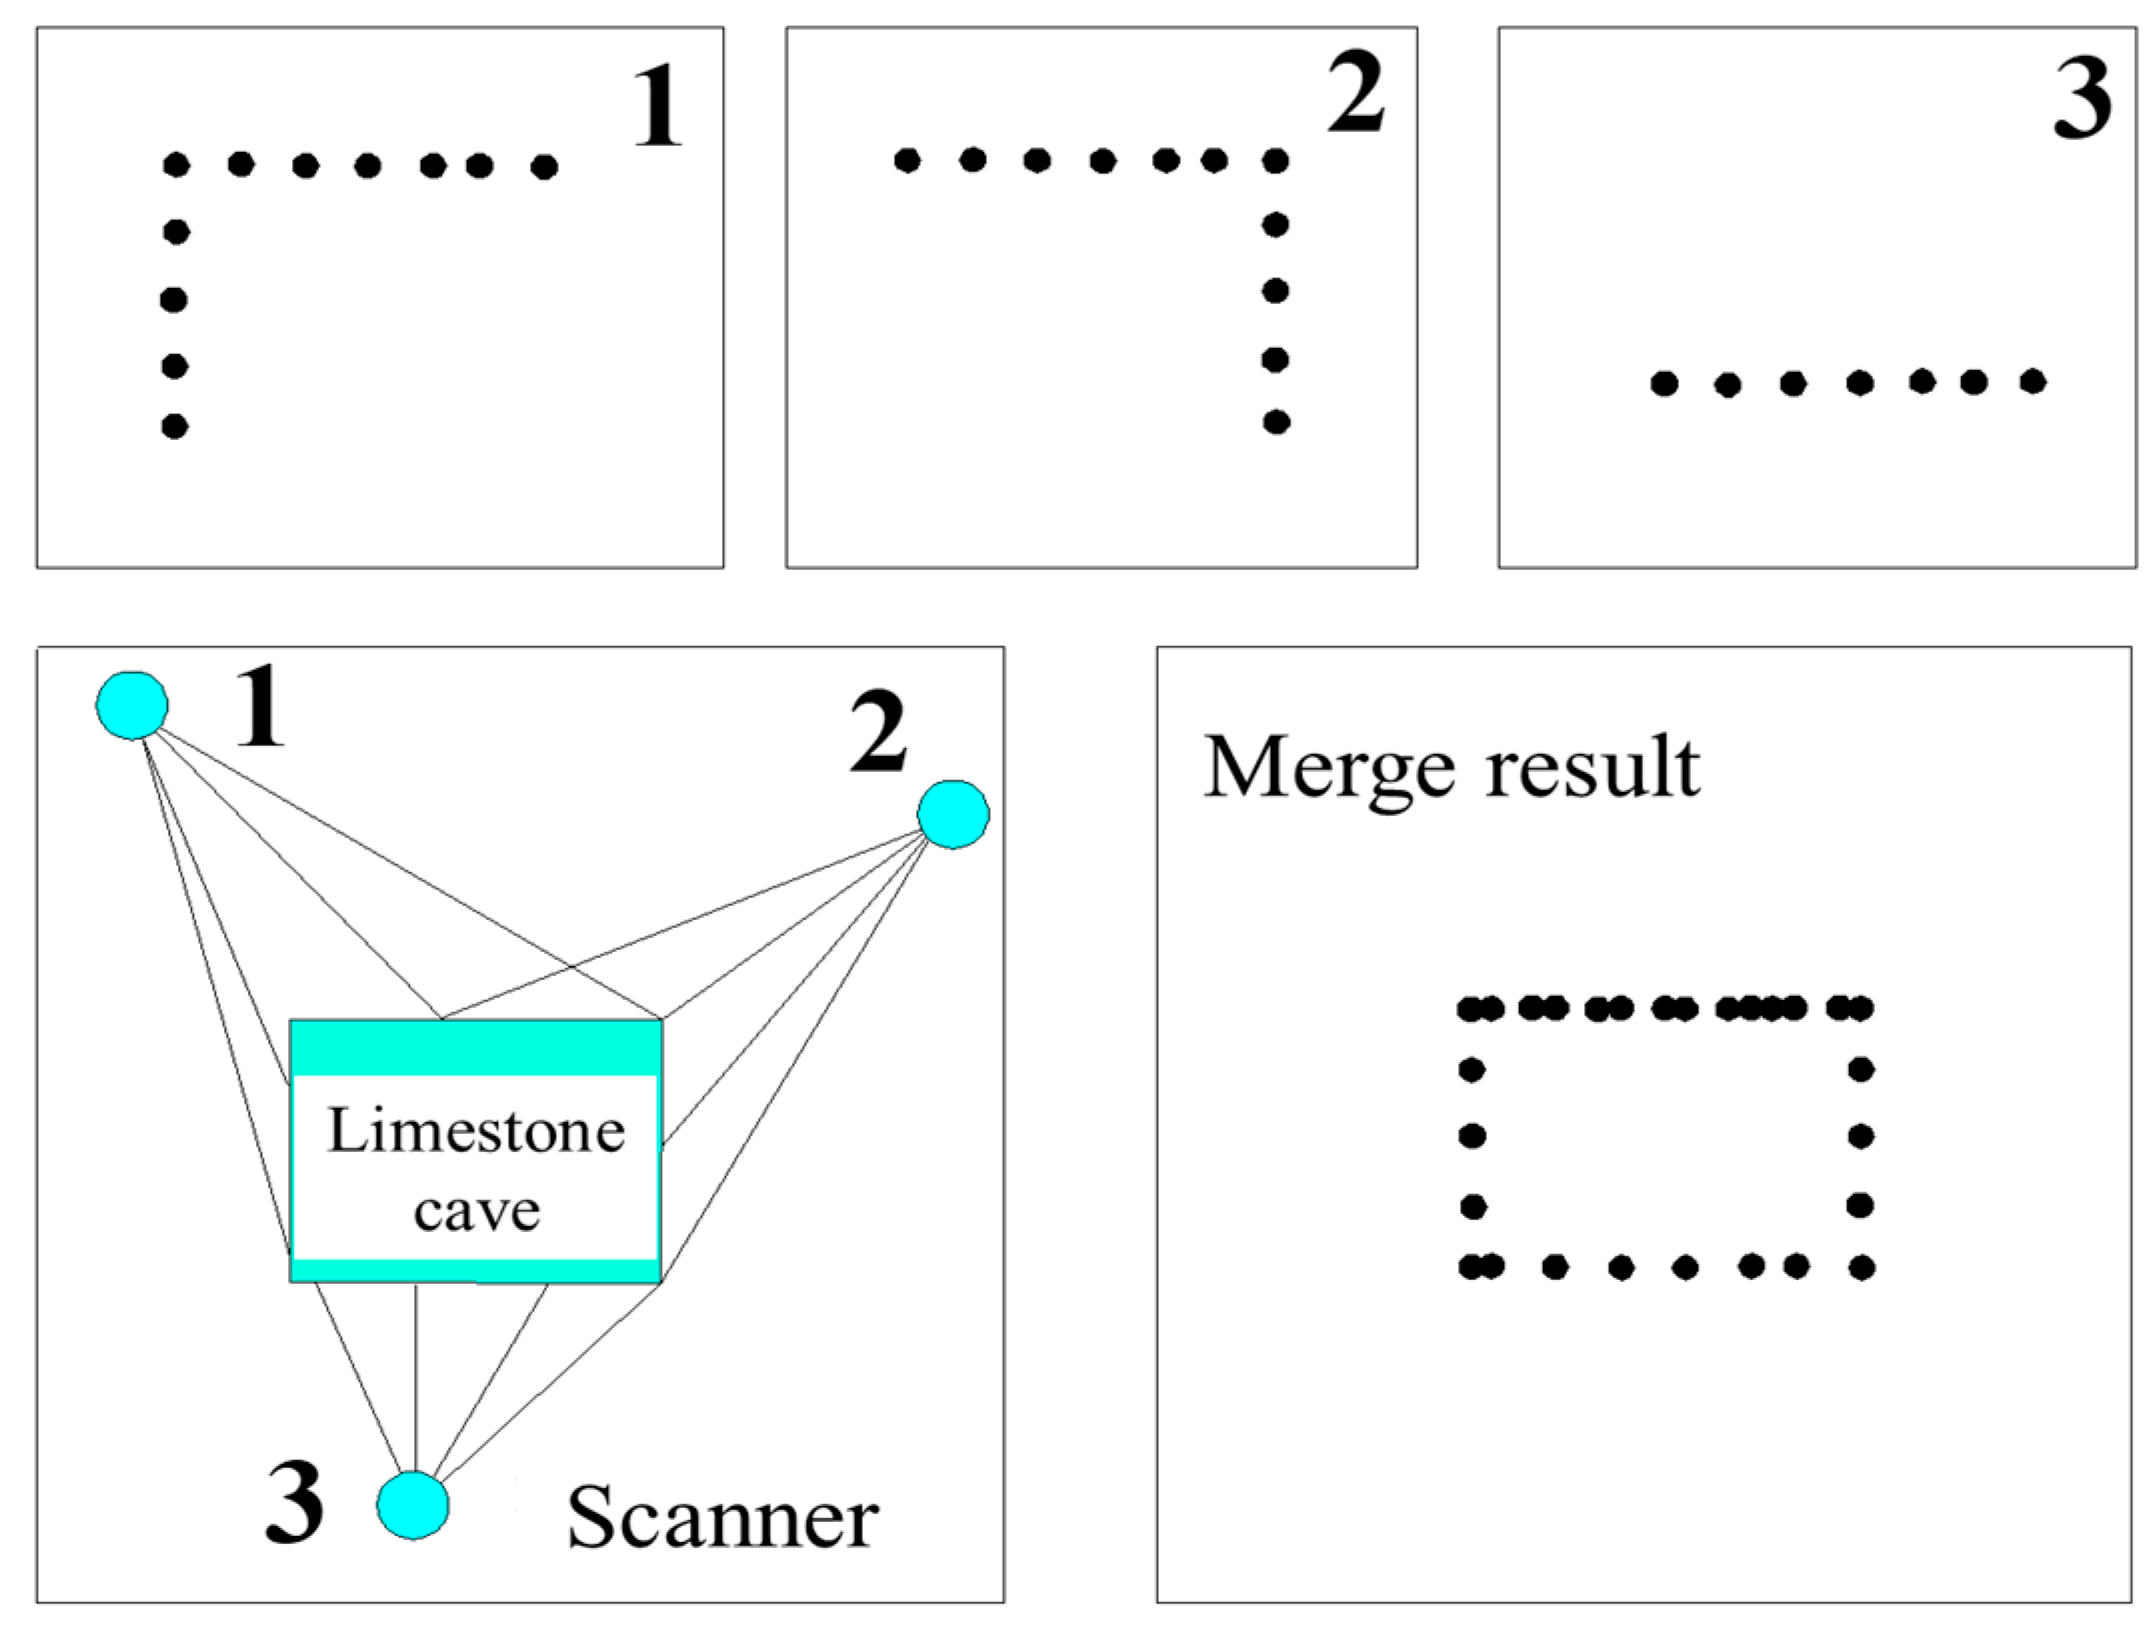
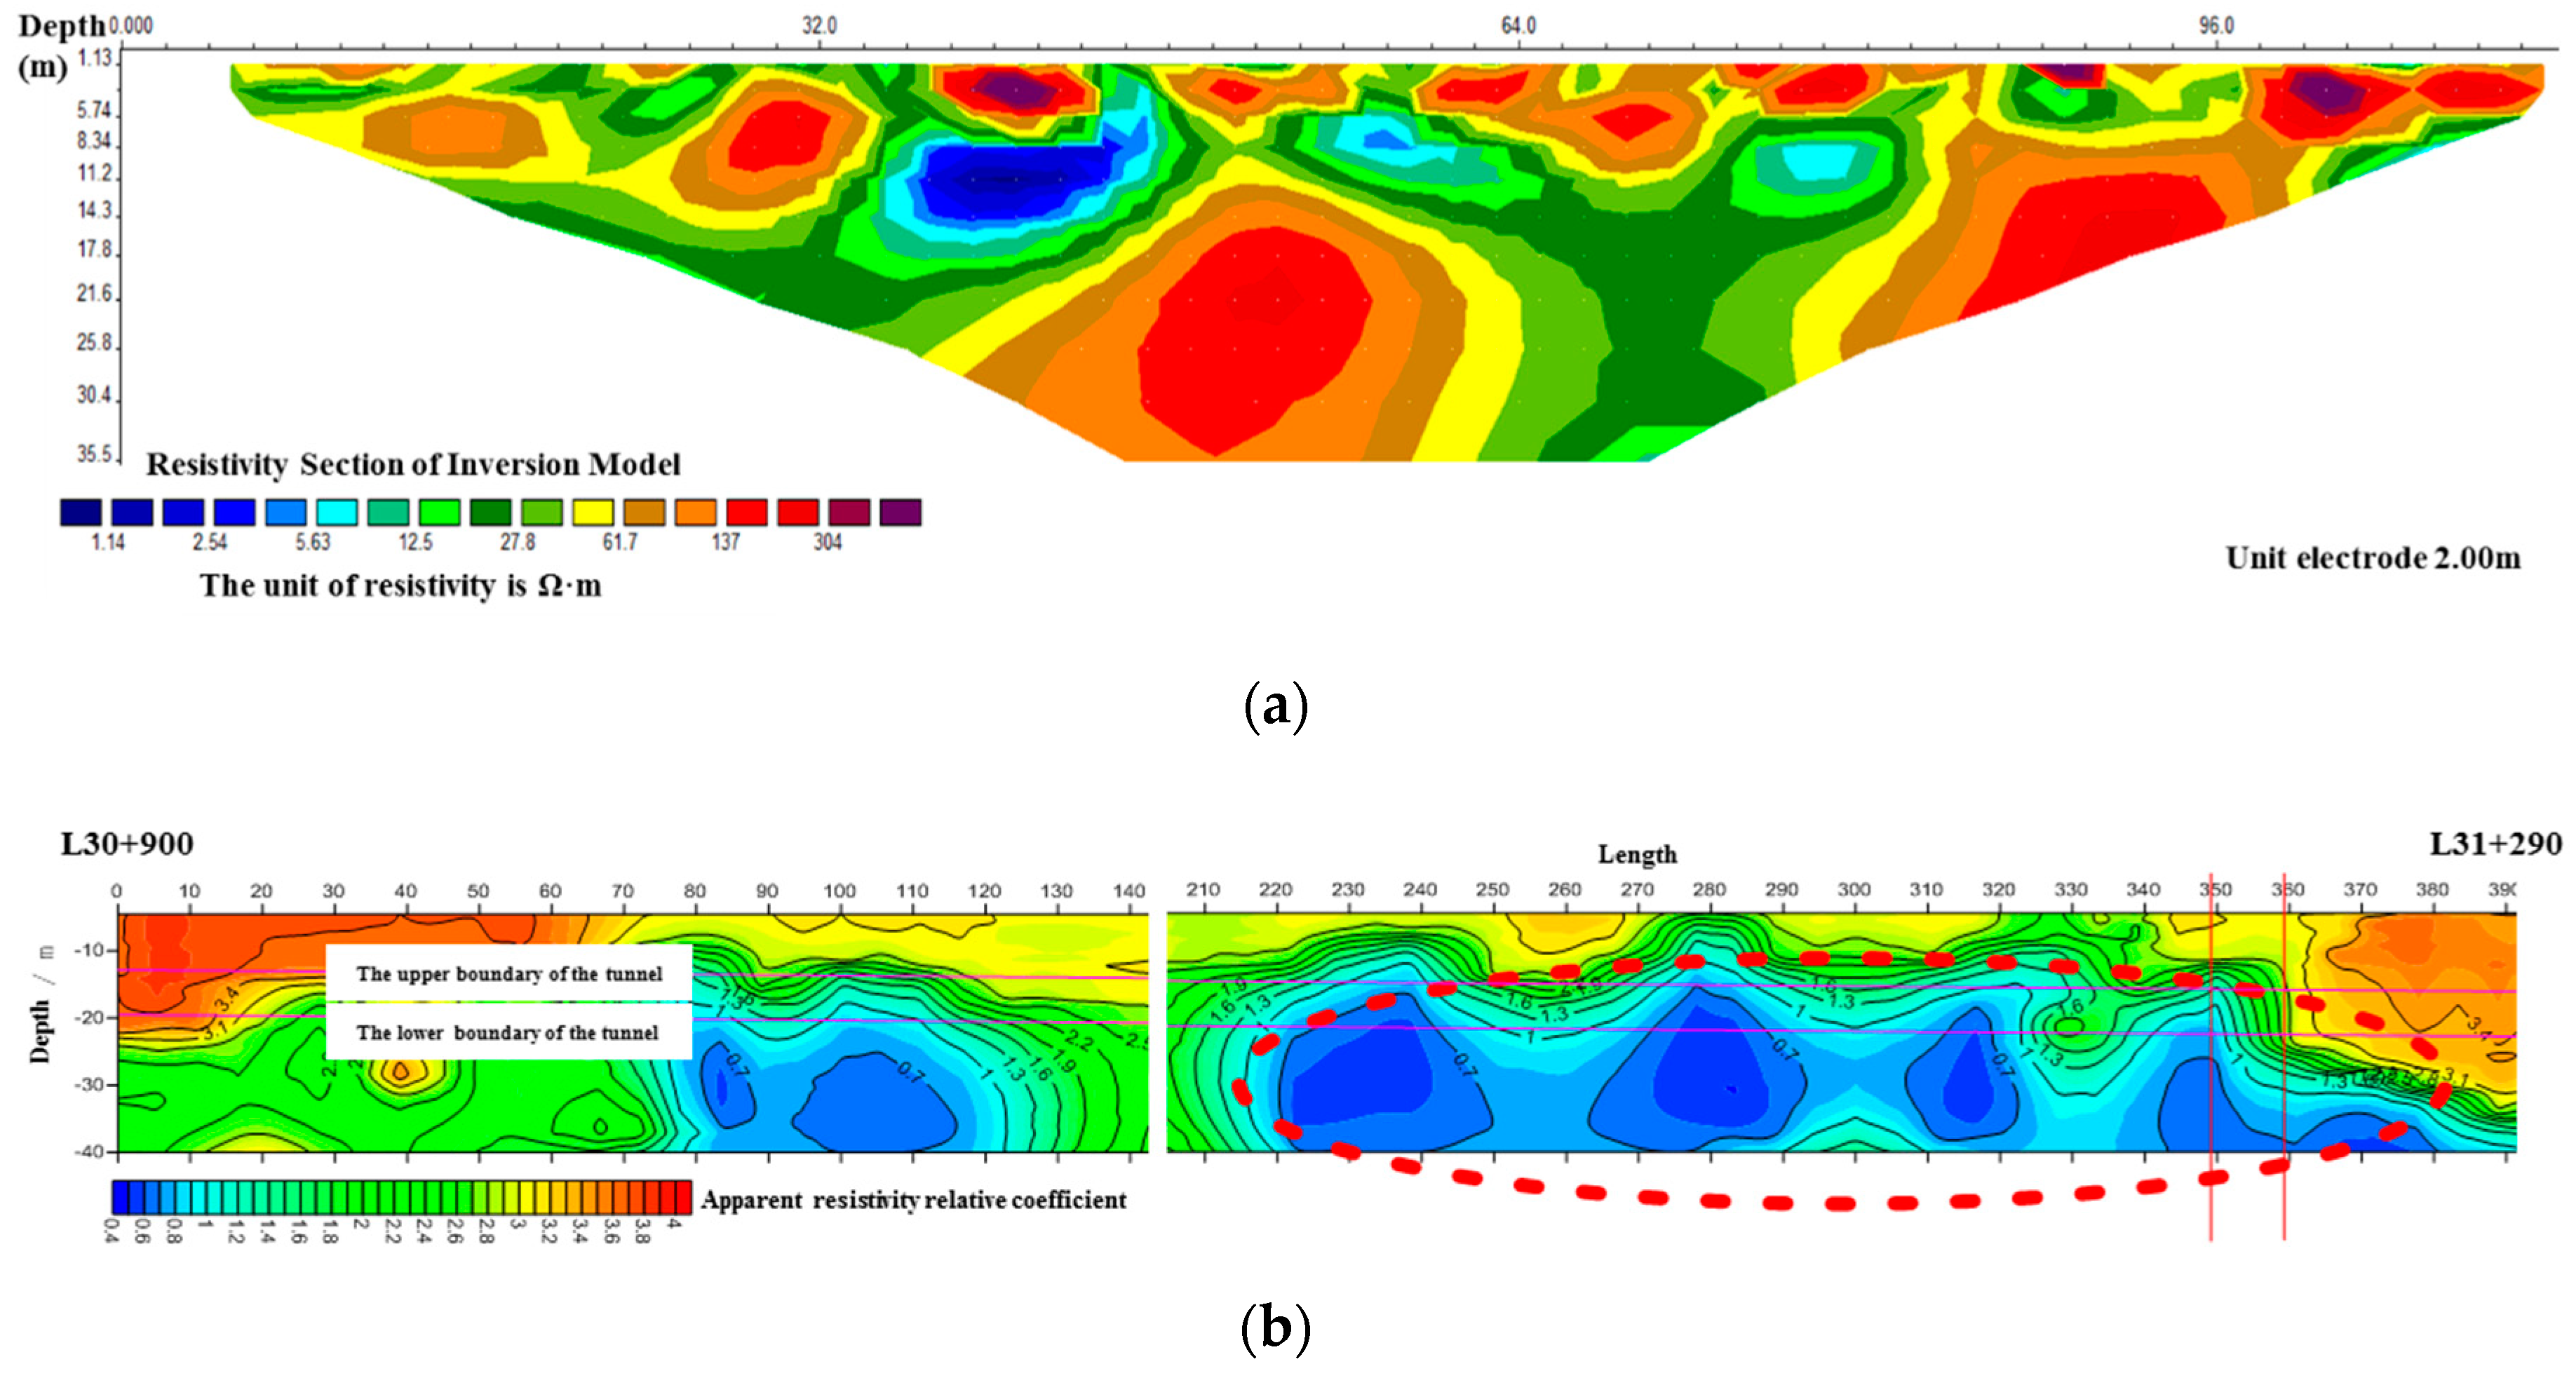
3.2. Location Exploration Method of Karst Cave
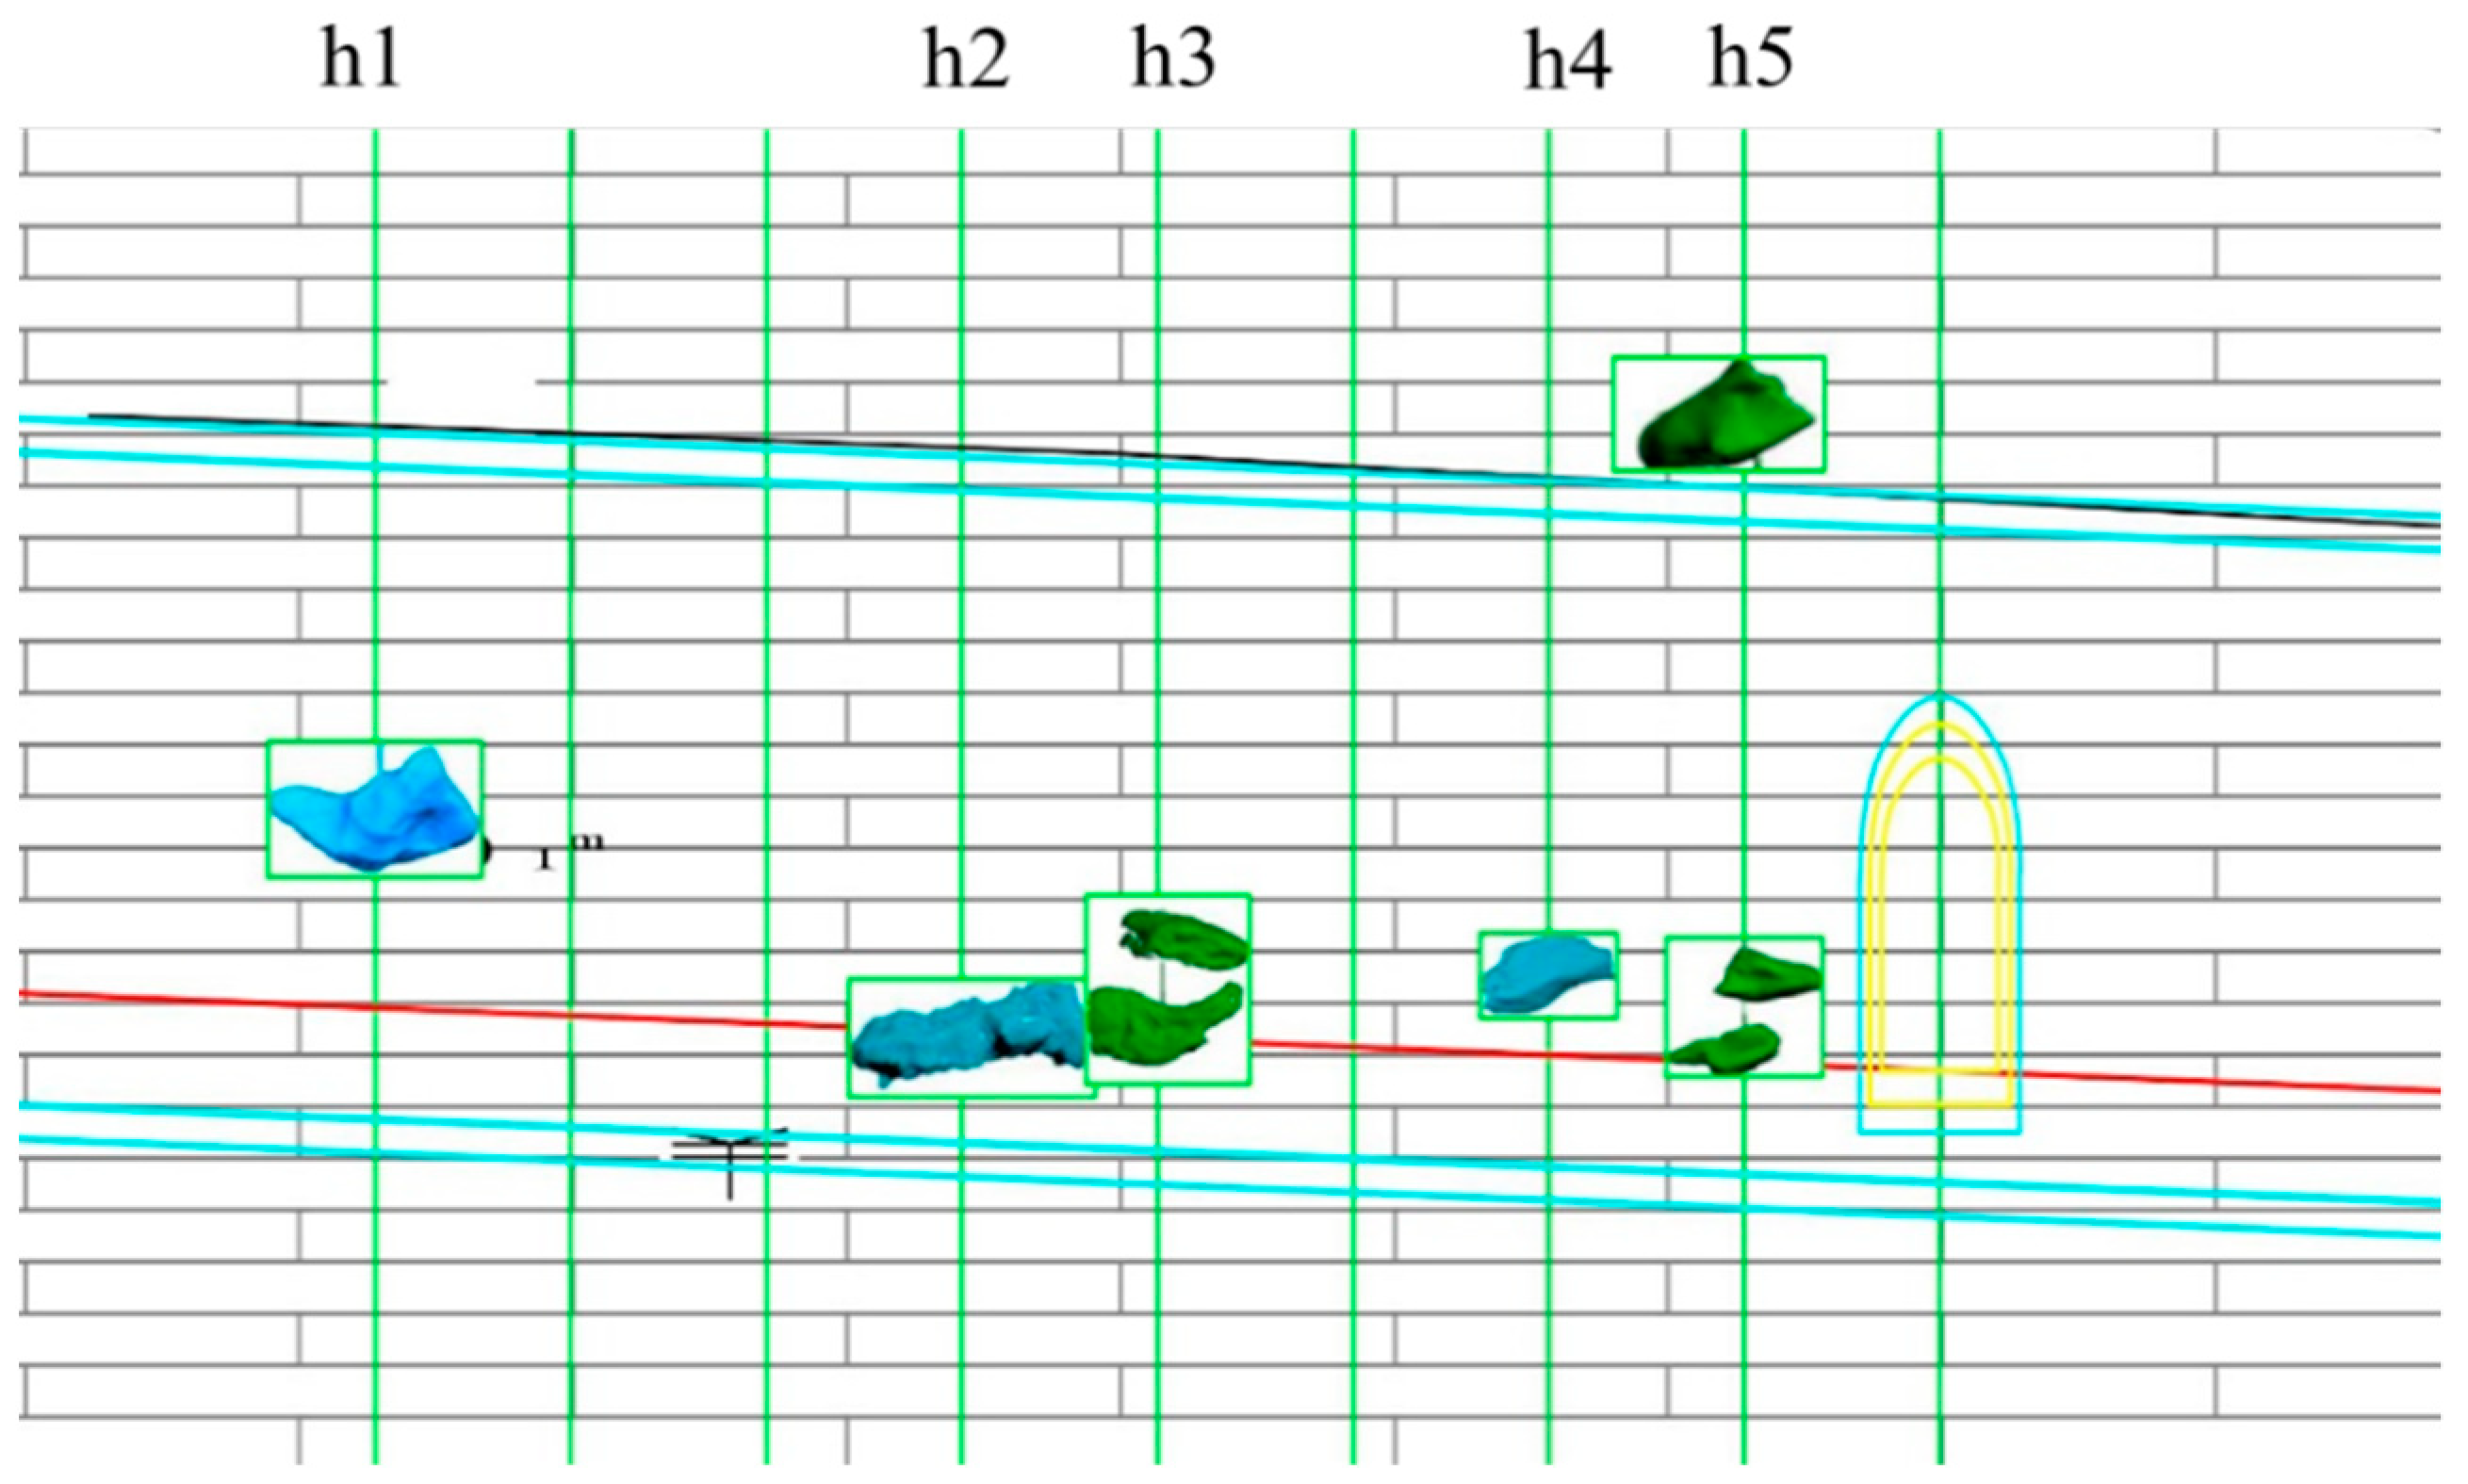
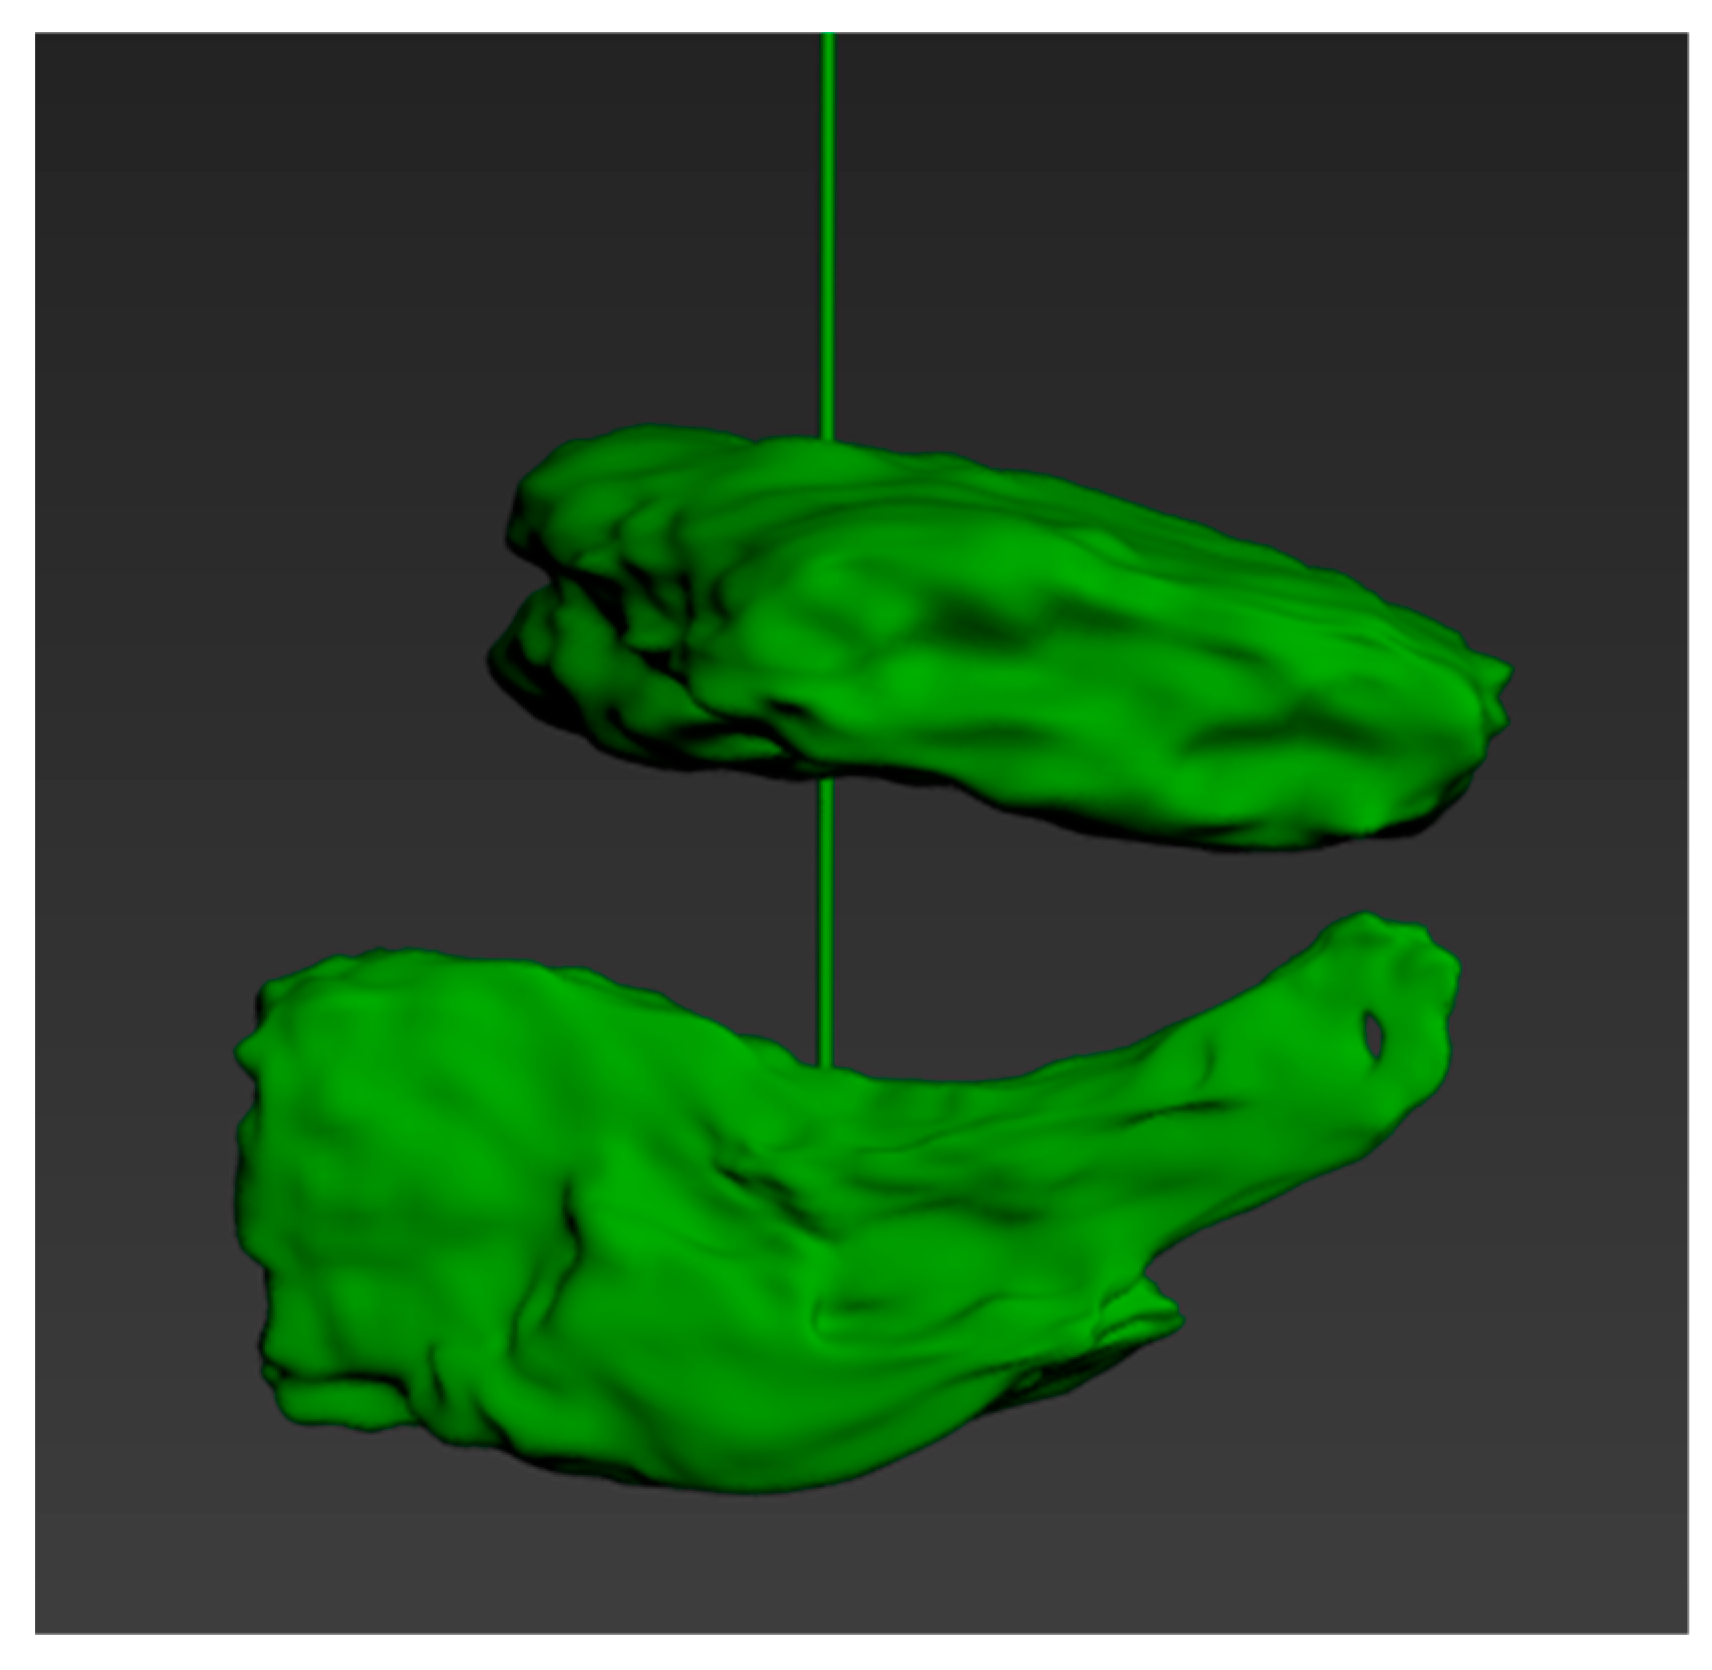
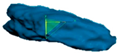
3.3. Three-Dimensional Model of Karst Cave
4. Treatment of Karst Cave
5. Conclusions
- The apparent resistivity of karst caves is higher than that of relatively intact strata. In a complex urban environment, high-density electrical method and transient electromagnetic method have high resolution for karst caves. Through the results of geophysical prospecting, targeted drilling can be carried out to avoid blind drilling.
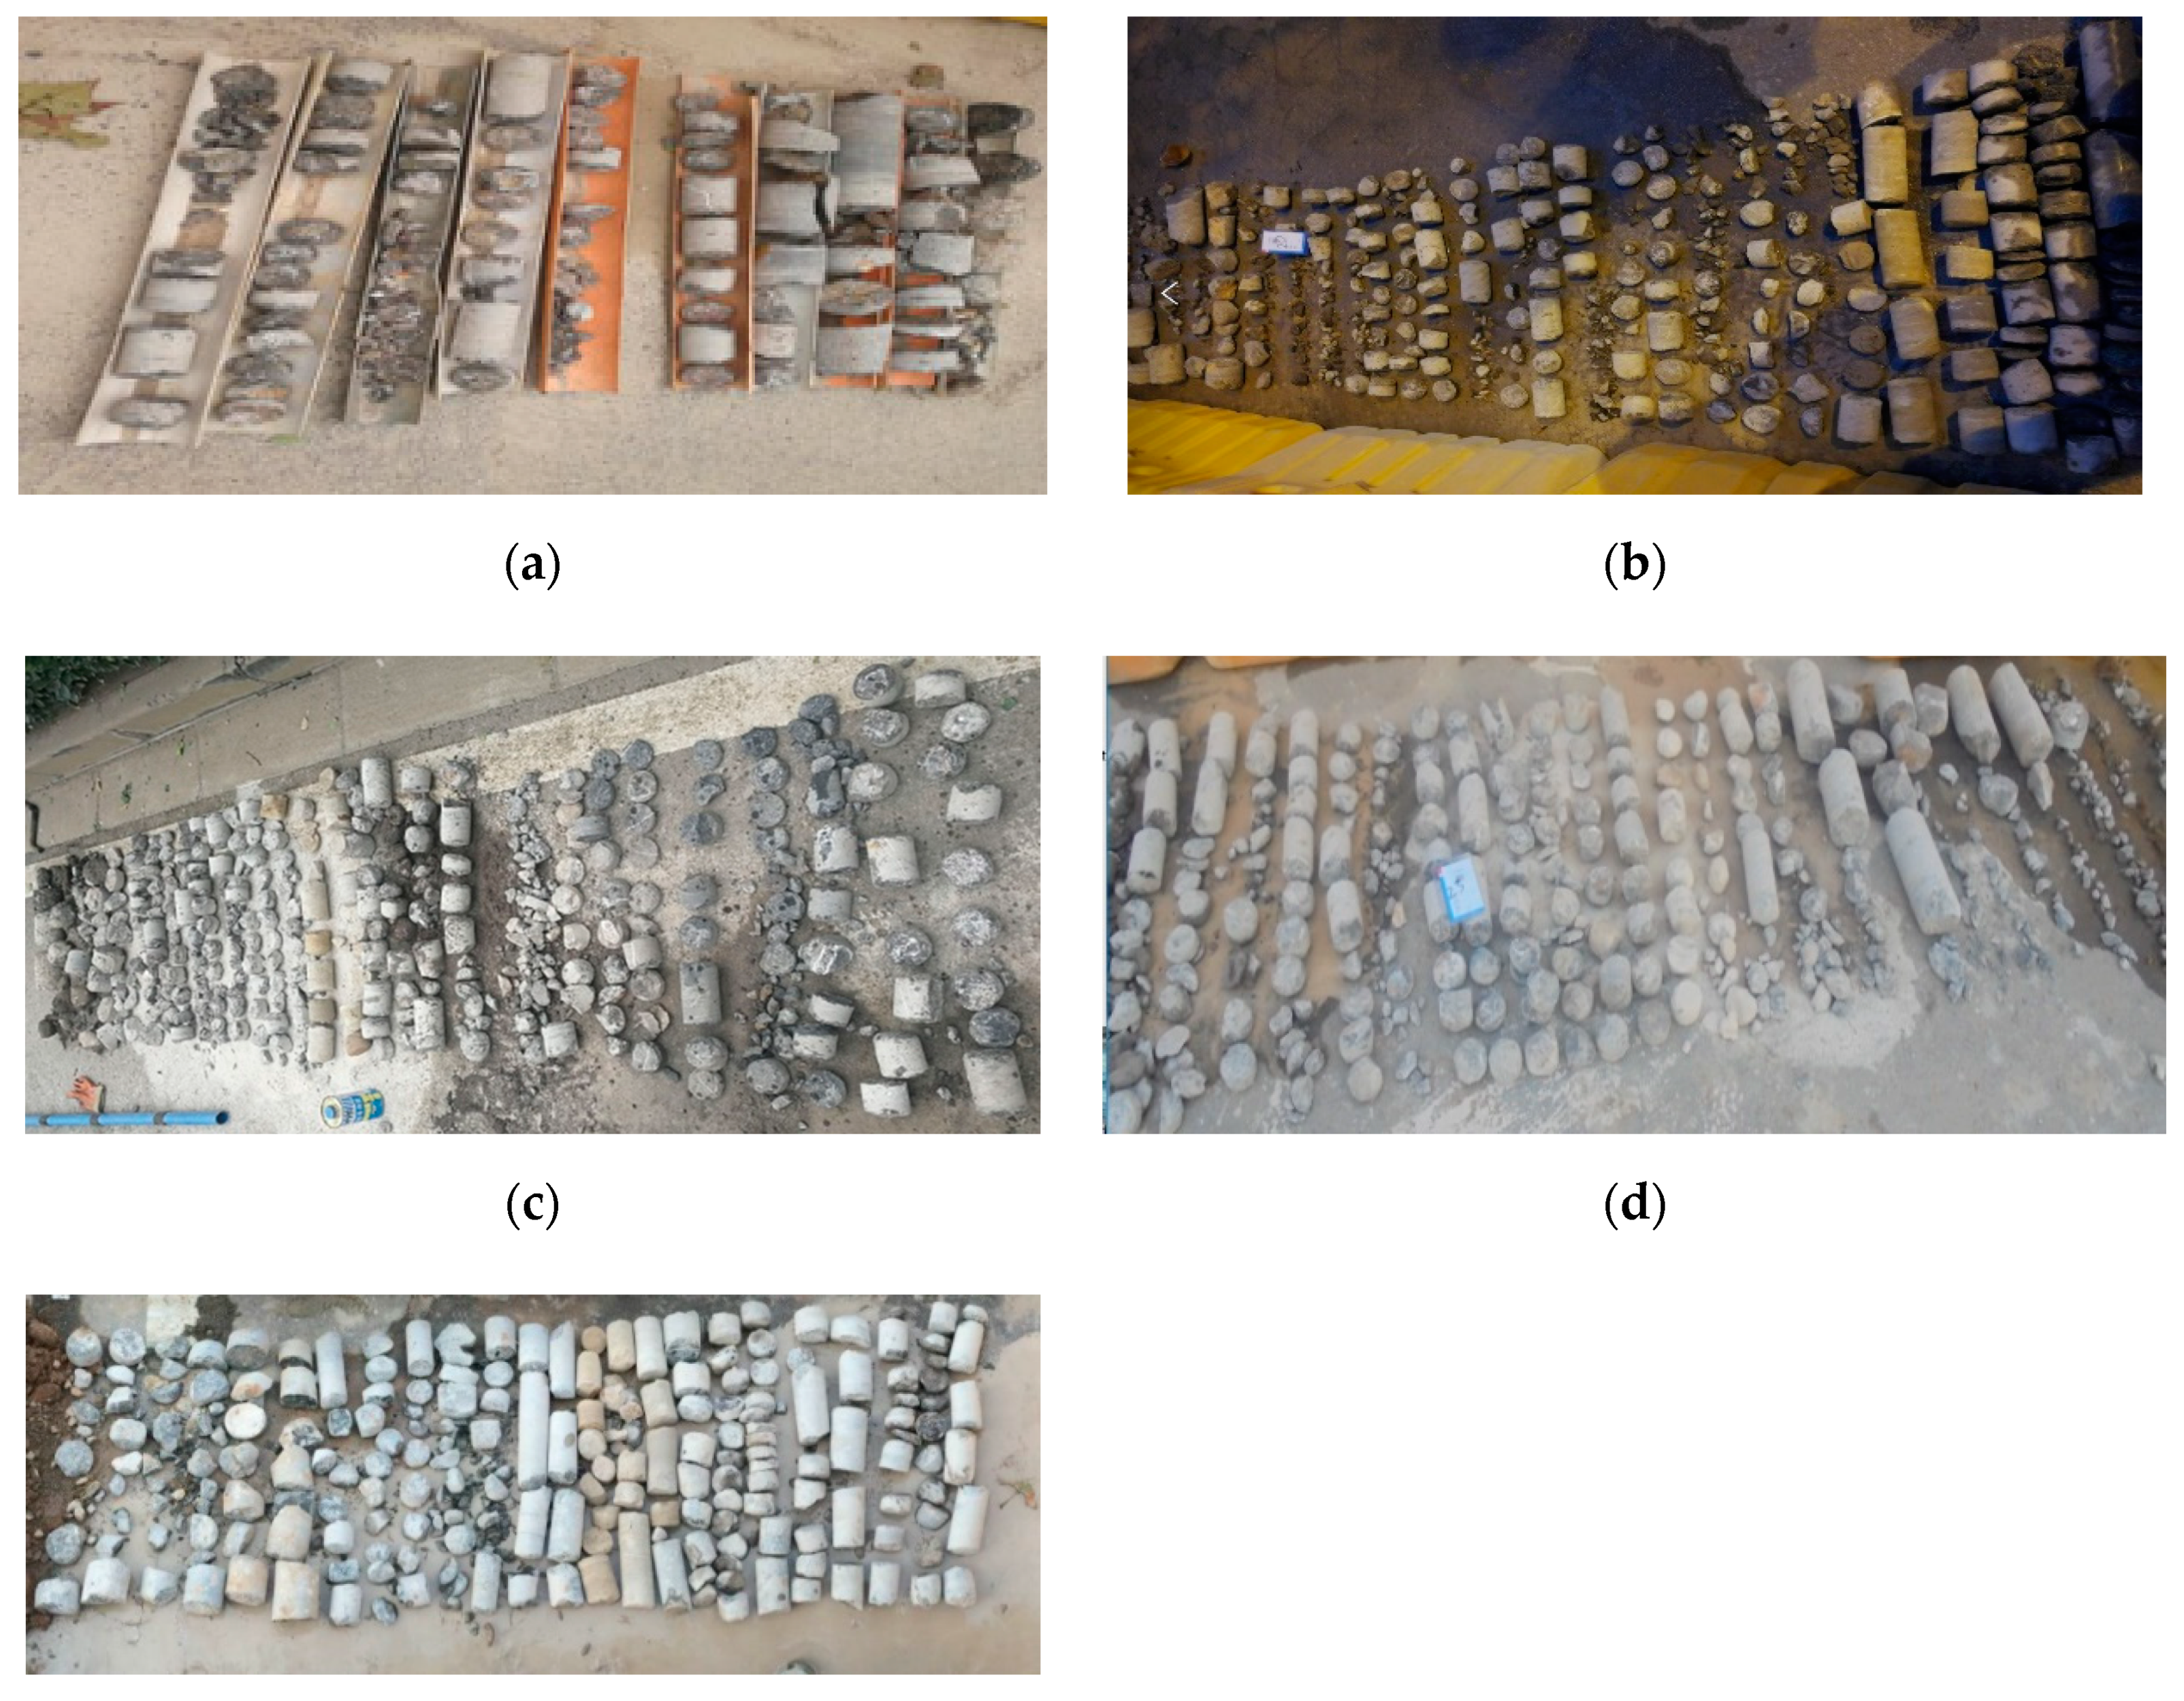
- The laser point cloud is composed of point position coordinate data. Using a large lattice and a certain density grid to describe the entity information, the target information can be described more accurately. Making full use of the target drill hole and fine scanning of the cave via a 3-D automatic laser scanner, parameters such as the real shape and volume of the cave were obtained.
- According to the construction experience and design principle, the treatment scope and method of karst caves in different locations are determined. The karst caves above the metro must be filled. The karst caves below the tunnel within twice the diameter need to be filled. The karst caves within 5 m on both sides of the tunnel need to be filled. When the diameter of karst cave is less than 1 m, it can be filled with cement slurry directly. When the diameter of karst cave is larger than 1 m, it needs to be filled with sand before grouting.
Author Contributions
Funding
Conflicts of Interest
References
- Sun, S.; Li, L.; Wang, J.; Shi, S.; Song, S.; Fang, Z.; Ba, X.; Jin, H. Karst Development Mechanism and Characteristics Based on Comprehensive Exploration along Jinan Metro, China. Sustainability 2018, 10, 3383. [Google Scholar] [CrossRef]
- Foley, A.E. The Use and Development of Some Groundwater Tracing Techniques for Wellhead Protection: Studies from the Corallian Limestone of Yorkshire. Ph.D. Thesis, University College London, 2006. [Google Scholar]
- Hui, G.; Xu, J. A numerical simulation of impact of groundwater seepage on temperature distribution in karst collapse pillar. Arab. J. Geosci. 2017, 10, 10. [Google Scholar]
- Li, S.; Liu, B.; Nie, L.; Liu, Z.; Tian, M.; Wang, S.; Su, M.; Guo, Q. Detecting and monitoring of water inrush in tunnels and coal mines using direct current resistivity method: A review. J. Rock Mech. Geotech. Eng. 2015, 7, 469–478. [Google Scholar] [CrossRef]
- Zhong, S.; Wang, R. New Landsonar Method for Survey of Ground in Busy Town, Karst Caves in Mountain and Sea Bottom on Water. J. Eng. Geol. 2013, 21, 422–432. [Google Scholar]
- Peng, C. The Combined Application of Seismic Imaging Method and High-Density Electric Method to the Survey of Karst CollapseAreas. Chin. J. Eng. Geophys. 2016, 13, 60–63. [Google Scholar]
- Knapp, R.W.; Steeples, D.W. High-resolution common-depth-point reflection profiling: Field acquisition parameter design. Geophysics 1986, 51, 283–294. [Google Scholar] [CrossRef]
- Carbonel, D.; Rodríguez, V.; Gutiérrez, F.; McCalpin, J.P.; Linares, R.; Roqué, C.; Zarroca, M.; Guerrero, J.; Sasowsky, I. Evaluation of trenching, ground penetrating radar (GPR) and electrical resistivity tomography (ERT) for sinkhole characterization. Earth Surf. Process. Landf. 2014, 39, 214–227. [Google Scholar] [CrossRef]
- Ardestani, V.E. Detecting, delineating and modeling the connected solution cavities in a dam site via microgravity data. Acta Geod. Geophys. 2013, 48, 123–138. [Google Scholar] [CrossRef]
- He, W.; Yu, R. Application of High-Density Resistivity Survey to Reconnaissance the Highway’s Geological Disaster in the Mountainous Area. Geotech. Investig. Surv. 2009, 37, 89–94. [Google Scholar]
- Xue, G.; Li, X.; Di, Q. The Progress of TEM in Theory and Application. Prog. Geophys. 2007, 22, 1195–1200. [Google Scholar]
- Milsom, J.; Eriksen, A. Ground Penetrating Radar. In Groundwater Geophysics; Wiley: Chichester, UK, 1998. [Google Scholar]
- Al-Fares, W.; Bakalowicz, M.; Guérin, R.; Dukhan, M. Analysis of the karst aquifer structure of the Lamalou area (Hérault, France) with ground penetrating radar. J. Appl. Geophys. 2004, 51, 97–106. [Google Scholar] [CrossRef]
- Li, S.; Li, S.; Zhang, Q.; Xue, Y.; Ding, W.; Zhong, S.; He, F.; Lin, Y. Forecast of Karst-Fractured Groundwater and Defective Geological Condition. Chin. J. Rock Mech. Eng. 2007, 26, 217–225. [Google Scholar]
- Jiang, W. Combination of Geophysical and Conventional Boring Methods for the Investigation of an Industrial Building over Abandoned Mining Areas in Zhangqiu. Soil Eng. Found. 2017, 3, 364–368. [Google Scholar]
- Waltham, D.T.; Bell, F.G.; Culshaw, M.G. Sinkholes and Subsidence; Springer: Berlin, Germany, 2005. [Google Scholar]
- Yang, B.; Fang, L. Automated Extraction of 3-D Railway Tracks from Mobile Laser Scanning Point Clouds. IEEE J. Sel. Top. Appl. Earth Obs. Remote Sens. 2015, 7, 4750–4761. [Google Scholar] [CrossRef]
- Gallay, M.; Hochmuth, Z.; Kaňuk, J.; Hofierka, J. Geomorphometric analysis of cave ceiling channels mapped with 3-D terrestrial laser scanning. Hydrol. Earth Syst. Sci. 2016, 20, 1827. [Google Scholar] [CrossRef]
- Ordóñez, C.; Cabo, C.; Sanzablanedo, E. Automatic Detection and Classification of Pole-Like Objects for Urban Cartography Using Mobile Laser Scanning Data. Sensors 2017, 17, 1465. [Google Scholar] [CrossRef] [PubMed]
- Liu, G.; Meng, X.; Ni, J.; Chen, Z.; Zhang, D. Evaluation of the two-dimension reflection seismic method towards the exploration of thrust-controlled mineral deposits in southwestern Fujian province, China. Geophysics 2018. [Google Scholar] [CrossRef]
- Zhong, S. Land sonar method and effectiveness. Geophys. Geochem. Explor. 1997, 21, 172–179. [Google Scholar]
- Guo, D.D.; Zhao, L.H.; Gao, Z.J. High-density electrical method used in the application of karst collapse. Ground Water 2011, 33, 108–110. [Google Scholar]
- Christiansen, A.V.; Auken, E.; Sørensen, K. The transient electromagnetic method. In Groundwater Geophysics; Springer: Berlin/Heidelberg, Germany, 2006; pp. 179–226. [Google Scholar]
- Li, X.; Xue, G.; Yin, C. Migration Imaging of the Transient Electromagnetic Method; Springer: Singapore, 2017. [Google Scholar]
- Arifi, M.H.; Jamaluddin, T.A.; Husin, H.; Ismail, A.; Abbas, A.A.; Nordin, M.N.M.; Othman, N.A. Comparison of Geological Mapping with Electrical Resistivity and Ground Penetration Radar Methods for Rock Fractured System Study. Chiang Mai J. Sci. 2016, 43, 1346–1357. [Google Scholar]
- Annan, A.P.; Diamanti, N.; Redman, J.D.; Jackson, S.R. Ground-penetrating radar for assessing winter roads. Geophysics 2016, 81, WA101–WA109. [Google Scholar] [CrossRef]
- Orfanos, C.; Apostolopoulos, G. 2D–3D resistivity and microgravity measurements for the detection of an ancient tunnel in the Lavrion area, Greece. Near Surf. Geophys. 2011, 9, 449–457. [Google Scholar] [CrossRef]


| Prediction Method | Characteristic |
|---|---|
| The seismic wave reflection method [20] | The detection accuracy is higher in the range of 20–200 m and the detection effect is better for karst caves. However, the adaptability to thick overburden soil is poor, and energy attenuation is faster. |
| The land sonar method [21] | The prediction of medium and small caverns and fractured zones is effective, but the velocity of each layer cannot be accurately obtained. |
| The high-density electrical method [22] | No filling cavern or water-rich cavern with the obvious electrical difference with surrounding rock stratum is good. It can only be qualitative but not quantitatively explored. |
| The transient electromagnetic method [23,24] | It is sensitive to large water-filled low-resistivity zones and has the ability to penetrate low-resistance coverage. The depth of detection is large. However, the resolution of empty caves or dry-filling karst caves is not enough, so it is difficult to distinguish. |
| The ground-penetrating radar method [25,26] | In the high-resistivity area, the detection depth is 20–30 m and the detection effect is good for karst caves and faults. However, it is easy to be affected by the surface soil, and the detection depth is greatly reduced. |
| The microgravity method [27] | Under flat terrain, it is widely used in karst investigation. However, factors such as topography fluctuation, sediment thickness, and fluctuation of diving surface are relatively large. |
| Drill Hole | Limestone Cave | Volume (m3) |
|---|---|---|
| h1 |  | 3.02 |
| h2 |  | 3.89 |
| h3 |  | 3.44 |
 | 3.66 | |
| h4 |  | 3.84 |
| h5 |  | 3.15 |
 | 3.7 | |
 | 3.29 |
© 2019 by the authors. Licensee MDPI, Basel, Switzerland. This article is an open access article distributed under the terms and conditions of the Creative Commons Attribution (CC BY) license (http://creativecommons.org/licenses/by/4.0/).
Share and Cite
Wang, J.; Li, L.; Shi, S.; Sun, S.; Ba, X.; Zhang, Y. Fine Exploration and Control of Subway Crossing Karst Area. Appl. Sci. 2019, 9, 2588. https://doi.org/10.3390/app9132588
Wang J, Li L, Shi S, Sun S, Ba X, Zhang Y. Fine Exploration and Control of Subway Crossing Karst Area. Applied Sciences. 2019; 9(13):2588. https://doi.org/10.3390/app9132588
Chicago/Turabian StyleWang, Jing, Liping Li, Shaoshuai Shi, Shangqu Sun, Xingzhi Ba, and Yijie Zhang. 2019. "Fine Exploration and Control of Subway Crossing Karst Area" Applied Sciences 9, no. 13: 2588. https://doi.org/10.3390/app9132588
APA StyleWang, J., Li, L., Shi, S., Sun, S., Ba, X., & Zhang, Y. (2019). Fine Exploration and Control of Subway Crossing Karst Area. Applied Sciences, 9(13), 2588. https://doi.org/10.3390/app9132588