Measurement of Contrast and Spatial Resolution for the Photothermal Imaging Method

Abstract
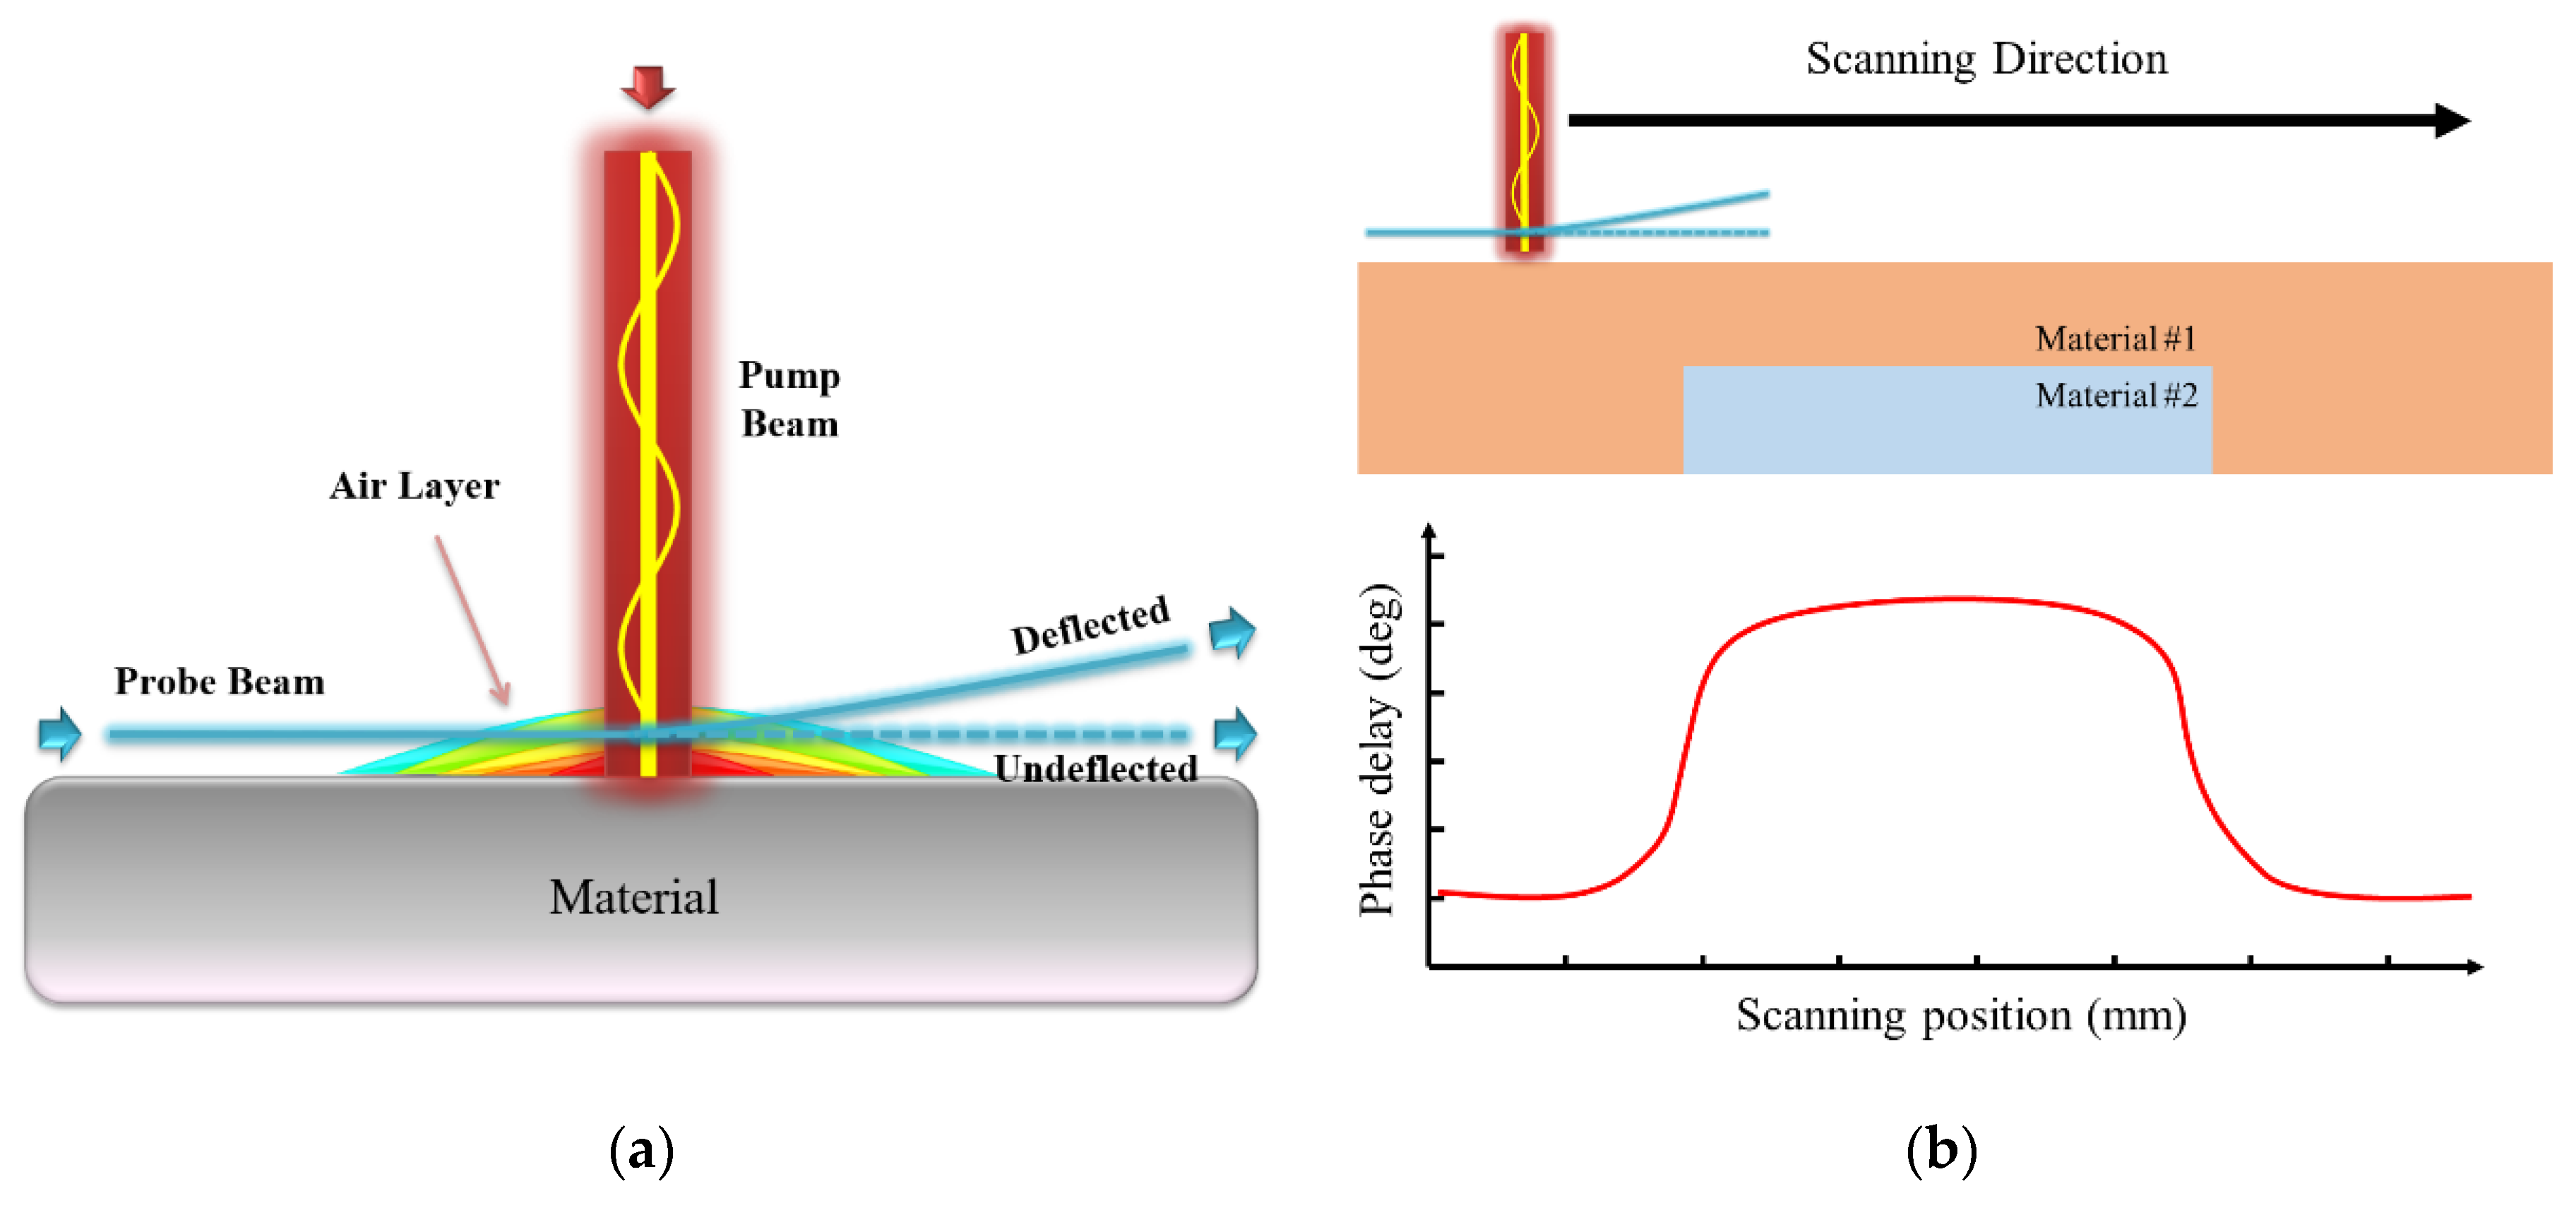
:1. Introduction
2. Image Quality Analysis Theory for Photothermal Imaging
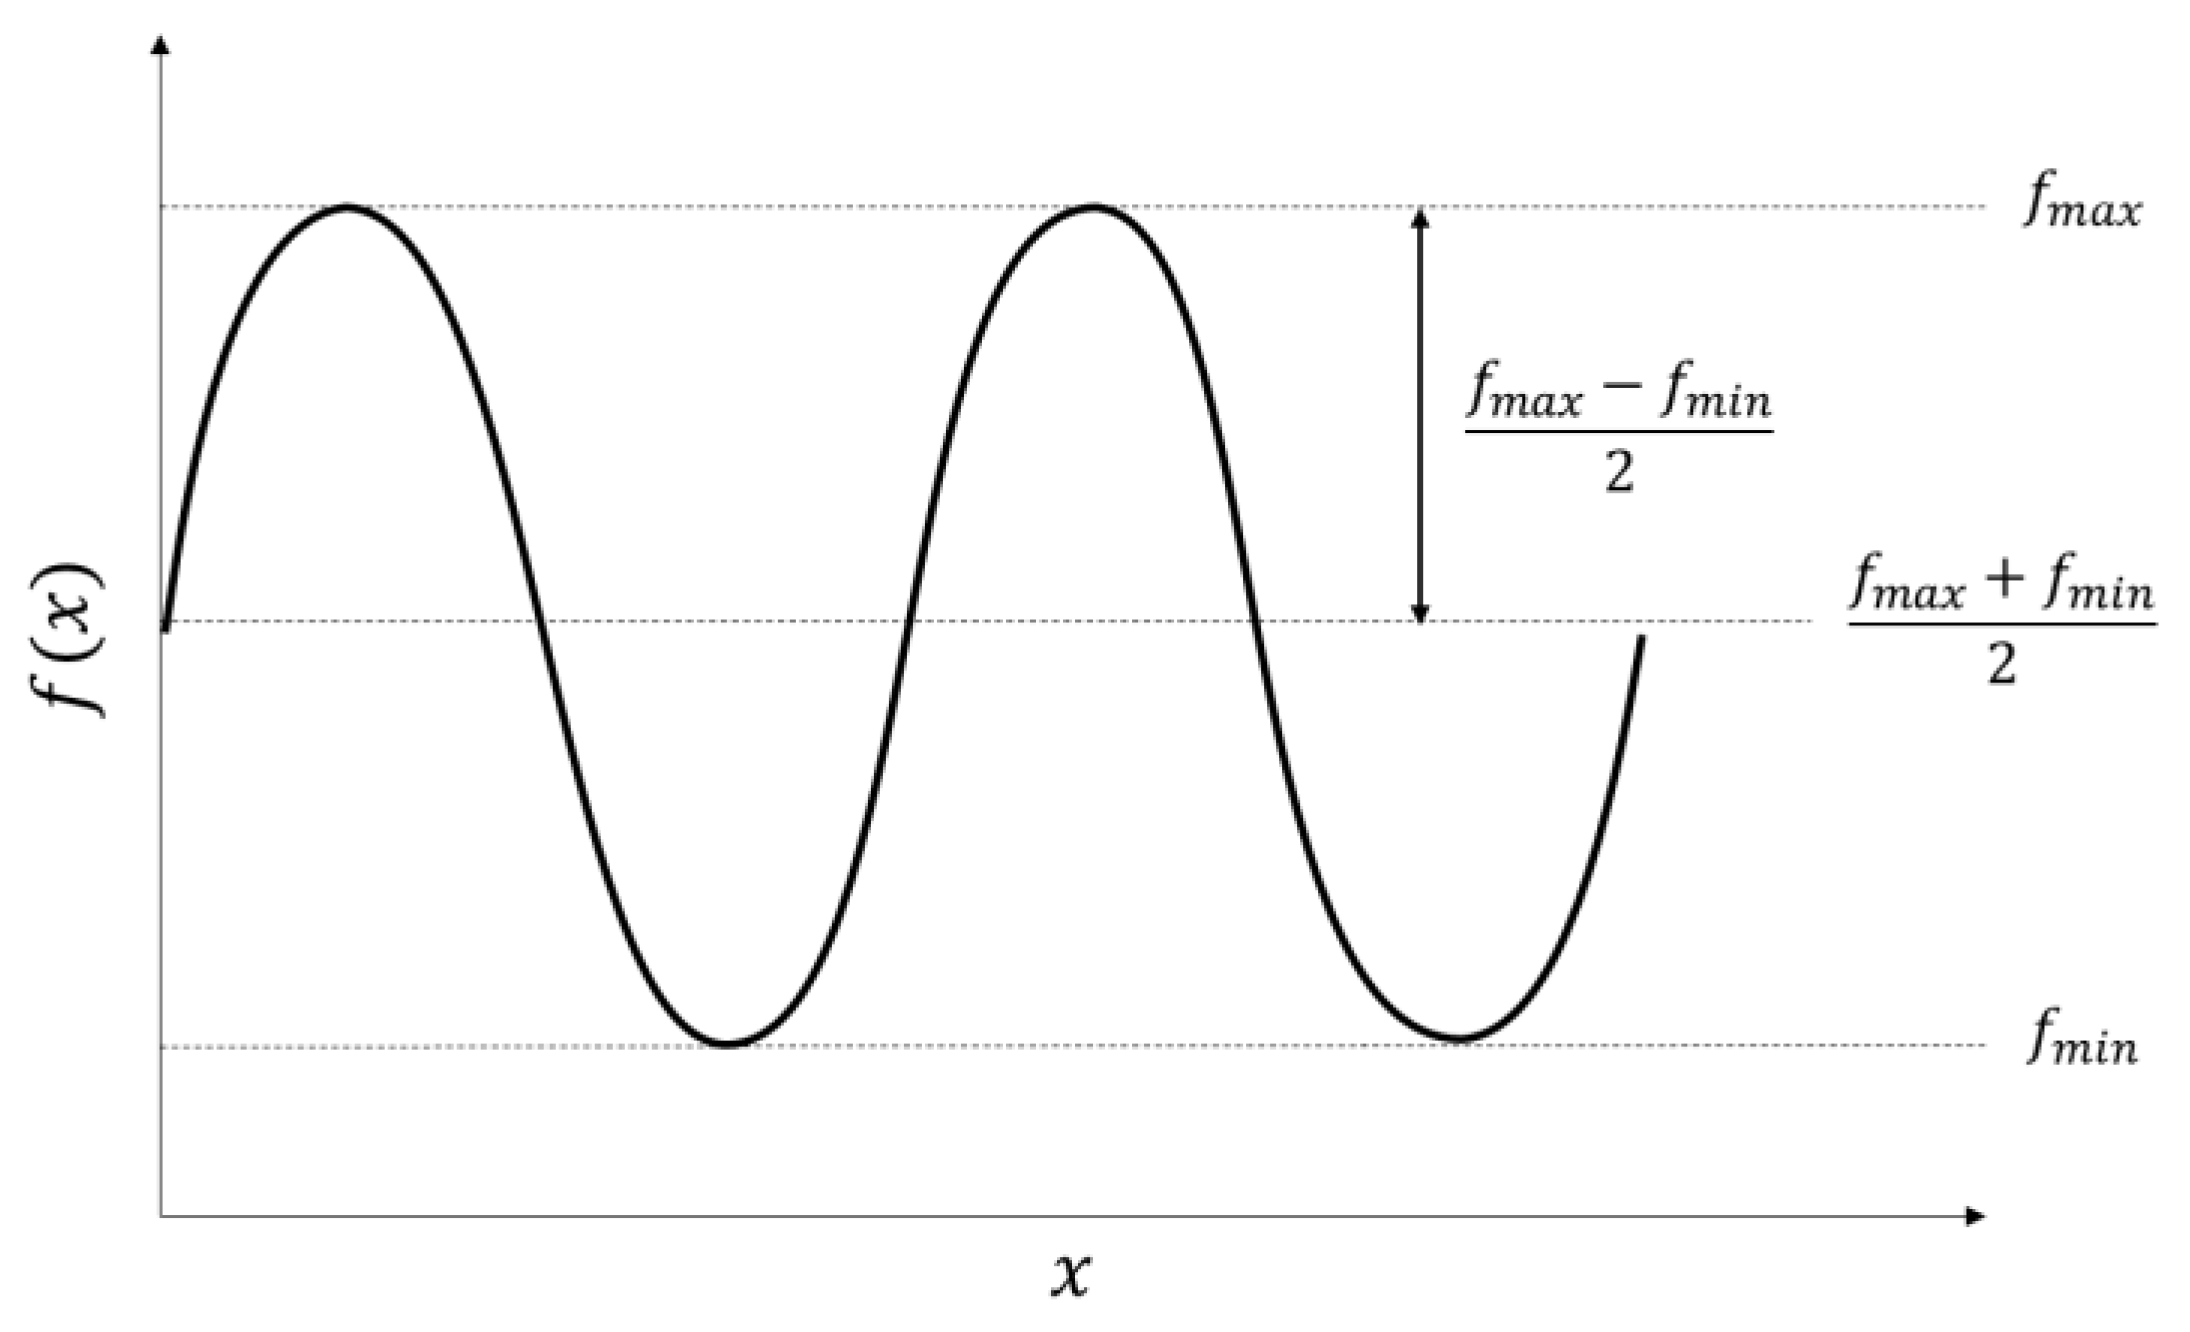
2.1. Contrast
- A
- B
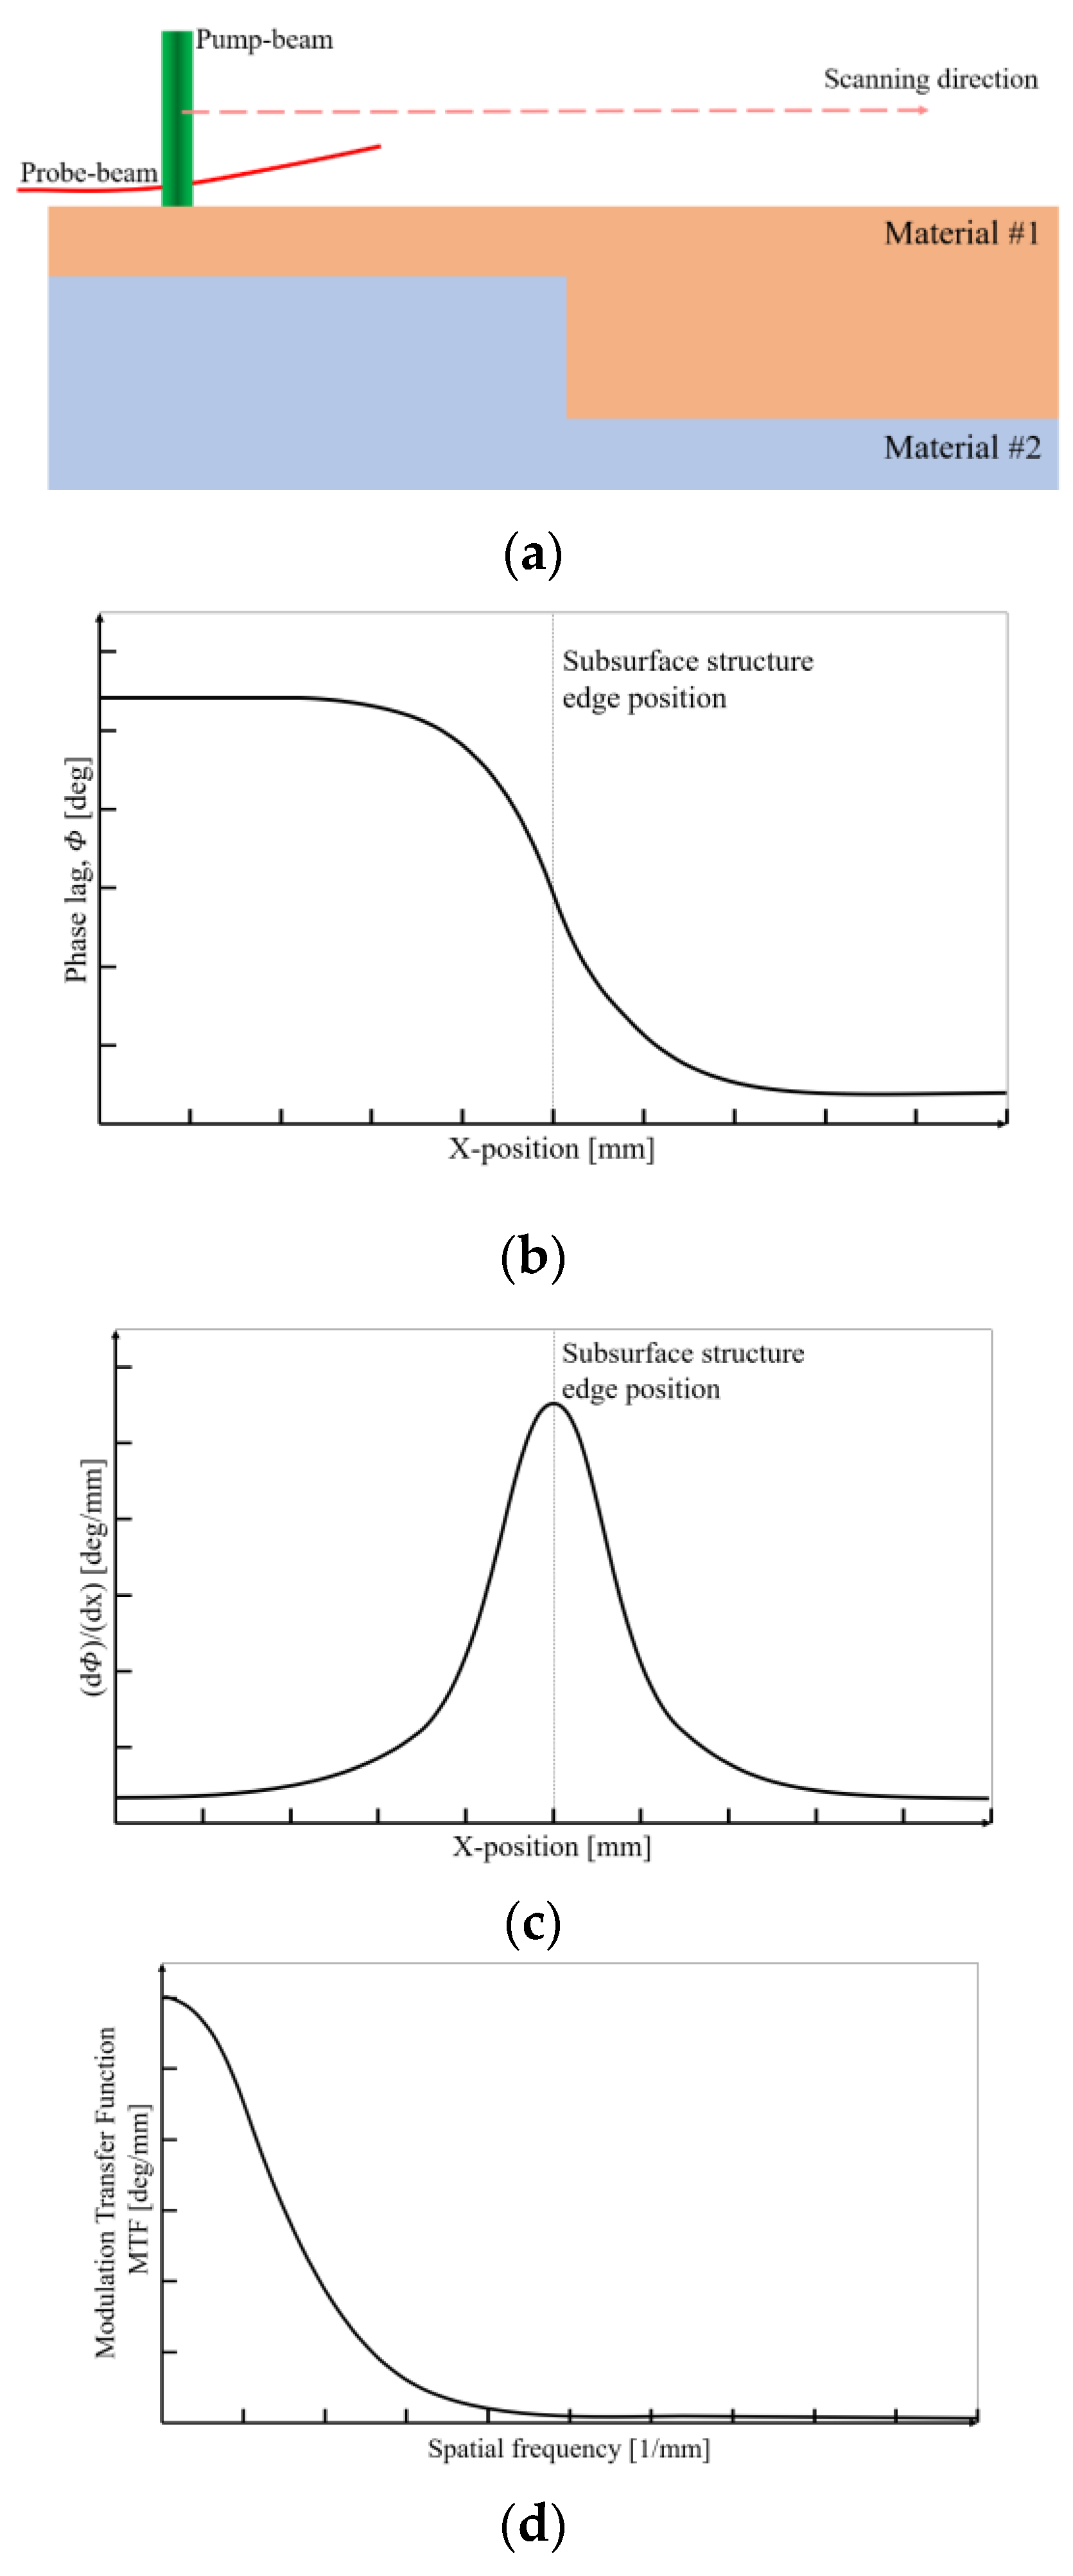
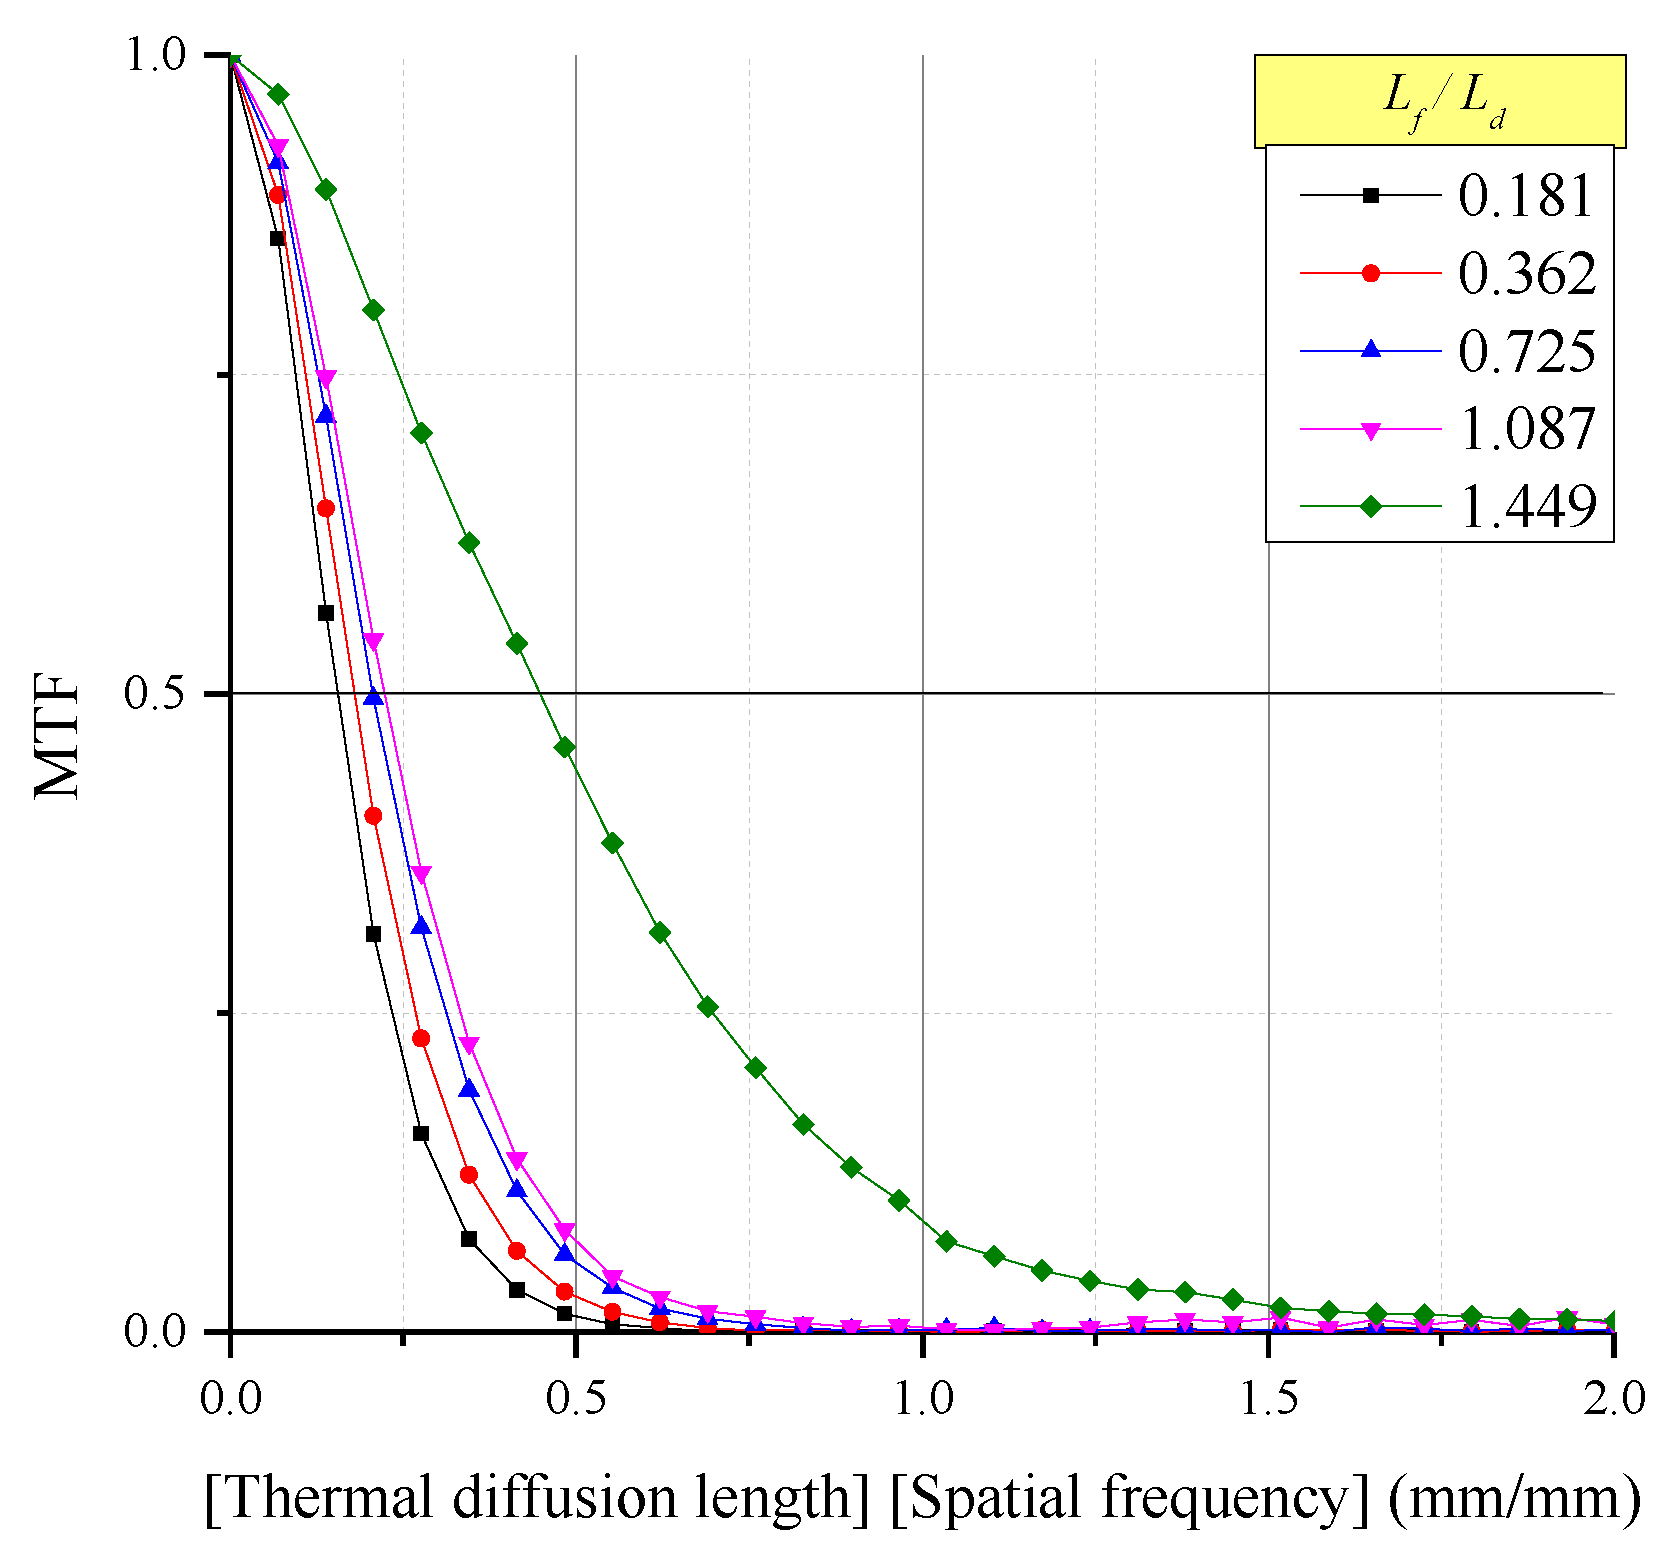
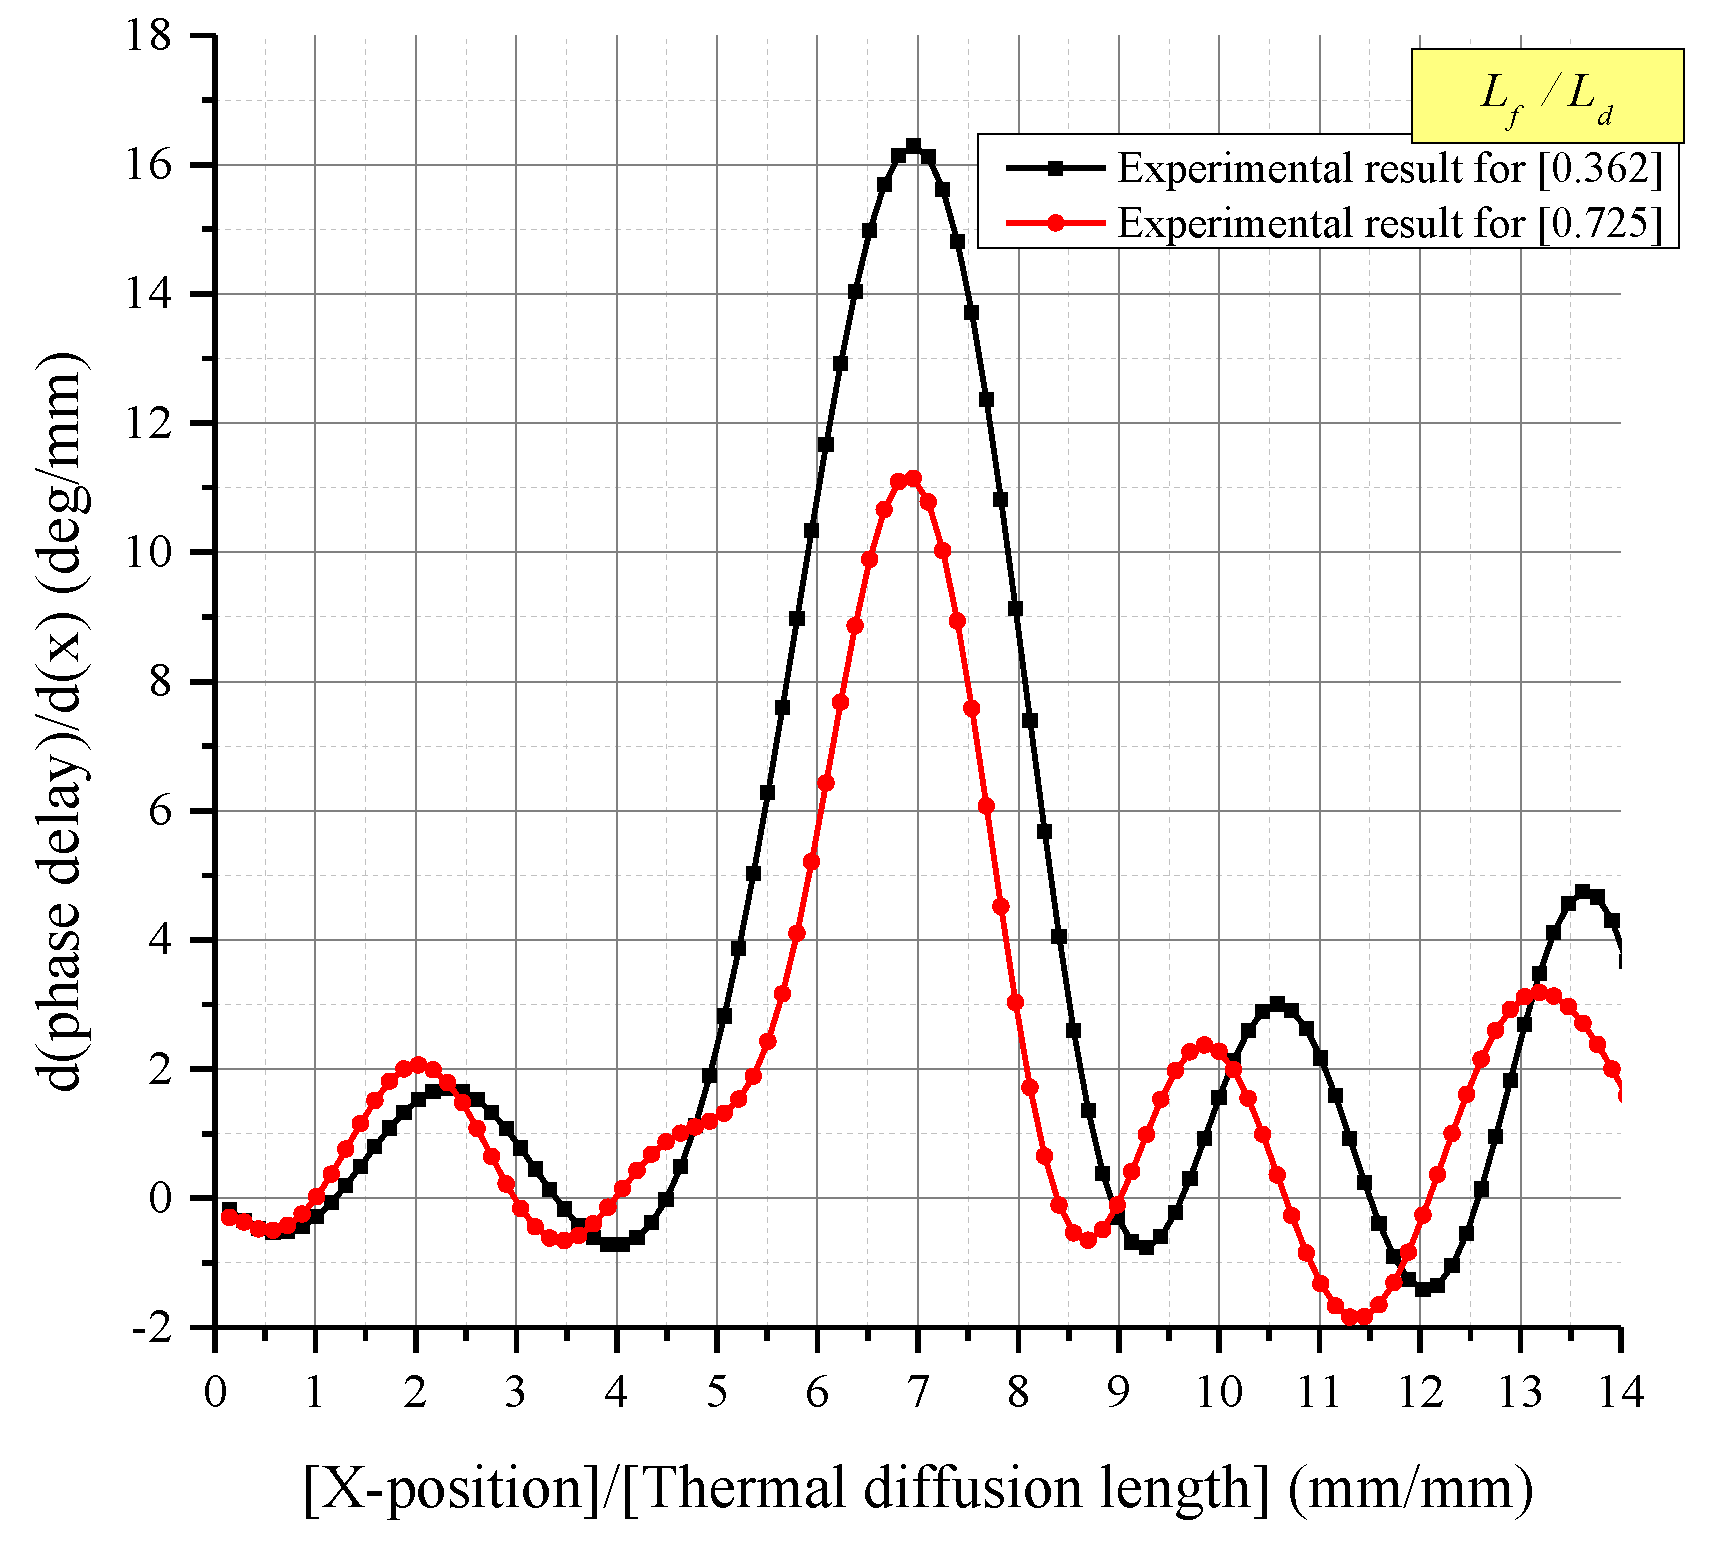
2.2. Spatial Resolution
3. Numerical and Experimental Analysis
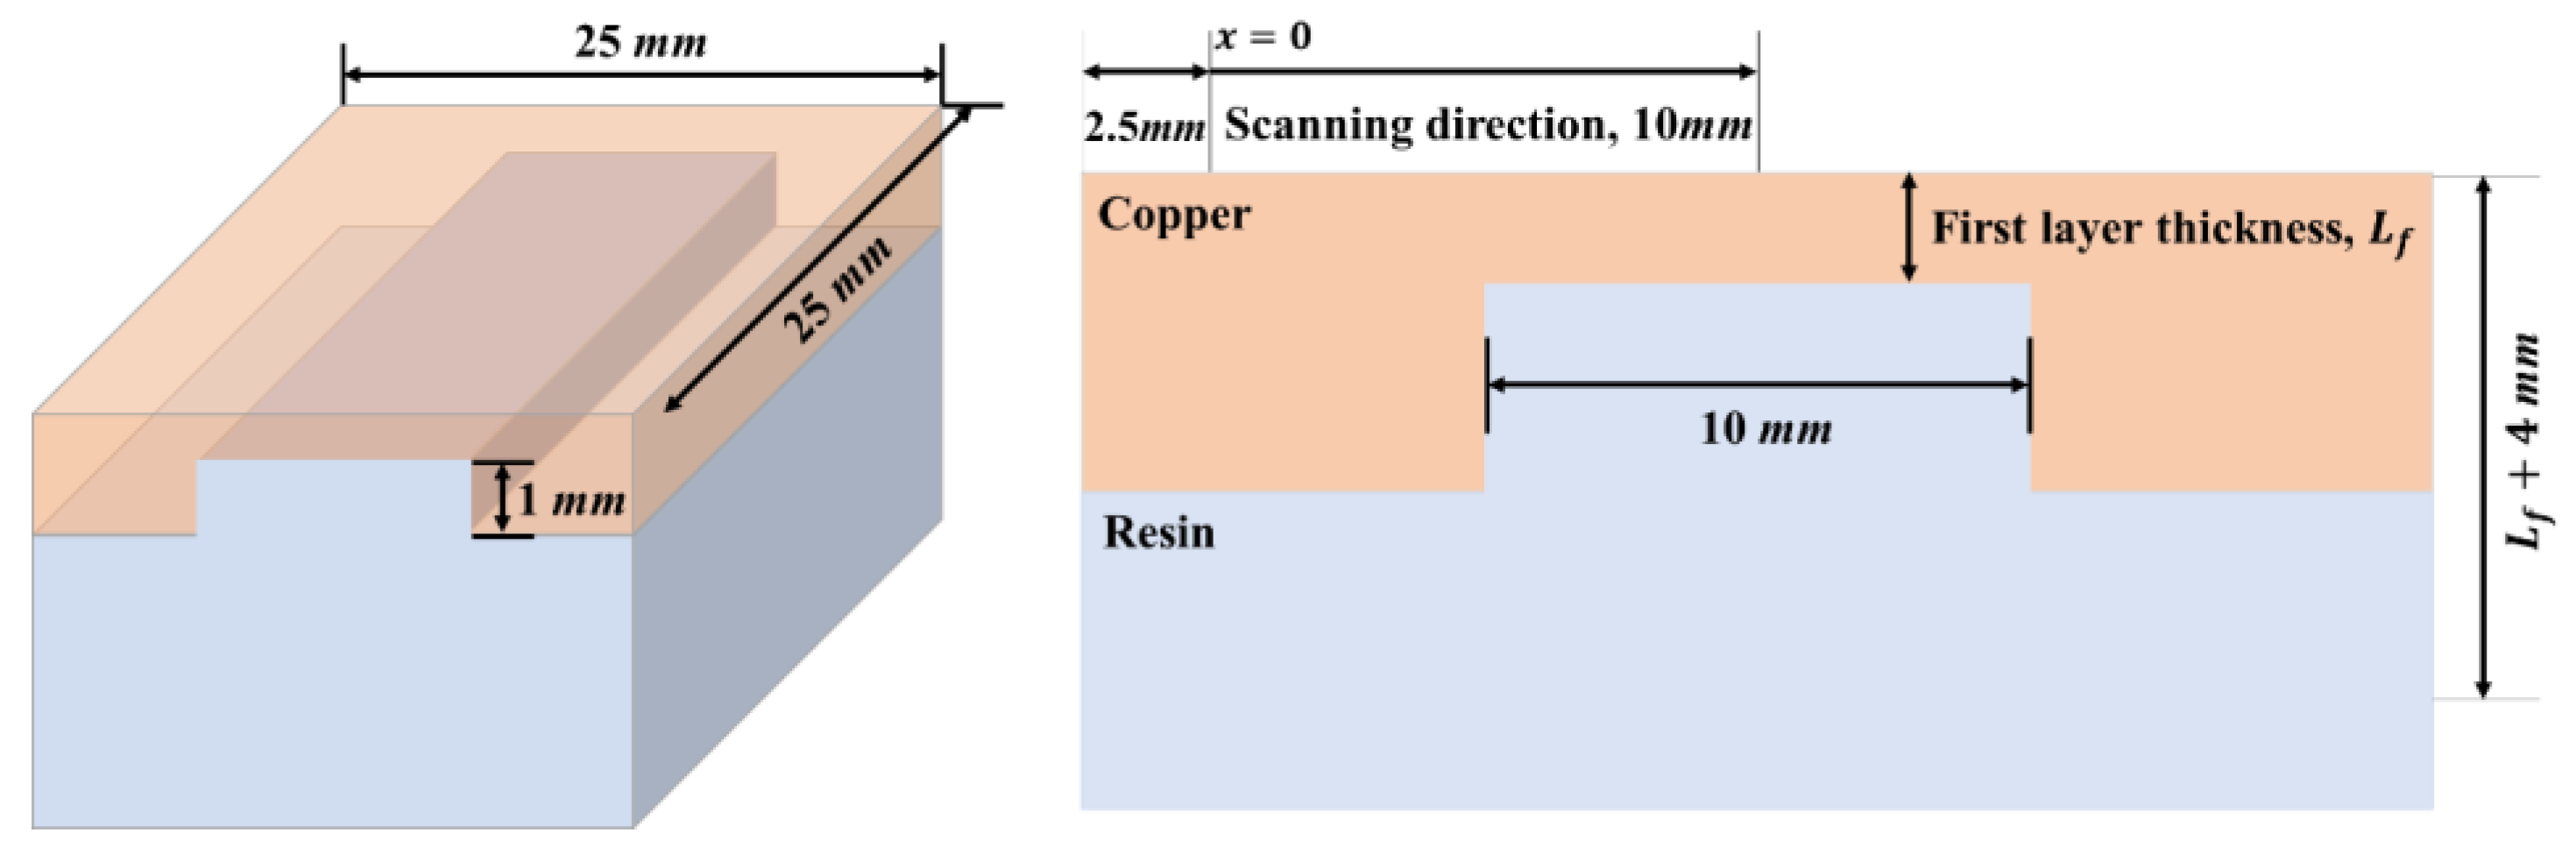
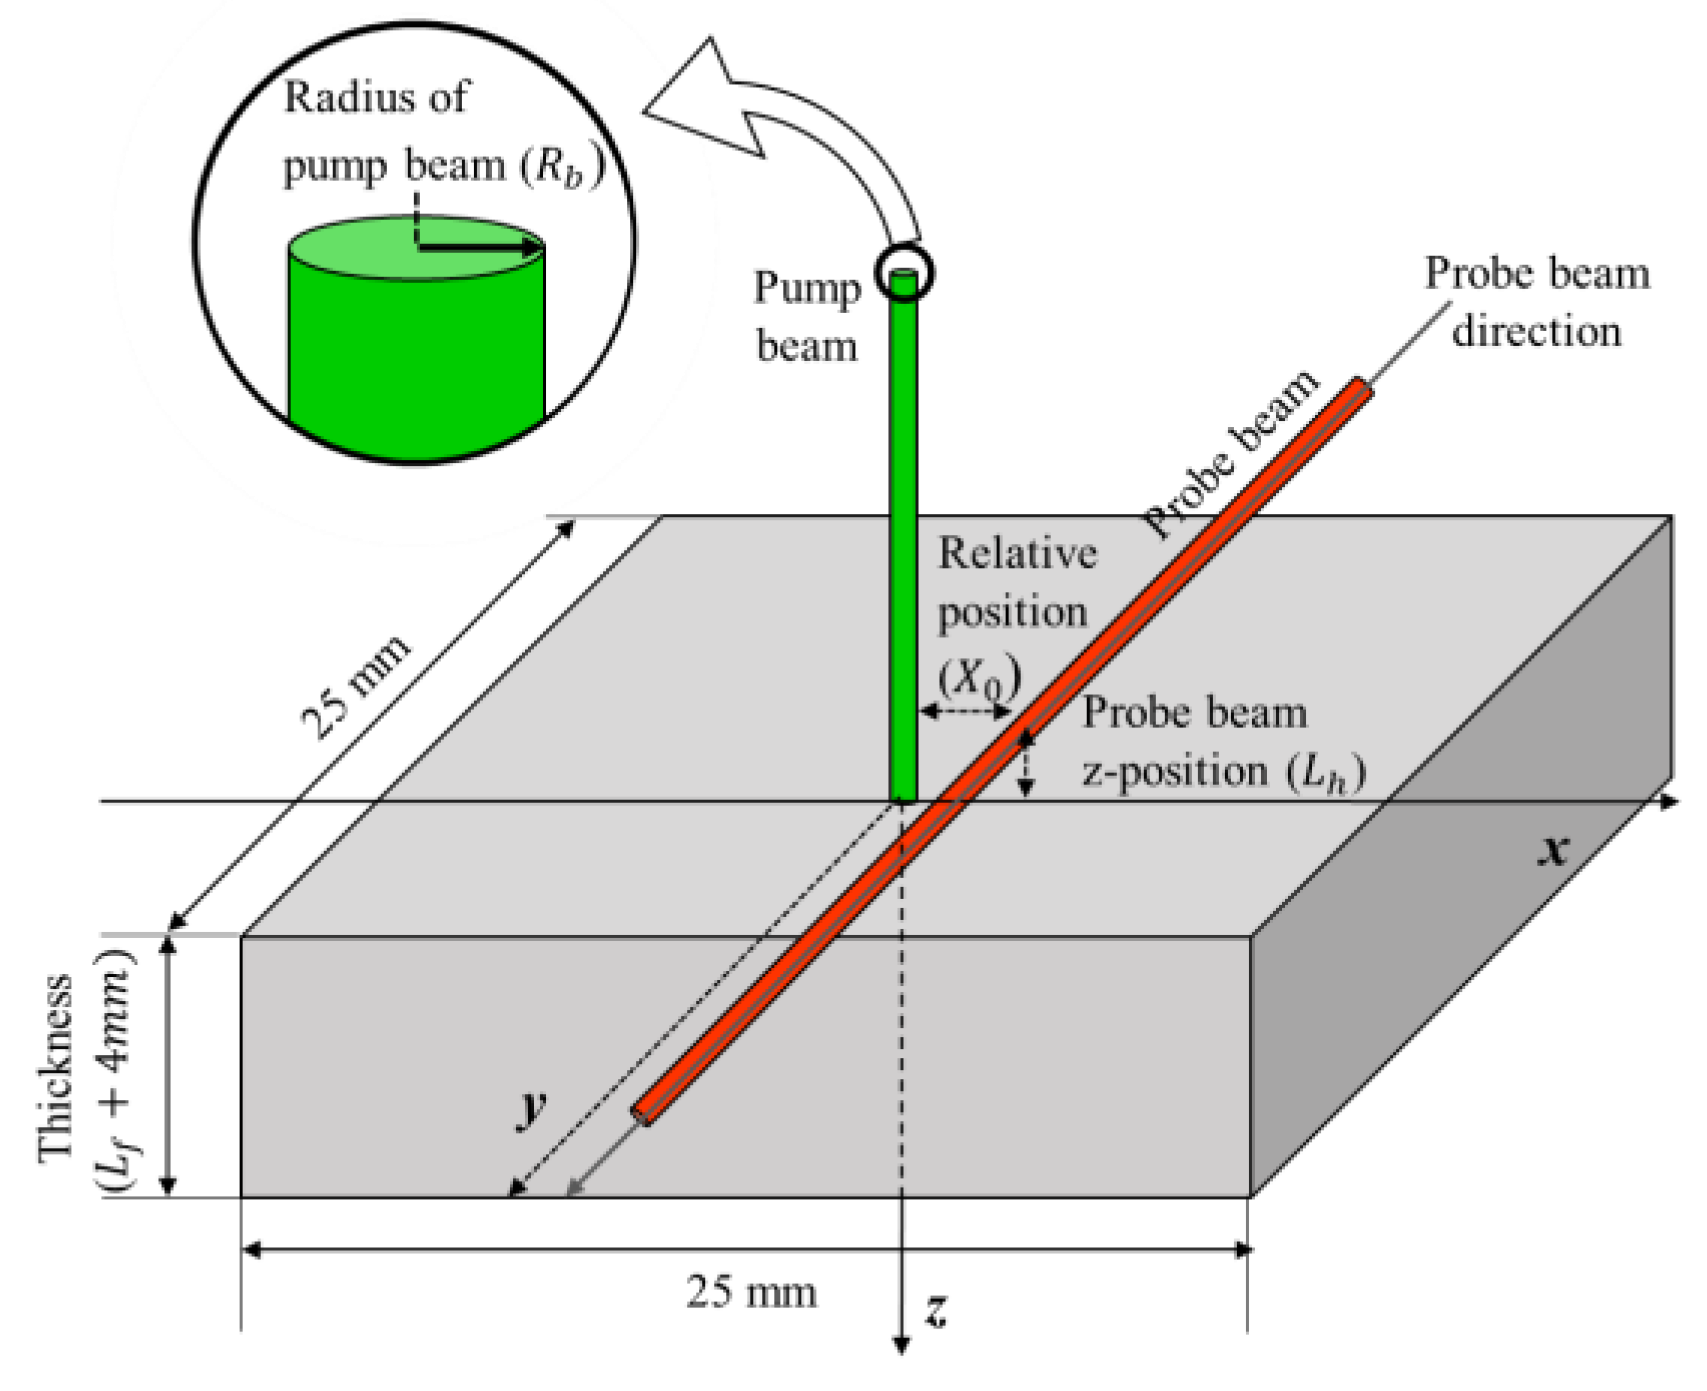
3.1. Setting the Study Parameters
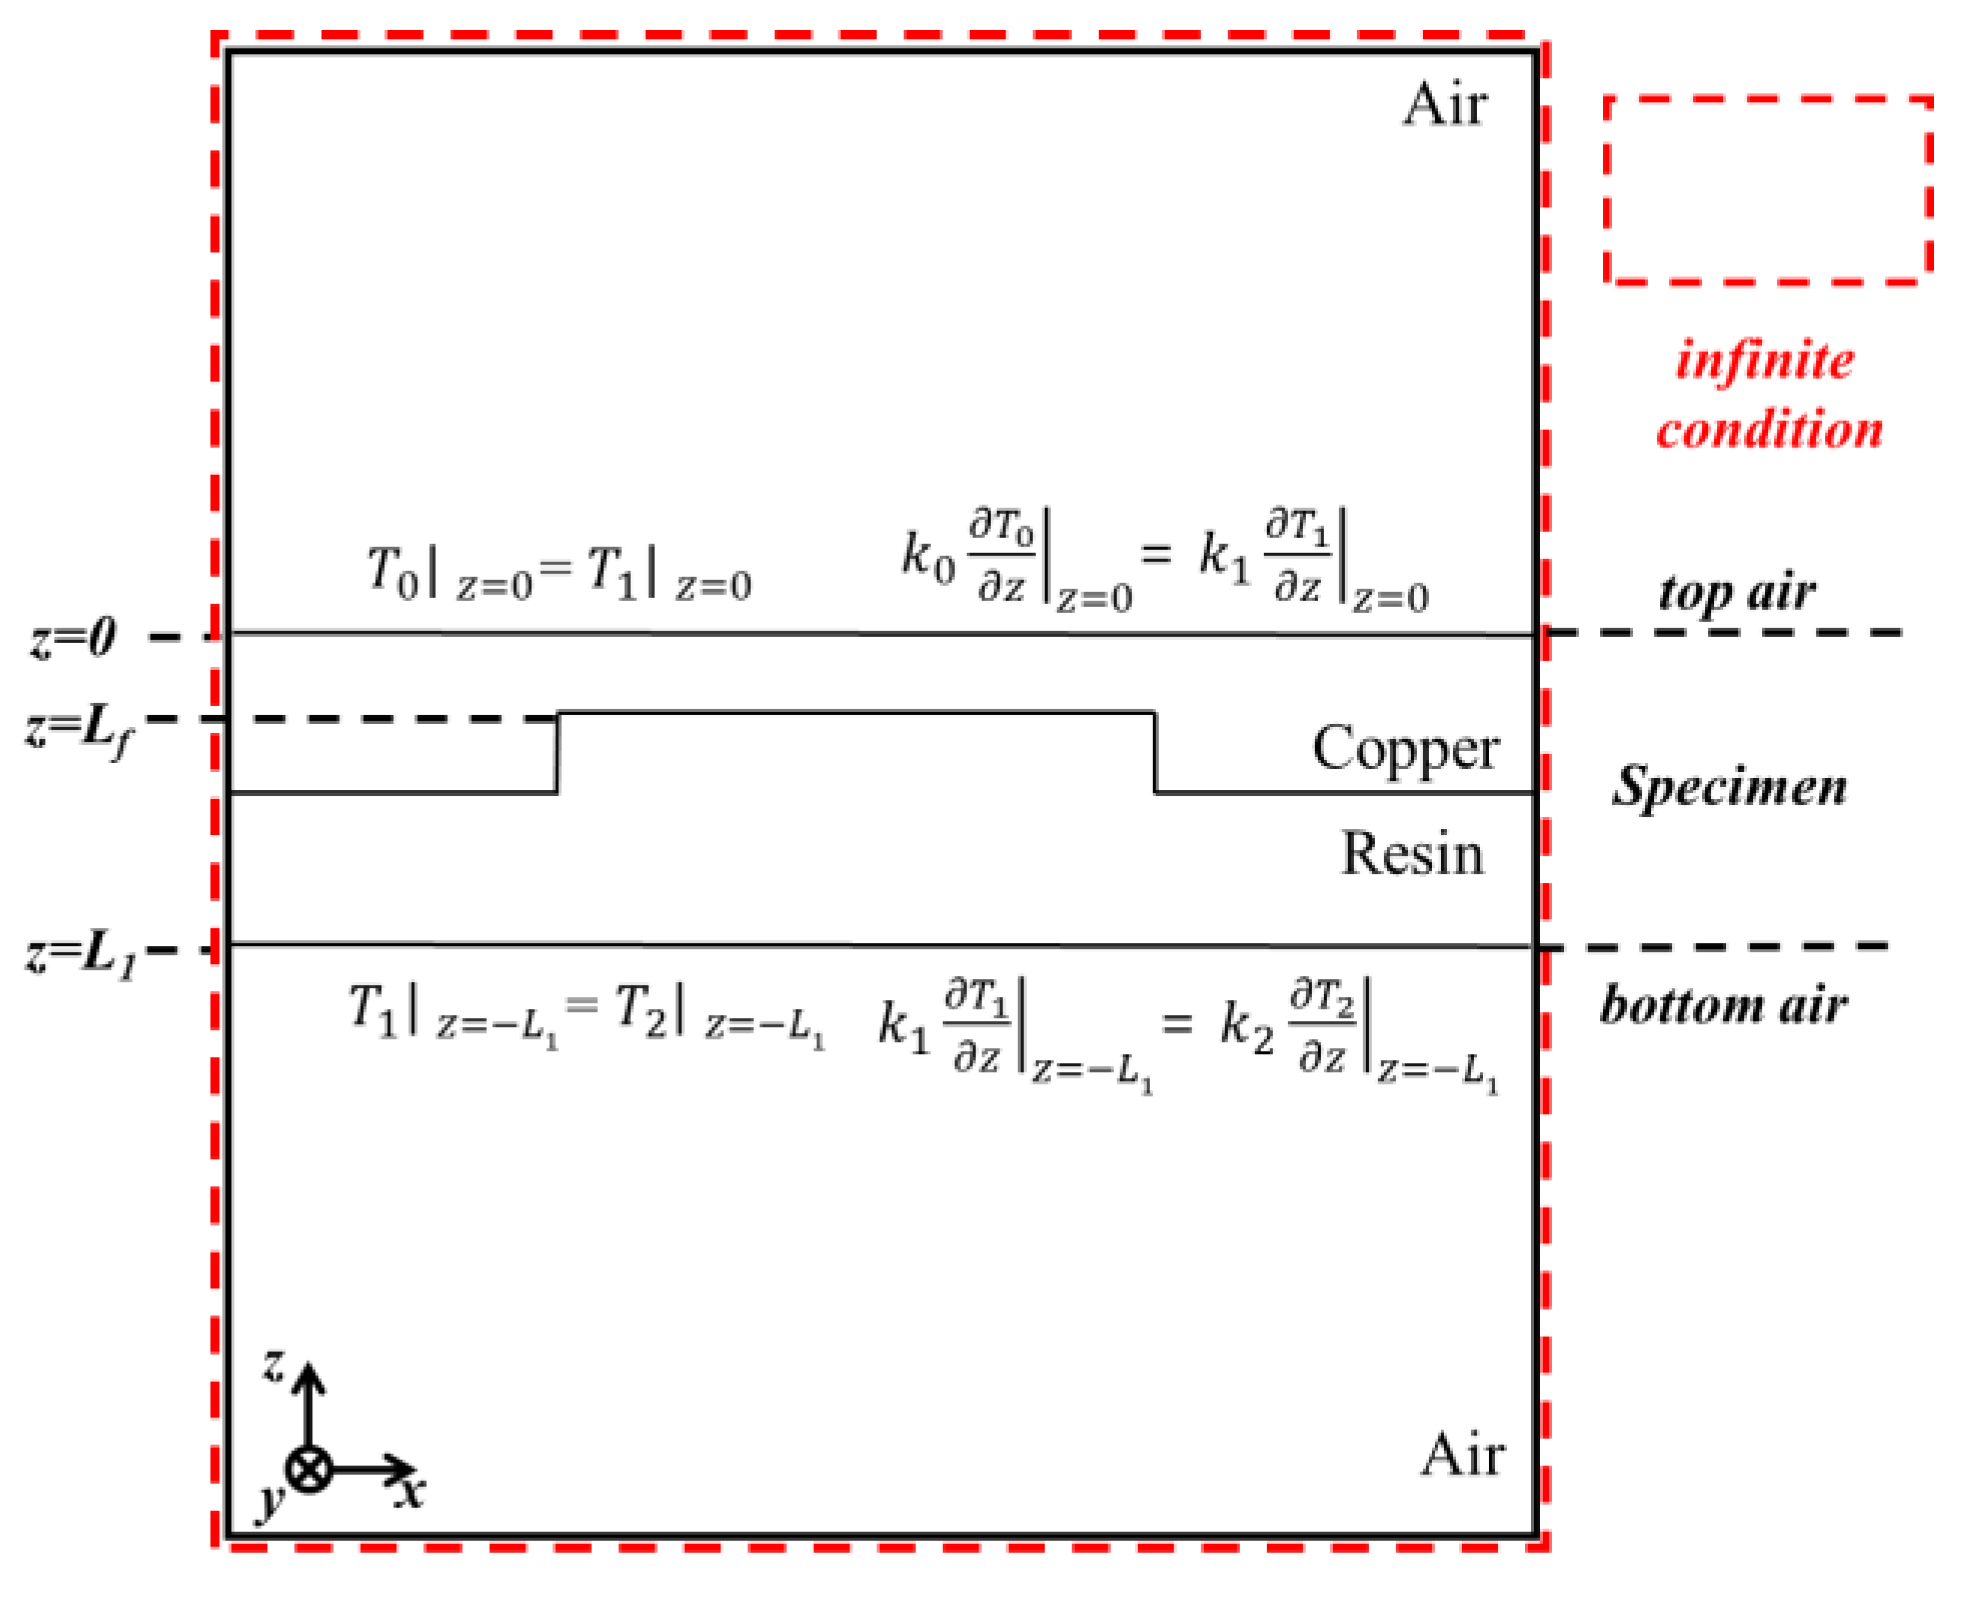
3.2. Numerical Analysis
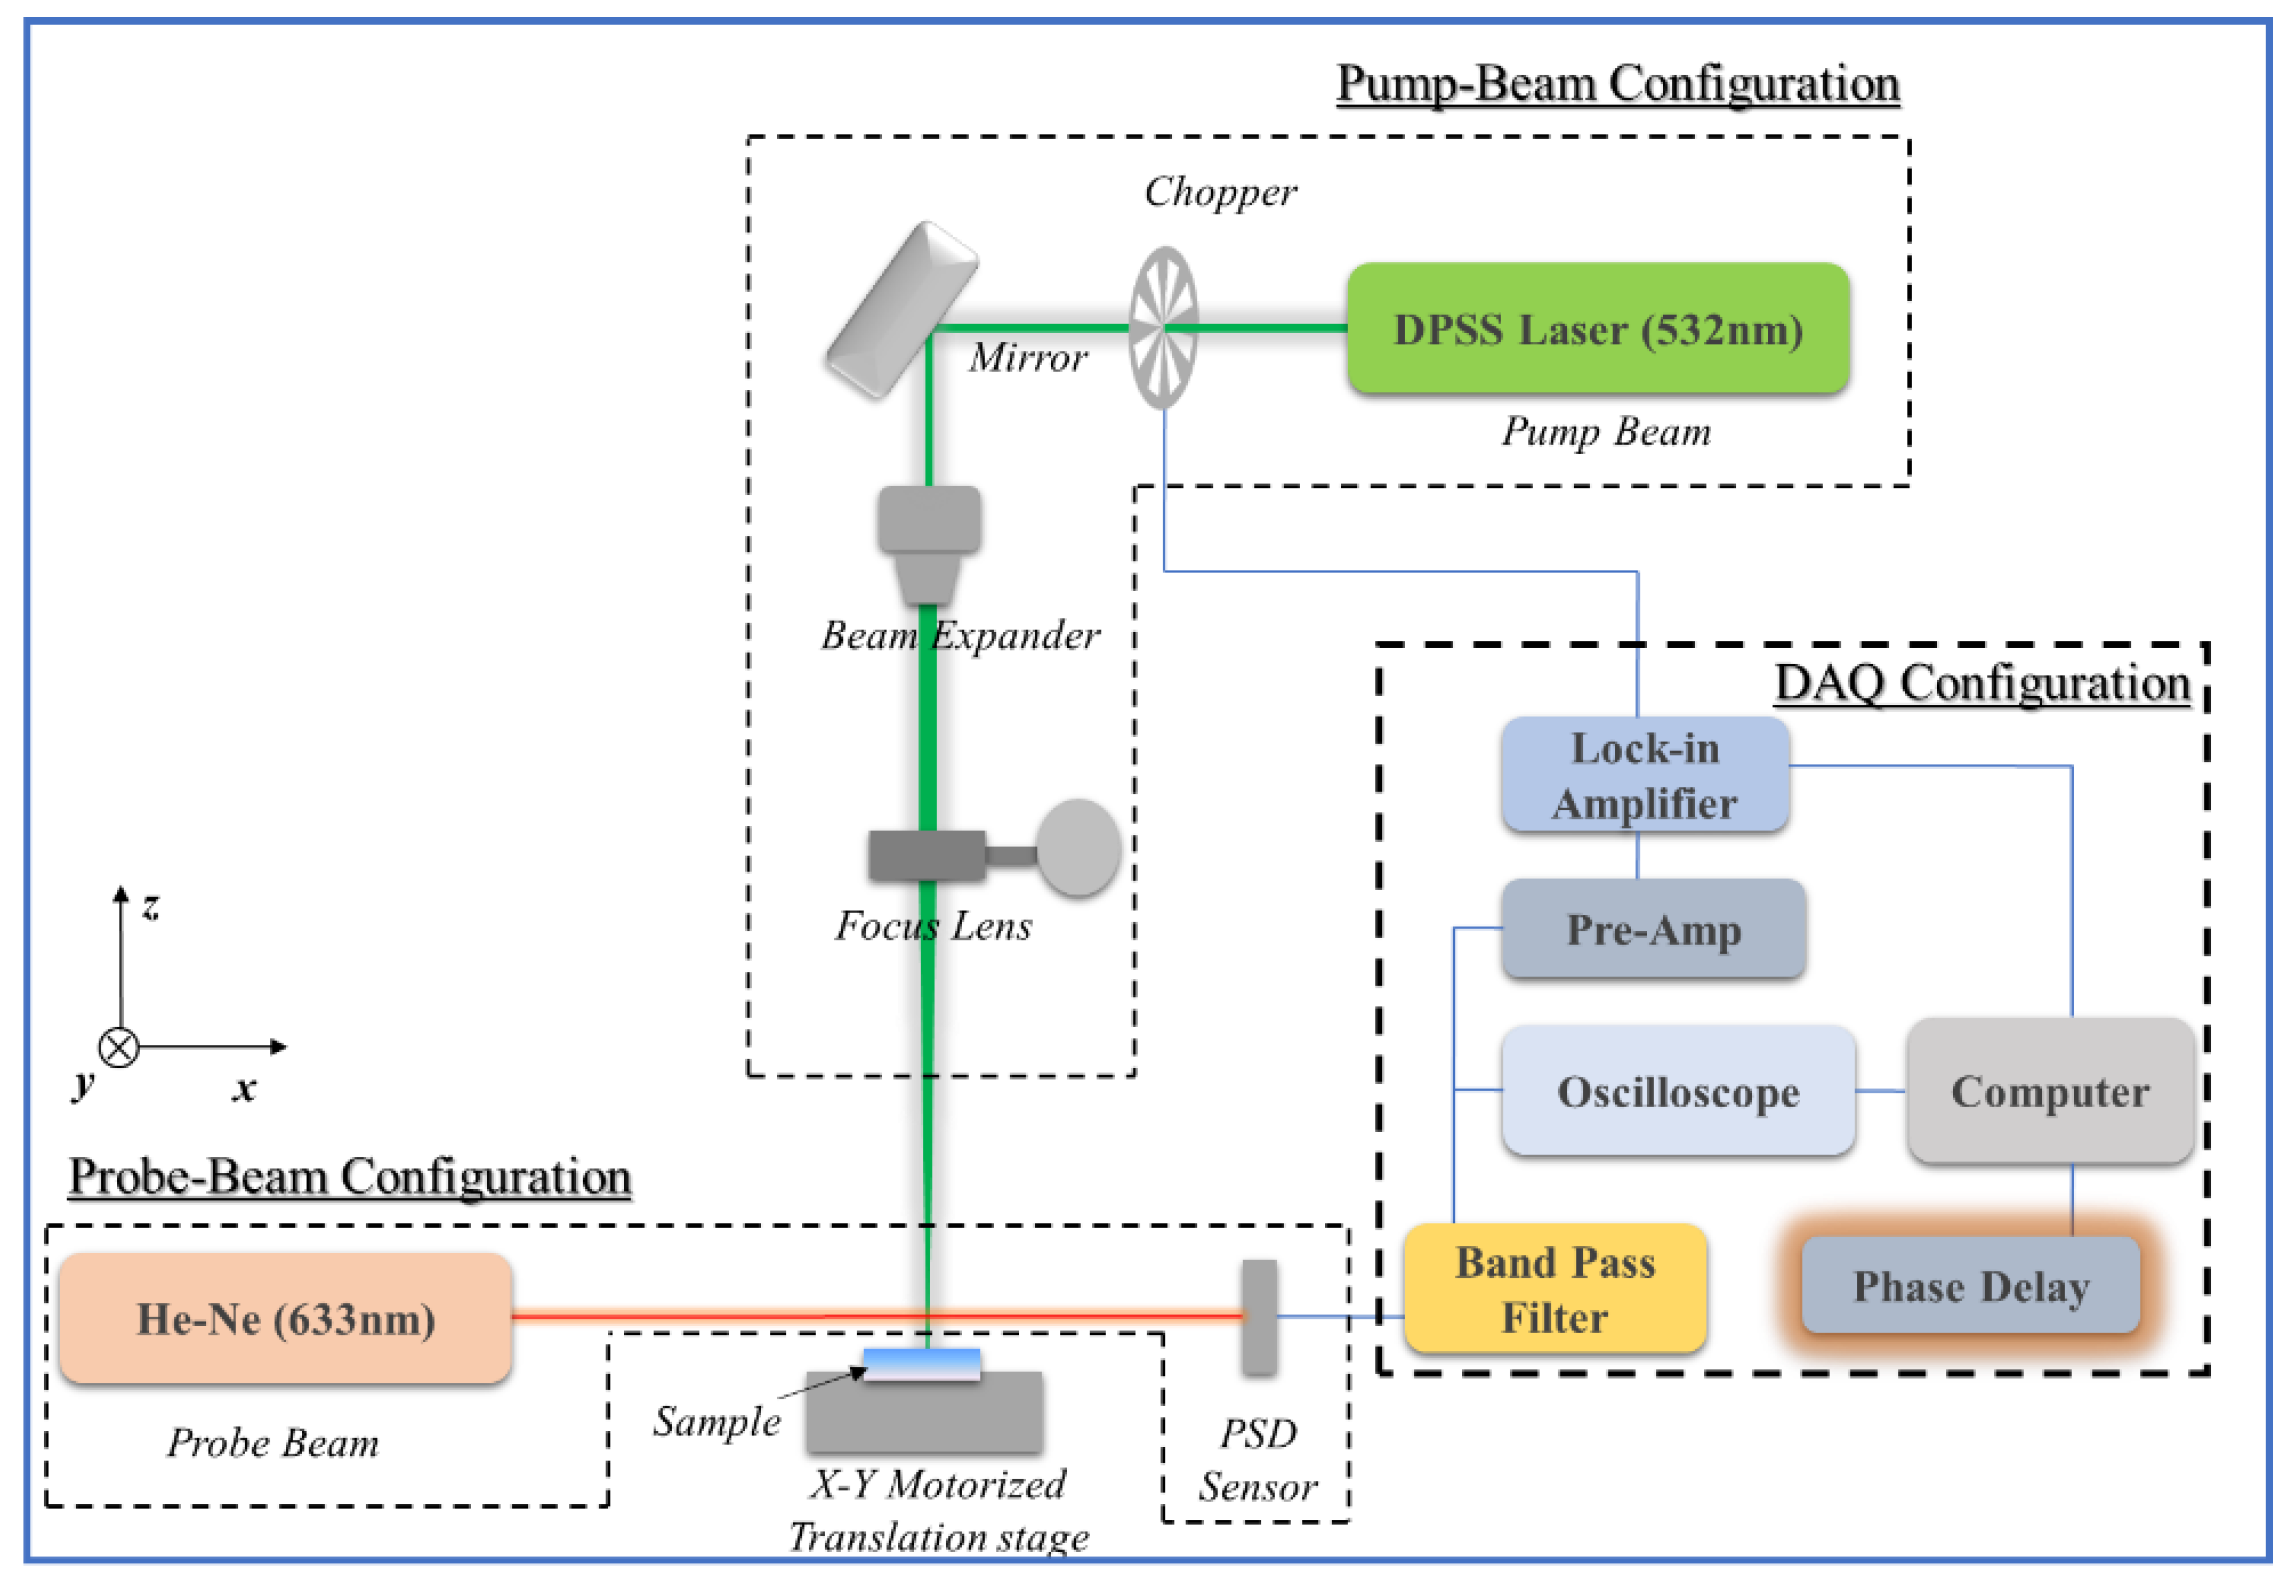
3.3. Experimental Apparatus and Setup
4. Results of Numerical Analysis
4.1. Image Quality Change with
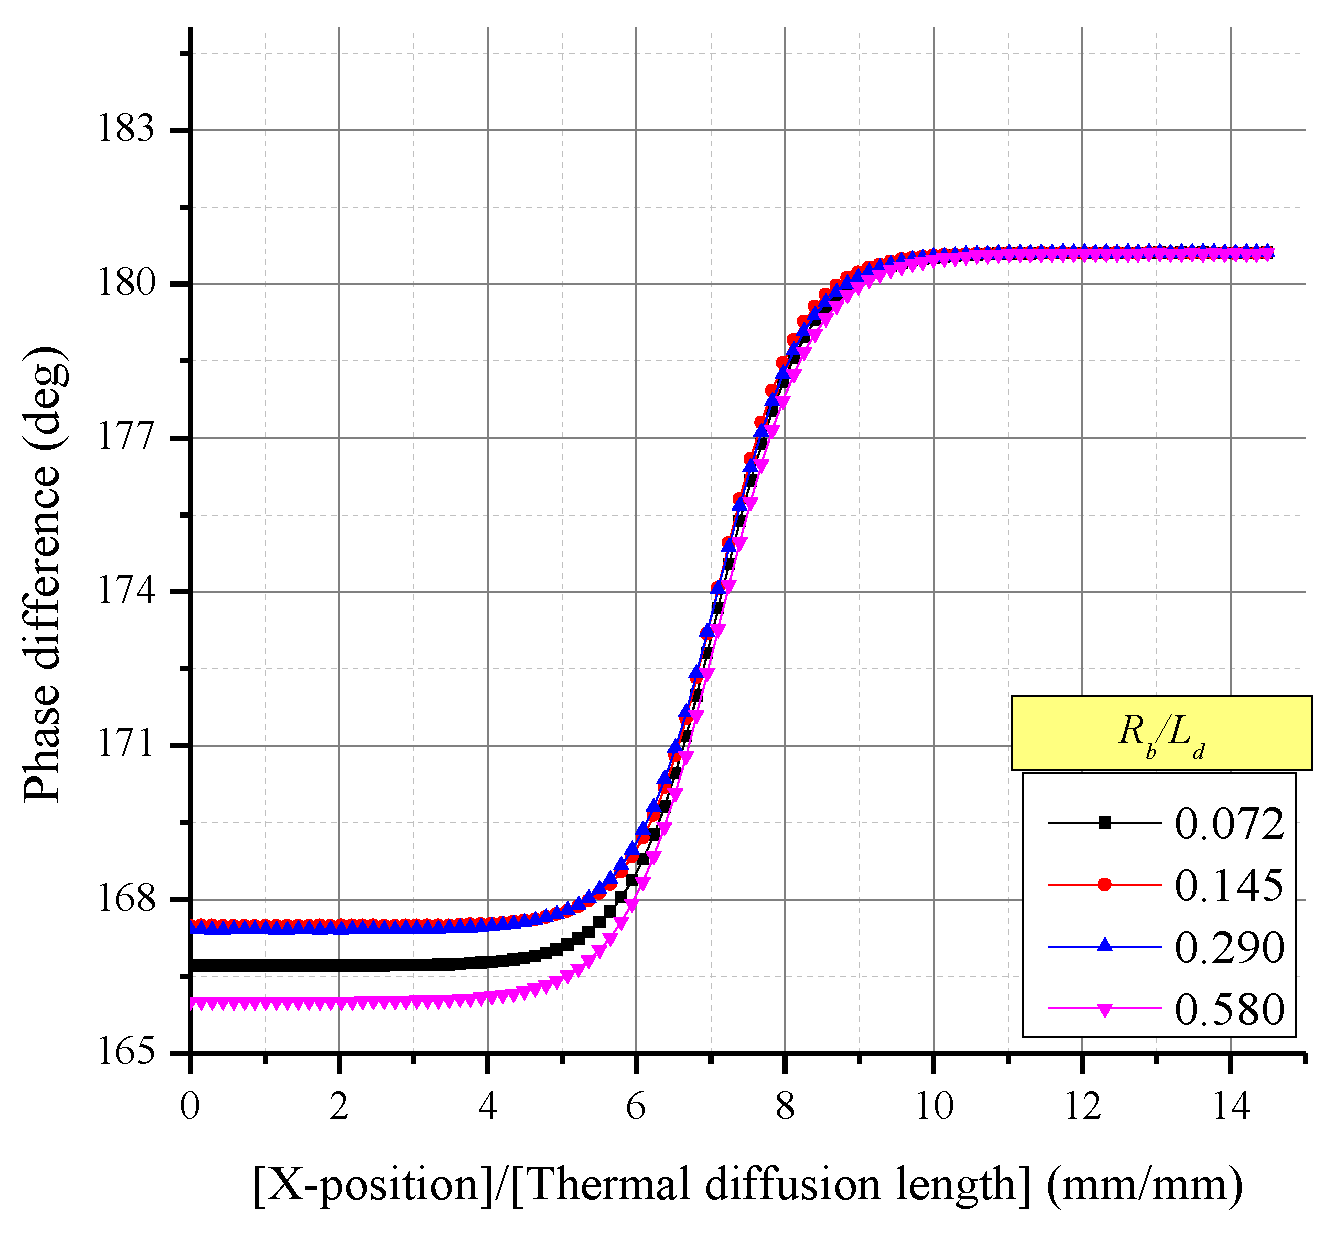
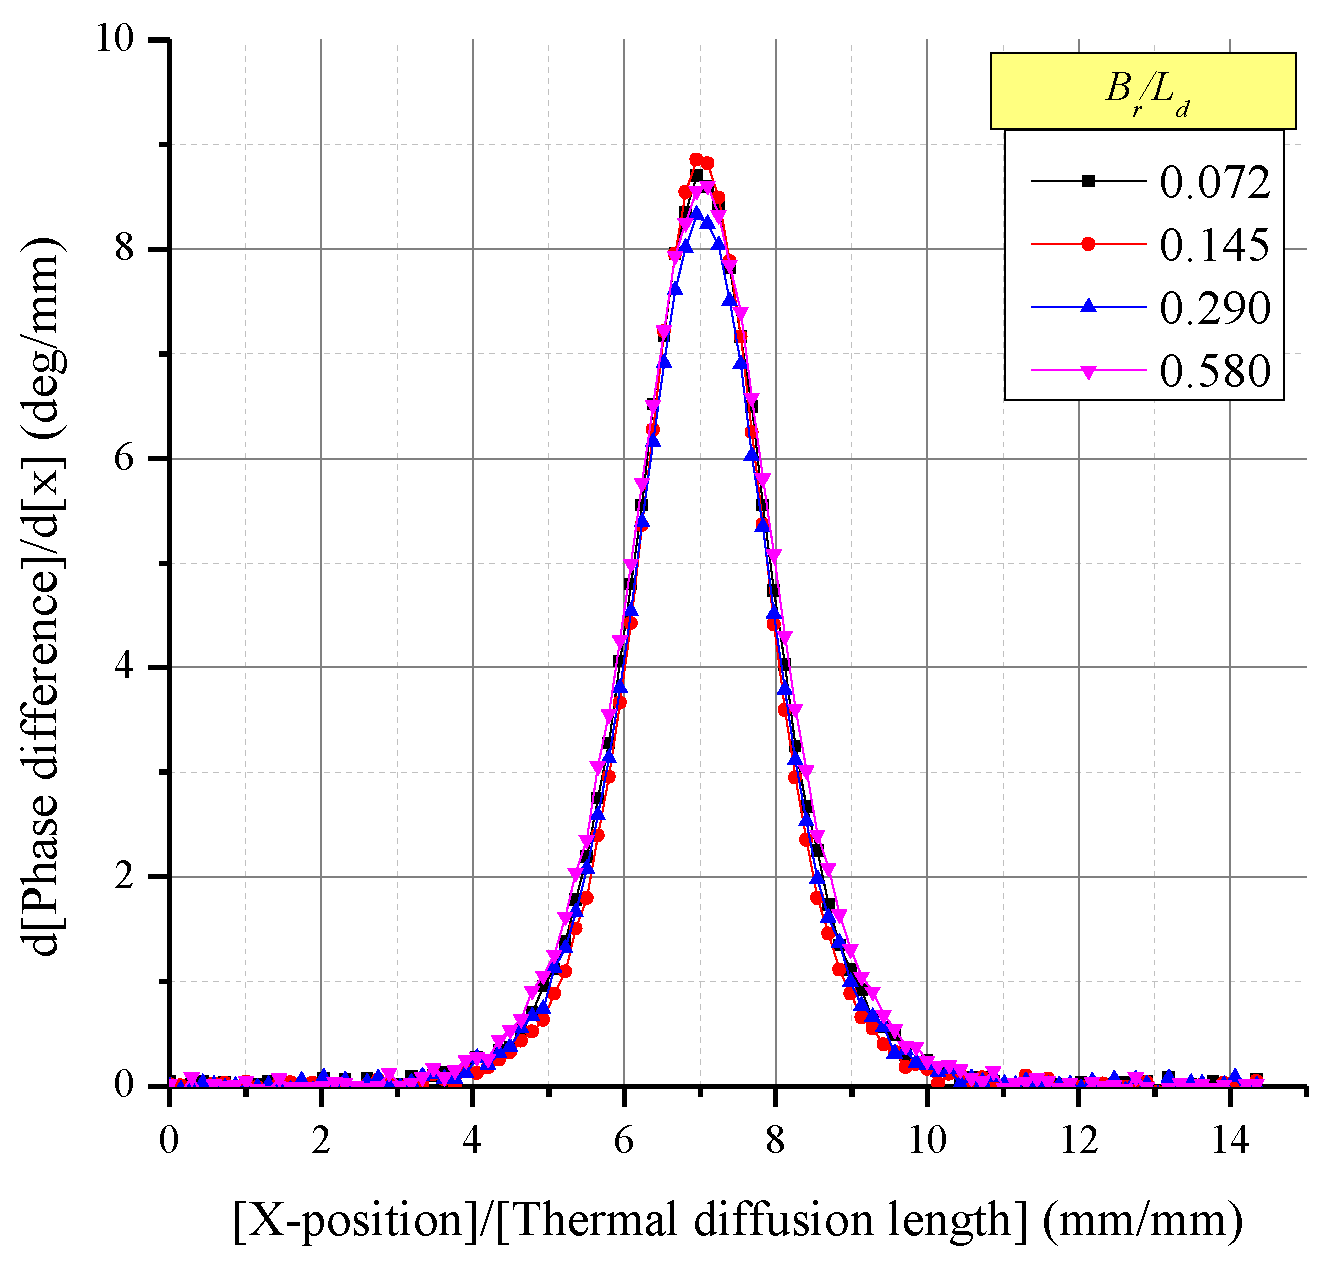
4.2. Image Quality Change with
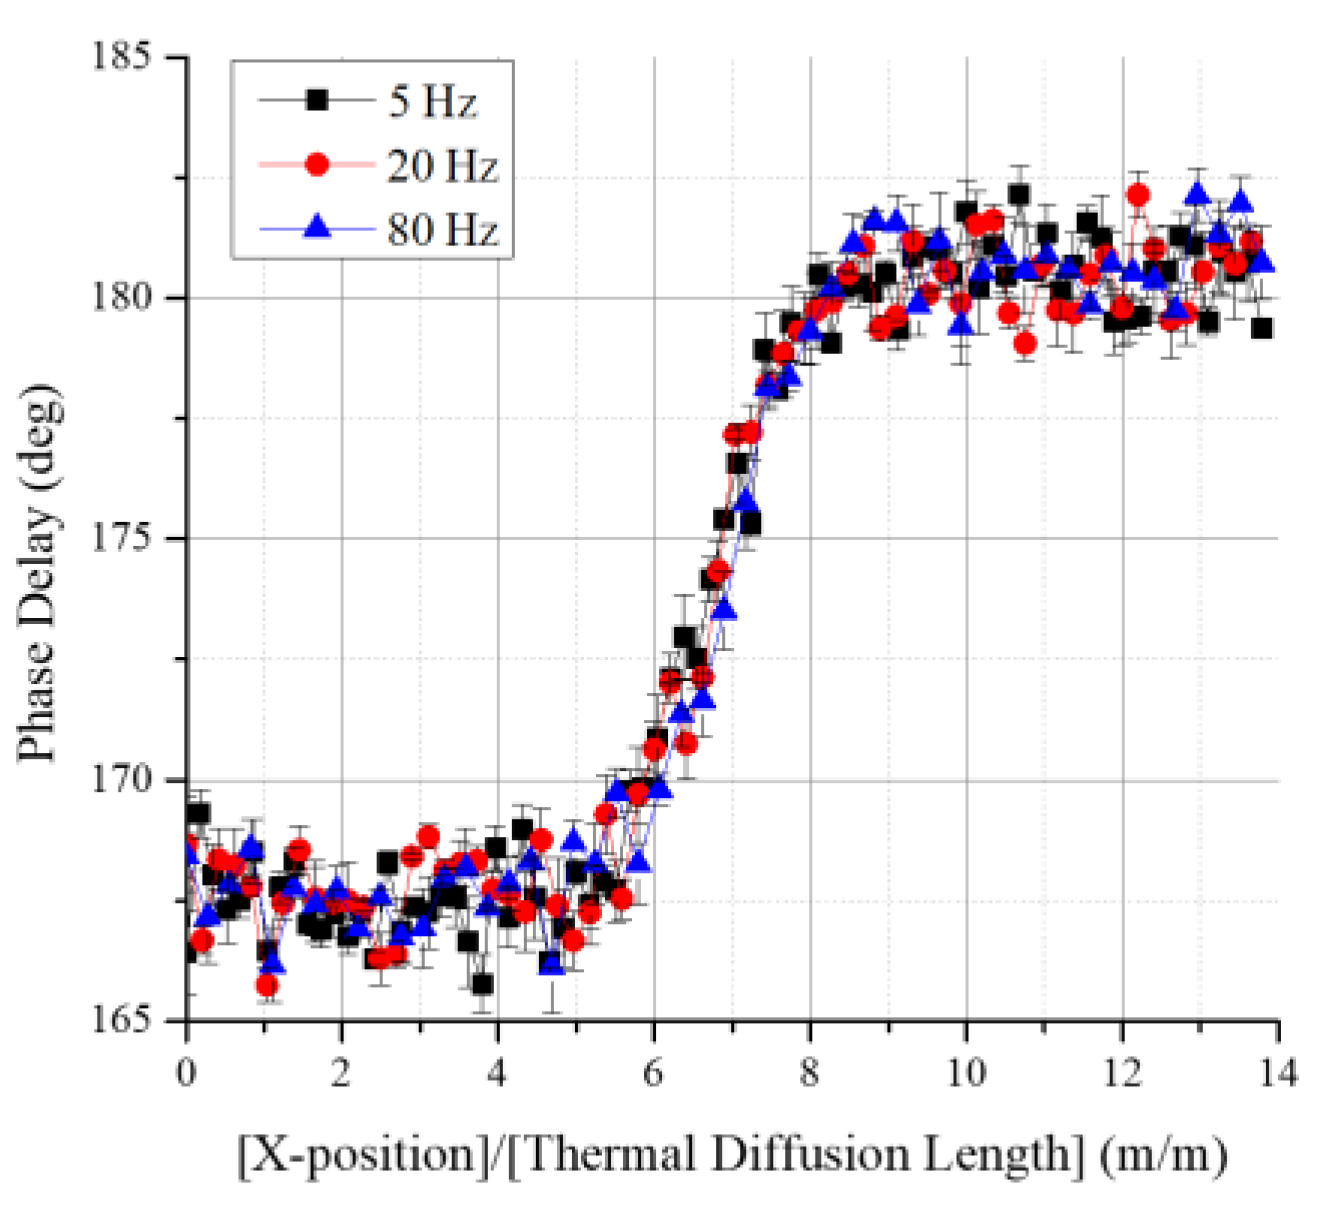
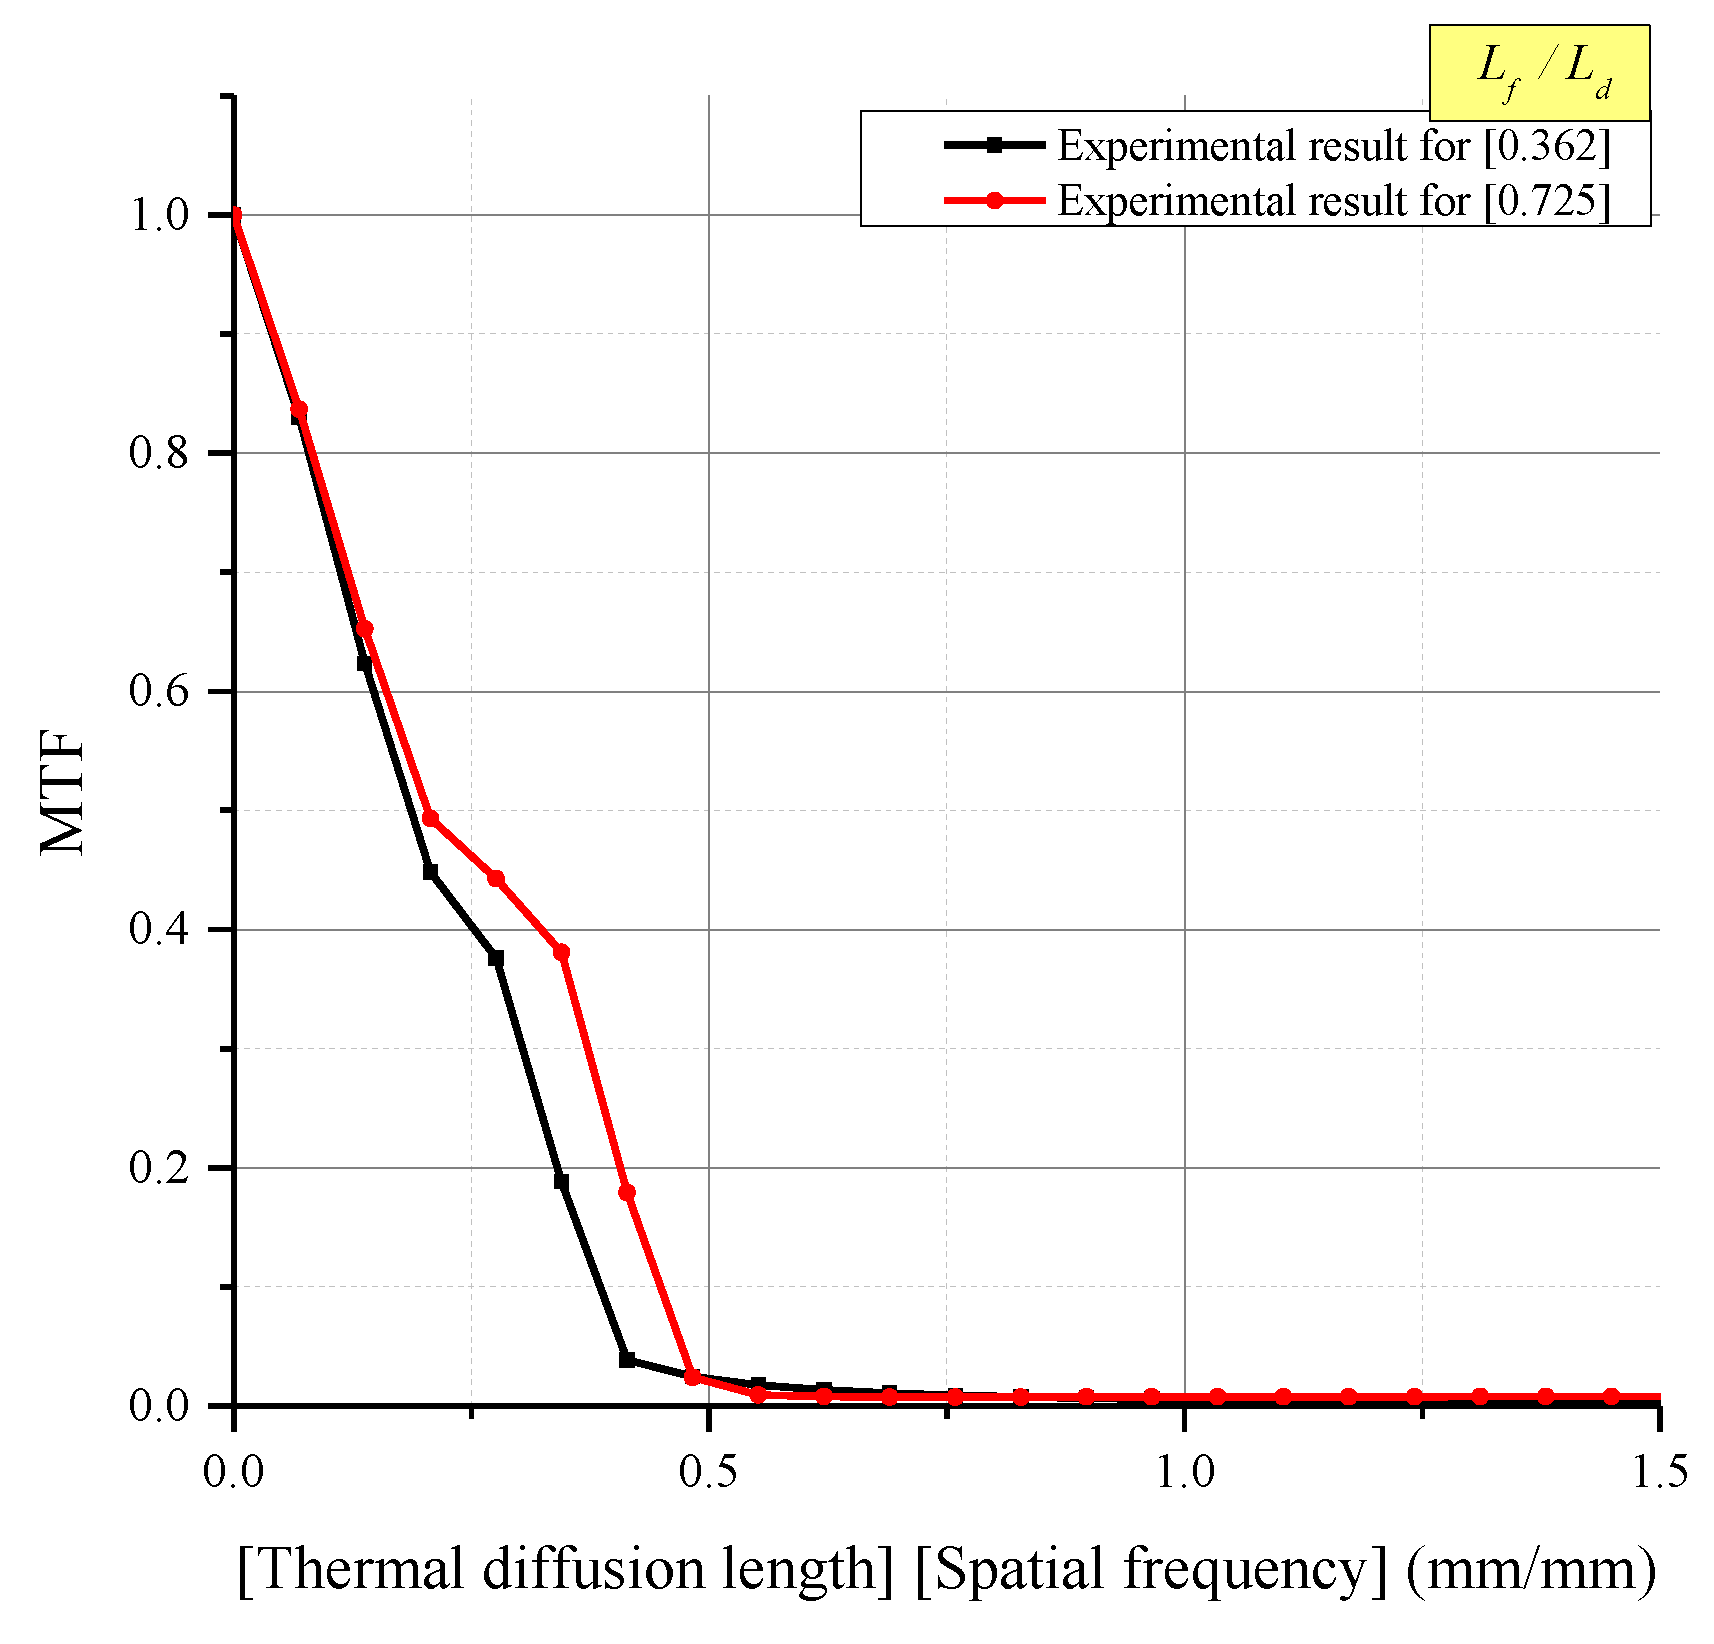
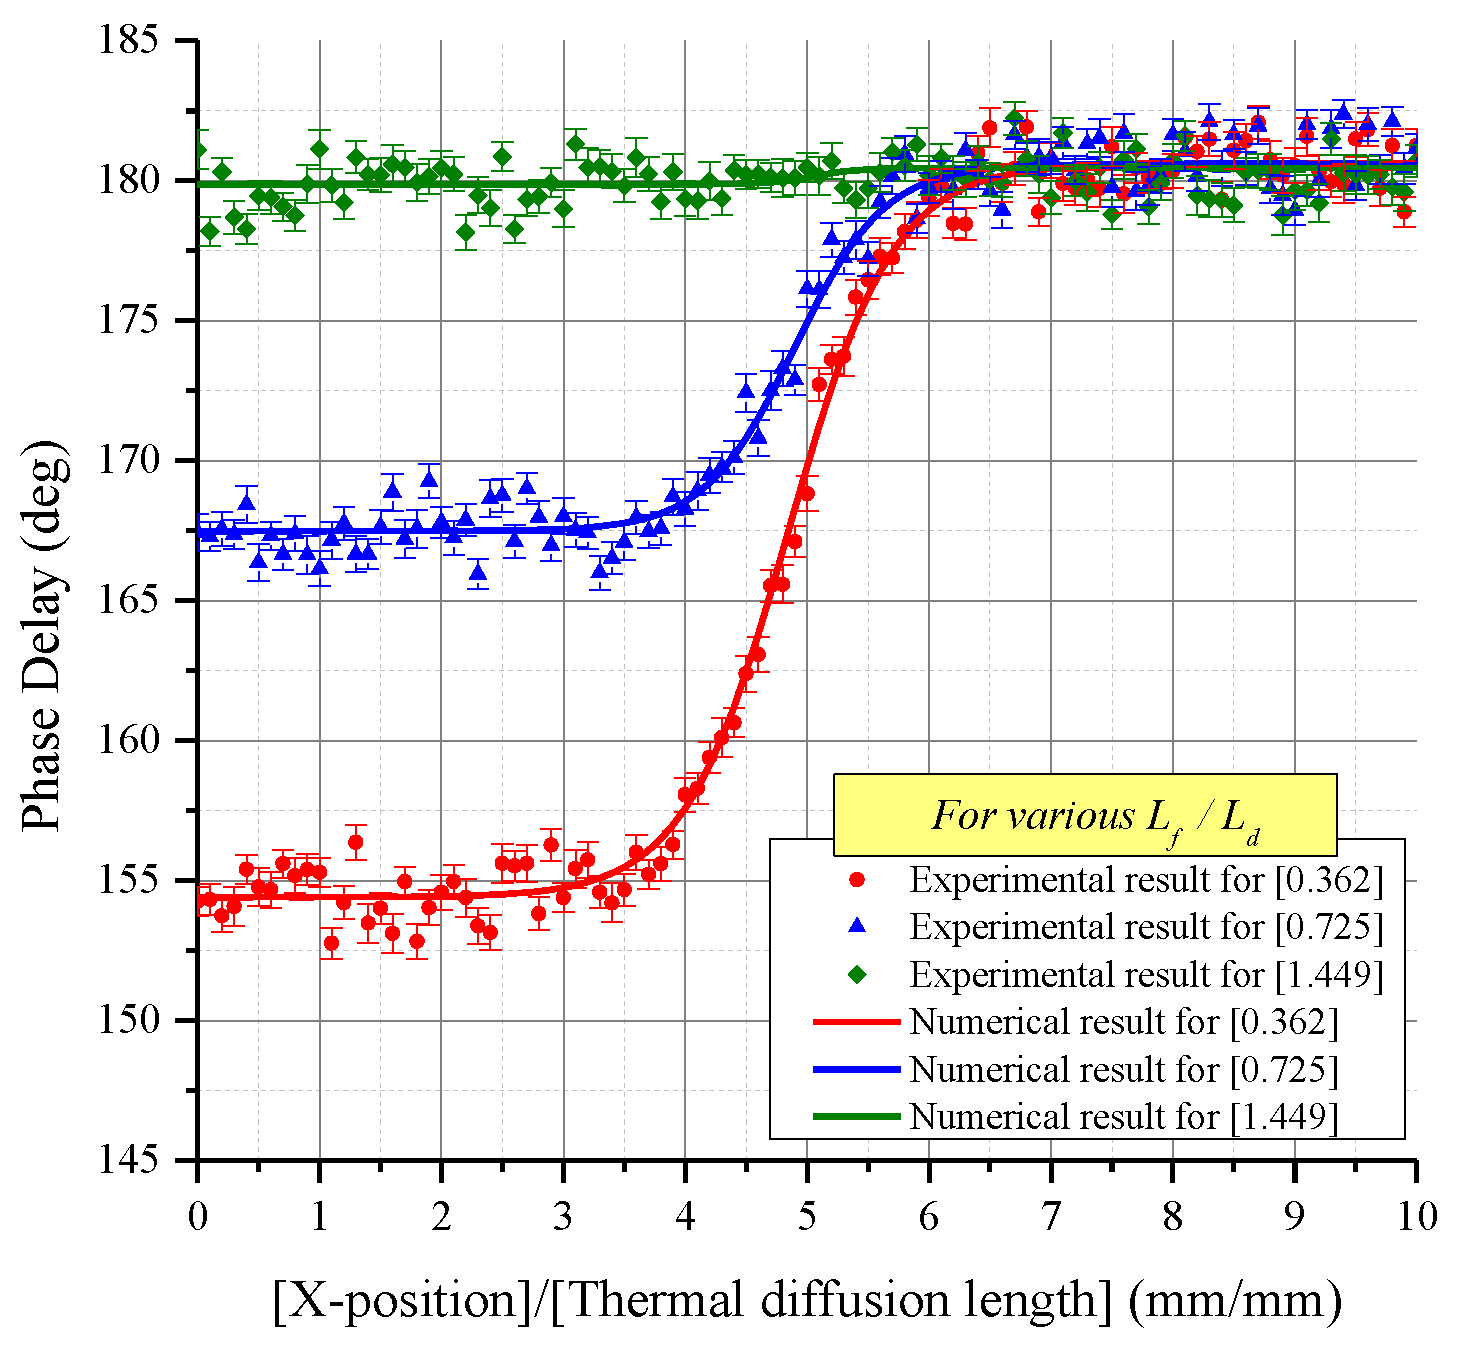
5. Results of Experimental Analysis
6. Conclusions
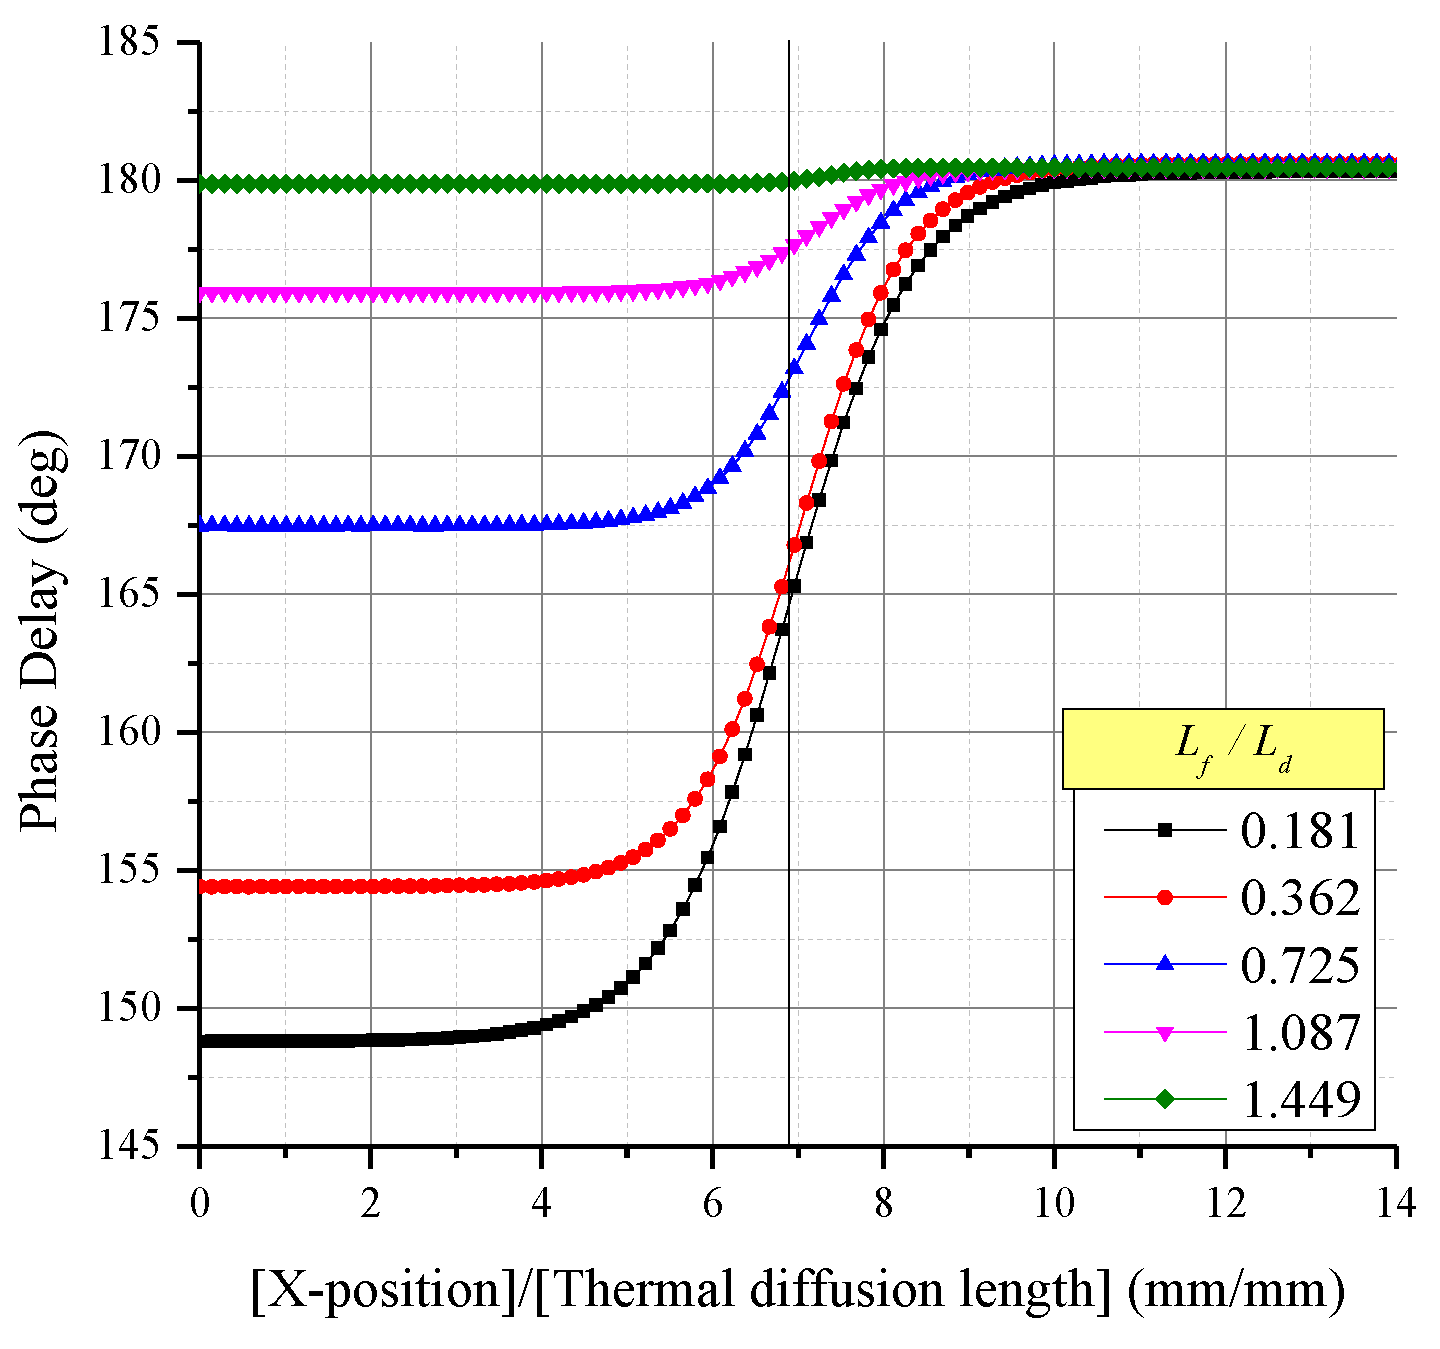
- It was verified that the phase delay profile (edge response function, ERF) of the subsurface structure derived by the photothermal imaging method could be nondimensionalized in relation to the thermal diffusion length. Therefore, various studies on and can be conducted to quantitatively analyze the spatial resolution and contrast of photothermal imaging regardless of the absolute size and thermal properties of the material to be measured.
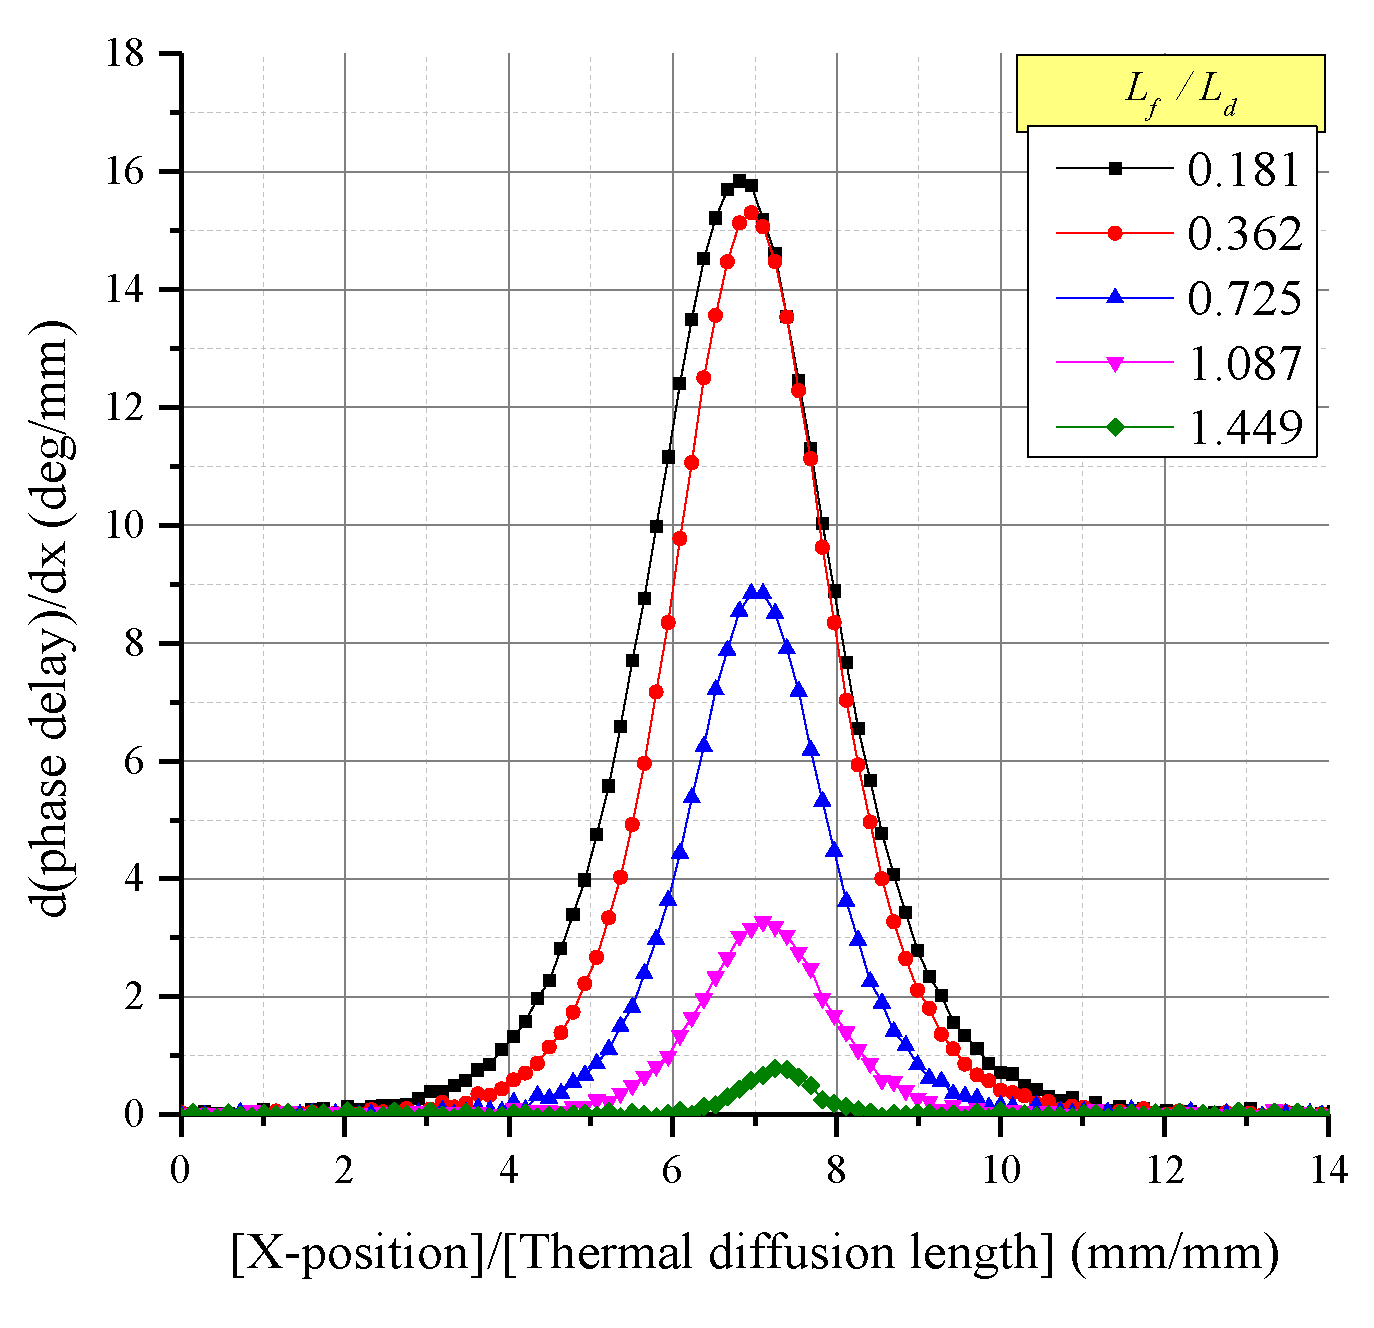
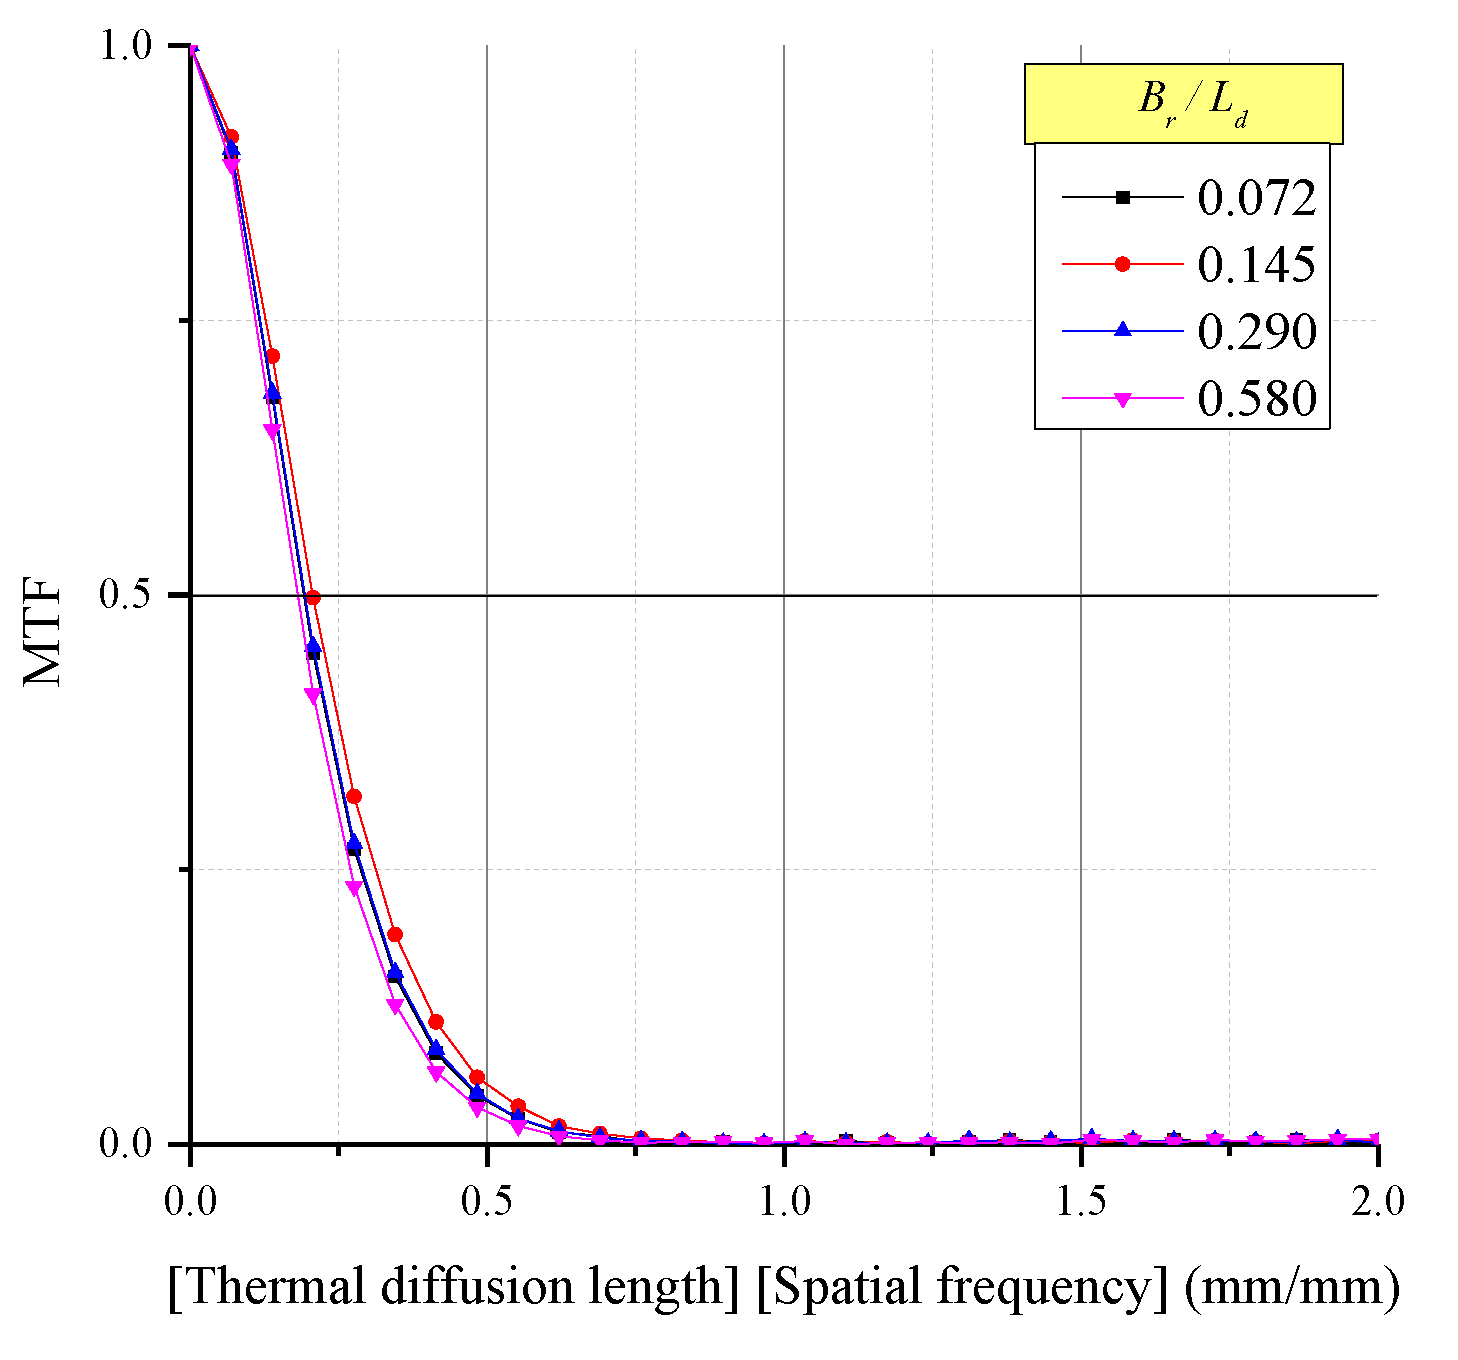
- Analyzing the spatial resolution and contrast under different measuring conditions revealed that, as the ratio of increases, the spatial resolution and contrast increase as well. On the other hand, the ratio of has an insignificant effect on the spatial resolution and contrast.
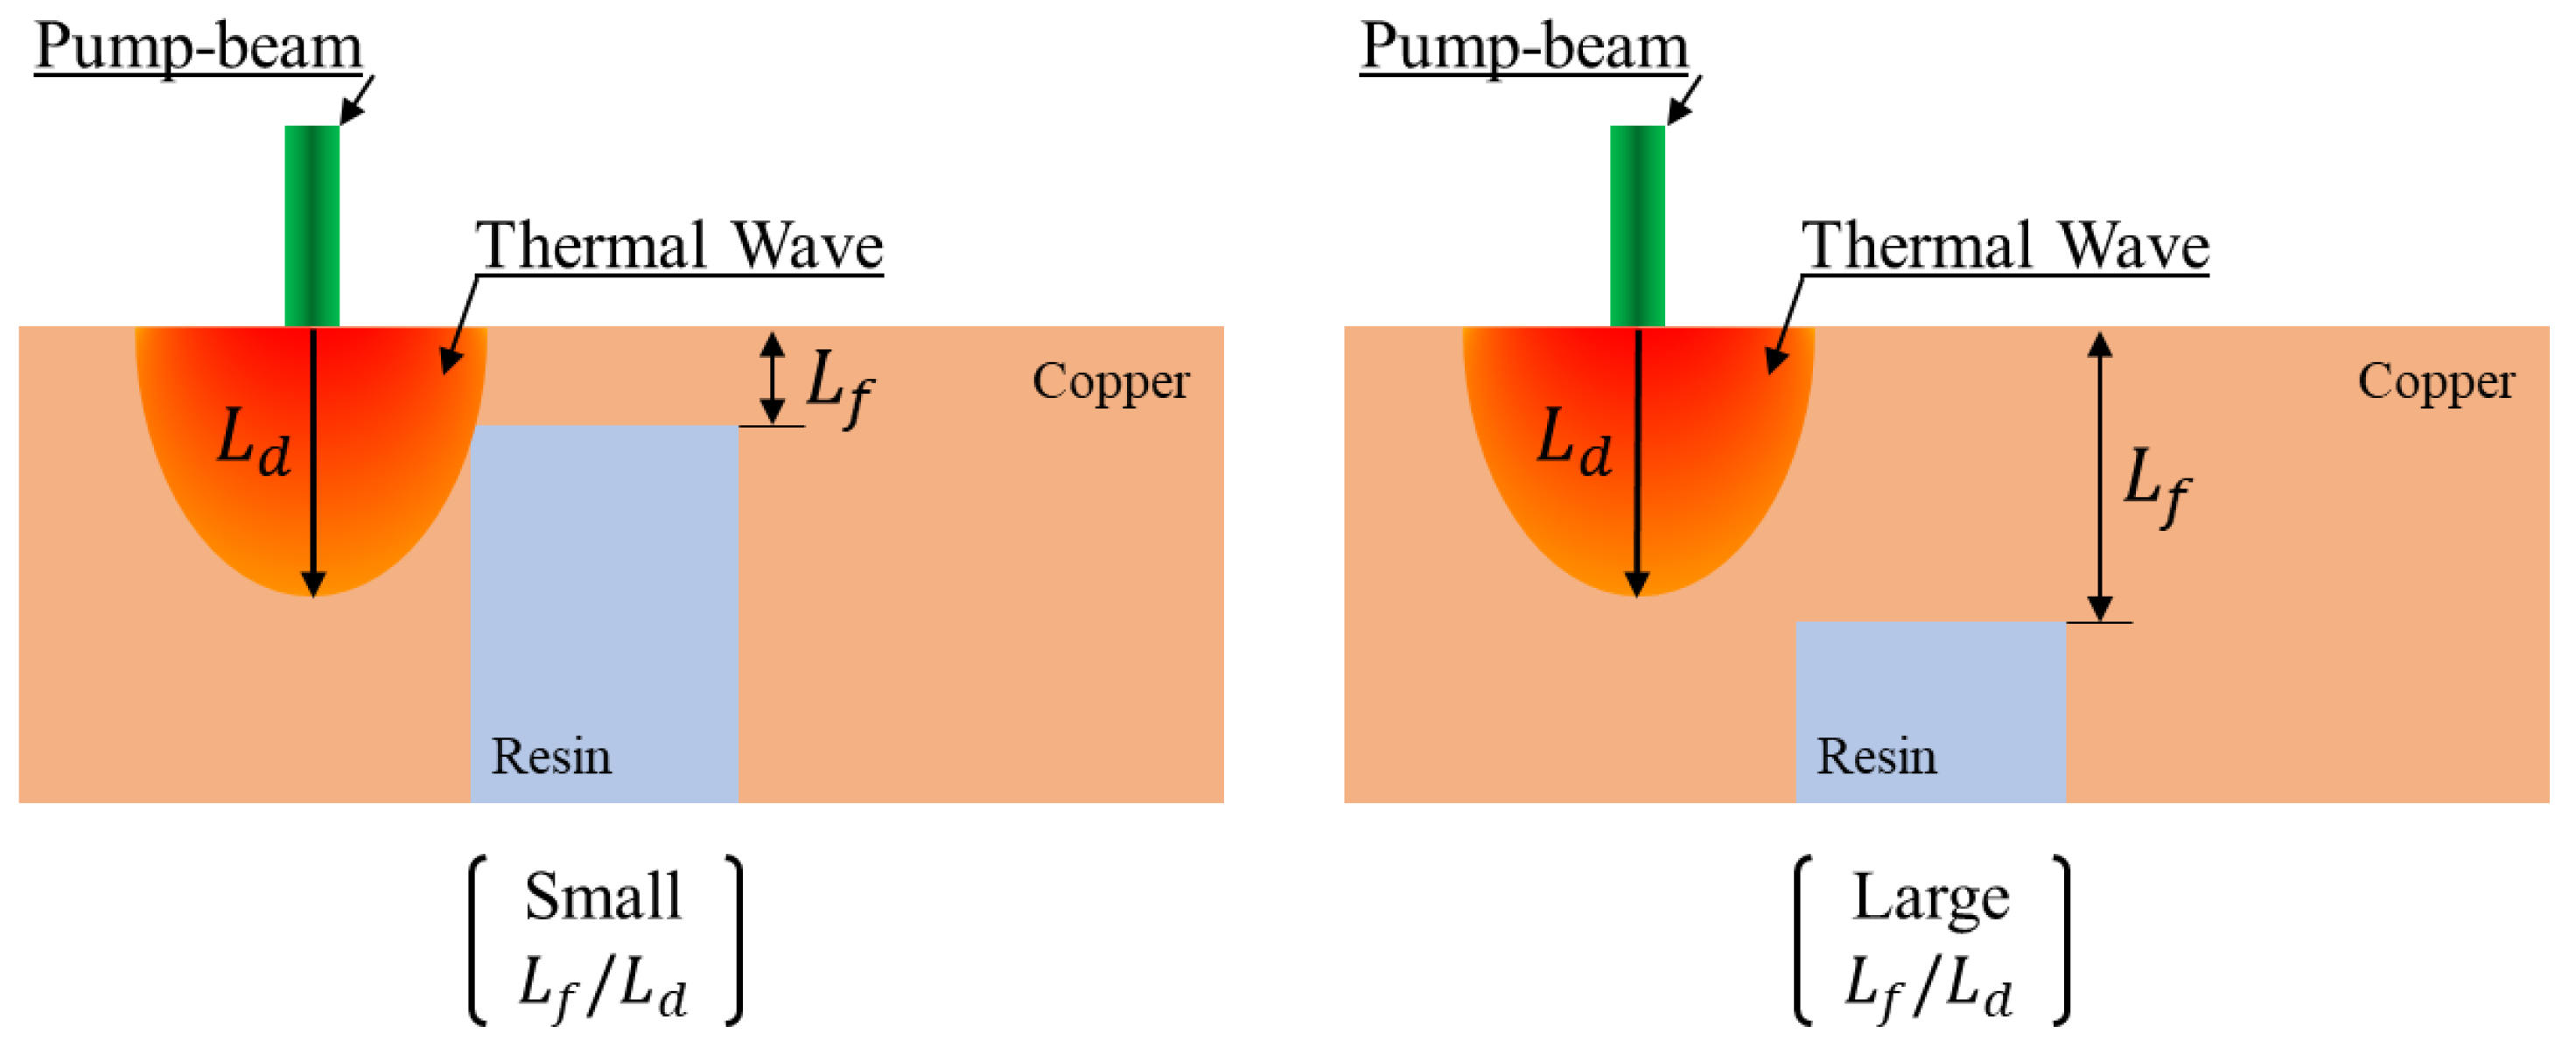
- The range of thermal waves that vary with has a significant effect on the spatial resolution and contrast of photothermal imaging. can be adjusted by the thermal diffusivity of the material to be measured and the modulation frequency of the pump beam as shown in Equation (3). Therefore, to increase the spatial resolution and contrast, it is advantageous for the photothermal imaging method to select , which is relatively short compared to .
- As the increases, however, the influence of the subsurface structure within the range of the thermal wave decreases. This means that the phase delay change may not reflect the subsurface structure. Therefore, the photothermal imaging method in large is not effective for the measurement.
- In conclusion, the image quality analysis of this paper is expected to provide a validation method for the results of photothermal imaging and effective measurement conditions for the photothermal imaging method.
Author Contributions
Funding
Conflicts of Interest
References
- Kim, M.; Yoo, J.; Kim, D.-K.; Kim, H. Development on the reconstruction of photothermal imaging method for subsurface structure. J. Vis. 2018, 22, 329–339. [Google Scholar] [CrossRef]
- Kim, M.; Kim, G.; Yoo, J.; Kim, D.-K.; Kim, H. Experimental study on the influence of surface roughness for photothermal imaging with various measurement conditions. Thermochim. Acta 2018, 661, 7–17. [Google Scholar] [CrossRef]
- Kim, M.; Yoo, J.; Kim, D.-K.; Kim, H. Numerical study on visualization method for material distribution using photothermal effect. J. Mech. Sci. Technol. 2015, 29, 4499–4507. [Google Scholar] [CrossRef]
- Murphy, J.C.; Aamodt, L.C. Optically detected photothermal imaging. Appl. Phys. Lett. 1981, 38, 196–198. [Google Scholar] [CrossRef]
- Murphy, J.C.; Spicer, J.W.M.; Aamodt, L.C.; Royce, B.S.H. Photoacoustic and photothermal phenomena II. In Proceedings of the 6th International Topical Meeting, Baltimore, MD, USA, 31 July–3 August 1989. [Google Scholar]
- Sell, J. Photothermal Investigations of Solids and Fluids; Elsevier: Amsterdam, The Netherlands, 2012. [Google Scholar]
- Jackson, W.B.; Amer, N.M.; Boccara, A.C.; Fournier, D. Photothermal deflection spectroscopy and detection. Appl. Opt. 1981, 20, 1333–1344. [Google Scholar] [CrossRef]
- Bertolotti, M.; Liakhou, G.; Li Voti, R.; Peng Wang, R.; Sibilia, C.; Yakovlev, V.P. Mirror temperature of a semiconductor diode laser studied with a photothermal deflection method. J. Appl. Phys. 1993, 74, 7054–7060. [Google Scholar] [CrossRef]
- Jeon, P.; Lee, E.; Lee, K.; Yoo, J. A theoretical study for the thermal diffusivity measurement using photothermal deflection scheme. Energy Eng. J. 2001, 10, 63–70. [Google Scholar]
- Salazar, A.; Sánchez-Lavega, A.; Fernandez, J. Thermal diffusivity measurements in solids by the ‘‘mirage’’technique: Experimental results. J. Appl. Phys. 1991, 69, 1216–1223. [Google Scholar] [CrossRef]
- Salazar, A.; Sánchez-Lavega, A.; Fernández, J. Thermal diffusivity measurements on solids using collinear mirage detection. J. Appl. Phys. 1993, 74, 1539–1547. [Google Scholar] [CrossRef]
- McDonald, F.A.; Wetsel, G.C., Jr.; Stotts, S.A. Scanned Photothermal Imaging of Subsurface Structure. In Acoustical Imaging; Springer: Berlin/Heidelberg, Germany, 1982; pp. 147–155. [Google Scholar]
- Friedrich, K.; Haupt, K.; Seidel, U.; Walther, H.G. Definition, resolution, and contrast in photothermal imaging. J. Appl. Phys. 1992, 72, 3759–3764. [Google Scholar] [CrossRef]
- McDonald, F.A.; Wetsel, G.C., Jr.; Jamieson, G.E. Spatial Resolution of Subsurface Structure in Photothermal Imaging. In Acoustical Imaging; Springer: Berlin/Heidelberg, Germany, 1985; pp. 377–385. [Google Scholar]
- Prince, J.L.; Links, J.M. Medical Imaging Signals and Systems; Pearson Prentice Hall: Upper Saddle River, NJ, USA, 2006. [Google Scholar]
- Martz, H.E.; Logan, C.M.; Schneberk, D.J.; Shull, P.J. X-ray Imaging: Fundamentals, Industrial Techniques and Applications; CRC Press: Boca Raton, FL, USA, 2016. [Google Scholar]
- Antoniou, A. Digital Signal Processing; McGraw-Hill: New York, NY, USA, 2016. [Google Scholar]
- Staude, A.; Goebbels, J. Determining the spatial resolution in computed tomography–comparison of MTF and line-pair structures. In Proceedings of the International Symposium on Digital Industrial Radiology and Computed Tomography, Ghent, Belgium, 22–25 June 2011; pp. 20–22. [Google Scholar]
- Hecht, E. Optics, 5th ed.; Pearson: London, UK, 2016. [Google Scholar]
- Park, S.K.; Schowengerdt, R.A.; Kaczynski, M.A. Modulation-transfer-function analysis for sampled image systems. Appl. Opt. 1984, 23, 2572. [Google Scholar] [CrossRef] [PubMed]
- 15708-1:2002. Non-Destructive Testing—Radiation Methods—Computed Tomography—Part 1: Principles; The International Organization for Standardization: Geneva, Switzerland, 2002. [Google Scholar]
- Dhawan, A.P. Medical Image Analysis; John Wiley & Sons: Hoboken, NJ, USA, 2011; Volume 31. [Google Scholar]
- Ross, R.B. Metallic Materials Specification Handbook; Springer Science & Business Media: Berlin/Heidelberg, Germany, 2013. [Google Scholar]
- Marín, E. Characteristic dimensions for heat transfer. Lat.-Am. J. Phys. Educ. 2010, 4, 56–60. [Google Scholar]
- Bergman, T.L.; Incropera, F.P.; DeWitt, D.P.; Lavine, A.S. Fundamentals of Heat and Mass Transfer; John Wiley & Sons: Hoboken, NJ, USA, 2011. [Google Scholar]


| Copper | Resin | Air | |
|---|---|---|---|
| Density () | 8930 | 1050 | 1.1614 |
| Thermal Conductivity () | 398 | 0.51 | 0.0263 |
| Specific Heat Capacity () | 385 | 500 | 1007 |
| Thermal Diffusivity () |
| 5 Hz | 20 Hz | 80 Hz | ||
|---|---|---|---|---|
| Thermal diffusion length, (mm) | 2.76 | 1.38 | 0.69 | - |
| Pump-beam radius, (mm) | 0.40 | 0.20 | 0.10 | 0.145 |
| First-layer thickness, (mm) | 2.00 | 1.00 | 0.50 | 0.725 |
| Relative position, (mm) | 1.20 | 0.60 | 0.30 | 0.435 |
| z-position of probe beam, (mm) | 0.60 | 0.30 | 0.15 | 0.218 |
| Pump beam frequency, (Hz) | 80 | 1 step |
| Thermal diffusion length, (mm) | 0.69 | 1 step |
| First layer thickness, (mm) | 0.125–1.00 | 5 steps (equal intervals) |
| Pump-beam radius, (µm) | 50–400 | 4 steps (equal intervals) |
| Relative position, (mm) | 0.3 | 1 step |
| z-position of probe beam, (mm) | 0.15 | 1 step |
| 0.181 | 0.362 | 0.725 | 1.087 | 1.449 | |
|---|---|---|---|---|---|
| Dimensionless resolution (mm/mm) | 2.549 | 2.191 | 1.881 | 1.775 | 0.903 |
| Dimensionless contrast (mm/mm) | 0.155 | 0.180 | 0.206 | 0.223 | 0.433 |
| 0.181 | 0.362 | 0.725 | 1.087 | 1.449 | ||
|---|---|---|---|---|---|---|
| Dimensionless resolution (mm/mm) | 0.072 | 2.557 | 2.196 | 2.050 | 1.804 | 0.756 |
| 0.145 | 2.549 | 2.191 | 1.881 | 1.775 | 0.903 | |
| 0.290 | 2.555 | 2.188 | 2.027 | 1.812 | 0.840 | |
| 0.580 | 2.561 | 2.193 | 2.167 | 1.768 | 1.091 | |
| Dimensionless contrast (mm/mm) | 0.072 | 0.153 | 0.177 | 0.191 | 0.217 | 0.568 |
| 0.145 | 0.155 | 0.180 | 0.206 | 0.223 | 0.433 | |
| 0.290 | 0.153 | 0.177 | 0.193 | 0.212 | 0.459 | |
| 0.580 | 0.153 | 0.177 | 0.181 | 0.223 | 0.373 | |
| 0.362 | 0.725 | 1.449 | ||
|---|---|---|---|---|
| Dimensionless resolution (mm/mm) | 0.150 | 2.344 | 1.743 | none |
| 7% | 8% | - | ||
| Dimensionless contrast (mm/mm) | 0.150 | 0.187 | 0.204 | none |
| 4% | 1% | - | ||
© 2019 by the authors. Licensee MDPI, Basel, Switzerland. This article is an open access article distributed under the terms and conditions of the Creative Commons Attribution (CC BY) license (http://creativecommons.org/licenses/by/4.0/).
Share and Cite
Kim, M.; Yoo, J.; Kim, D.-K.; Kim, H. Measurement of Contrast and Spatial Resolution for the Photothermal Imaging Method. Appl. Sci. 2019, 9, 1996. https://doi.org/10.3390/app9101996
Kim M, Yoo J, Kim D-K, Kim H. Measurement of Contrast and Spatial Resolution for the Photothermal Imaging Method. Applied Sciences. 2019; 9(10):1996. https://doi.org/10.3390/app9101996
Chicago/Turabian StyleKim, Moojoong, Jaisuk Yoo, Dong-Kwon Kim, and Hyunjung Kim. 2019. "Measurement of Contrast and Spatial Resolution for the Photothermal Imaging Method" Applied Sciences 9, no. 10: 1996. https://doi.org/10.3390/app9101996
APA StyleKim, M., Yoo, J., Kim, D.-K., & Kim, H. (2019). Measurement of Contrast and Spatial Resolution for the Photothermal Imaging Method. Applied Sciences, 9(10), 1996. https://doi.org/10.3390/app9101996