You are currently viewing a new version of our website. To view the old version click .
Applied Sciences
  • Article
  • Open Access

18 September 2018

Data Analysis and Forecasting of Tuberculosis Prevalence Rates for Smart Healthcare Based on a Novel Combination Model

,
and
1
Faculty of Information Technology, Macau University of Science and Technology, Macau 999078, China
2
School of information Science & Engineering, Lanzhou University, Lanzhou 730000, China
3
College of Atmospheric Sciences, Key Laboratory of Arid Climatic Change and Reducing Disaster of Gansu Province, Lanzhou University, Lanzhou 730000, China
*
Author to whom correspondence should be addressed.
This article belongs to the Special Issue Data Analytics in Smart Healthcare

Abstract

In recent years, healthcare has attracted much attention, which is looking for more and more data analytics in healthcare to relieve medical problems in medical staff shortage, ageing population, people living alone, and quality of life. Data mining, analysis, and forecasting play a vital role in modern social and medical fields. However, how to select a proper model to mine and analyze the relevant medical information in the data is not only an extremely challenging problem, but also a concerning problem. Tuberculosis remains a major global health problem despite recent and continued progress in prevention and treatment. There is no doubt that the effective analysis and accurate forecasting of global tuberculosis prevalence rates lay a solid foundation for the construction of an epidemic disease warning and monitoring system from a global perspective. In this paper, the tuberculosis prevalence rate time series for four World Bank income groups are targeted. Kruskal–Wallis analysis of variance and multiple comparison tests are conducted to determine whether the differences of tuberculosis prevalence rates for different income groups are statistically significant or not, and a novel combined forecasting model with its weights optimized by a recently developed artificial intelligence algorithm—cuckoo search—is proposed to forecast the hierarchical tuberculosis prevalence rates from 2013 to 2016. Numerical results show that the developed combination model is not only simple, but is also able to satisfactorily approximate the actual tuberculosis prevalence rate, and can be an effective tool in mining and analyzing big data in the medical field.

1. Introduction

Currently, the world faces a considerable health burden related to tuberculosis (TB), which is an infectious bacterial disease caused by Mycobacterium tuberculosis, typically exerting adverse effects not only on the lungs, but also on other bodily organs. TB is transmitted from person to person via small droplets of sputum and saliva expelled when an infectious patient coughs or sneezes [1]. Declared a major worldwide health problem by the World Health Organization (WHO), TB induces ill-health among millions of people each year, and ranks as the second leading cause of death from infectious disease after human immunodeficiency virus (HIV) [2]. Nonetheless, TB is the most prevalent airborne infectious cause of death, inducing approximately three million deaths each year, principally among young adults in the globally poorest nations [3,4,5,6,7,8,9].
Smart cities have been paid attention, and its status consolidates as one of the fanciest areas of research today. Hence, [10] makes a case for a cautious rethink of the very rationale and relevance of the debate, and in the paper [11], the origins of what is termed normative bias in smart cities research are identified and a case is made for a holistic, scalable, and human-centered smart cities research agenda. Smart healthcare applications are one part of a smart city, which involve domain and data understanding for physician- and patient-centric healthcare, data preprocessing, and modeling using natural language processing and (big) data analytic techniques, and model evaluation and knowledge deployment through information infrastructures [12].
TB is often associated with behavioral factors and demographics, including occupation, age, tobacco and alcohol consumption, poor nutrition, and household crowding [13,14,15,16,17,18]. Recently, WHO has begun to promote efforts to address social determinants as an important component of global tuberculosis control [19]. Recently, the improvement of medical conditions [20], the improvement of optimal control strategy [21], classification algorithm, and signal processing algorithm [22,23], have been widely used in the medical field, meanwhile, big data and data analysis techniques are applied to disease diagnosis [24], such that the accuracy of diagnosis results has been significantly improved, and have contributed to preventing the incidence of tuberculosis diseases. Much of the epidemiological TB literature relies on notified cases, and relatively few involve measurements and trend predictions of TB prevalence [25]. However, the approaches related to the prediction of TB prevalence rates are less than ideal, and these possible tools deserve further exploration. Accurate tuberculosis prevalence rate forecasting is of vital importance to global tuberculosis prevention and control. Advances made in predicting tuberculosis events may be used to anticipate high and low risk years or future tuberculosis epidemics. In recent-year forecasts, future disease trends or comparisons of competing disease control policies commonly estimate results using dynamic transmission models, which represent the mechanisms of transmission, natural history, and health system interactions that generate tuberculosis outcomes. The studies shown in Table 1 described standard tuberculosis modeling approaches and examined specific modeling approaches. However, little systematic investigation has been done on the assumptions made by published tuberculosis models. If these assumptions are not valid, the results of these studies could be biased [26].
Table 1. The different forecasting approaches of tuberculosis (TB).
According to the above discussion, this paper seeks to use a combined model to estimate and forecast the prevalence of TB. We mainly focus on hierarchical tuberculosis prevalence rate data according to four World Bank income groups. The association between tuberculosis prevalence rates and income levels is examined by means of nonparametric analysis of variance (ANOVA). In addition, nonlinear regression analysis is first applied to hierarchically forecast tuberculosis prevalence rates; then, a combination forecasting strategy, whose weights are further optimized by the cuckoo search algorithm, based on machine learning, is proposed. Cuckoo search-based combined models are constructed in this paper to improve forecasting accuracy as much as possible and, thus, provide meaningful evidence and information about the potential trends and future evaluation of the burden of tuberculosis, i.e., incidence, prevalence, and mortality. In conclusion, the major distinction of this study is that hierarchical tuberculosis prevalence rates are innovatively analyzed and forecasted. Furthermore, an innovative combination forecasting model based on regression analysis and an artificial intelligence optimization method is proposed.
In the future, big data and data analysis technology will be widely used in disease surveillance, decision-making, health management, and other fields, which is the focus of current intelligent medical care. In this paper, data analysis is used to analyze and forecast the tuberculosis prevalence rates. Through repeated analysis of tuberculosis data, combined with the data of tuberculosis prevalence rates and professional literature, a hybrid combined forecasting model is proposed, verified repeatedly and, finally, the CS-combined model is used to forecasting the trend of prevalence rates of intelligent medical products.
The remainder of this paper is organized as follows: Section 2 introduces related methodologies, including the Kruskal–Wallis test, regression analysis, combination forecasting strategy, and the cuckoo search algorithm. In Section 3, we present numerical examples and forecasting results. Section 4 reports the related conclusions of this study.

3. The Model Processing and Analysis Forecasting Result

Original yearly records of tuberculosis prevalence rate are measured and published by the World Health Organization [43], which is our main data resource. In this section, the tuberculosis prevalence rates from four different income groups are used to estimate the performance of the proposed novel combined model. The proposed novel combined model is compared with other forecasting models, namely, Poly, Sin, Reci-Poly, Reci-Exp, Power2-Poly2, and Power2-Exp2.

3.1. The Data Description and the Forecasting Modeling for Each Income Group

Considering that tuberculosis prevalence rates are associated with income groups, we seek to make full use of the hierarchical tuberculosis prevalence rates. Thus, for each income group, we construct six different types of regression models with good adjusted R-square values. The tuberculosis prevalence rates from 2000 to 2012 are used for model construction and coefficient estimation. Linear and nonlinear regression models, such as the quadratic polynomial model, the two-term exponential model, the sum-of-sines model, and the Gaussian model, are repeatedly used for the different income groups. It is worth noting that the adjusted R-square value is regarded as the appropriate metric to evaluate the model’s goodness-of-fit. That is to say, we prefer to select regression models with adjusted R-square values as large as possible. Tuberculosis prevalence rates from 2013 to 2016 are forecasted for each income group, respectively.
In addition, for each income group, a total of six individual regression models are combined to forecast tuberculosis prevalence rates from 2013 to 2016, and the weights of the combination forecasting model are optimized by the cuckoo search algorithm. Below, the results of the individual and combination forecasting models are presented in great detail.
(1)
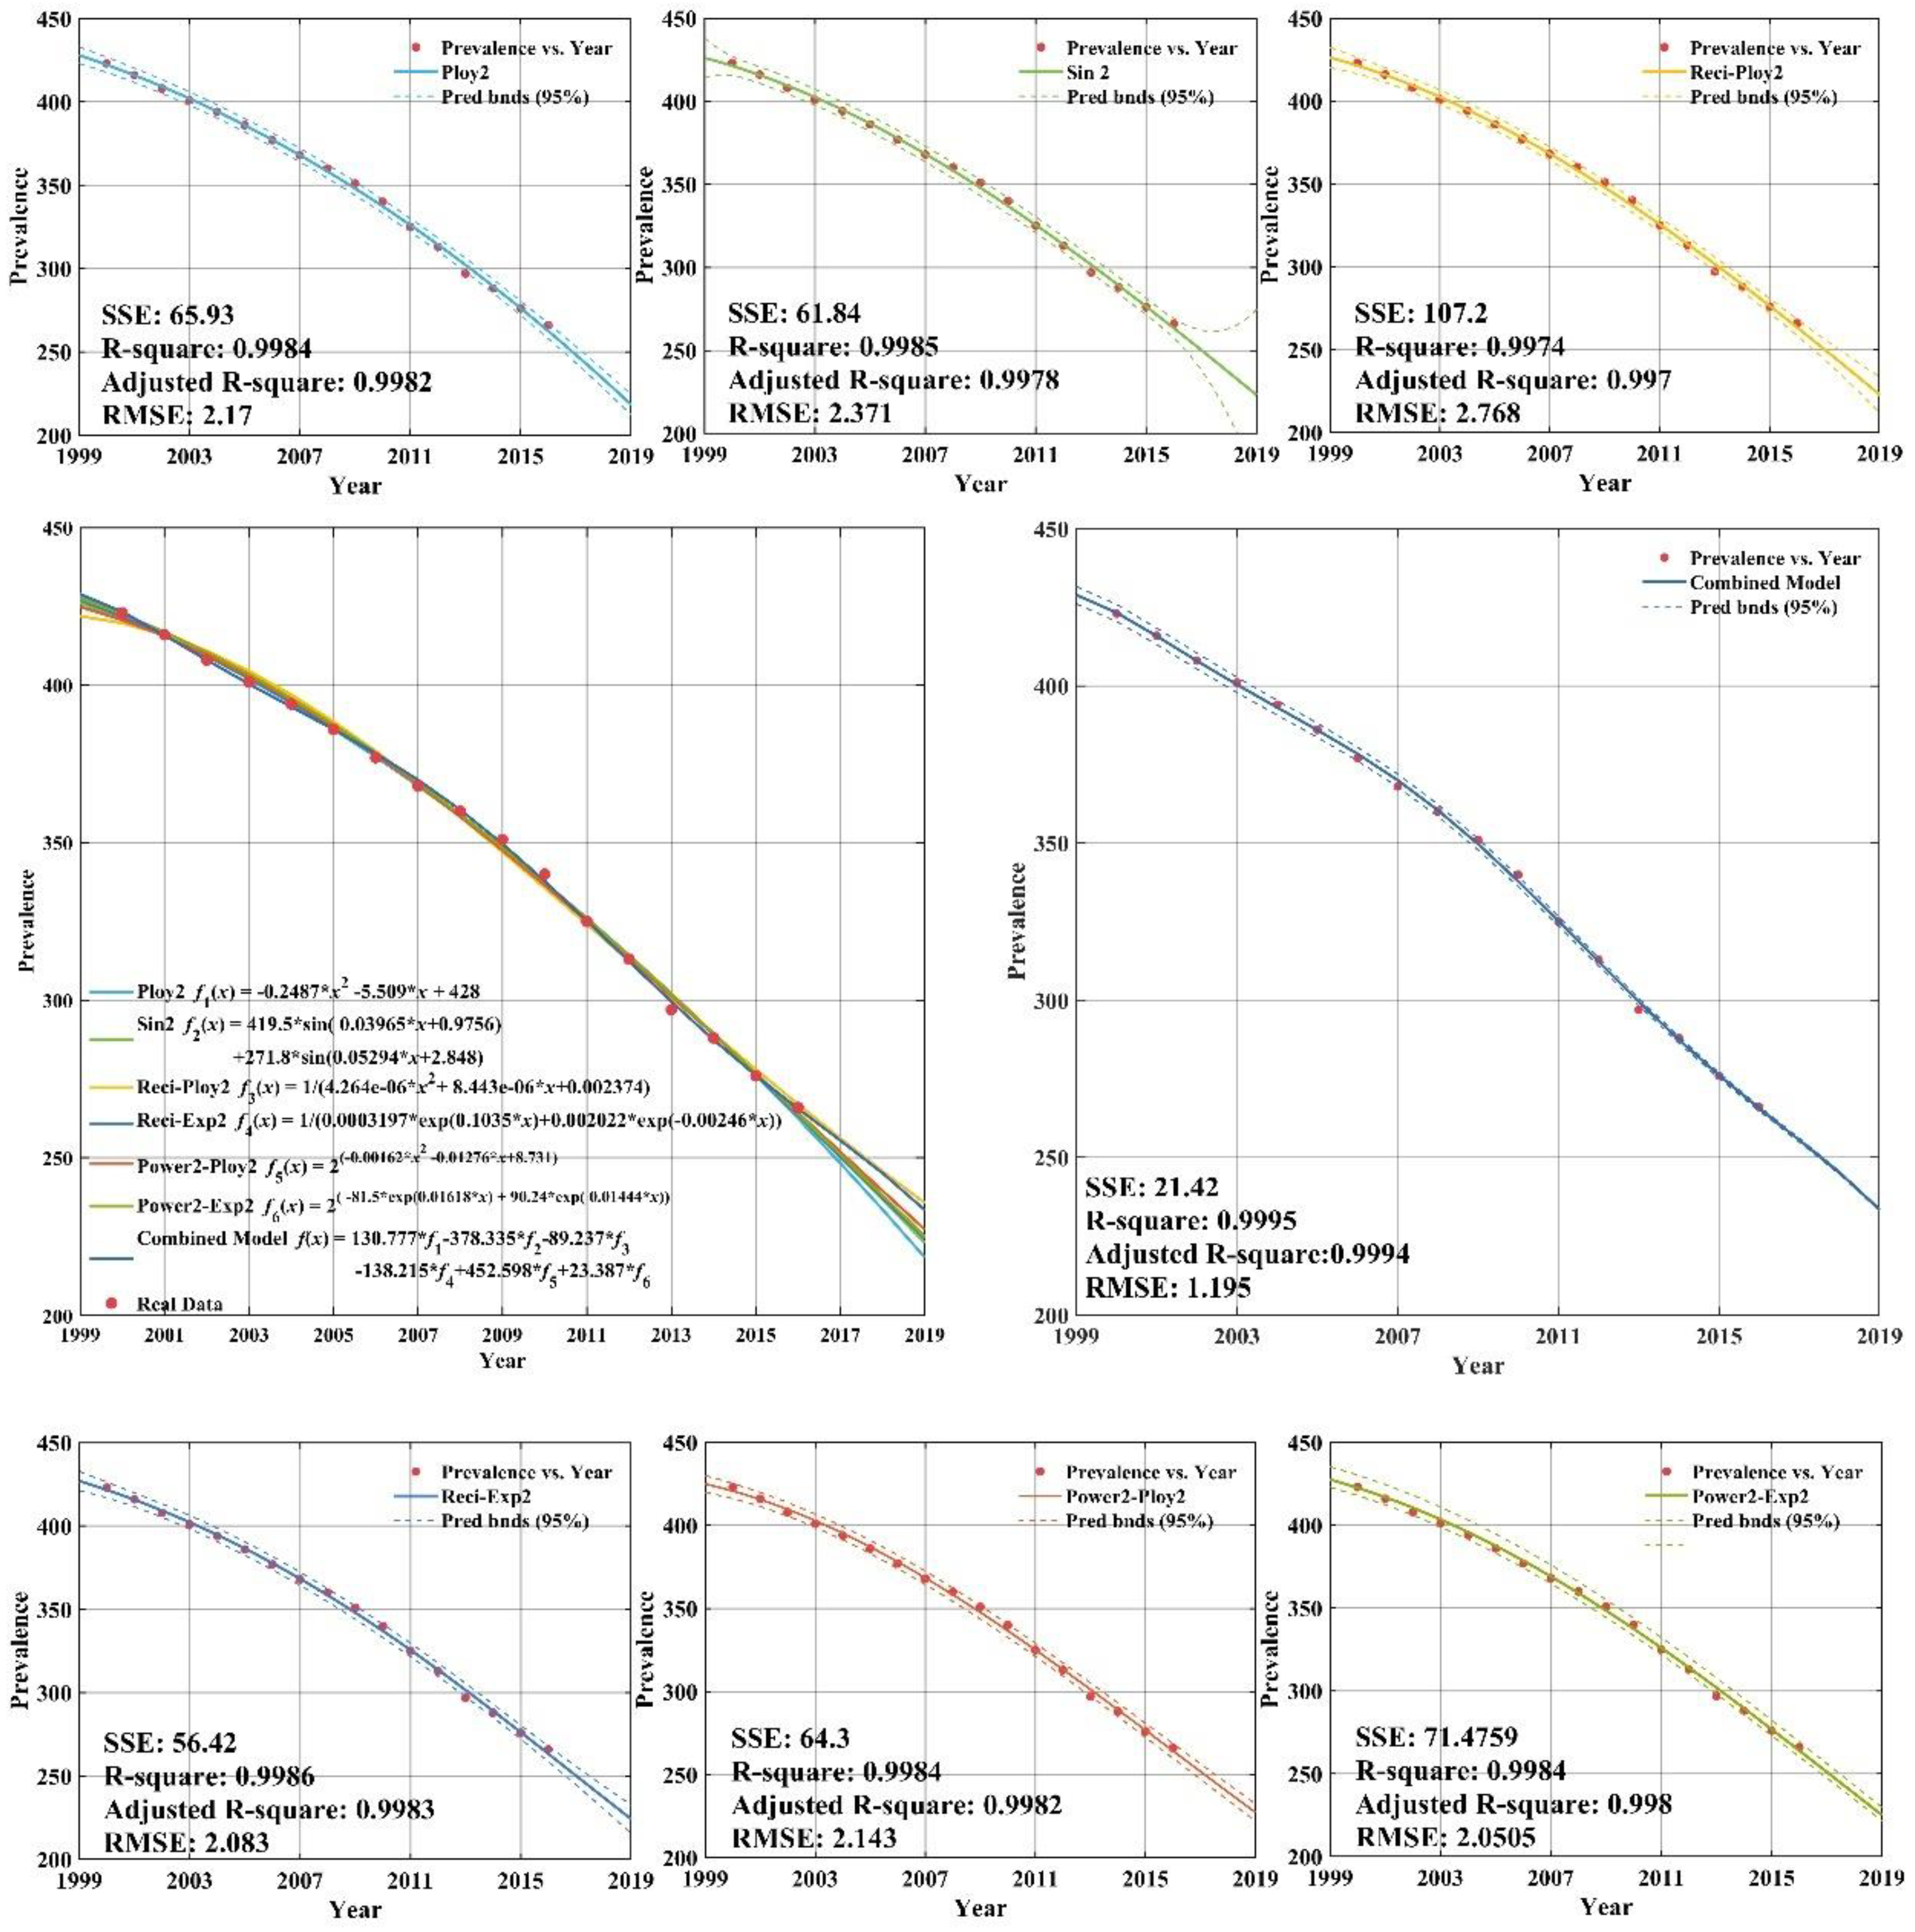
With respect to tuberculosis prevalence rates for the high income group, we first construct two regression models based on the original dataset using the quadratic polynomial model (Poly2) as well as the sum-of-two-sines model (Sin2). In addition, the original tuberculosis prevalence rates are transformed by taking reciprocals and then the quadratic polynomial model (Reci-Poly2) and the two-term exponential model (Reci-Exp2) are applied to characterize the data using a global fit. Finally, the original time series is transformed by taking base-2 logarithms and then the quadratic polynomial model (Power2-Poly2), as well as the one-term Gaussian model (Power2-Gauss1), are built.
(2)
In regard to tuberculosis prevalence rates for upper-middle income group, the seven types of forecasting models are the quadratic polynomial model (Poly2), the single sine model (Sin1), the reciprocal transformation plus quadratic polynomial model (Reci-Poly2) or the two-term exponential model (Reci-Exp2), the base-2 logarithm transformation with the quadratic polynomial model (Power2-Poly2), or the two-term exponential model (Power2-Exp2), and the combination model (CS-Combined).
(3)
Taking the tuberculosis prevalence rates for the lower-middle income group into account, the quadratic polynomial model (Poly2), the single sine model (Sin1), reciprocal transformation plus the quadratic polynomial model (Reci-Poly2), or the two-term exponential model (Reci-Exp2), the base-2 logarithm transformation with the quadratic polynomial model (Power2-Poly2), or the two-term exponential model (Power2-Exp2), as well as the combination model (CS-Combined) sequentially comprise a total of seven types of forecasting models.
(4)
With regard to the tuberculosis prevalence rates for the low income group, as described above, the cubic polynomial model (Poly2), the single sine model (Sin1), the reciprocal transformation plus the quadratic polynomial model (Reci-Poly2), or the two-term exponential model (Reci-Exp2), the base-2 logarithm transformation with the quadratic polynomial model (Power2-Poly2), or the two-term exponential model (Power2-Exp2), as well as the combination model (CS-Combined), are constructed sequentially.

3.2. Analysis of the Modeling Result for Tuberculosis Prevalence Rate in Each Income Group

According to the above analysis, in this part, we further analyze the tuberculosis prevalence rate forecasting results of four different income groups. Note that the corresponding inverse transformations are implemented to obtain final forecasting values. The coefficients of each regression model are estimated by the least-squares method, and the adjusted R-square (A-R2) of each regression model is calculated. Finally, the combination model is formed based on the six individual regression models, whose weights are optimized by the cuckoo search algorithm, which is denoted as “CS-Combined”. The reason why the aforementioned six regression models are chosen in our combined approach, is that these models have higher adjusted R-square values than other competing models. Appendix C plots the fit curves of all seven types of forecasting models while including details of the regression equations and adjusted R-squares.
Combined models which integrate the results of six individual regression models are often utilized in the forecasting field. In order to obtain the optimal weight coefficients of the individual models, a novel deciding weight method based on the cuckoo search is developed to determine the optimal combination weights. The optimization is as follows.
According to the cuckoo’s process of hatching bird eggs, the CS algorithm is described as follows:
Step 1 Defines the objective function y ^ = ω 1 y 1 + ω 2 y 2 + + ω 6 y 6 , initializes the function, and randomly generates the initial position of n nests ω = [ ω 1 i , ω 2 i , , ω 6 i ] (i = 1, 2, …, n) to set parameters such as population size, problem dimension, maximum discovery probability P, and maximum iterative times;
Step 2 Chooses the fitness function and calculates the objective function value of each bird’s nest position, and obtains the current optimal function value;
Step 3 Records the optimal function value of the previous generation, and uses the formula (5.10) to update the position and state of the other nests;
Step 4 The existing position function value is compared with the previous generation optimal function value and, if it is better, the current optimal value is changed;
Step 5 After the location update, compare the random number γ [ 0 , 1 ] with P. If γ > P , randomly change x i ( t + 1 ) , otherwise, it will not change. Finally, keep the best of a group of nest positions y i ( t + 1 ) ;
Step 6 If the maximum number of iterations or the minimum error requirement is not reached, return to step 2, otherwise, continue to the next step;
Step 7 Output the global optimal combination weight.
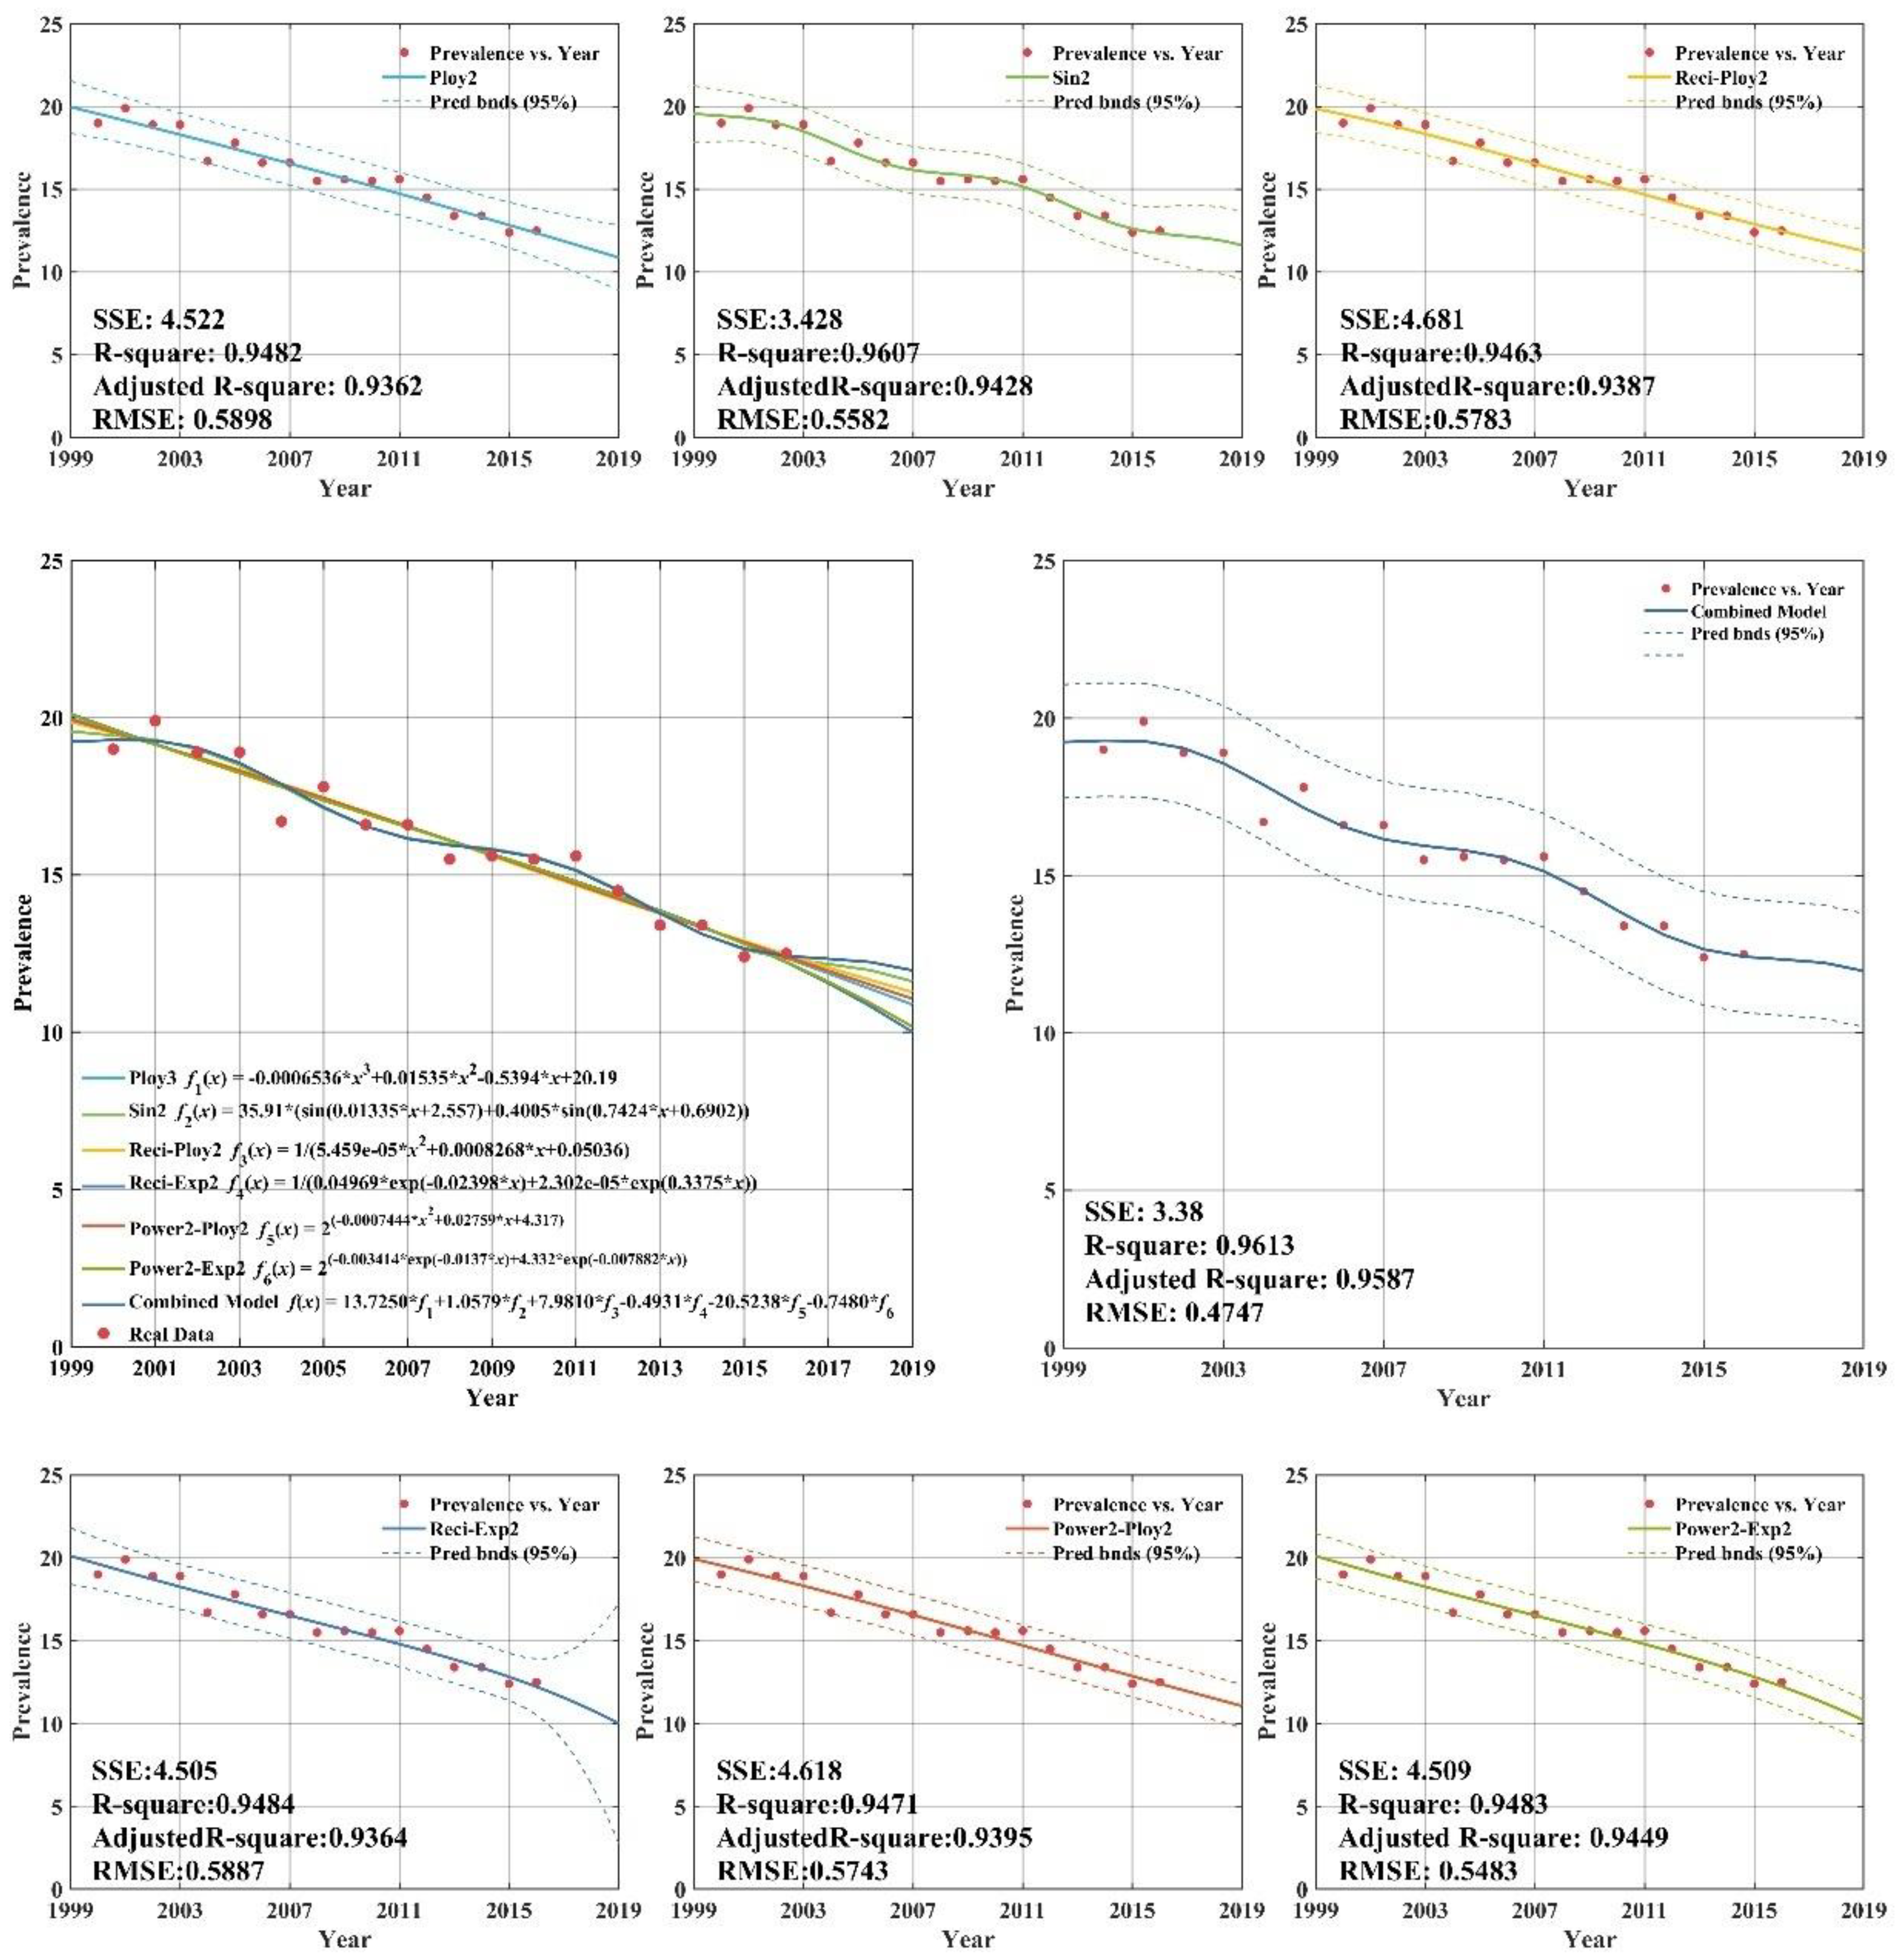
As demonstrated in Appendix C (Figure A1), all six individual regression models provide remarkable goodness-of-fit, with adjusted R-squares all above 0.93. Thus, the selection of regression models is proper and effective. From Appendix C (Figure A1), there are clearly significant improvements for combined model forecasts compared with the results of other forecasting models for high income group. The annual high income group tuberculosis prevalence rate from 2013 to 2016 years was forecasted by CS-combined model. The forecasting results show that the SSE (sum square error), RMSE (root mean square error) are 3.38 and 0.9587, respectively. The forecasting values are close to the actual value. It is indicated that the CS-combined model has better forecasting performance, which has high popularization and application in forecasting the tuberculosis prevalence rate. It can provide a reference basis for the prevention and control measures of TB in the world.
Appendix C (Figure A2) plots the fitting and forecasting curves and presents related regression equations and goodness-of-fit for the upper-middle income group. From Appendix C (Figure A2), it can be concluded that the estimated fitting equations are able to fit the dataset quite well; the adjusted R-squares of the six regression models all being above 0.99. Appendix C (Figure A2) demonstrated that the sum square error, root mean square error, R-square, and adj R-square of the CS-combined forecasting model established by the upper-middle income group tuberculosis prevalence rate from 2000 to 2012 were 5.35, 0.5972, 0.9968, and 0.9966, respectively. This indicates that the forecasting efficiency of the combined model is better than the other model, which can achieve higher forecasting requirements and be used for extrapolation forecasting. The forecasting can help provide reference for the formulation of tuberculosis prevalence rate control measures in upper-middle income group.
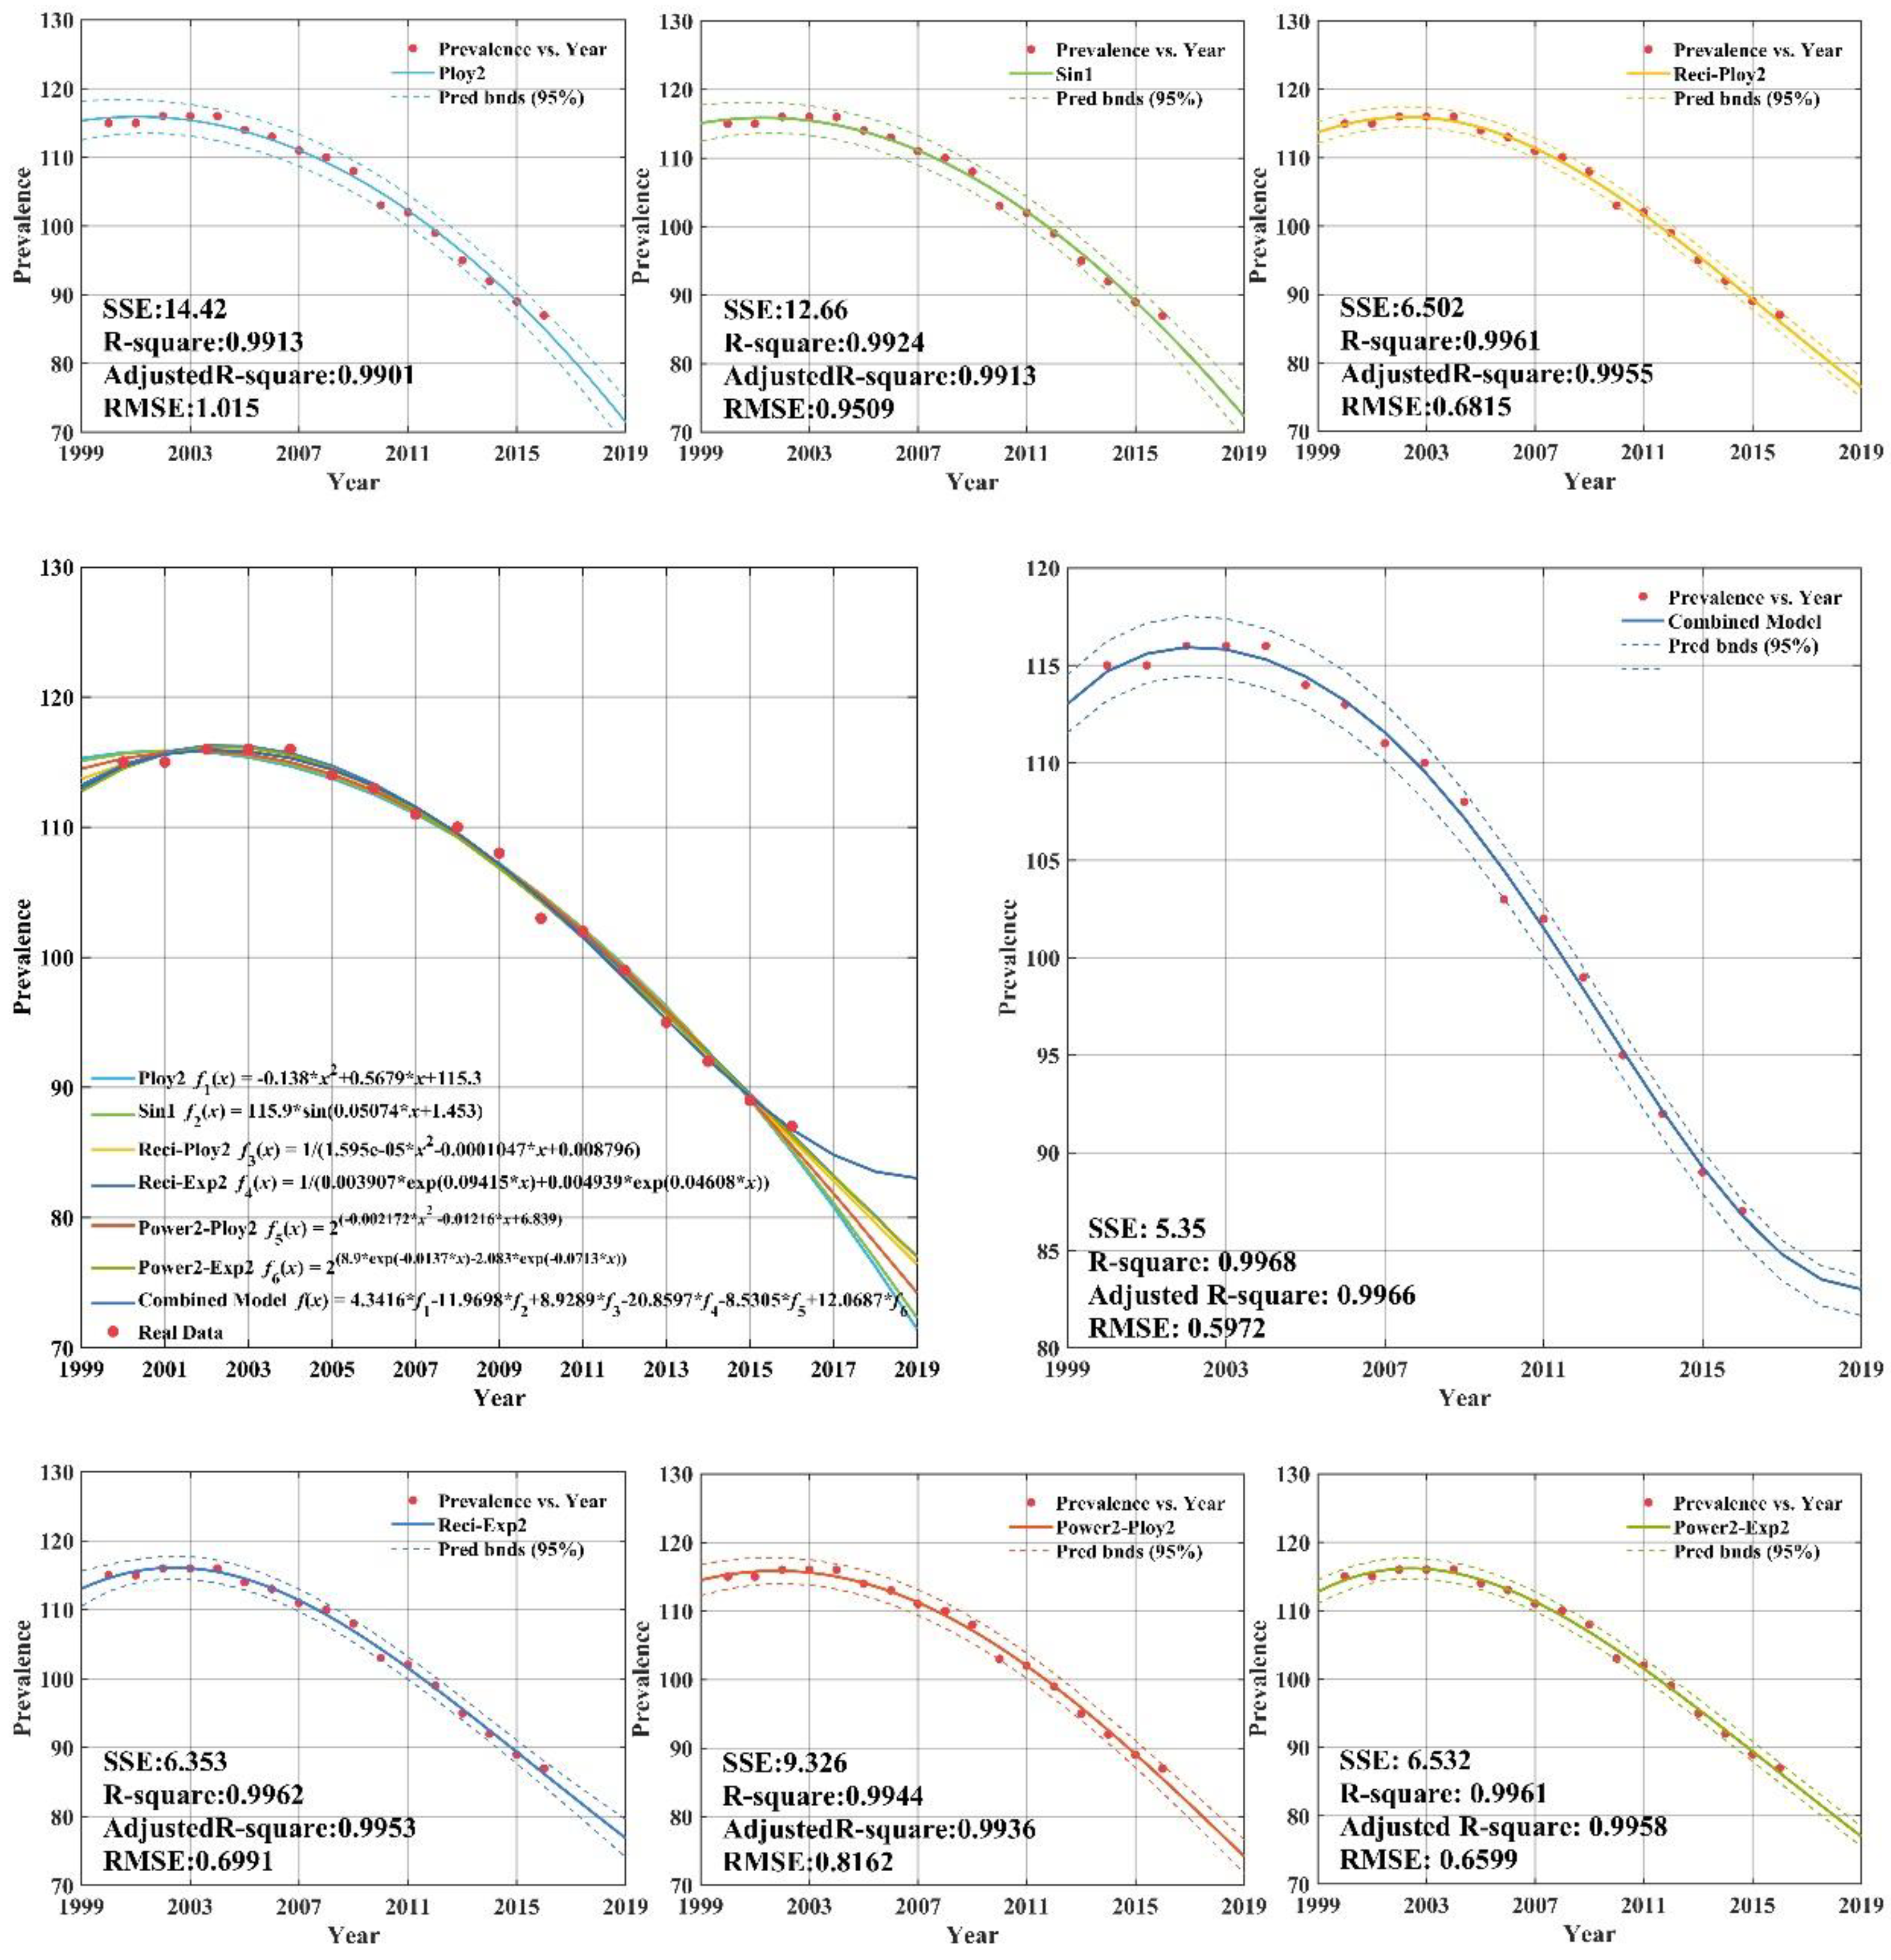
The related fitting and forecasting curves for the lower-middle income group are drawn in Appendix C (Figure A3), which demonstrates that all six regression models fit the dataset very well, with adjusted R-square values greater than 0.99. As indicated in Appendix C (Figure A3), the forecasting results of tuberculosis prevalence rate for lower-middle income group from 2013 to 2016 was 258.3/100,000; 252.6/100,000; 246.9/100,000; and 241.2/100,000, showing a downward trend year by year. The forecasting results of CS-combined showed that sum square error is 1.957, and root mean square error is 0.6651. The CS-combined model fitting accuracy criteria (R-square) indicated that the fitting accuracy of CS-combined model is 0.9998, and the fitting curve almost coincides with the actual tuberculosis prevalence rate curve. The fitting effect is better than the other models and can be used for forecasting the lower-middle income group tuberculosis prevalence rate.
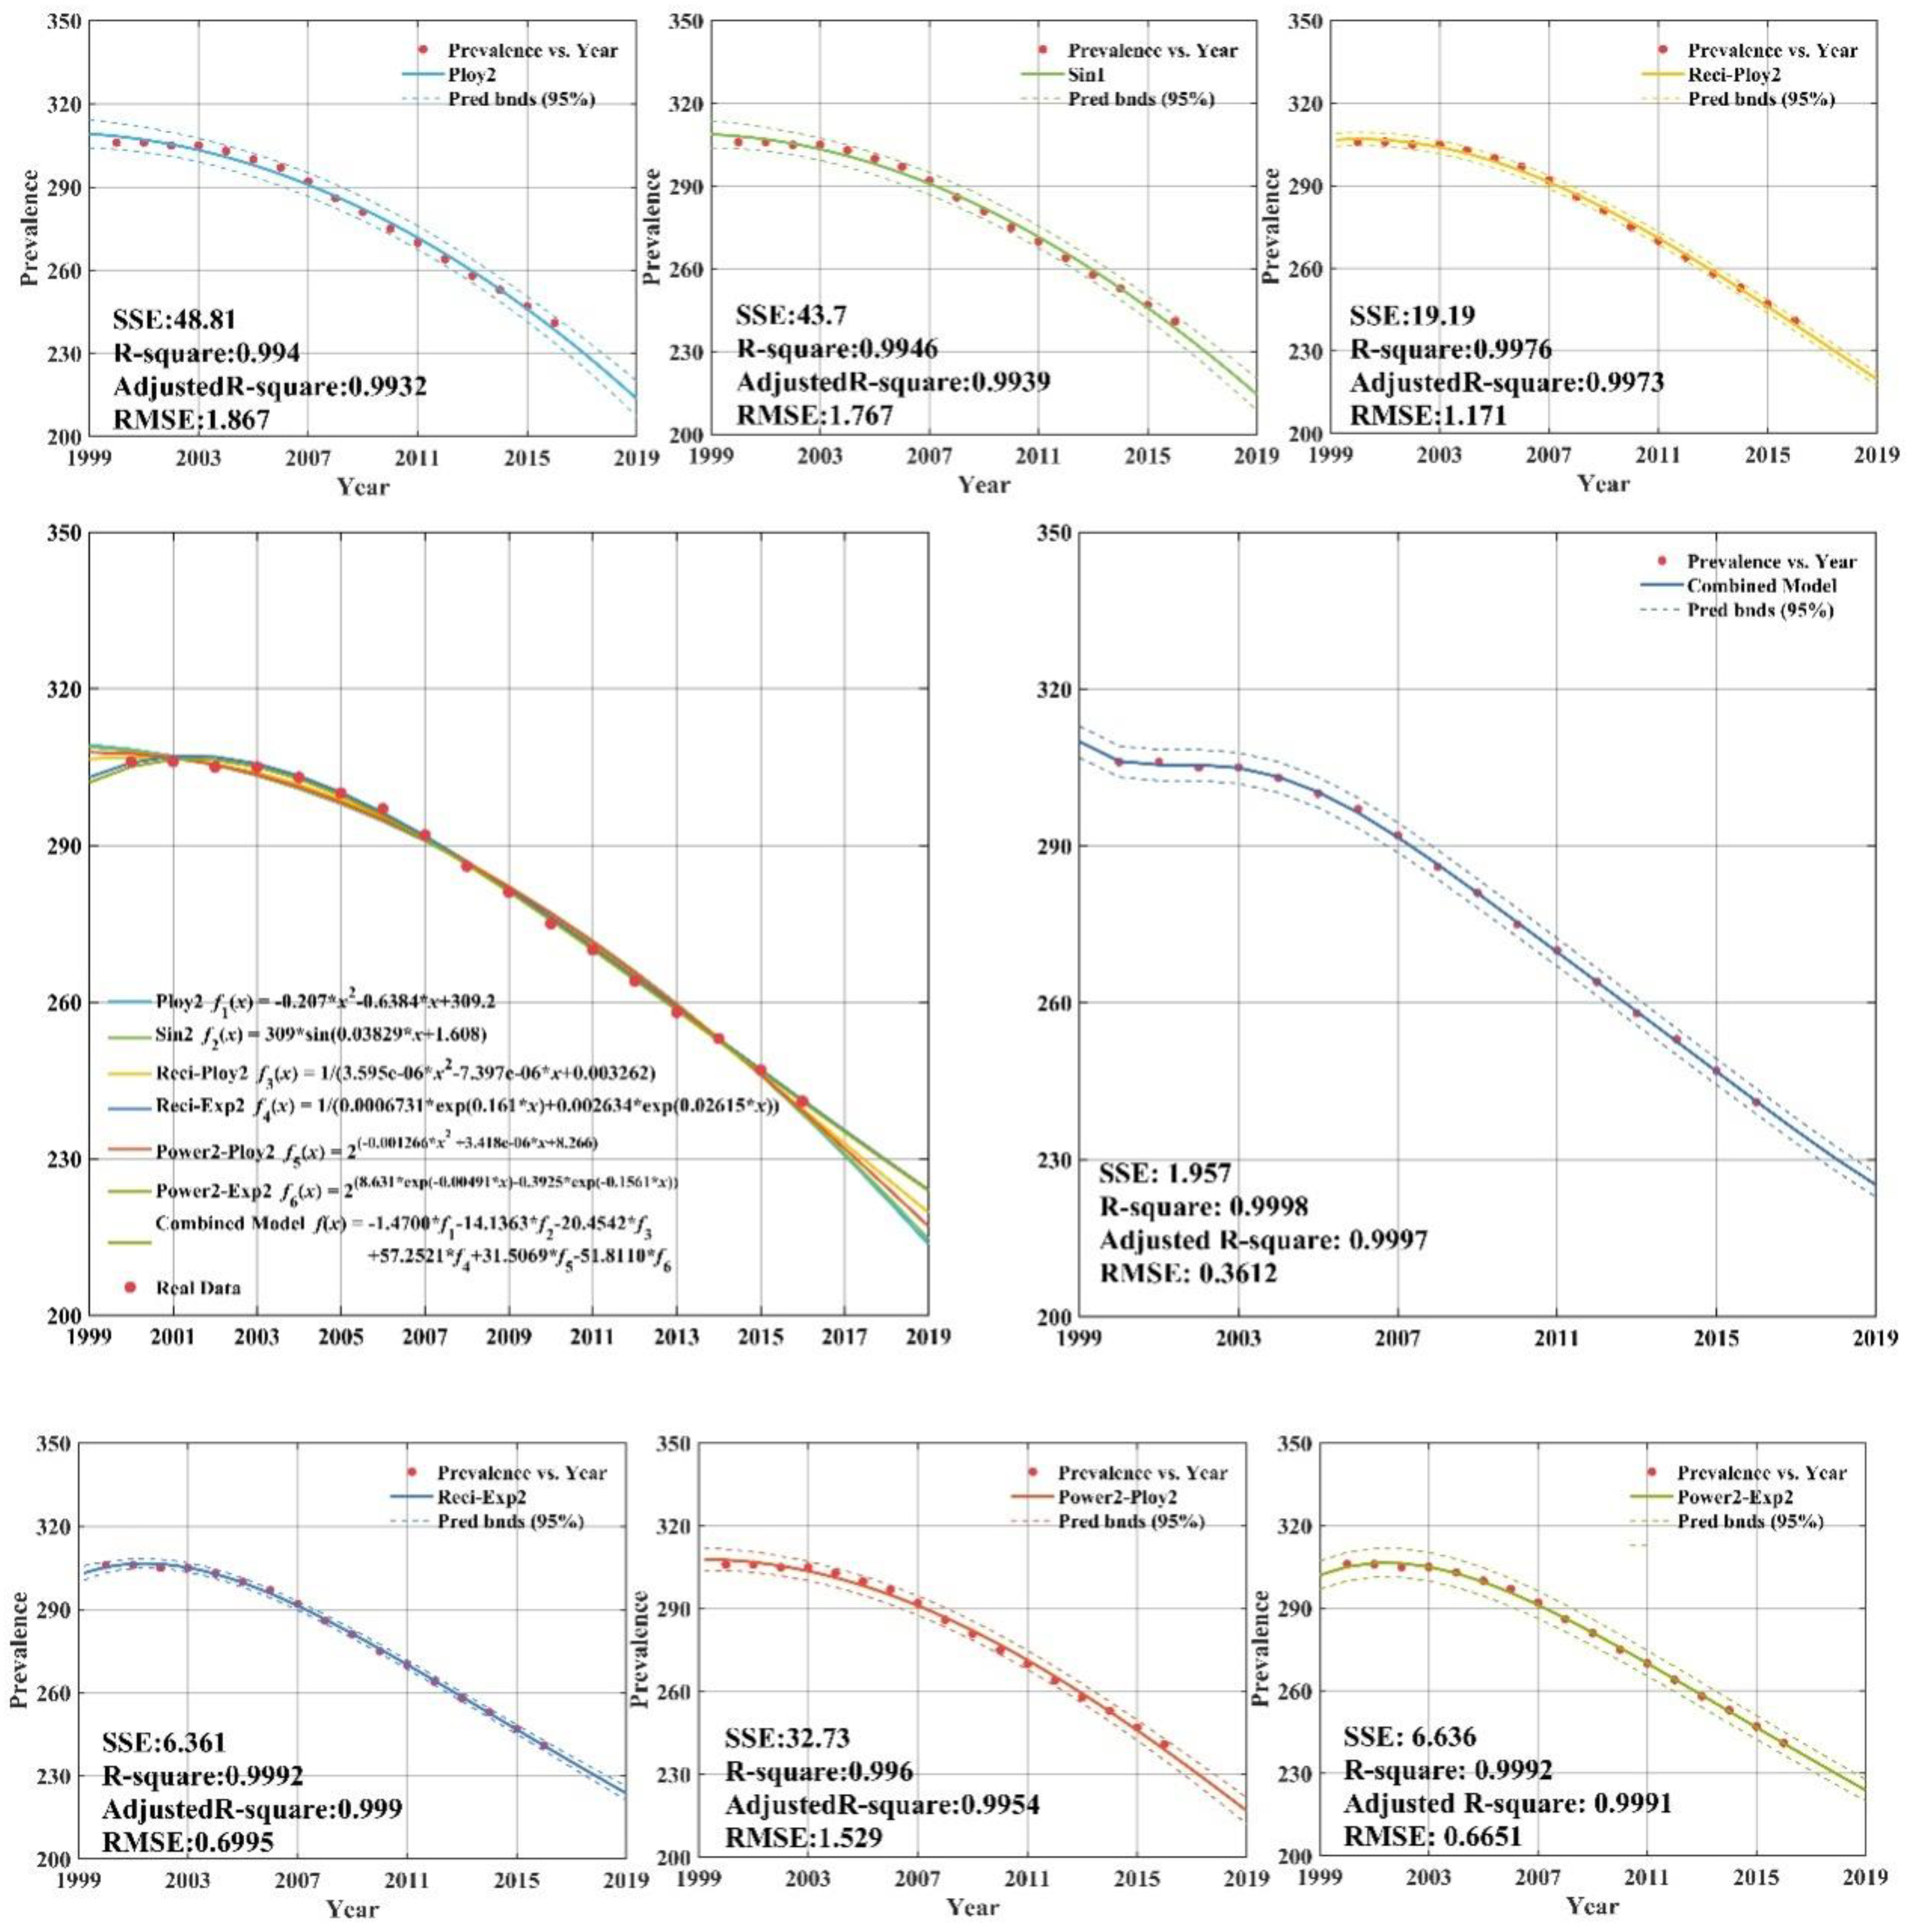
The low income group with fitting and forecasting curves is plotted in Appendix C (Figure A4). According to Appendix C (Figure A4), the individual regression models all have remarkable goodness-of-fit with adjusted R-square values greater than 0.99. Appendix C (Figure A4) shows that the CS-combined model is used to fit tuberculosis prevalence rate time series for low income group during 2000–2012. The data of tuberculosis prevalence rate from 2013 to 2016 are forecasted by CS-combined model. The fitting value and forecasting value of the CS-combined model for 2000–2016 are basically the same as the actual tuberculosis prevalence rate, which is very similar to the actual value, and shows that the fitting and forecasting results are better than individual regression models.

3.3. Forecasting Results of Individual and Combined Models

In this section, forecasting results of both individual and combined methods are presented. The real values and forecasting values for the four different income groups from 2013 to 2016, generated by all seven forecasting models, are listed in Appendix B.
From Table 5, it can be concluded that the absolute values of the differences between the real values and the forecasting values, by means of the combined forecasting model, are no greater than four. Moreover, one-third of the twelve forecasting values derived from the proposed combination forecasting model are exactly equal to their real values. Thus, related analysis sufficiently reflects the superiority of the proposed combination forecasting model based on artificial intelligence optimization.
Table 5. Root mean square error (RMSE) and mean absolute percentage error (MAPE) values of forecasting models.
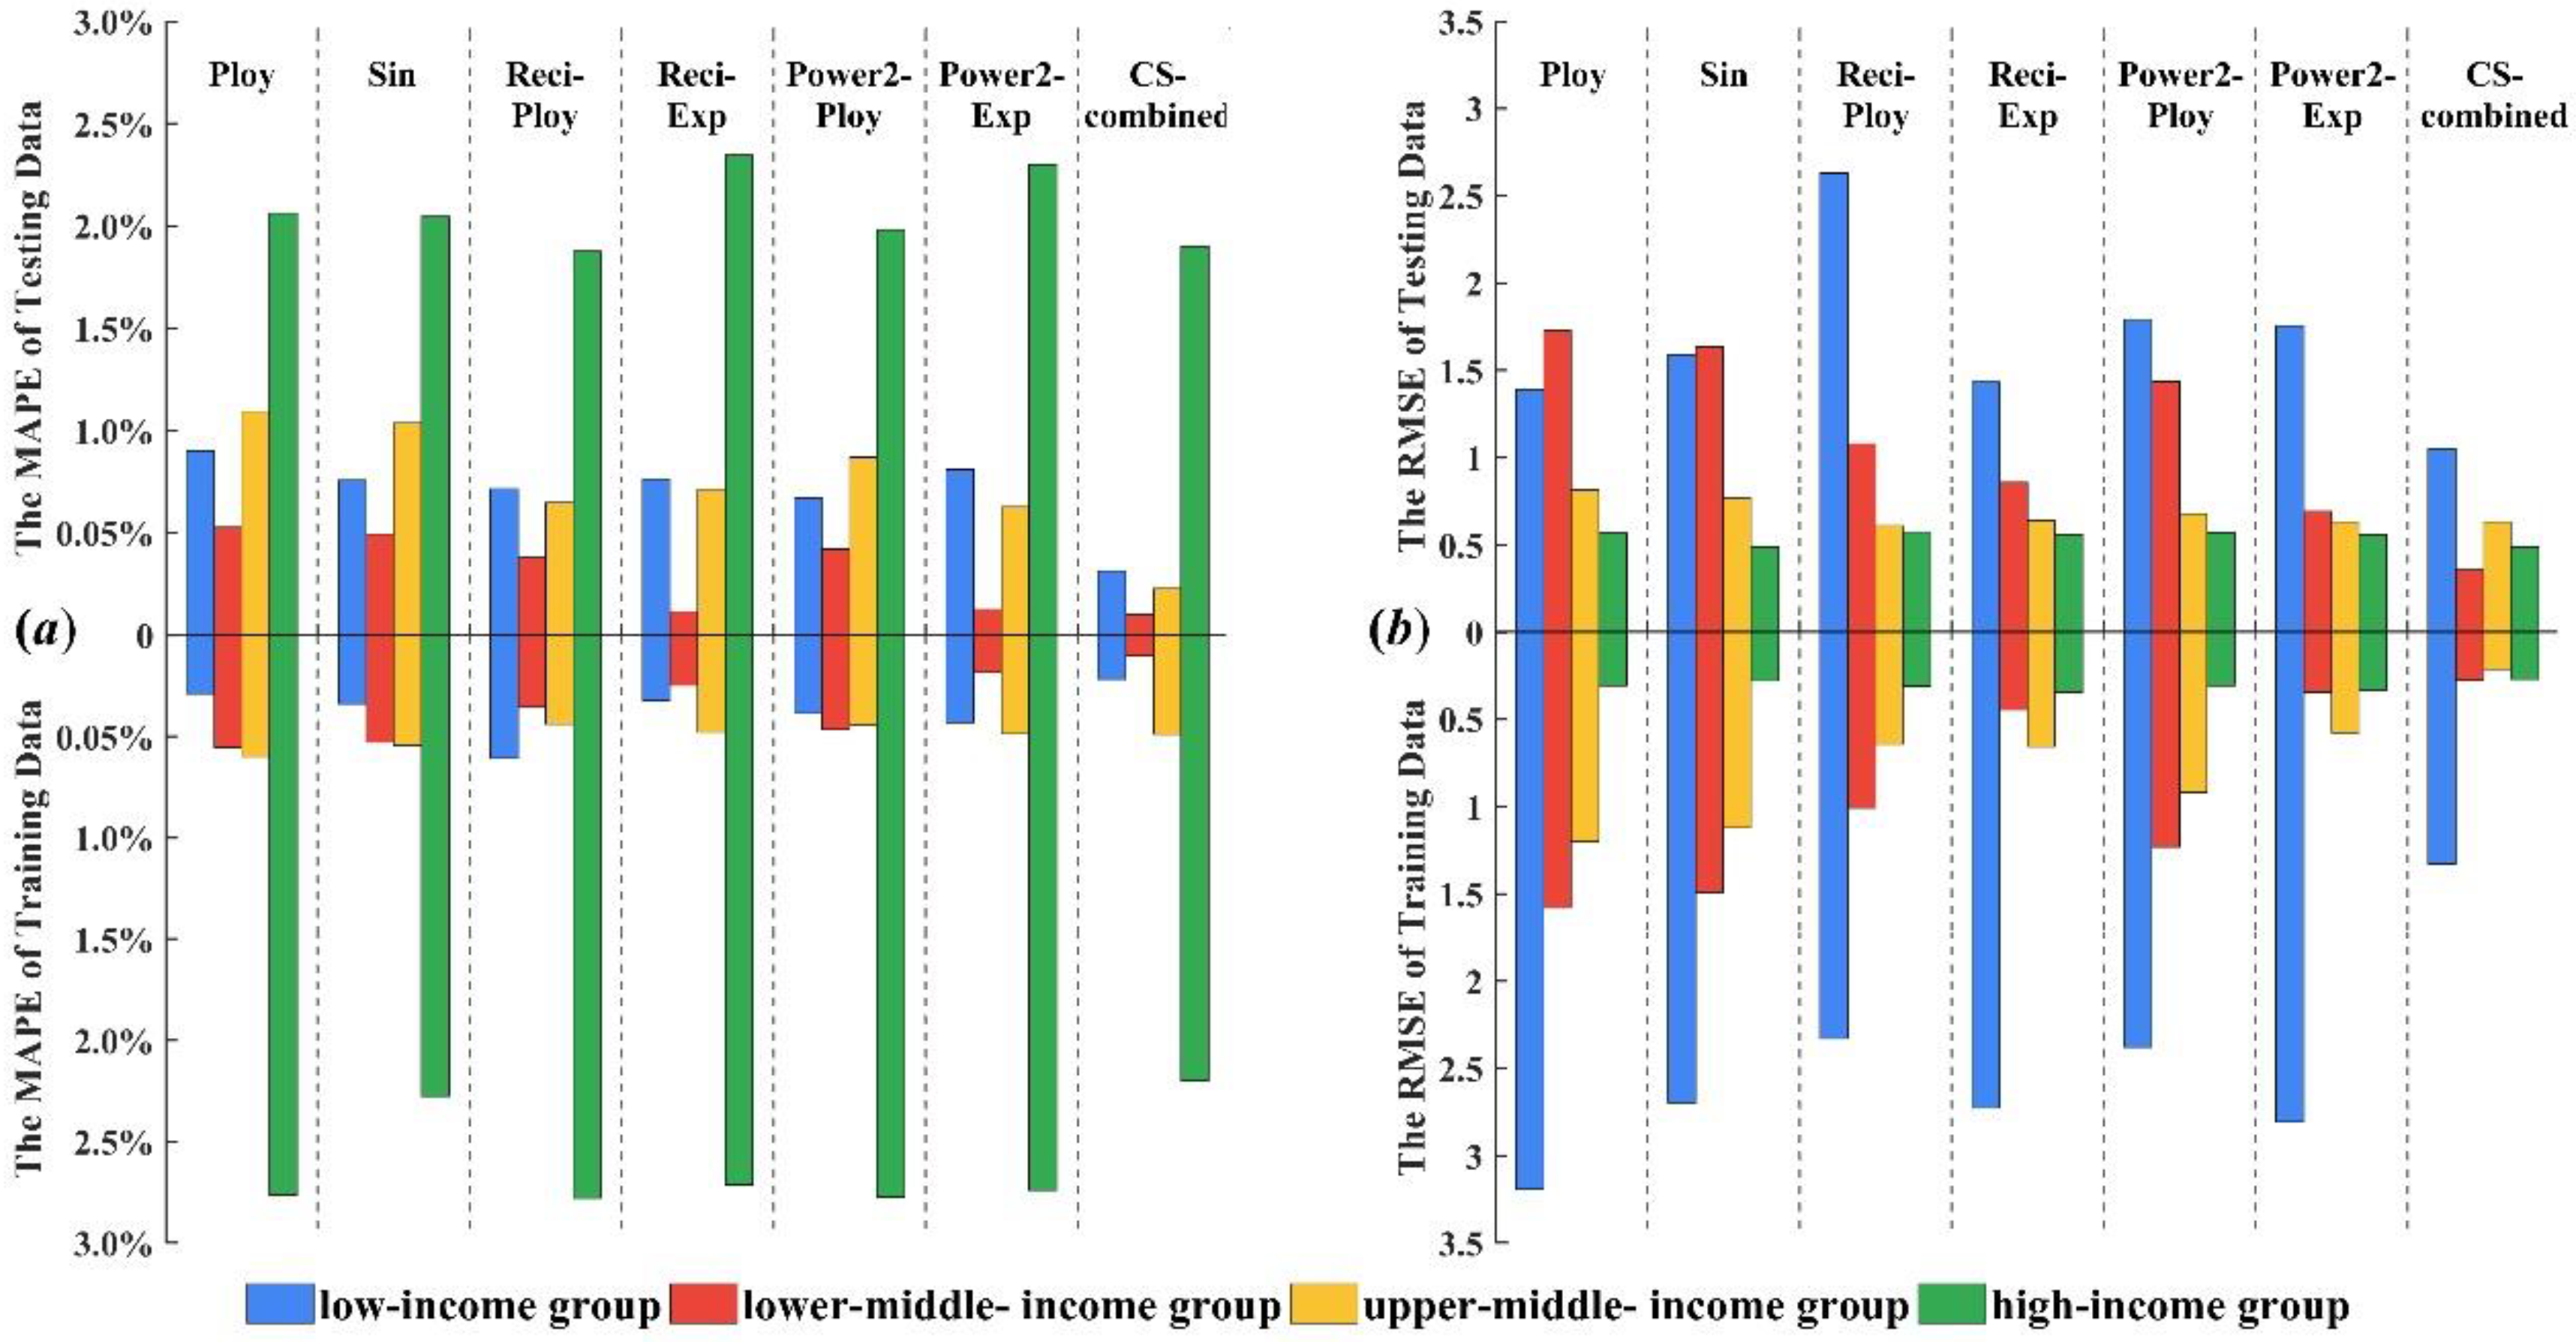
Figure 2 presents the stack bars of forecast errors, including MAPE and RMSE, of the seven forecasting models for the four income groups. Note that, in Figure 2, the MAPE value is represented as a percentage.
Figure 2. Stack bars of forecast errors for the four income groups.
From Figure 2 and Table 5 we can see that the combined forecasting model can further improve forecast accuracy compared with individual regression models as evidenced by it always achieving the lowest forecast error. Based on the fitting results of six polynomial regression models from 2000 to 2012, the combined weight of each model is calculated according to the combined model theory. In order to get the optimal combined weight, cuckoo algorithm is used to optimize the combination weight and the forecasting results (2013–2016) of CS-combined model is calculated by the optimal combination weight.
The CS-combined model was established for the tuberculosis prevalence rate in high income population, which fitted the trend of the original tuberculosis prevalence rate. The forecasting accuracy of CS-combined model is higher than the other model and could be used for the forecasting tuberculosis epidemic trend in high income group. The forecasting results show that the incidence of tuberculosis in the high income group has been declining year by year since 2013 and the decline in 2013–2016 fluctuated between 2% and 4%. The tuberculosis prevalence rate in upper-middle income group in 2013–2016 showed a decreasing trend. For the forecasting results of upper-middle income group from 2013 to 2016, the RMSE and MAPE of CS-combined forecasting model were 0.6307 and 0.4883% respectively, which indicated that the CS-combined model has better forecasting performance and can meet higher forecasting requirements. From another point of view, the CS-combined model can be used for other diseases forecasting. For the lower-middle income group, the RMSE and MAPE of CS-combined model are 0.2113% and 0.2270%, respectively. The forecasting result of CS-combined model indicates that the tuberculosis prevalence rate from 2013 to 2016 is also declining. The forecasting results of tuberculosis prevalence rate for low income group from 2013 to 2016 showed that RMSE and MAPE were 0.3556% and 0.1028%, respectively, and the forecasting values were close to the actual values, which indicate that the CS-combined model has good forecasting performance and application in the tuberculosis prevalence rate forecasting. The forecasting results of the combined model could be used for the prevention and control of tuberculosis in low income group, and provide reference for formulating measures. The above analysis shows that global tuberculosis control strategies and measures have obtained significant achievements, which effectively curb the trend of tuberculosis prevalence rate.
Remark: The CS-combined model proposed in this paper can improve the forecasting accuracy, which combines the advantages of a variety of models and overcomes the influence of the characteristics of the tuberculosis prevalence rate time series on the forecasting results, such as fluctuating trend, small sample, randomness, and non-linearity. Therefore, the combination model in the forecasting and analysis of tuberculosis prevalence rate trend shows good forecasting performance. Therefore, infectious disease control has great significance.

3.4. Analysis of the Performance of Each Model

To further estimate and analyze the performance of the proposed combined tuberculosis prevalence rate forecasting model, the forecasting availability [40] and the DM (Diebold–Mariano) test [44], which evaluate the forecasting performance, are discussed in this part.
(1)
Table 6 shows the results of the DM test. We can reject the null hypothesis and it is deemed that the difference between the prediction abilities of two models is significant. The significance level for a study is chosen before data collection, and typically set to 1%, 5%, 10% [45,46]. The corresponding significance level is as follows:
Table 6. Diebold–Mariano (DM) test of five different models for four different income groups.
(a)
If |DM| > 1.65 the null hypothesis is rejected at a 10% level, otherwise, if |DM| ≤ 1.65 we accept the null hypothesis.
(b)
If |DM| > 1.96 the null hypothesis is rejected at a 5% level, otherwise, if |DM| ≤ 1.96 we accept the null hypothesis.
(c)
If |DM| > 2.58 the null hypothesis is rejected at a 1% level, otherwise, if |DM| ≤ 2.58 we accept the null hypothesis.
For example, the results of low income group indicate that the combined model is different than Reci-ploy2 at the 10% significance level for training process, for the testing process, the |DM| value of Reci-ploy2 is 2.146856 at the 5% significance level, and the |DM| value of Ploy2, Sin2, Reci-exp2, Power2-ploy2, and Power2-Exp2 are 1.809601, 1.695902, 1.642031, 1.487737, and 1.524198 at the 10% significance level in tuberculosis prevalence rate forecasting. The upper limits at the different significance levels are smaller than the DM statistics in four income groups in tuberculosis prevalence rates. The combined model successfully overcomes some limitations of the individual forecasting models and effectively improves the forecasting accuracy. These results indicate that the proposed combined model is more valid and significantly superior to the other models. Thus, it is obvious that the proposed combined model is superior to the other six individual regression models. Accordingly, the proposed combined forecasting model can satisfactorily approximate the observed tuberculosis prevalence rate.
(2)
Table 7 indicates that the first-order and second-order forecasting availabilities offered by the proposed combined model outperform six individual regression models for the four income groups in tuberculosis prevalence rate forecasting. For example, for the low income group, the first-order forecasting availabilities offered by each forecasting model are 0.998405, 0.998663, 0.99874, 0.998651, 0.998815, 0.998572, and 0.999445, respectively, while their second-order values are 0.998403, 0.998662, 0.99874, 0.99865, 0.998814, 0.998571, and 0.999445, respectively.
Table 7. Forecasting availability of five different forecasting models for four different income group.
Remark: The results indicate that the proposed combined model is more valid and significantly superior to the other models. Accordingly, the proposed combined forecasting model can satisfactorily approximate the observed tuberculosis prevalence rate.

4. Conclusions

Concerning the association of income status and prevalence rate, a non-parametric Kruskal–Wallis test is performed, and the matrix derived from the test demonstrates that there are significant differences in tuberculosis prevalence rates among pairwise income groups, except between the lower-middle income and the low income group.
In addition, individual regression models are constructed to fit the tuberculosis prevalence rates from 1999 to 2012 for the four income groups. The quadratic polynomial model, the two-term exponential model, the sum-of-sines model, and the Gaussian model, are repeatedly used to forecast the tuberculosis prevalence rates from 2013 to 2016, with two types of variable transformations: taking reciprocals and base-2 logarithms. All selected individual regression models have satisfactory goodness-of-fit with adjusted R-squares all greater than 0.96. Combined forecasting models are proposed based on six individual regression models, and the weights are optimized by the cuckoo search algorithm, which is based on machine learning. From the extensive simulation results, it can be concluded that for each of the four income groups, the proposed combination forecasting models based on artificial intelligence optimization always provide better forecast accuracy than the individual regression models. As a result, these findings provide substantial information about the effectiveness and stability of the proposed combination forecasting model in the forecasting of hierarchical tuberculosis prevalence rates.
Future healthcare is research on the interaction between patient-centered healthcare and all pillar industries, which uses data science to store, capture, and mine the relationship between medical data and patients. This is, in fact, a new era of radical innovation based on big data and data analysis applications, capable of exploiting leading-edge approaches in data analysis and data mining, which include the idea that the analysis of big data is conducted and designed to better understand healthcare, analyses on healthcare data, and deal with various social issues in the adoption of telematics in medicine and healthcare. In this paper, we mainly focus on analysis and forecasting data of tuberculosis prevalence rate. Through repeated analysis of tuberculosis data, combined with the data of tuberculosis prevalence rates and professional literature, a hybrid combined forecasting model is proposed, verified repeatedly and, finally, the trend of prevalence rates of intelligent medical products.
Based on these developments, this paper contributes significantly in the body of data of tuberculosis prevalence rates, and publishes a combined forecasting model and data analysis methodologies in the field of tuberculosis prevalence rates.
The following points are a summary of the main contents of this paper:
(1)
the KW test is used to validate the different among four kinds of income group;
(2)
different forecasting models are set up for each income group;
(3)
a CS-combined model is proposed in this paper, which incorporates the advantages of each forecasting model.
The numerical results show that the CS-combined model is effective in forecasting the tuberculosis prevalence rate, and the forecasting results have important guiding significance for tuberculosis prevention and control.

Author Contributions

J.W. carried on the validation and visualization of experiment results; C.W. carried on programming and writing of the whole manuscript; J.W. and Y.Z. provided the overall guide of conceptualization and methodology.

Conflicts of Interest

The authors declare no conflict of interest.

Abbreviations

ANOVAanalysis of variance
A-R2adjusted R-square value
CDFcumulative distribution function
CScuckoo search
CS-Combinedcombination model with cuckoo search algorithm
DMDiebold–Mariano
DOTSdirectly observed treatment, short-course
GNIgross national income
HIVhuman immunodeficiency virus
KW methodKruskal–Wallis method
MAPEmean absolute percentage error
MDGsmillennium development goals
Poly2quadratic polynomial model
Poly3cubic polynomial model
Power2-exp2base-2 logarithm transformation and two-term exponential model
Power2-gauss1 base-2 logarithm transformation and one-term Gaussian model
Power2-ploy2base-2 logarithm transformation and quadratic polynomial model
RBFNNradical basis function neural network
Reci-exp2reciprocal transformation and two-term exponential model
Reci-poly2reciprocal transformation and quadratic polynomial model
RMSEroot mean square error
SCDFempirical cumulative distribution function
Sin1single sine model
Sin2sum of two-sines model
TBtuberculosis
WHOWorld Health Organization

Appendix A

Algorithm A1 The shortened process of the cuckoo search algorithm.
Algorithm: CS.
Input:
x = ( x 1 , , x d ) T —A sequence of training data.
Output:
x b e s t —The returned value with the best fitness in the search domain.
Parameters:
n—Number of nests.
p a —Discovery rate of alien eggs/solutions.
Ub—Upper bounds of the search domain.
Lb—Lower bounds of the search domain.
F ( x ) —Objective function.
MaxGeneration—Maximum number of generations.
1: /* Generate an initial population of n host nests x i ( i = 1 , , n ) */
*/2: FOR EACHi: 1 i n DO
3: x i = L b + ( U b L b ) r a n d ( ) ;
4: END FOR
5: i t e r = 1;
6: WHILE (iter<MaxGeneration) DO
7: /* Get a cuckoo randomly (sayi) by Lévy flights. */
8: /* Evaluate its quality/fitness F i . */
9: /* Choose a nest among n (say j) randomly. */
10: IF ( F i > F j ) THEN1
11: /* Replace j by the new solution. */
12: END IF
13: /* Abandon a fraction ( p a ) of the worse nests. */
14: /* Build new ones at new locations via Lévy flights. */
15: /* Keep the best solutions. */
16: /* Rank the solutions and find the current best. */
17: iter = iter + 1;
18: END WHILE
19: RETURN x b e s t

Appendix B

Table A1. Real values and forecasting values of the seven models for the four income groups.
high income groupYearReal ValuePloy3Sin2Reci-ploy2Reci-exp2Power2-ploy2Power2-Exp2CS-Combined
201313.413.798213.797513.767513.867913.783213.847313.7744
201413.413.322913.123013.325413.362313.321313.344113.1150
201512.412.843012.625712.892612.816312.861612.808012.6540
201612.512.358612.333112.470112.218712.404912.231312.4212
upper-middle income groupYearReal valuePoly2Sin1Reci-ploy2Reci-exp2Power2-ploy2Power2-Exp2CS-combined
20139596.202696.140495.635295.772195.930795.605895.2133
20149292.768592.733792.470692.671292.613592.532892.1231
20158989.058489.088489.253889.529189.142489.417489.2615
20168785.072385.213786.016786.372185.543786.284586.7775
lower-middle income groupYearReal valuePoly2Sin1Reci-ploy2Reci-exp2Power2-ploy2Power2-Exp2CS-combined
2013258259.6904259.6018258.8620258.8623259.3924258.4081258.3227
2014253253.0490252.9959252.5304252.9670252.9045252.5490252.6082
2015247245.9936246.0191246.0649247.0764246.1485246.6981246.8826
2016241238.5242238.6817239.5091241.2176239.1550240.8832241.1815
low income groupYearReal valuePoly2Sin2Reci-ploy2Reci-exp2Power2-ploy2Power2-Exp2CS-combined
2013297302.1288301.5349300.8472301.6497301.2547301.9486299.5565
2014288289.4075289.0711289.3481289.1197289.0349289.4911287.4155
2015276276.1888276.3133278.0348276.3462276.6887276.8117276.0947
2016266262.4727263.2969266.9637263.4011264.2757263.9669265.5636

Appendix C

Figure A1. Fitting and forecasting curves for the high income group.
Figure A2. Fitting curves and forecasting for the upper-middle income group.
Figure A3. Fitting and forecasting curves for the lower-middle income group.
Figure A4. Fitting and forecasting curves for the low income group.

References

  1. Guernier, V.; Guegan, J.F.; Deparis, X. An evaluation of the actual incidence of tuberculosis in French Guiana using a capture-recapture model. Microbes Infect. 2006, 8, 721–727. [Google Scholar] [CrossRef] [PubMed]
  2. World Health Organization. Global Tuberculosis Report 2013; World Health Organization: Geneva, Switzerland, 2013. [Google Scholar]
  3. Bhunu, C.P.; Mushayabasa, S.; Smith, R.J. Assessing the effects of poverty in tuberculosis transmission dynamics. Appl. Math. Model. 2012, 36, 4173–4185. [Google Scholar] [CrossRef]
  4. Neville, K.; Bromberg, A.; Bromberg, R.; Bank, S.; Hanna, B.A.; Ross, W.N. The third epidemic: Multi-drug resistant tuberculosis. Chest 1994, 105, 45–48. [Google Scholar] [CrossRef] [PubMed]
  5. Lambregts-van Weezenbeek, C.S.; Veen, J. Control of drug-resistant tuberculosis. Tubercle Lung Dis. 1995, 76, 455–459. [Google Scholar] [CrossRef]
  6. Yew, W.W.; Chau, C.H. Drug-resistant tuberculosis in the 1990s. Eur. Respir. J. 1995, 8, 1184–1192. [Google Scholar] [CrossRef] [PubMed]
  7. World Health Organisation. Anti-Tuberculosis Drug Resistance in the World: The WHO/IUTLD Global Project on Anti-Tuberculosis Drug Resistance Surveillance 1994–1997; WHO: Geneva, Switzerland, 1997. [Google Scholar]
  8. Farmer, P.; Kim, J.Y. Community based approaches to the control of multidrug resistant tuberculosis: Introducing ‘‘DOTS-plus’’. Br. Med. J. 1998, 317, 671–674. [Google Scholar] [CrossRef]
  9. Dye, C.; Maher, D.; Weil, D.; Espinal, M.; Raviglione, M. Targets for global tuberculosis control. Int. J. Tuberc. Lung Dis. 2006, 10, 460–462. [Google Scholar] [PubMed]
  10. Lytras, M.D.; Visvizi, A. Who Uses Smart City Services and What to Make of It: Toward Interdisciplinary Smart Cities Research. Sustainability 2018, 10, 1998. [Google Scholar] [CrossRef]
  11. Spruit, M.; Lytras, M. Applied Data Science in Patient-centric Healthcare. Telemat. Inf. 2018, 35, 643–653. [Google Scholar] [CrossRef]
  12. Anna, V.; Miltiadis, D.L. Rescaling and refocusing smart cities research: From mega cities to smart villages. J. Sci. Technol. Policy Manag. 2018, 9, 134–145. [Google Scholar]
  13. WHO. Global Tuberculosis Control: Surveillance, Planning, Financing; World Health Organization: Geneva, Switzerland, 2007. [Google Scholar]
  14. WHO. Forty-Fourth World Health Assembly, Resolutions and Decisions; World Health Organization: Geneva, Switzerland, 1991. [Google Scholar]
  15. Dye, C.; Scheele, S.; Dolin, P.; Pathania, V.; Raviglione, M.C. Global burden of tuberculosis: Estimated incidence, prevalence, and mortality by country. J. Am. Med. Assoc. 1999, 282, 677–686. [Google Scholar] [CrossRef]
  16. Dye, C.; Bassili, A.; Bierrenbach, A.L. Measuring tuberculosis burden, trends, and the impact of control programmes. Lancet Infect. Dis. 2008, 8, 233–243. [Google Scholar] [CrossRef]
  17. Dye, C. Tuberculosis 2000–2010: Control, but not elimination. Int. J. Tuberc. Lung Dis. 2000, 4, S146–S152. [Google Scholar] [PubMed]
  18. Dye, C.; Floyd, K. Disease Control Priorities in Developing Countries, 2nd ed.; Oxford University Press: New York, NY, USA, 2006; pp. 289–312. [Google Scholar]
  19. Yu, C.Y.; Li, X.X.; Yang, H.; Li, Y.H.; Xue, W.W.; Chen, Y.Z.; Tao, L.; Zhu, F. Assessing the Performances of Protein Function Prediction Algorithms from the Perspectives of Identification Accuracy and False Discovery Rate. Int. J. Mol. Sci. 2018, 19, 183. [Google Scholar] [CrossRef] [PubMed]
  20. Temesgen, D.A.; Kassa, S.M. Optimal Control Strategy for TB-HIV/AIDS Co-Infection Model in the Presence of Behaviour Modification. Processes 2018, 6. [Google Scholar] [CrossRef]
  21. Yang, T.; Liu, S.; Liu, W.; Guo, J.; Wang, P. Noise Enhanced Signal Detection of Variable Detectors under Certain Constraints. Entropy 2018, 20, 470. [Google Scholar] [CrossRef]
  22. Livieris, I.; Kanavos, A.; Tampakas, V.; Pintelas, P. An Ensemble SSL Algorithm for Efficient Chest X-ray Image Classification. J. Imaging 2018, 4, 95. [Google Scholar] [CrossRef]
  23. Rasanathan, K.; SivasankaraKurup, A.; Jaramillo, E.; Lonnroth, K. The social determinants of health: Key to global tuberculosis control. Int. J. Tuberc. Lung Dis. 2011, 15, S30–S36. [Google Scholar] [CrossRef] [PubMed]
  24. Lytras, M.D.; Raghavan, V.; Damiani, E. Big data and data analytics research: From metaphors to value space for collective wisdom in human decision making and smart machines. Int. J. Semant. Web Inf. Syst. 2017, 13, 1–10. [Google Scholar] [CrossRef]
  25. Harling, G.; Castro, M.C. A spatial analysis of social and economic determinants of tuberculosis in Brazil. Health Place 2014, 25, 56–67. [Google Scholar] [CrossRef] [PubMed]
  26. Menzies, N.A.; Wolf, E.; Connors, D. Progression from latent infection to active disease in dynamic tuberculosis transmission models: A systematic review of the validity of modelling assumptions. Lancet Infect. Dis. 2018. [Google Scholar] [CrossRef]
  27. Cohen, T.; Colijn, C.; Finklea, B.; Murray, M. Exogenous re-infection and the dynamics of tuberculosis epidemics: Local effects in a network model of transmission. J. R. Soc. Interface 2007, 4, 523–531. [Google Scholar] [CrossRef] [PubMed]
  28. Brookspollock, E.; Cohen, T.; Murray, M. The impact of realistic age structure in simple models of tuberculosis transmission. PLoS ONE 2010, 5, e8479. [Google Scholar]
  29. Wearing, H.J.; Rohani, P.; Keeling, M.J. Appropriate models for the management of infectious diseases. PLoS Med. 2005, 2, e174. [Google Scholar]
  30. Klotz, A.; Harouna, A.; Smith, A.F. Forecast analysis of the incidence of tuberculosis in the province of Quebec. BMC Public Health 2013, 13, 400. [Google Scholar]
  31. Feng, Z.; Huang, W.; Castillo-Chavez, C. On the Role of Variable Latent Periods in Mathematical Models for Tuberculosis. J. Dyn. Differ. Equ. 2001, 13, 425–452. [Google Scholar] [CrossRef]
  32. Colijn, C.; Cohen, T.; Murray, M. Emergent heterogeneity in declining tuberculosis epidemics. J. Theor. Biol. 2007, 247, 765–774. [Google Scholar] [PubMed]
  33. Ozcaglar, C.; Shabbeer, A.; Vandenberg, S.L. Epidemiological models of Mycobacterium tuberculosis complex infections. Math. Biosci. 2012, 236, 77–96. [Google Scholar] [CrossRef] [PubMed]
  34. White, P.J.; Garnett, G.P. Mathematical modelling of the epidemiology of tuberculosis. Adv. Exp. Med. Biol. 2010, 673, 127–140. [Google Scholar] [PubMed]
  35. Gibbons, J.D.; Chakraborti, S. Nonparametric Statistical Inference; CRC Press: Boca Raton, FL, USA, 2003. [Google Scholar]
  36. Hajek, J.; Sidak, Z.; Sen, P.K. Theory of Rank Tests; Academic Press: Cambridge, MA, USA, 1999. [Google Scholar]
  37. Montgomery, D.C.; Runger, G.C. Applied Statistics and Probability for Engineers; Wiley: Hoboken, NJ, USA, 2002. [Google Scholar]
  38. Adelantado, F.; Verikoukis, C. Detection of malicious users in cognitive radio ad hoc networks: A non-parametric statistical approach. Ad Hoc Netw. 2013, 11, 2367–2380. [Google Scholar] [CrossRef]
  39. Carpenter, R.G. Principles and Procedures of Statistics with Special Reference to the Biological Sciences. Ann. N. Y. Acad. Sci. 1960, 682, 283–295. [Google Scholar]
  40. Yang, X.S.; Deb, S. Engineering optimization by Cuckoo Search. Int. J. Math. Model Numer. Optim. 2010, 1, 330–343. [Google Scholar]
  41. Yang, X.S.; Deb, S. Cuckoo search via Levy flights. In Proceedings of the World Congress on Nature & Biologically Inspired Computing, Coimbatore, India, 9–11 December 2009; pp. 210–214. [Google Scholar]
  42. Cantwell, D. Using Radial Basis Function Networks and Hyper-Cubes for Excursion Classification in Semi-Conductor Processing Equipment. U.S. Patent US9262726, 17 January 2016. [Google Scholar]
  43. Incidence Data by World Bank Income Groups (Last updated: 2017-10-07). Available online: http://apps.who.int/gho/data/view.main.57038ALL?lang=en (accessed on 17 September 2018).
  44. Xiao, L.; Shao, W.; Wang, C.; Zhang, K.; Lu, H. Research and application of a hybrid model based on multi-objective optimization for electrical load forecasting. Appl. Energy 2016, 180, 213–233. [Google Scholar] [CrossRef]
  45. Craparo, R.M. Significance level. In Encyclopedia of Measurement and Statistics; Salkind, N.J., Ed.; SAGE Publications: Thousand Oaks, CA, USA, 2007; pp. 889–891. ISBN 1-412-91611-9. [Google Scholar]
  46. Sproull, N.L. Hypothesis testing. In Handbook of Research Methods: A Guide for Practitioners and Students in the Social Science, 2nd ed.; Scarecrow Press, Inc.: Lanham, MD, USA, 2002; pp. 49–64. ISBN 0-810-84486-9. [Google Scholar]

Article Metrics

Citations

Article Access Statistics

Multiple requests from the same IP address are counted as one view.