Article

Characterization of Spatial Light Modulator Based on the Phase in Fourier Domain of the Hologram and Its Applications in Coherent Imaging

1
School of Mathematics and Physics, Hebei University of Engineering, Handan 056038, China
2
School of Optics and Photonics, Beijing Institute of Technology, Beijing 100081, China
3
Faculty of Science, Kunming University of Science and Technology, Kunming 650500, China
4
Hebei Boxia Photoelectric Information Technology Co., Ltd., Handan 056000, China
*
Author to whom correspondence should be addressed.
Appl. Sci. 2018, 8(7), 1146; https://doi.org/10.3390/app8071146
Submission received: 1 June 2018 / Revised: 1 July 2018 / Accepted: 11 July 2018 / Published: 14 July 2018
(This article belongs to the Special Issue Holography, 3D Imaging and 3D Display)

Abstract

:

Featured Application

This work can be used for fast characterizing the phase modulation of the spatial light modulator (SLM) and shows the applications in coherent imaging by using the SLM.

Abstract

Although digital holography is used widely at present, the information contained in the digital hologram is still underutilized. For example, the phase values of the Fourier spectra of the hologram are seldom used directly. In this paper, we take full advantage of them for characterizing the phase modulation of a spatial light modulator (SLM). Incident plane light beam is divided into two beams, one of which passes the SLM and interferes with the other one. If an image with a single grey scale loads on the SLM, theoretical analysis proves that the phase of the Fourier spectra of the obtained hologram contains the added phase and a constant part relative to the optical distance. By subtracting the phase for the image with the grey scale of 0 from that for the image with other grey scales, the phase modulation can be characterized. Simulative and experimental results validate that the method is effective. The SLM after characterization is successfully used for coherent imaging, which reconfirms that this method is exact in practice. When compared to the traditional method, the new method is much faster and more convenient.

Graphical Abstract

1. Introduction

Digital holography (DH) is a technology that permits the numerical reconstruction of optical wave fields in both amplitude and phase from a digitally-recorded hologram [1,2,3,4,5,6,7]. By processing the information contained in a hologram digitally, this technology has been widely used in many fields, including particle field measurements [1,2], structure testing [3,4], and quantitative analysis of cells [5,6,7]. However, the digital hologram is still not utilized sufficiently. For example, the phase of the Fourier spectra is often processed together with the intensity to get final reconstructed images, and it can also be used directly in some applications without reconstruction. Dohet-Eraly et al. used the phase in the Fourier domain to achieve numerical autofocusing in DH [8]. However, to the best of our knowledge, direct usages of the phase value still need further exploitation. In this paper, we utilize the phase directly for fast characterization of the phase modulation of a spatial light modulator (SLM).
It is well known that, based on the liquid-crystal birefractive property, SLM has been widely applied in many disciplines, such as optical information processing [9], holographic and/or color display [10,11], pattern recognition [12], and vector beams [13,14,15]. The modulation is usually achieved by displaying a gray value map to an SLM. Different gray scale values correspond to the different directions of the liquid-crystal optical axis. As the optical axis is changed, the phase and/or intensity of the light beam passing through the SLM is modulated [16]. However, as the birefractive property can be affected by the wavelength of the incident light and the environment, it is necessary to characterize the phase and/or intensity modulation, i.e., to get the relationships between the changes of phase and/or intensity and the gray values [17,18]. The intensity modulation can be easily characterized by an optical power meter, whereas the phase modulation may not be acquired directly. Usually, the phase modulation is characterized using interferometry, such as the Mach-Zehnder [18,19], the Michelson [20], or even the simple double-beam interference [21]. Plane wave is always used as the incident beam; it is divided into two beams, one of which passes through the SLM (named as object wave) and interferes with the other one (named as reference wave) to form the patterns. Usually, two-part gray-scale maps are loaded on the SLM in the phase measurement. The gray scale in one part of the maps keeps the same (usually it is zero), and that in another part varies during the measurement. As the gray value changes, the phase added to the object wave is also changed, which bring on the relative shifts in interference patterns. Then, the phase variation can be obtained by measuring the shift and comparing it with the period of the fringes [16,17,18,20,21]. This traditional method is convenient, but sometimes it is time consuming to compare the intensity of the patterns to determine the real shifts. It may not be suitable for fast characterization of the phase modulation. Martín-Badosa et al. performed a one-dimensional correlation product to determine fringe displacement, as well as period [19]. This method is more convenient than the traditional method, but the procedure still seems a slightly complicated. Zhang et al. acquired the relationship of the phase shift and the gray value by writing a Ronchi grating pattern for the SLM, but the accuracy was limited by the quantization levels of the image board [22]. Recently, ptychography has been used to characterize SLM with excellent phase accuracy; however, owing to the mechanical shift in the experiment and the iterative algorithm used in the data process, this method is not suitable for fast characterization [23]. Digital holography is also applied for characterization [24]; however, a numerical autofocus process should be implemented, and the tilt distortion may also be considered in the traditional treatment for the hologram. Here, we utilize the phase in the Fourier domain to characterize the phase modulation of SLM. When compared to the traditional method, the new method is much faster and more convenient. SLM, after characterization with this method, is also successfully used for coherent imaging, confirming that the characterization is exact.

2. Analysis and Methods

Our method is based on digital holography. Figure 1 shows a sketch of the phase measurement setup. Transmissive SLM is used here as an example. Plane waves are used as the light beam. The wavefunction of the beam received at the monitor plane can be written as:
U = U O + U R  
Here, the subscripts O and R represent the object and reference beam, respectively. The intensities of the two beams are adjusted to be the same and set to 1 in the analyses. The intensity of the obtained interferogram can be written as:
I = ( U O + U R ) ( U O * + U R * ) = | U O | 2 + | U R | 2 + U O U R * + U R U O *
The interferogram can be considered as the hologram of SLM after diffraction. By applying Fourier transforms to the hologram, there will be three spots in the Fourier domain, namely the 0th, +1st and −1st order spots. They correspond to F { | U O | 2 + | U R | 2 } , F { U O U R * } and F { U R U O * } , respectively. F{} is the operator of the Fourier transform.
Set (α, β, γ) as the direction cosine of the beams, Z as the axis perpendicular to the monitor plane, X and Y as the axes parallel to it, (x, y, z) as the coordinates in the X-Y-Z coordinate system, and θ as the phase added by SLM in the object beam, then:
U O = F 1 { F { W exp ( j θ ) } exp ( j k z 1 ( λ f x ) 2 ( λ f y ) 2 ) }
We chose z = 0 as the position of the SLM; and the modulation of SLM is considered to be in the pure phase mode. W is the transmitting zone of SLM. It can be treated as a two-dimensional (2D) rectangular function, i.e.,
W = rect ( x a , y b ) = rect ( x a ) rect ( y b )
Here, a and b are the size of the width and length of the transmitting zone. The wave function of UR can be expressed as:
U R = exp [ j k R · R ] = exp [ j k ( α R x + β R y + γ R z ) ]
where k = k ( α e x + β e y + γ e z ) , and R = x e x + y e y + z e z . Here, k is the wave vector of the beam. e x , e y and e z denote the unit vector of the axis X, Y, and Z, respectively. The +1 order in the Fourier domain can then be written as:
F { U O U R * } = F { F 1 { F { W exp ( j θ ) } exp ( j k z 1 ( λ f x ) 2 ( λ f y ) 2 ) } × exp [ j k ( α R x + β R y + γ R z ) ] }
According to the properties of the Fourier transform [25] and considering that θ and z are constant, Equation (6) can be calculated as:
F { U O U R * } = | a b | sinc ( a ( f x + α R λ ) ) sinc ( b ( f y + α R λ ) ) × exp ( j k z 1 λ 2 ( f x + α R λ ) 2 λ 2 ( f x + β R λ ) 2 ) exp ( j θ ) exp ( j k γ R z )
The maximum value of the function sinc(x) is at x = 0 [25]. If we choose the origin as the center of the Fourier domain of the hologram, the coordinate of the point with the highest intensity in the +1st order spot is ( α R λ , β R λ ) . It is independent of θ, and the phase of the point can then be written as:
φ = ( 1 γ R ) k z + θ
Usually, θ is set to be zero when the gray scale of the image loading on the SLM is zero. As ( 1 γ R ) k z is the same for all the gray values, the variation θ can then be obtained by subtracting φ 0 . The subscript 0 means that the gray scale of the image loading on the SLM is zero. The phase modulation is then characterized.
In practice, the experimental setup is sometimes affected by the airflow in the environment. Then, optical path z may vary. In most situations, the direction of the beam is unchanged as the optical devices are fixed during measurement. This means that the positions of the ±1st order of the spectra continues to be the same, but their phases change. An unknown phase is added to the objective beam. Considering the cross of the beam is very small, the unknown phase is thought to be the same for every part of the beam. Then, in the practice, we can get the relationship of the phase added by SLM and the gray scale of the image loading on it using the following steps:
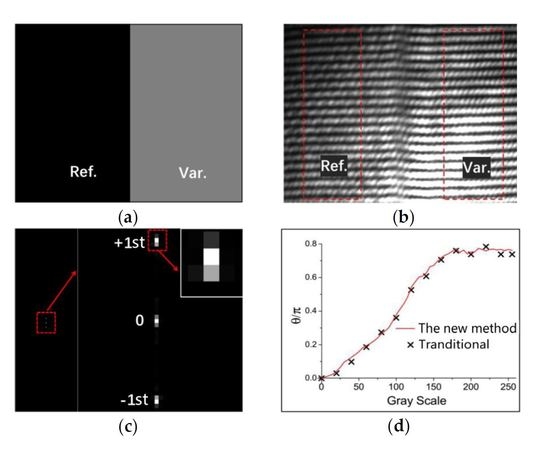
  • Step 1: Divide the image loading on the SLM into two parts. One part (named the reference part) has a constant gray scale of 0. The other one (named the variable part) has a gray scale varying from 0 to 255 (for the 8-bit-gray-scale SLM) during the experiment.
  • Step 2: There are then two sets of interfered patterns in the holograms accordingly. An area with the same size is selected from each for Fourier transform. In the practice, the areas are far from the borders of the two patterns to avoid the influence of the diffraction in the border.
  • Step 3: Subtract phase φ r of the point with the highest intensity in +1st order spot for the reference part from φ v for the variable part. Then difference Δ φ = φ v φ r is phase variation θ.
Sometimes, the monitor may be tilted to the light beam. In this condition, the optical path z is a function of x and y. It means that Δ φ contains the phase difference related to Δz, which is the optical path difference between the two selected parts. As Δz is constant during the experiment, its influence will be removed by subtracting Δ φ 0 . Here, subscript 0 represents that the gray scale of the reference part being zero.

3. Results

3.1. Simulation Results

A simulation was applied to test the method shown above. The wave function of the reference beam was U R = exp { j [ k ( β y + γ z ) + θ un ] } . Here, θ un was set randomly to simulate the unknown phase from the vibration of the environment. For simplicity, the phase was added to the reference beam only. As the reference wave was tilted to the monitor, we supposed that optical distance zR varied from 14 to 16 mm along the x axis at the monitor plane. β was set to be 0.1 and γ = ( 1 β 2 ) = 0.9950 . A 512 pixel × 512 pixel matrix was used to simulate the transmitting area of SLM. Its length and width were set to 9.216 mm, and the wavelength was set to 532 nm.
The object beam passes through the SLM, where the gray scale in the variable part varied from 0 to 255, and the corresponding phase shift θset was set as a variable value from 0 to 255 256 × 2 π in the step of π 128 . The optical distance zo from SLM to the monitor plane was set to be 10 mm. The wavefunction UO on the monitor plane was calculated using the angular spectrum theory. The processes were implemented in the MATLAB 2017a environment with an Intel Core i7-6500U CPU at 2.50 GHz and 8 Gb RAM.
The interferograms with different added phases of θ were then obtained. A typical one is shown in Figure 2a. θ was calculated following the steps shown in Section 2. The areas surrounded by the red lines were selected for fast Fourier transform (FFT). Their positions were fixed for different interferograms. Figure 2b shows a typical spectra pattern for the variable part; it was like that for the reference part as well. The central point in the +1 order with the highest intensity was chosen to acquire its phase. As discussed above, its position was fixed for all spectra patterns. The calculated phase shift θcal matches the set phase variation θset very well, as shown in Figure 2c.: The relative error was introduced to quantitatively evaluate the characterization. It was defined as:
E r = { | θ cal θ set | / θ set ( θ set 0 ) | θ cal θ set | ( θ set = 0 )
From Figure 2d, for all the θcal, the relative errors are less than 0.01%. The results show that the new method is very exact.

3.2. Experimental Methods and Results

This method was applied to characterize a transmissive SLM (GCS-SLM-T2, Beijing Daheng Corp., China) in the experiments. The size of the pixel of the SLM was 18 μm × 18 μm. The experimental setup can also be seen in Figure 1. A laser with a wavelength of 532 nm was used here. Polarizers P1 and P2 were adjusted to make sure that the SLM worked in the pure phase mode. Two-part gray-scale images were displayed on the SLM during the experiment, just like in the simulation. Figure 3a is a typical image, and the gray scale in its variable part is 100. The corresponding hologram is shown in Figure 3b. There is a shift in the fringes between the reference and the variable parts. Areas with the same size were selected in both parts for FFT, as mentioned in Section 2. Figure 3c shows the spectra of the selected area in the variable part after FFT. The point with the highest intensity in the +1st order of the spectra was chosen to get phase φ v . Its position continued to be the same for all the gray scales. A similar process was also implemented on the reference part to get φ r . Following the same steps as those described in Section 2, the relationships between the gray scale and the added phase could be obtained, as shown in Figure 3d.
From Figure 3d, the phases could be adjusted nonlinearly by the SLM. The adjustable range was between 0 and about 0.8π. If the gray scale is below 20, the phase shift increases slowly with the increase in the gray scale value, while it is maintained almost constant with a value of about 0.8π if the gray scale value is beyond 180. For gray scale values between 80 and 130, the phase shift increases nearly linearly with the increasing gray scale value.
The traditional method like that in Reference [18] was also used to verify the new method. Figure 4 presents the main process. At first, the interference patterns were rotated parallel to one edge of the image, as closely as possible. The x axis was set to be parallel to this edge. Taking Figure 3b as an example, by properly cutting and slightly rotating it, Figure 4a could be obtained. It seems that the two figures had the same line orientation, because the angle of the rotation was quite small (about 0.05 rad). A dashed line parallel to the y axis was chosen in each part of the image (see in Figure 4a). Here, the y axis is perpendicular to the x axis. The relationships between the intensities along the lines and the y coordinates are shown in Figure 4b. Both curves varied periodically and there was a relative shift between them. By measuring the distance of the adjacent peaks or troughs, the period could be obtained. Then it was used to compare the relative shift between the two curves to get the phase shift. Here, as shown in Figure 4b, the period was about 45 pixels, and the relative shift was about 8.1 pixels. The phase shift here could then be calculated as 8.1 45 × 2 π . This means that the relative added phase was about 0.36 π when the gray scale was 100. Repeating the same process, the relationships between the gray scale and the added phase could also be obtained. The results are also referred to in Figure 3d. They matched the results obtained by the new method very well, indicating that the new method was effective. The processing time of the two methods were different. For the new method, the total time consumed was about 1.694 s for characterizing all 256 gray scales in the MATLAB 2017a environment with an Intel Core i7-6500U CPU at 2.50 GHz and 8 Gb RAM. However, for the traditional method, as the comparisons of the shifts were implemented manually to avoid the influence of noises around the peaks or troughs in the curves, the processing time was long; about 30 min for about 12 gray scales. With a simpler procedure, the new method can be implemented more conveniently than the traditional one. As all the steps can be carried out automatically; it can be used to quickly characterize SLM.

3.3. Applications in Coherent Imaging

The characterization with this new method can also be tested using the SLM in coherent imaging. Zhang et al. showed that arbitrary complex-valued fields could be retrieved through aperture-plane modulation [26,27]. In Reference [26], a phase plate was used as the wave-front modulator. By shifting the plate, the authors recorded a set of diffractograms with different modulations and used them to retrieve the complex-valued fields by using an iterative retrieval technique.
Here, we used SLM as the modulator, and different modulations were produced by loading different images on the SLM. The experimental setup is referred to in Reference [26]. For simplicity, only a pure modulus-type specimen was used in the experiment as a prototype. A map with a transparent character J surrounded by a translucent background was treated as the specimen, and its size was about 3 × 3 mm (Figure 5a). The specimen is fixed on a glass by the lighttight taps. The monitor used here was a COMS camera (MER-131-210U3M, Beijing Daheng Corp) with a pixel size of 4.8 μm × 4.8 μm. In the experiment, the distance between the SLM and specimen and that between the specimen and the digital receiver were about 7 and 207 mm, respectively.
Because the phase modulation of the SLM may be affected by the environment, the phase added might have had a slight deviation from what we expected. To reduce the effect, we use random grid-like masks (Figure 5b). Only two gray scales are in the masks; one was 0 and the other was 110, corresponding to 0.440π according to our characterization. We took six different masks to adjust the diffractograms. A typical diffractogram can be seen in Figure 5c. The specimen is then retrieved using the iterative method, the details of which are referred to in Reference [26]. This process spends about 6 s for about 100 iterations. Figure 5d shows the retrieved modulus of the specimen. From the figure, not only character J, but also the background with poor transmittance and the lighttight area around the specimen were retrieved. This confirms that the characterization was available in practice.
It is possible that a value of θ in a range around 0.44π can lead to successful retrieval. During the retrieval process, we set different values of θ to investigate how they affected the retrieval. One-hundred iterations were taken for all the θ. Figure 6 shows part of the results. When θ is set to be 0.439π, it seems that the modulus is retrieved with little loss of the quality (Figure 6a). The specimen cannot be retrieved when θ equals 0.437π or 0.443π, as shown in Figure 6b,c. To quantitatively evaluate the retrieval, we introduced parameter EI. It is defined as:
E I = i ( | I cal , i | | I exp , i | ) 2 N mask N pixel
Here, Ical,i and Iexp,i are the intensities of the calculated and the experimental diffractograms for the ith mask, respectively. Nmask and Npixel are the total number of masks and the total pixels in a diffractogram, respectively. Considering that a pure amplitude sample was used in the experiment, Ical,i was calculated by the retrieved modulus instead of the complex amplitude. Obviously, a smaller EI means a more accurate retrieval. The relationship of the EI and θ values can be seen in Figure 6d. For Figure 6a–c, the EI values are 0.0117, 0.0133 and 0.0245, respectively. As the θ value is farther away from 0.440π, the corresponding EI should be larger. From the above results, it can be determined that, in this experiment, the retrieval can tolerate an error of θ less than 0.006π. From our characterization (see in the inset of Figure 3d), θ is 0.437π when the gray scale of the image loaded on the SLM is 109, and 0.447π when it is 111. They both cannot lead to a successful retrieval. This indicates that by direct use of the phase value in the Fourier domain, the phase modulation of the SLM can be precisely characterized in the practice.

4. Discussion and Conclusions

Simulative and experimental results can prove that the characterization of phase modulation of the SLM, based on the phase in the Fourier domain of the hologram, was effective. This means that, for holography, not only the reconstructed wave field from a hologram, but also the phase in the Fourier domain can be directly utilized in practice. Some processes, such as digital refocusing and/or phase compensation, are not needed in the new method and it will be faster than characterization based on the traditional treatment of a hologram [24]. In this method, all steps can be carried out automatically; it can be implemented more conveniently than the traditional method. The SLM characterized by the new method has also been applied for coherent imaging. The results show that, with characterization, the specimen was reconstructed successfully. This indicates that this characterizing method for phase modulation can be precise in practice.
Although the information of the specimen can be successfully retrieved in the coherent imaging system with SLM, the robustness of the system is not very strong. The tolerance of the error of the phases added by the SLM is very small in this system. If the environment varies, the phase modulation may need to be recharacterized. Moreover, variations can also bring pixel misalignments into the experimental setup and lead to a failure in retrieving the information. If the SLM is used effectively in coherent imaging, unexpected relative lateral shifts between it and the monitor, as well as the specimen, must be avoided, and the environment should be kept stable.

5. Patents

Related patents are showed as follows:
A ptychographic imaging setup (CN 201720808955.9; CN 201710544508.1).
A holographic imaging technology based on phase ptychography (CN 201610028448.3).

Author Contributions

Conceptualization, Z.D. and H.W.; Methodology, Z.D.; Software, Y.F. and X.J.; Validation, F.F. and Y.L.; Formal Analysis, Z.D. and Y.F.; Investigation, Z.D., H.W. and F.F.; Resources, H.W. and Y.L.; Data Curation, H.W., Z.D. and Y.F.; Writing-Original Draft Preparation, Z.D.; Writing-Review and Editing, H.W. and Y.L.; Project Administration, H.W.; Funding Acquisition, Z.D., F.F., H.W. and Y.L.

Funding

This work was supported by the Science and Technology Plan Project of Hebei Province (16273901D, 15275602D); the National Natural Science Foundation of China (61465005, 11504078); the International Science and Technology Cooperation (2014DFE00200); and the Natural Science Foundation of Hebei Province (F2018402285).

Acknowledgments

The authors are grateful to the anonymous reviewers for their constructive suggestions. We thank Xiufa Song and Sixing Xi for their help in the experiment, and we thank Eddie Wang for his help in the English writing.

Conflicts of Interest

The authors declare no conflicts of interest.

References

  1. Ren, Z.; Chen, N.; Lam, E.Y. Extended focused imaging and depth map reconstruction in optical scanning holography. Appl. Opt. 2016, 55, 1040–1047. [Google Scholar] [CrossRef] [PubMed]
  2. Qu, X.; Song, Y.; Jin, Y.; Li, Z.; Wang, X.; Guo, Z.; Ji, Y.; He, A. 3D SAPIV particle field reconstruction method based on adaptive threshold. Appl. Opt. 2018, 57, 1622–1633. [Google Scholar] [CrossRef] [PubMed]
  3. Pourvais, Y.; Asgari, P.; Abdollahi, P.; Khamedi, R.; Moradi, A.-R. Microstructural surface characterization of stainless and plain carbon steel using digital holographic microscopy. J. Opt. Soc. Am. B 2017, 34. [Google Scholar] [CrossRef]
  4. Wang, H.; Dong, Z.; Wang, S.; Lou, Y. Comparison of the refocus criteria for the phase, amplitude, and mixed objects in digital holography. Opt. Eng. 2018, 57, 054111. [Google Scholar] [CrossRef]
  5. McReynolds, N.; Cooke, F.G.M.; Chen, M.; Powis, S.J.; Dholakia, K. Multimodal discrimination of immune cells using a combination of Raman spectroscopy and digital holographic microscopy. Sci. Rep. 2017, 7, 43631. [Google Scholar] [CrossRef] [PubMed] [Green Version]
  6. Yi, F.; Moon, I.; Javidi, B. Automate red blood cells extraction from holographic images using fully convolutional neural networks. Biomed. Opt. Express 2017, 8, 4466–4479. [Google Scholar] [CrossRef] [PubMed]
  7. Merola, F.; Memmolo, P.; Miccio, L.; Savoia, R.; Mugnano, M.; Fontana, A.; D’Ippolito, G.; Sardo, A.; Iolascon, A.; Gambale, A.; et al. Tomographic flow cytometry by digital holography. Light Sci. Appl. 2017, 6, e16241. [Google Scholar] [CrossRef]
  8. Dohet-Eraly, J.; Yourassowsky, C.; Dubois, F. Fast numerical autofocus of multispectral complex fields in digital holographic microscopy with a criterion based on the phase in the Fourier domain. Opt. Lett. 2016, 41, 4071–4074. [Google Scholar] [CrossRef] [PubMed]
  9. Wang, C.; Su, Y.; Wang, J.; Zhang, C.; Zhang, Z.; Li, J. Method for holographic femtosecond laser parallel processing using digital blazed grating and the divergent spherical wave. Opt. Eng. 2015, 54, 016109. [Google Scholar] [CrossRef]
  10. Collings, N.; Christmas, J.L.; Masiyano, D.; Crossland, W.A. Real-time phase-only spatial light modulator for 2D holographic display. J. Disp. Technol. 2015, 11, 278–284. [Google Scholar] [CrossRef]
  11. Harm, W.; Jesacher, A.; Thalhammer, G.; Bernet, S.; Ritsch-Marte, M. How to use a phase-only spatial light modulator as a color display. Opt. Lett. 2015, 40, 581–584. [Google Scholar] [CrossRef] [PubMed]
  12. Xu, P.; Hong, C.; Sun, Z.; Han, F.; Cheng, G. Integrated zigzag Vander Lugt correlators incorporating an optimal trade-off synthetic discriminant filter for invariant pattern recognition. Opt. Commun. 2014, 315, 97–102. [Google Scholar] [CrossRef]
  13. Zhan, Q. Cylindrical vector beams: From mathematical concepts to applications. Adv. Opt. Photonics 2009, 1, 1–57. [Google Scholar] [CrossRef]
  14. Maluenda, D.; Juvells, I.; Martinez-Herrero, R.; Carnicer, A. Reconfigurable beams with arbitrary polarization and shape distributions at a given plane. Opt. Express 2013, 21, 5424–5431. [Google Scholar] [CrossRef] [PubMed]
  15. Maluenda, D.; Carnicer, A.; Martinez-Herrero, R.; Juvells, I.; Javidi, B. Optical encryption using photon-counting polarimetric imaging. Opt. Express 2015, 23, 655–666. [Google Scholar] [CrossRef] [PubMed]
  16. Bergeron, A.; Gauvin, J.; Gagnon, F.; Gingras, D.; Arsenault, H.H.; Doucet, M. Phase calibration and applications of a liquid-crystal spatial light modulator. Appl. Opt. 1995, 34, 5133–5139. [Google Scholar] [CrossRef] [PubMed]
  17. Dou, R.; Giles, M.K. Simple technique for measuring the phase property of a twisted nematic liquid crystal television. Opt. Eng. 1996, 35, 808–812. [Google Scholar] [CrossRef]
  18. Reichelt, S. Spatially resolved phase-response calibration of liquid-crystal-based spatial light modulators. Appl. Opt. 2013, 52, 2610–2618. [Google Scholar] [CrossRef] [PubMed]
  19. Matín-Badosa, E.; Carnier, A.; Juvells, I.; Vallmitjana, S. Complex modulation characterization of ligquid crystal devices by interferometric data correlation. Meas. Sci. Technol. 1997, 8, 764–772. [Google Scholar] [CrossRef]
  20. Otón, J.; Ambs, P.; Millán, M.S.; Pérez-Cabré, E. Multipoint phase calibration for improved compensation of inherent wavefront distortion in parallel aligned liquid crystal on silicon displays. Appl. Opt. 2007, 46, 5667–5679. [Google Scholar] [CrossRef]
  21. Bondareva, A.P.; Cheremkhin, P.A.; Evtikhiev, N.N.; Krasnov, V.V.; Starikov, R.S.; Starikov, S.N. Measurement of characteristics and phase modulation accuracy increase of LC SLM “HoloEye PLUTO VIS”. J. Phys. Conf. Ser. 2014, 536, 012011. [Google Scholar] [CrossRef]
  22. Zhang, Z.; Lu, G.; Yu, F.T.S. Simple method for measuring phase modulation in liquid crystal televisions. Opt. Eng. 1994, 33, 3018–3022. [Google Scholar] [CrossRef]
  23. McDermott, S.; Li, P.; Williams, G.; Maiden, A. Characterizing a spatial light modulator using ptychography. Opt. Lett. 2017, 42, 371–374. [Google Scholar] [CrossRef] [PubMed]
  24. Dev, K.; Singh, V.R.; Asundi, A. Full-field phase modulation characterization of liquid-crystal spatial light modulator using digital holography. Appl. Opt. 2015, 50, 1593–1600. [Google Scholar] [CrossRef] [PubMed]
  25. Lv, N. Fourier Optics, 2nd ed.; China Machine Press: Beijing, China, 2006; pp. 31–39. ISBN 978-7-111-18480-5. [Google Scholar]
  26. Zhang, F.; Pedrini, G.; Osten, W. Phase retrieval of arbitrary complex-valued fields through aperture-plane modulation. Phys. Rev. A 2007, 75, 043805. [Google Scholar] [CrossRef]
  27. Kohler, C.; Zhang, F.; Osten, W. Characterization of a spatial light modulator and its application in phase retrieval. Appl. Opt. 2009, 48, 4003–4008. [Google Scholar] [CrossRef] [PubMed]
Figure 1. Sketch of the phase measurement setup. L1: collimation lens; NBS: nonpolarized beam splitter; P: Polarizer; M: Mirror.
Applsci 08 01146 g001
Figure 2. (a) The simulated interferogram with θset of π. Areas around the red line were selected for Fourier transform; the inset is the enlarged patterns surrounded by yellow lines. (b) the frequency spectrum of the selected variable areas; the inset is the enlarged image of the +1st order; (c) the relationship of θset and θcal; (d) the relationship of the relative error and the gray scales.
Applsci 08 01146 g002
Figure 3. (a) Sketch of a typical image displayed on the spatial light modulator (SLM) with two equal parts as the reference and the variable; the gray scale in the variable part is 100; (b) the related interferogram received by the monitor; (c) the frequency spectrum of the variable part around by the red dashes in (b), left: the whole patterns; right: the enlarged image of the part around by the dashes in the left; inset: The enlarged image of +1st order; (d) the relationship between the phase variation and the gray scale of the image loaded on the SLM.
Applsci 08 01146 g003
Figure 4. Sketch of the process of the traditional method. (a) Figure 3b after being rotated slightly and properly cut; the curves beside the pattern represent the intensity along the dashed lines at the left and right parts, respectively; (b) comparison of the troughs of the light intensities of the dashed lines.
Applsci 08 01146 g004
Figure 5. (a) A photograph of the specimen and the lighttight blue taps around it. (b) a typical grid-like mask sent to the SLM; (c) a diffractogram received by the camera; (d) the retrieved modulus of the specimen. The scale bar here is 1 mm.
Applsci 08 01146 g005
Figure 6. Results of the retrieved modulus of the specimen for different θ values. (a) θ = 0.439π; (b) θ = 0.437π; (c) θ = 0.443π; (d) the relationship between EI and θ. The scale bar is 1 mm.
Applsci 08 01146 g006

