Abstract
This work presents a framework that monitors particular symptoms such as respiratory conditions (abnormal breathing pattern) experienced by hyperthyreosis, sleep apnea, and sudden infant death syndrome (SIDS) patients. The proposed framework detects and monitors respiratory condition using S-Band sensing technique that leverages the wireless devices such as antenna, card, omni-directional antenna operating in 2 GHz to 4 GHz frequency range, and wireless channel information extraction tool. The rhythmic patterns extracted using S-Band sensing present the periodic and non-periodic waveforms that correspond to normal and abnormal respiratory conditions, respectively. The fine-grained amplitude information obtained using aforementioned devices is used to examine the breathing pattern over a period of time and accurately identifies the particular condition.
1. Introduction
Hyperthyreosis is a condition that is characterized by the excess production of thyroid hormone [1]. This disorder is primarily caused by the auto-immune system, produces a butterfly-shaped organ in the neck and controls the rate of metabolism. The term hyperthyroidism refers to the production of the huge amount of thyroid hormone that affects the metabolism rate, as a result increase in shortness of breath (abnormal breathing), mood swings, anxiety, muscle weakness, hair loss and tremors in limbs can be experienced [2]. Sleep apnea is a sleep disorder that causes abnormal breathing which can ultimately cause apnea [3], while sudden infant death syndrome condition is experienced by a newly born baby or around one year old where the baby experience abnormal respiration and then suddenly stops breathing while asleep. The normal breathing rate for healthy person while is resting is 12 to 20 breaths per minute and the abnormal respiratory rate is over 25 breaths per minute. Normal breathing presents a periodic waveform and abnormal breathing waveform is non-period.
In healthcare environment, the introduction of wireless communication systems has promoted the improvement in the efficiency of patient care and health management [4,5]. This paper presents S-Band sensing technique (operating at 2 GHz to 4 GHz) that leverage wireless channel information (WCI) obtained using wireless devices such as antenna, card, omni-directional antenna, etc. to monitor and detect the respiratory condition experienced by patient suffering from diseases such as hyperthyreosis, sleep apnea and sudden infant death syndrome (SIDS). The aim is to assist the doctors or caregivers for documenting objective assessments.
2. Related Work
This section presents the research work performed for detecting the respiratory patterns. With regard to breathing pattern assessment, polysomnography (PSG) used pressure transducers in the nostrils to record the airflow pressure [6]. The subject has to sleep while wearing multiple sensors including an Electroencephalography (EEG) monitor, an Electromyography (EMG) monitor, an Electrooculography (EOG) monitor, nasal probes, etc. [7]. The system introduced in [8] exploits the pressure sensor array equipped with a mat to detect the subject’s breathing pattern, and body motion. The camera-based system introduced in [9] monitors the patient and extract the respiration rate. However, the sleeping mat equipped with sensors is expensive, uncomfortable at times and the vision-based system is light dependent, computationally expensive, and raises privacy issues.
As an alternative, radio frequency (RF) signals can be used to track the subject’s chest movements due to the advantage of less complexity and independence of light intensity. The core idea is to exploit the change in wireless signal propagation between transceiver pair due to minute chest movement. Leveraging RF technologies, Aqib et al. [10] used the Frequency Modulated Carrier Waves (FMCW) radar to detect subject’s breathing pattern. The main limitation of FMCW radar is that the transmitted signals interfere with the nearby RF systems since it exploits large range of frequencies.
Patwari et al. [11] used the commercially available small wireless devices to track breathing pattern and exploited the received signal strength indicator (RSSI). Further improvements were brought up by [12] where the RSSI measurements were obtained using single transceiver pair to track the subject’s respiration. The RSSI data, however, do not report the subtle chest movement due to breathing, as a result, the desirable results can be greatly affected by environmental noise. In order to cope with this issue, the RSSI measurements are essentially termed as sinusoidal signals, and the amplitude information is generally estimated on the basis receive signal measurements under particular periodic assumption [13]. Also, the performance of RSSI dramatically degrades in complex situations due to temporal dynamics and multipath fading [14]. However, the RSSI-based systems give us a blueprint to use wireless channel features that are more sensitive than RSSI, in extracting the normal breathing pattern and abnormal breathing pattern of a patient suffering from hyperthyreosis, sleep apnea and SIDS. Thus, in order to extract the subject’s normal and abnormal respiration, we use S-Band sensing technique which is highly sensitive to body motion by exploiting the wireless channel information.
3. S-Band Sensing and Breath Detection
The wireless channel information characterizes the wireless channel properties of a communication link. The information essentially presents the RF signal propagation from transmitter to receiver and describes the combined effect of multipath propagation such as reflection, fading, and scattering [15]. The signal received can be expressed as:
Here is the wireless channel information, the terms and denote the amplitude and phase information for ith frequency, respectively. It should be noted that the card reveals group of 30 frequencies known as one WCI packet and is intrinsic feature of the device that sweeps over multiple channel frequencies.
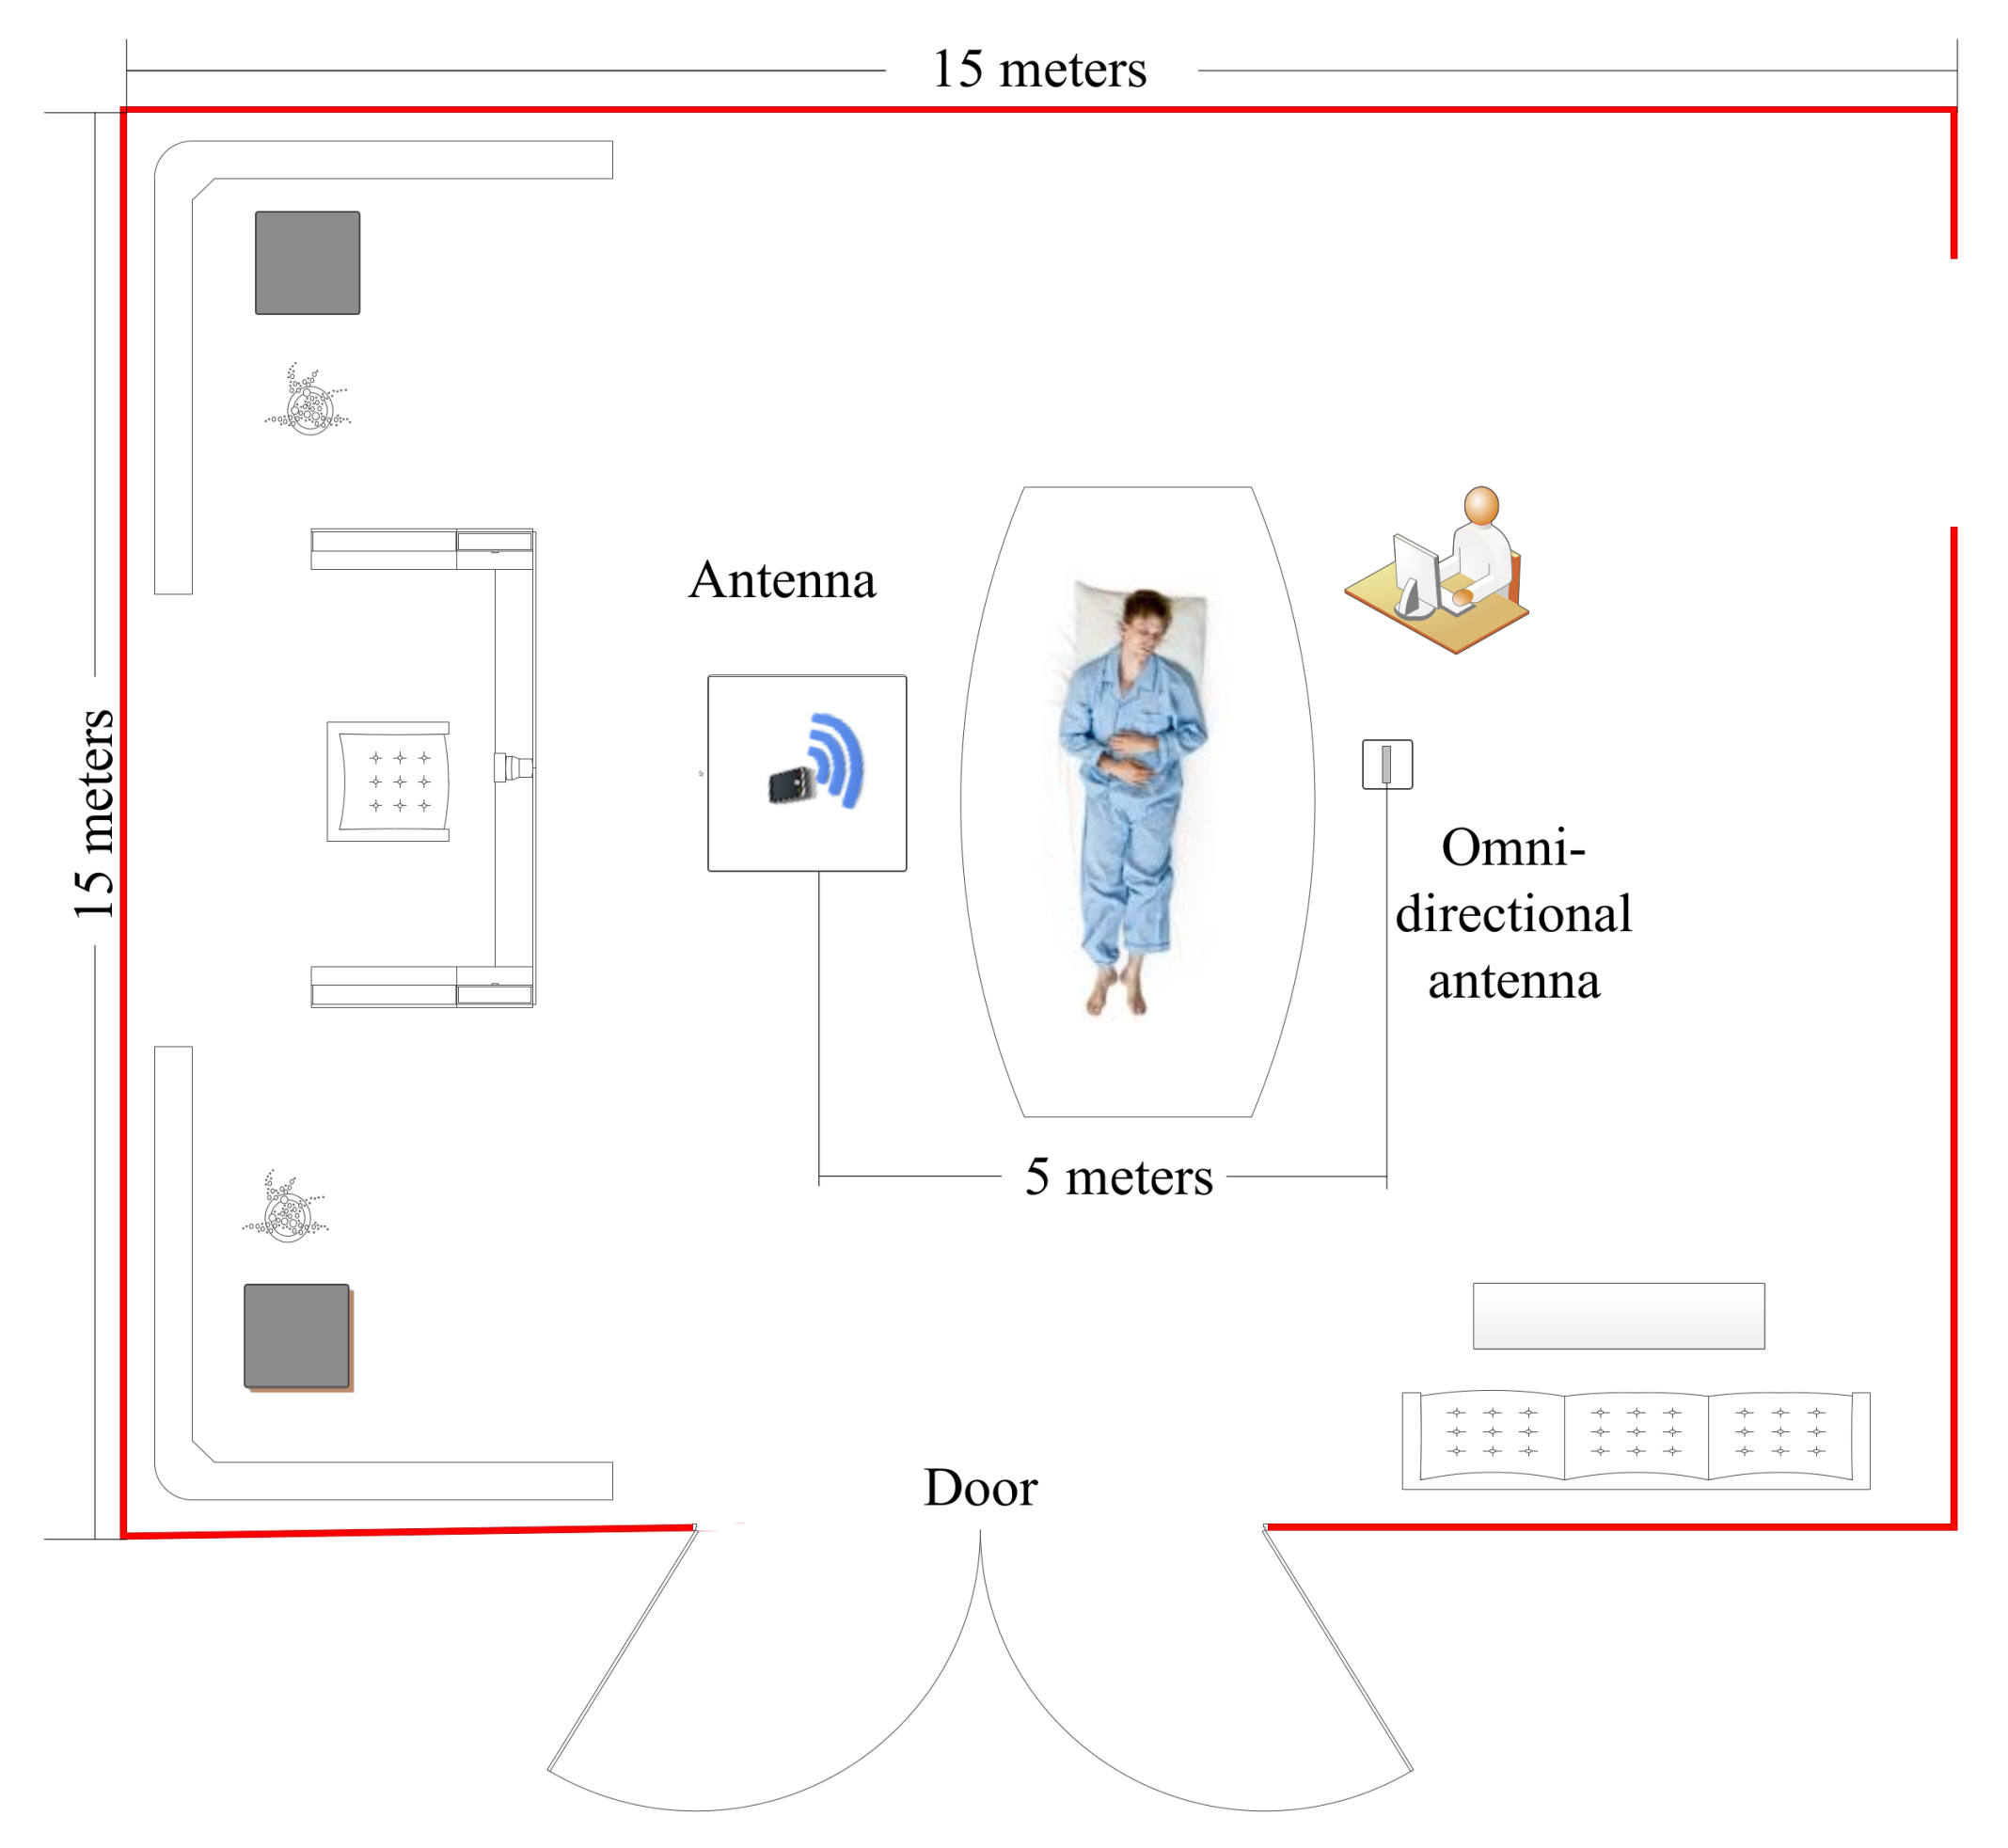
The experimental design was implemented in a meeting room at Xidian University, as shown in Figure 1. An antenna which is in the range of S-Band (2 GHz to 4 GHz) was deployed as the transmitter and a 2.4 GHz omni-directional antenna working as a receiver. The wireless channel information extraction tool introduced by [16] was installed. The host computer receive 10 WCI packets per second [17]. From each WCI packet received using the specific NIC, a 30 1 matrix was extracted known as channel frequency response (CFR) and can be written as:

Figure 1.
Experimental setting for respiration monitoring.
Here hi is a complex number and describes channel frequency response of the ith frequency and n = 30 is the total number of frequencies. In order to examine the time history of a total number of WCI packets received over a period of time, the CFRmatrix is put together recorded at various time intervals and forms a WCI time history stream as:
Here is a 30-x-1 matrix, where k represents the total number of WCI packets received within a particular time window.
Figure 2 indicates the variances of raw WCI due to the subject’s chest movement, which will be used to extract the breathing pattern in the subsequent section. In order to extract the breathing pattern, we select the frequency # 13 as in [15]. We have examined all the 30 frequencies for detecting breathing pattern and compared the results with digital respiratory sensor. The main advantage of using S-Band sensing which exploit the NIC is that one or multiple frequencies out of 30 can be used for desired purpose. We tested the proposed framework in 8 various places that had different geometry and structure. In 7 cases, frequency # 13 provided the best results when observed through the digital respiratory sensor. Only at one place, the frequency # 12 provided results closely matched to the digital respiratory sensor. The primary reason that frequency # 13 provides best results because it is available to all wireless local area network systems but rarely used making it less prone to interference.
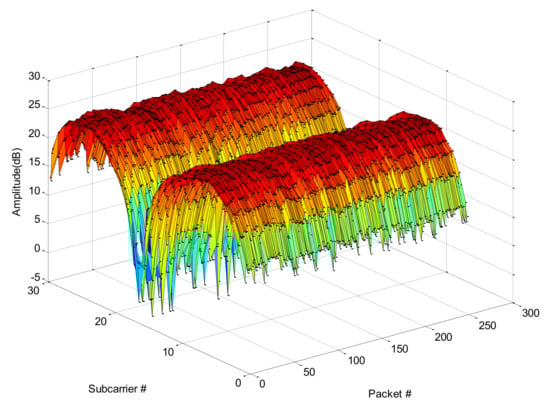
Figure 2.
The raw wireless channel information (WCI) amplitude information received for breathing pattern detection.
4. Rational of Using S-Band Sensing for Breath Detection
This section gives an intuition about how the S-Band sensing technique leveraging wireless channel information can be used to track subtle chest movements for breath detection. Ideally, an RF signal propagates directly from transmitter to receiver when no obstacle is encountered, is known as line-of-sight (LOS) communication. When an obstacle is encountered, the signal experiences scattering, reflection, and diffraction. This is known as non-line-of-sight (NLOS) communication. The signal received through LOS and NLOS communication will have different WCI data [18,19]. The signal propagation continuously moves back and forth between LOS and NLOS due to person’s chest movement, as a result the WCI data retrieved are significantly different. For breathing pattern detection, in almost all scenarios, the minute chest movement keeps on changing the communication path between LOS and NLOS. The RF signal propagating from transmitter to the receiver will always have a LOS communication path and a lot of NLOS communication paths. When the subject is inhaling and exhaling, the received RF signal will continuously keep on changing due to reflections caused by the person’s chest movement.
5. Overview of the Proposed Method
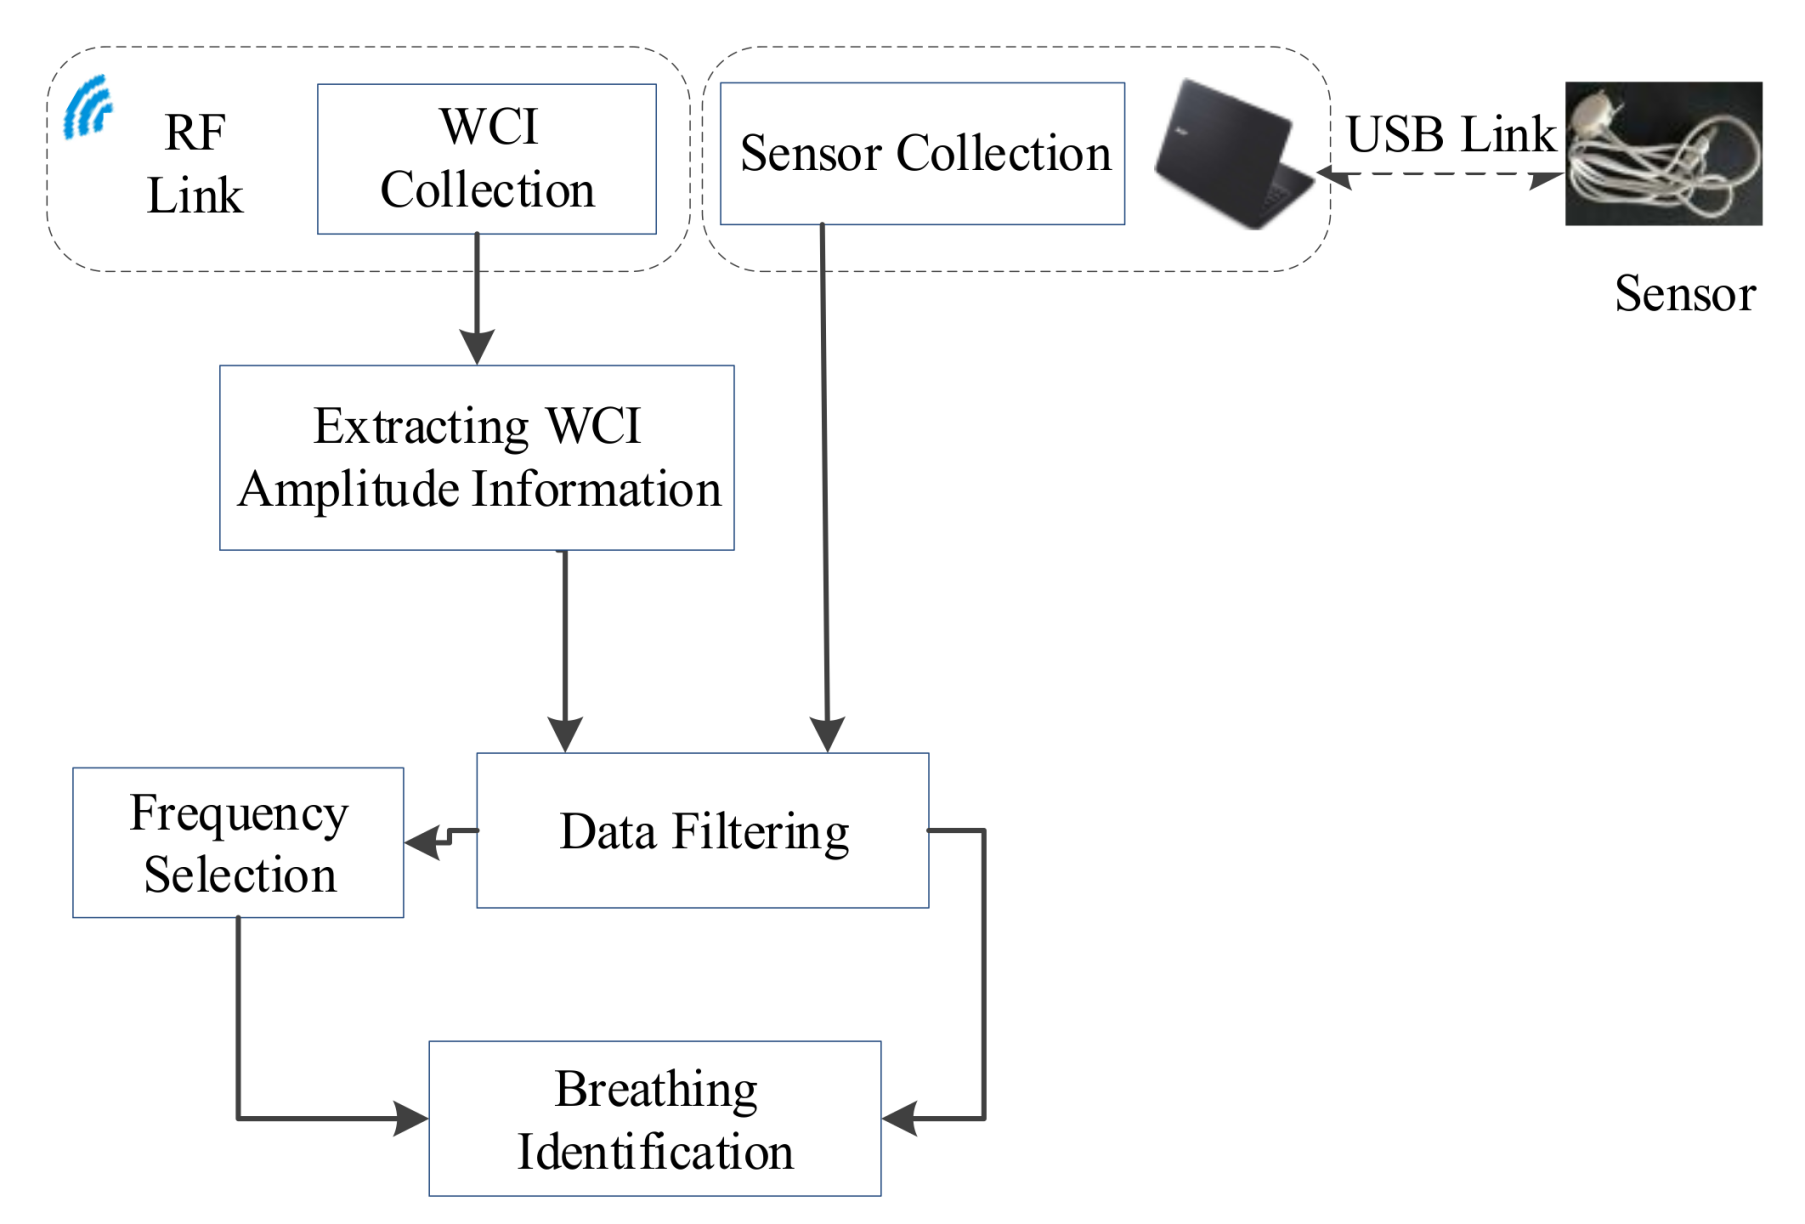
The system architecture designed to monitor the breathing of patient suffering from hyperthyreosis, sleep apnea and SIDS diseases consist of two main components as shown in Figure 3. Identification of breathing pattern using a wearable digital respiratory sensor, and breathing pattern monitoring using S-Band sensing technique leveraging wireless channel information. From raw WCI data, the amplitude information is extracted which is examined against the time history using an individual frequency. The variances of amplitude information are then passed through a filtering process, using wavelet filter. The variances of amplitude information are then analyzed and compared with the data collected with a wearable sensor to see if they can be attributed to the normal breathing or abnormal breathing.
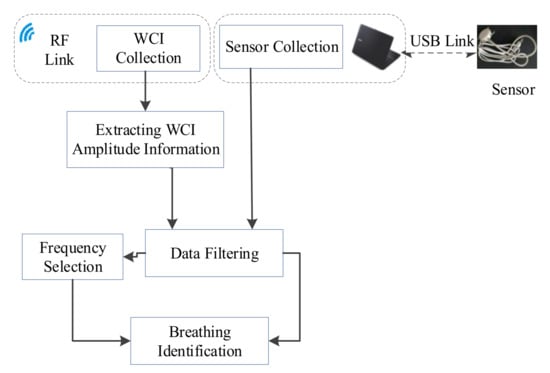
Figure 3.
System architecture for breath monitoring.
Noise Filtering Process
The noise contained in the data collected using the wearable sensor as well as in the wireless channel information should be removed. The wavelet filter presented in [20] is used to remove the noise and smoothens the rising and falling edges appeared in the received signals critical for tracking the normal and abnormal breathing. The advantage of using wavelet filter over other filters such as Chebyshev or Butterworth is due to its better performance considering the high-frequency noise.
6. Tracking Person’s Breathing in Typical Environment
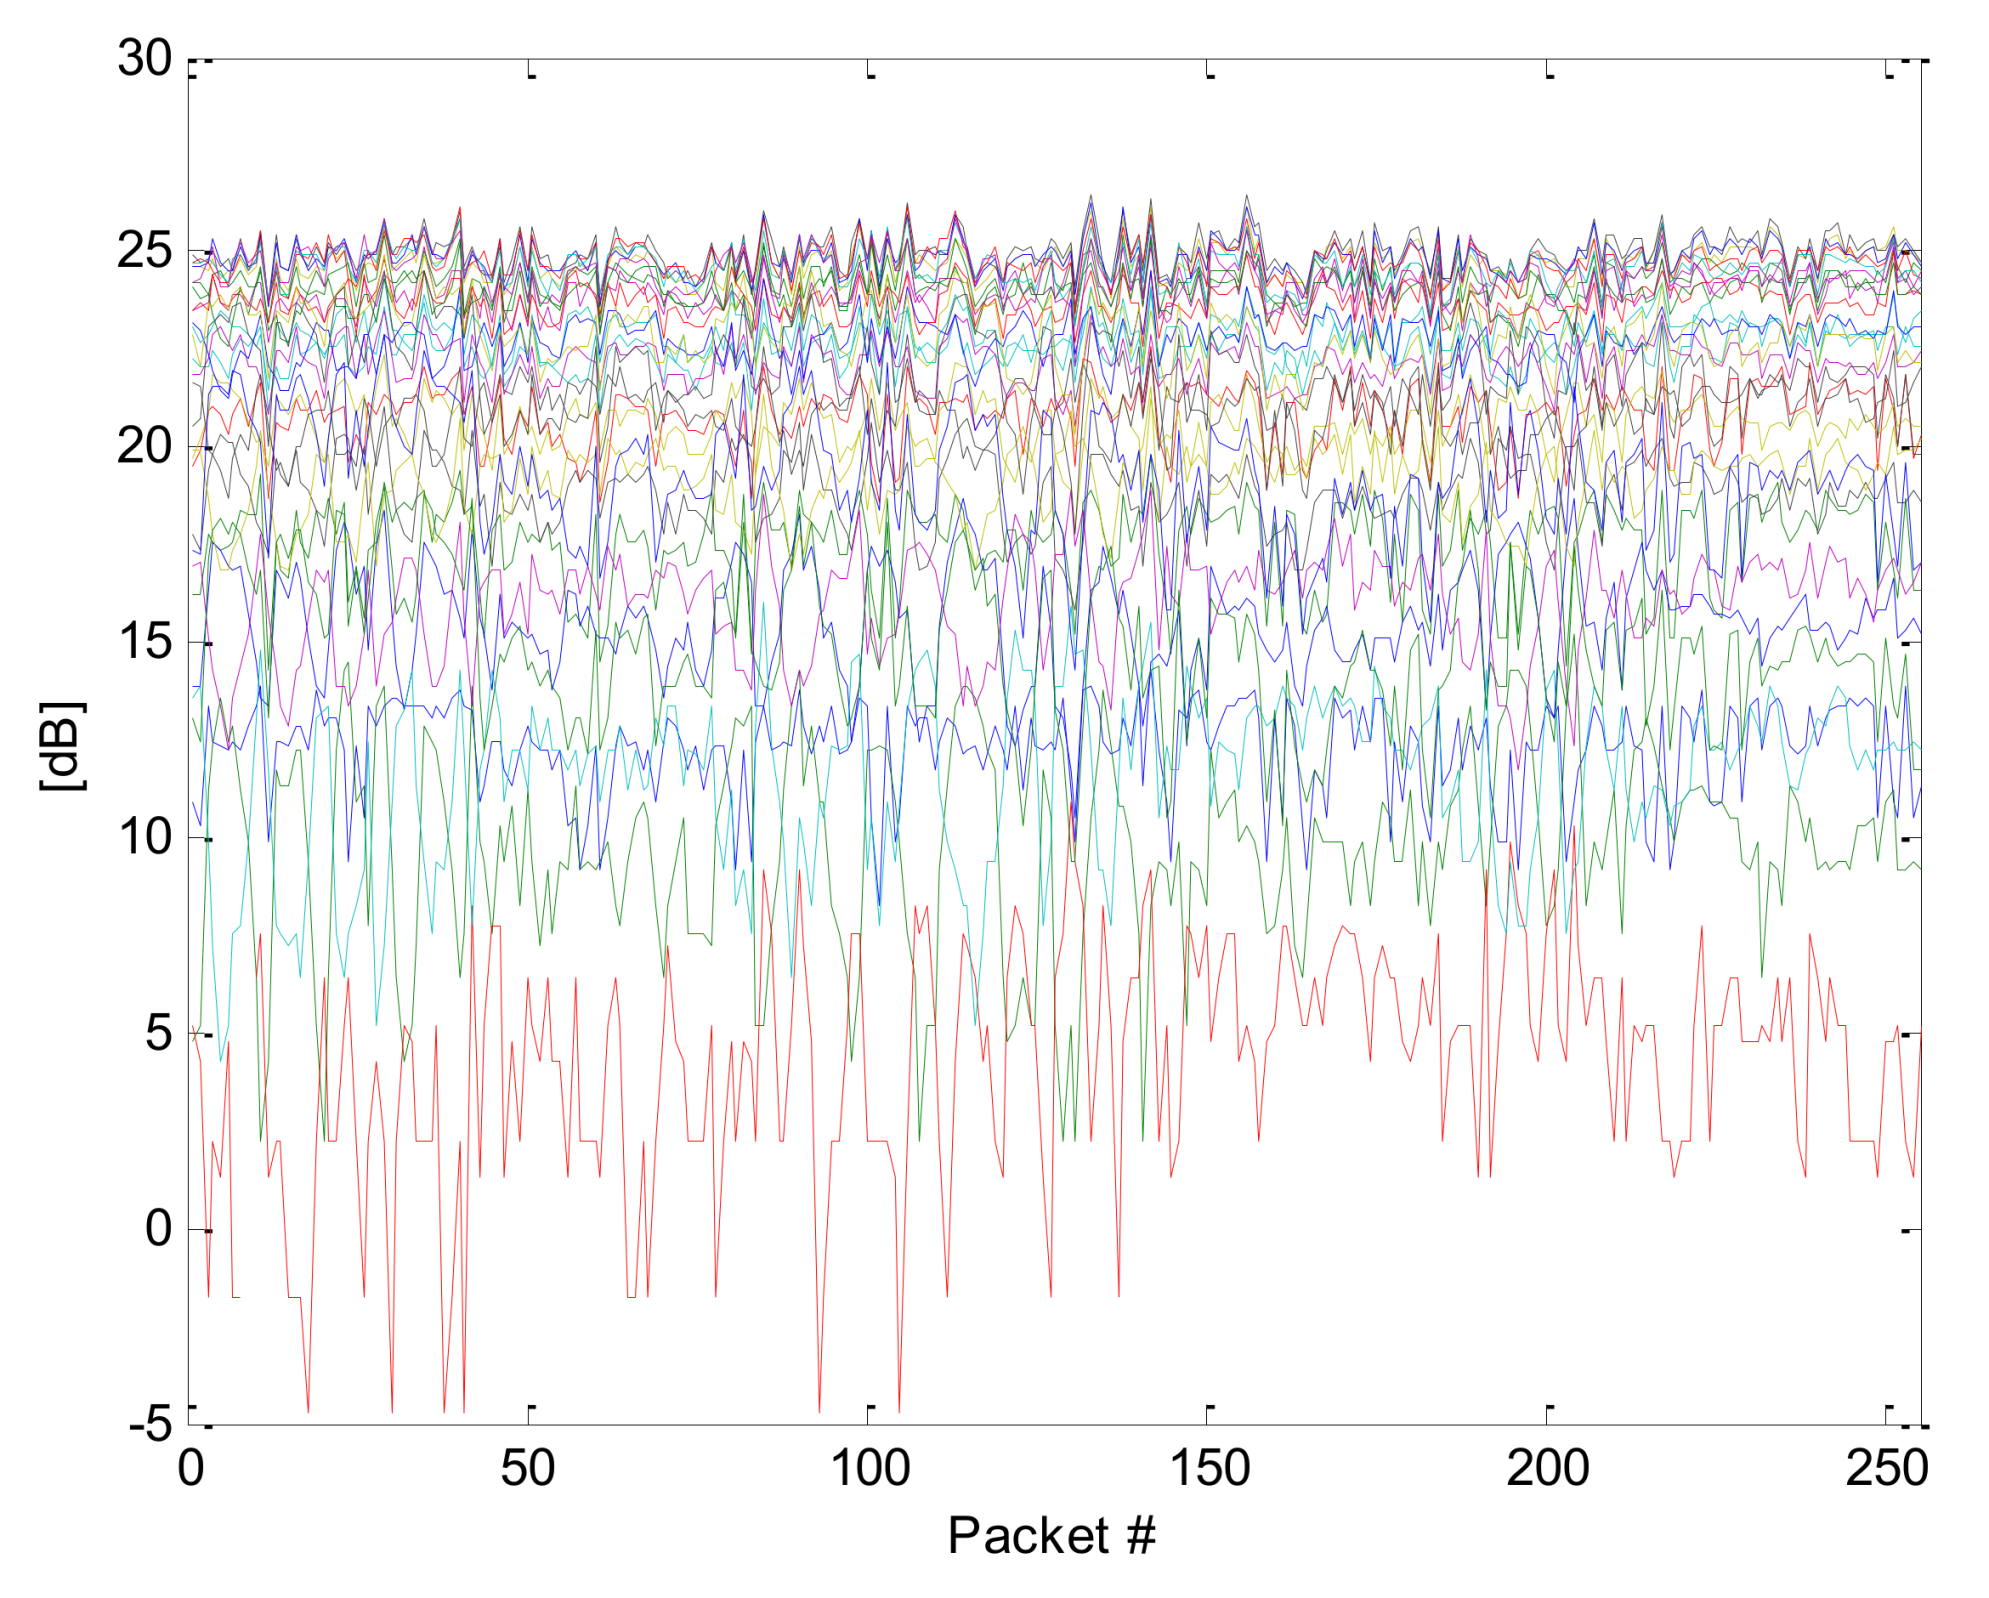
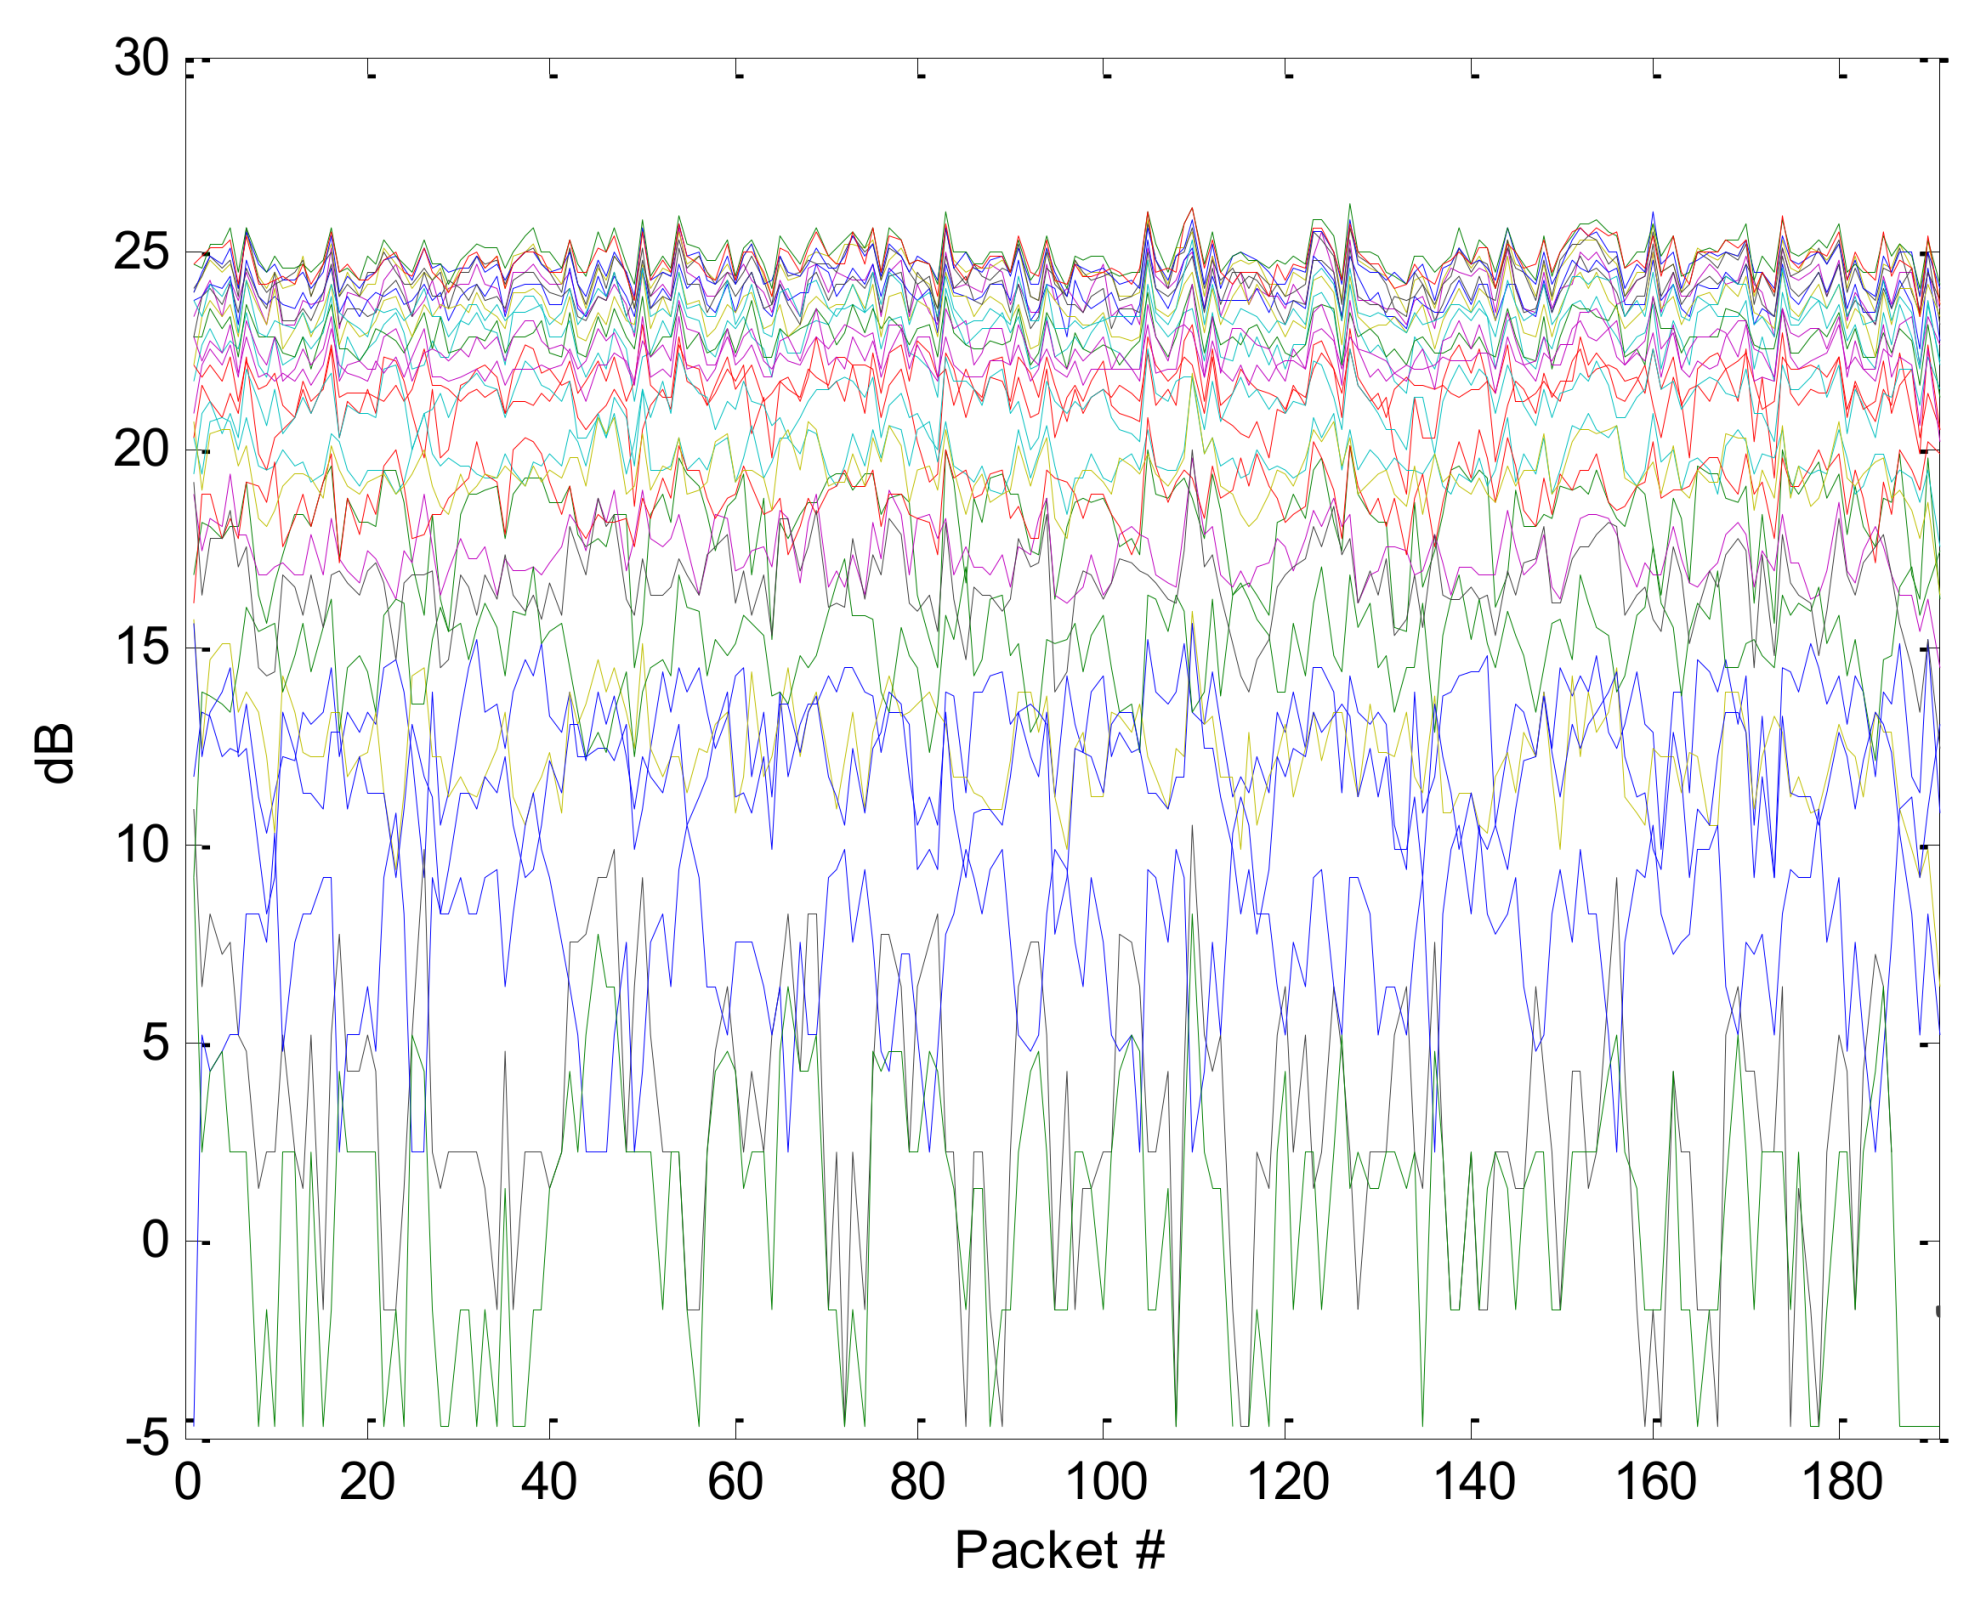
This section presents the details regarding the proposed method of tracking breathing under typical conditions when person lay on the back. The individual CFR sequence i.e., the individual frequency is selected to accurately estimate the breathing pattern of a person. Figure 4 shows the variations of amplitude information of all 30 frequencies against packet number retrieved over a period of time.
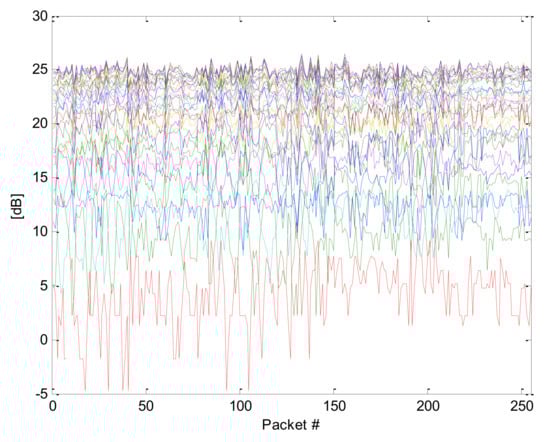
Figure 4.
The channel frequency response (CFR) sequence of all frequencies obtained during experiment.
6.1. Analysis of Measured Data for Normal Breathing
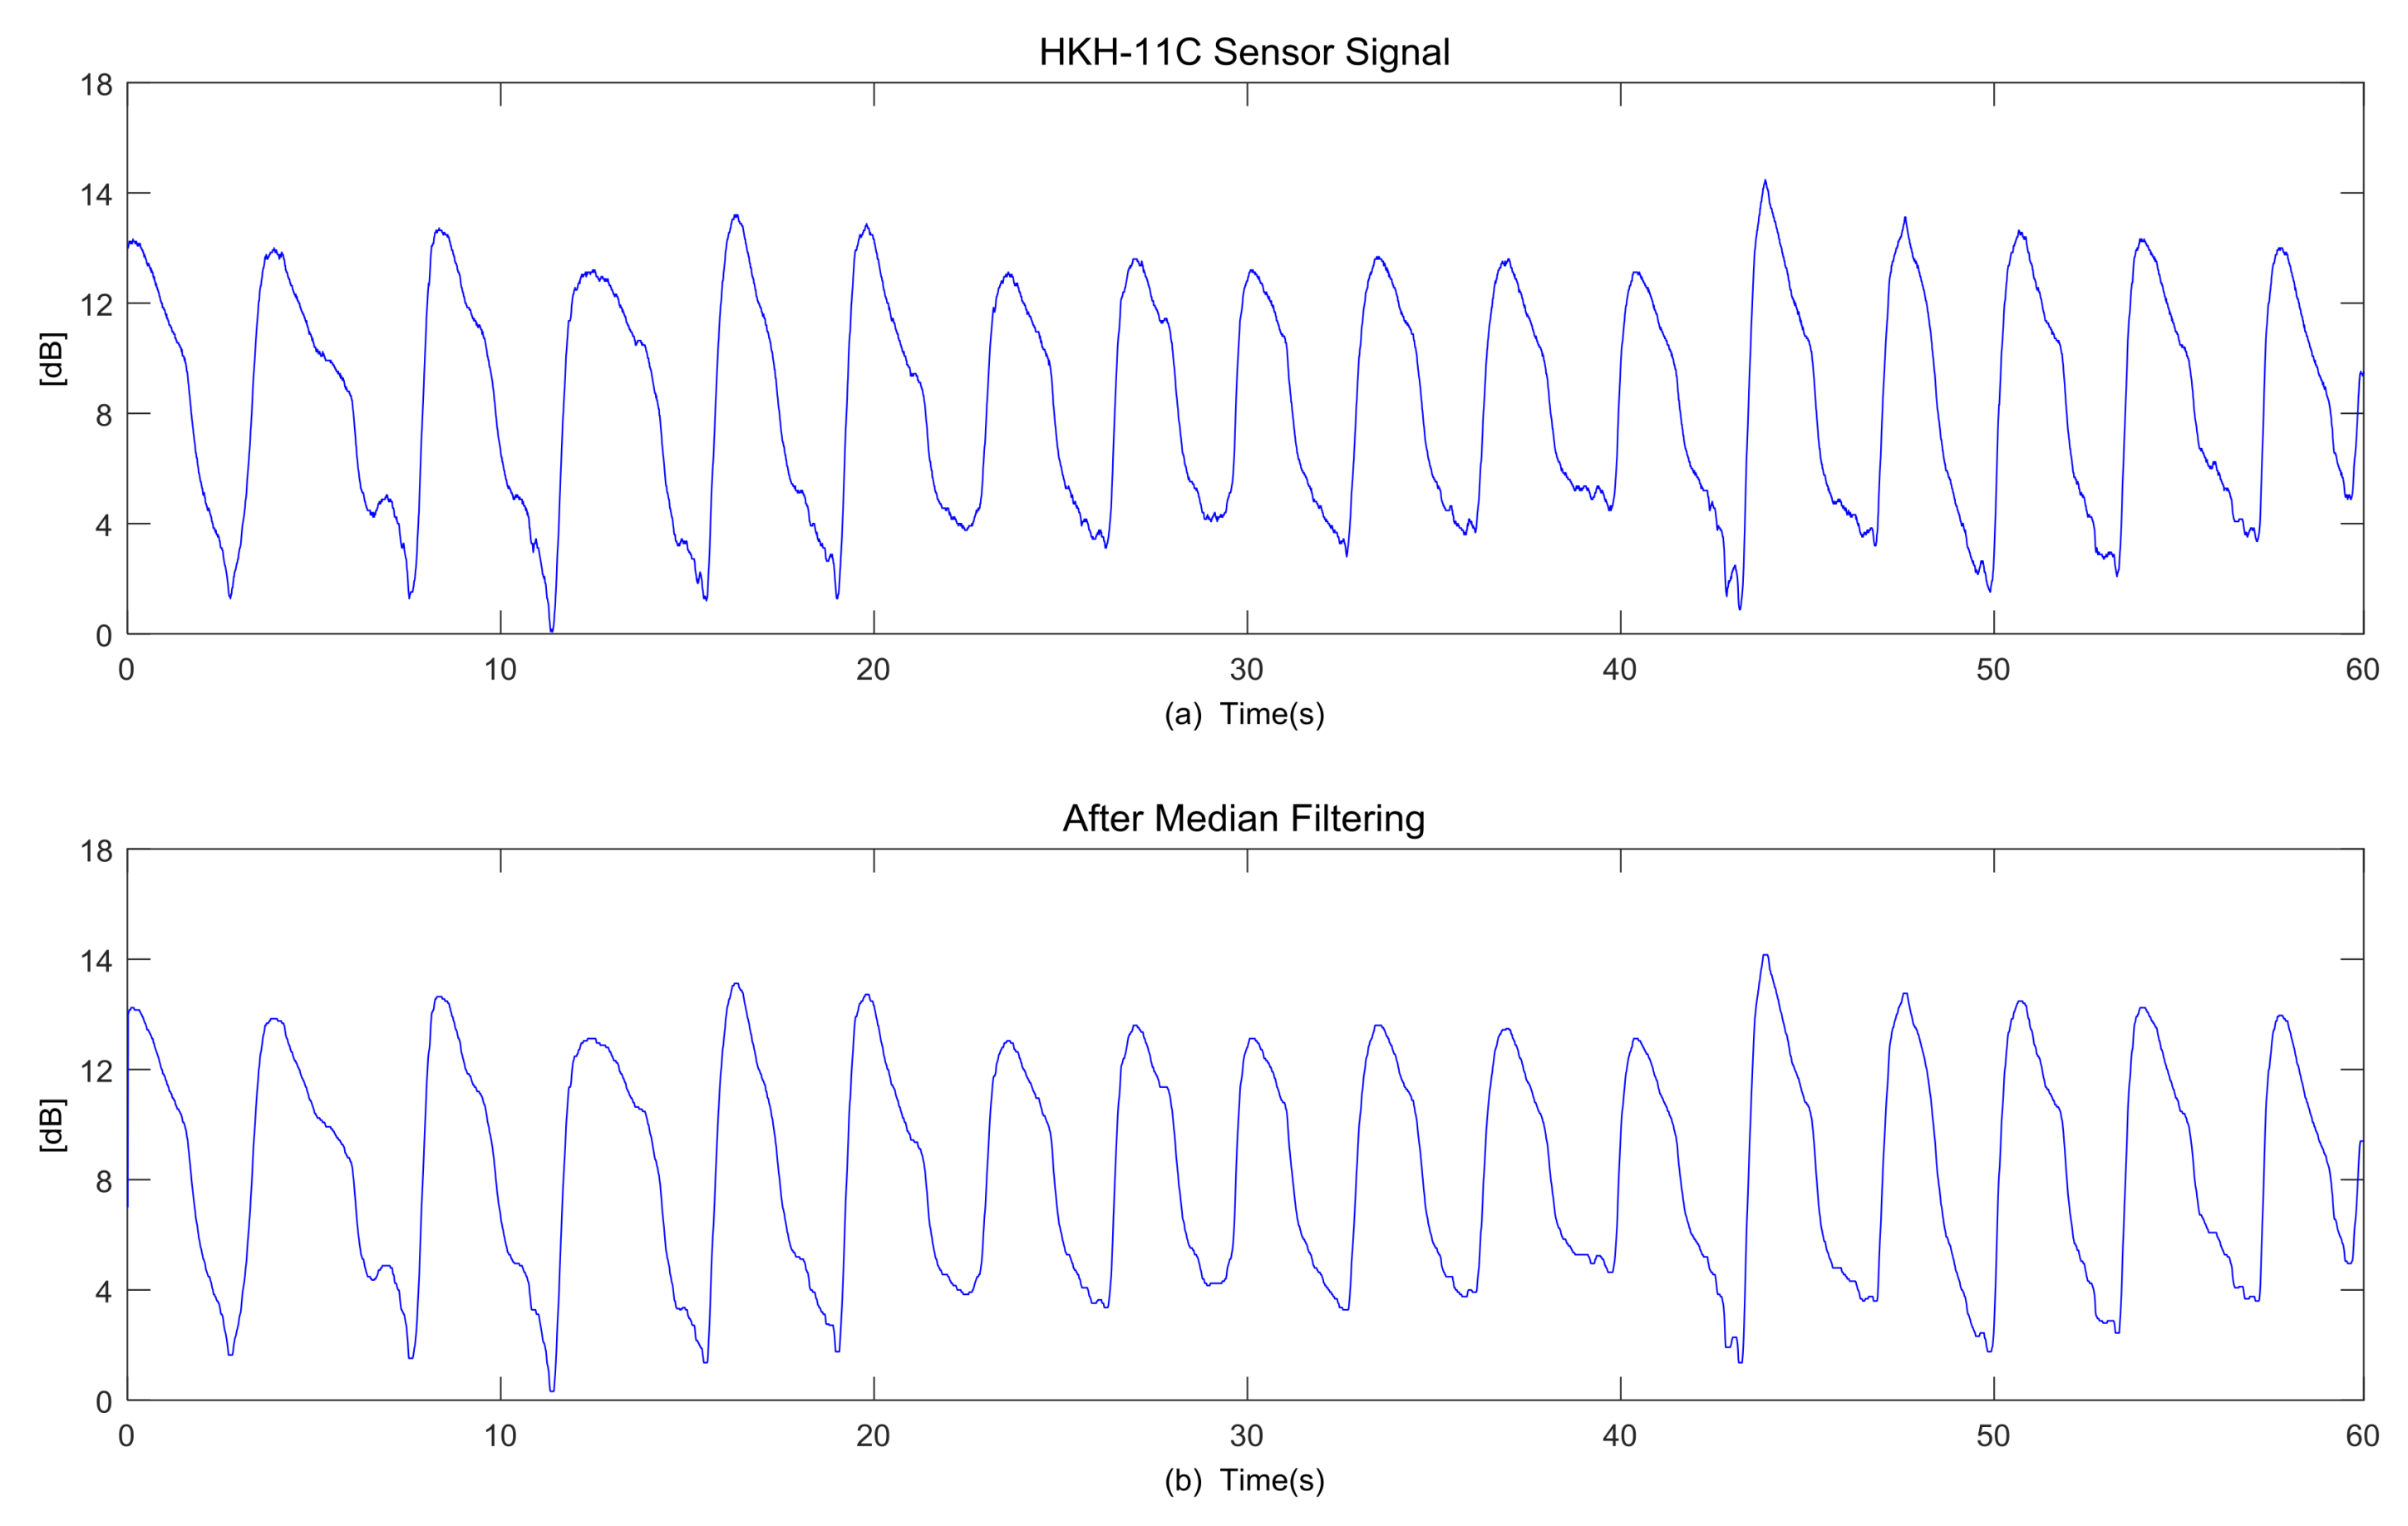
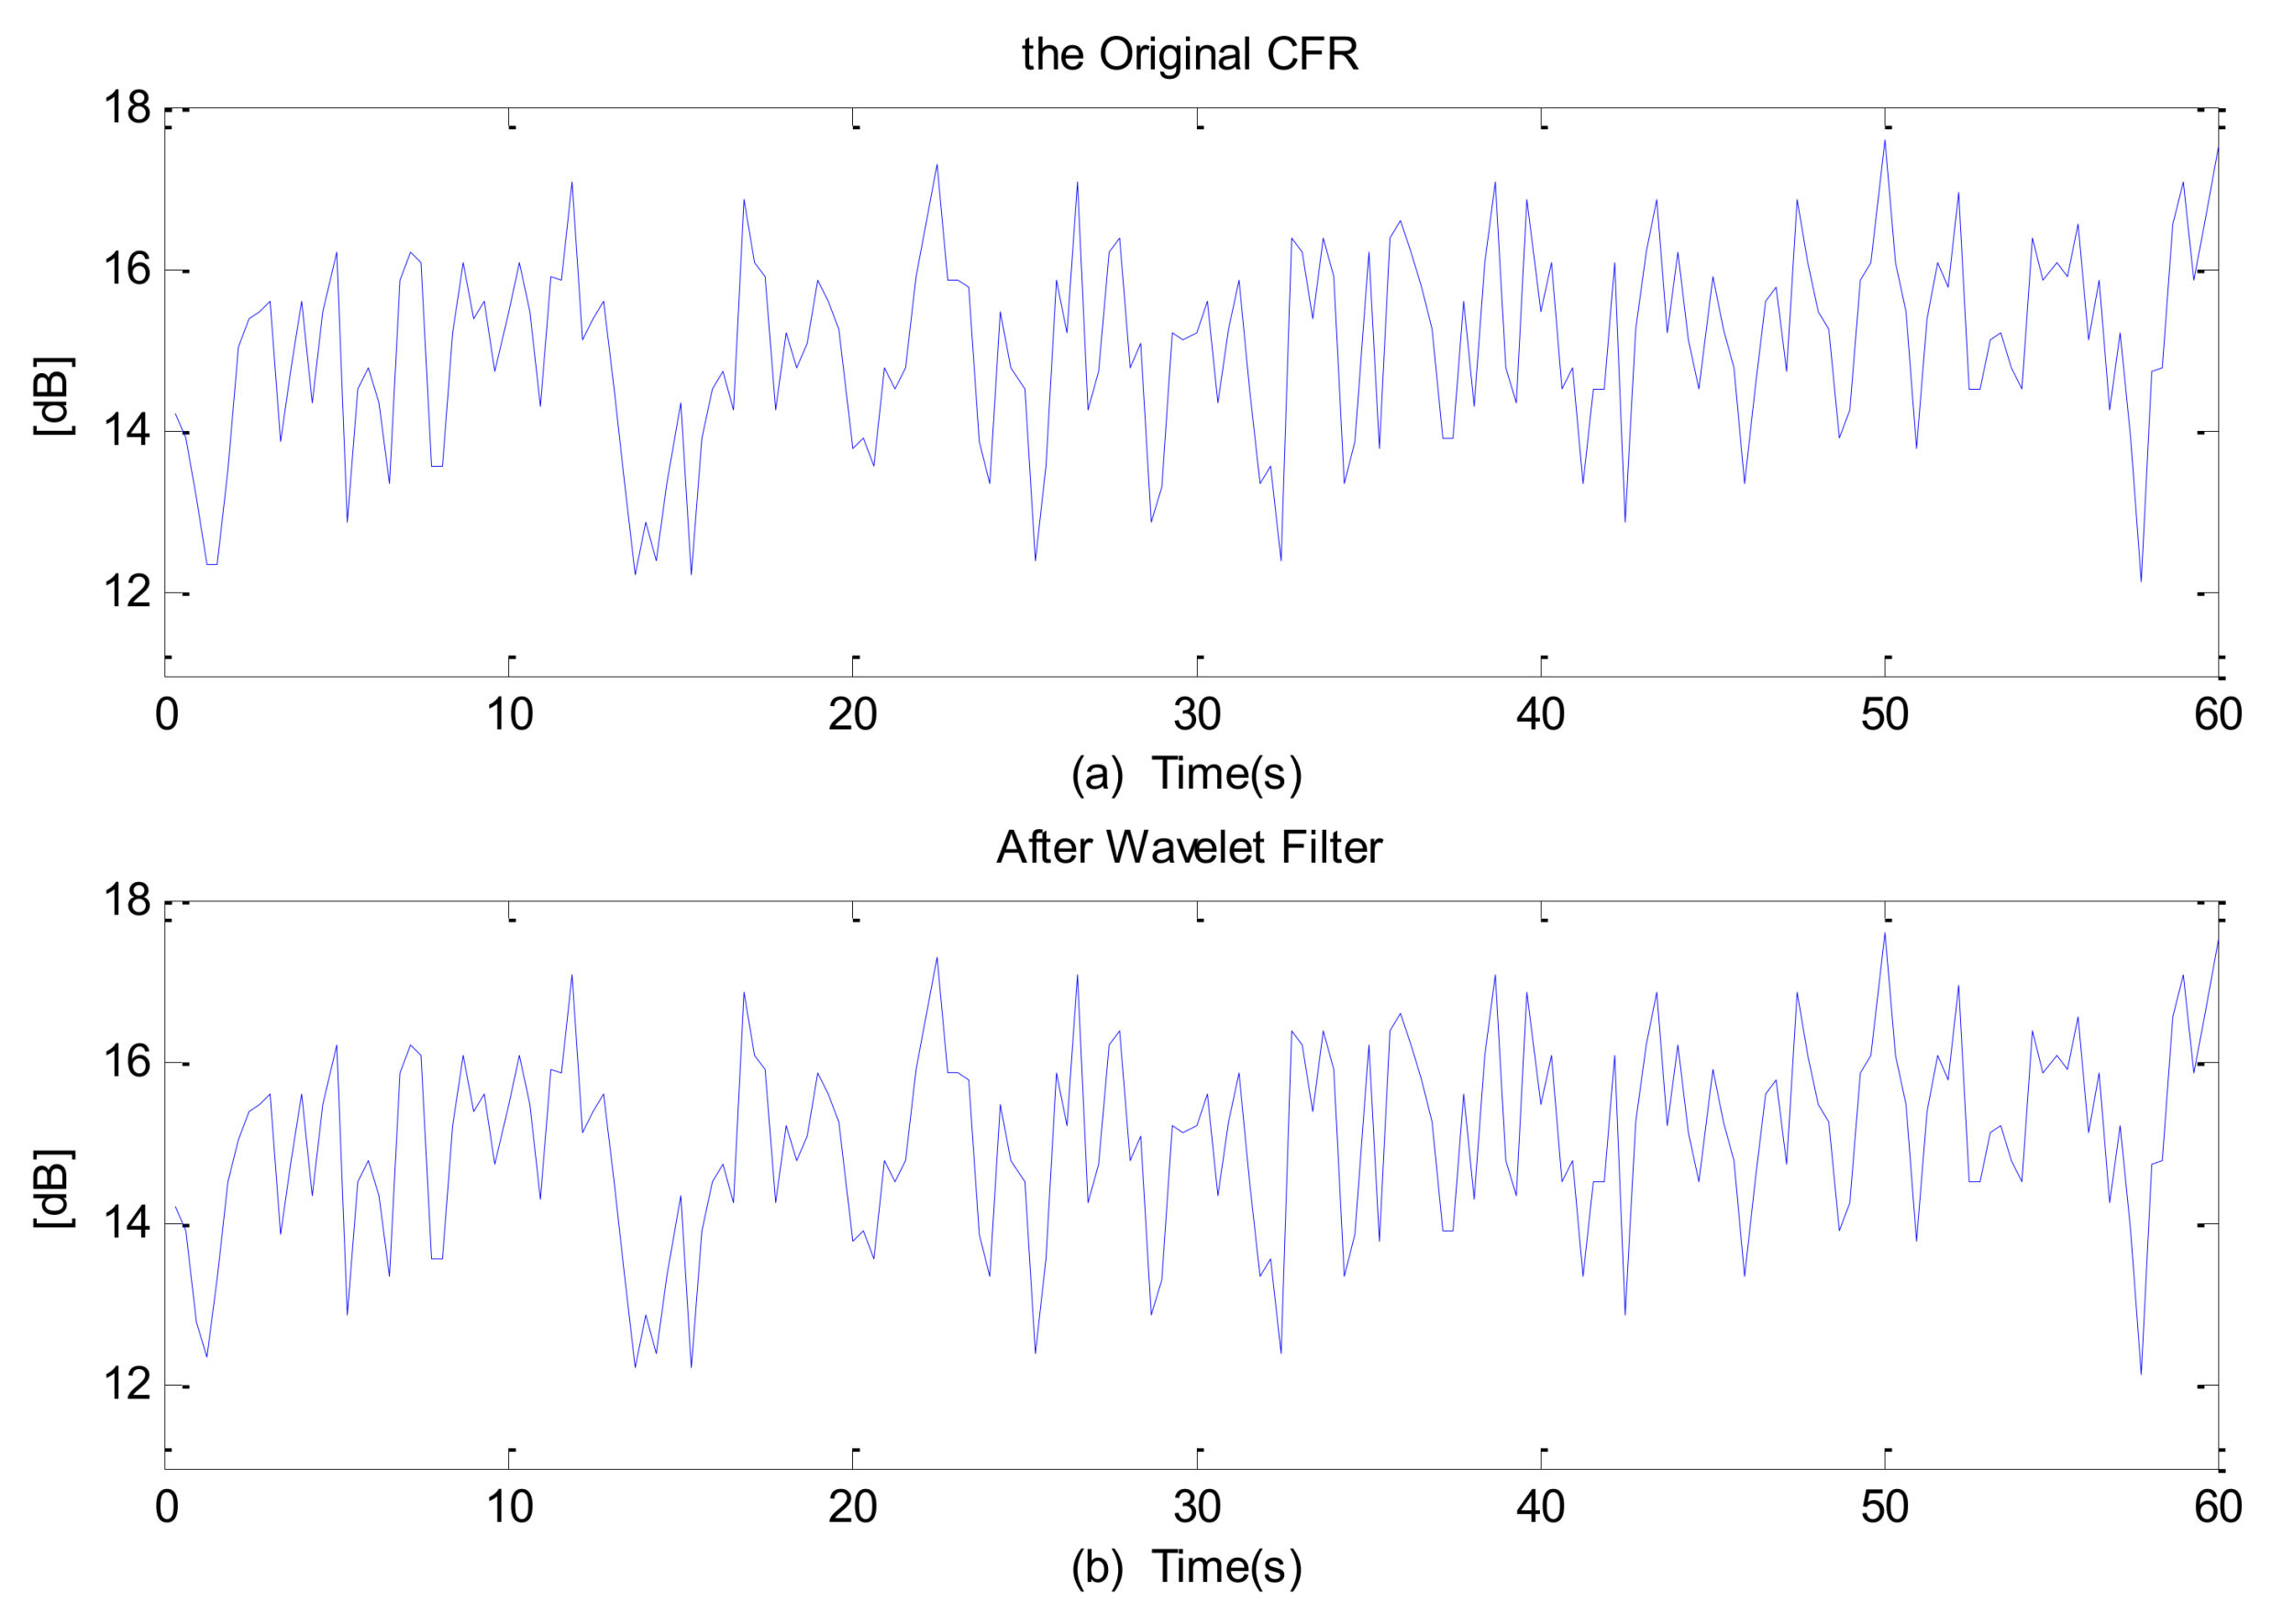
Figure 5 indicates the breathing pattern of a person lying in a straight position on the back. The measurements were taken for 60 s. Figure 5a shows the raw breathing pattern obtained using respiratory sensor and Figure 5b shows the filtered estimated breathing pattern. The person, in this case, completed nearly 16 breathing cycles. We further examine the breathing pattern obtained using S-Band sensing leveraging the wireless channel information.
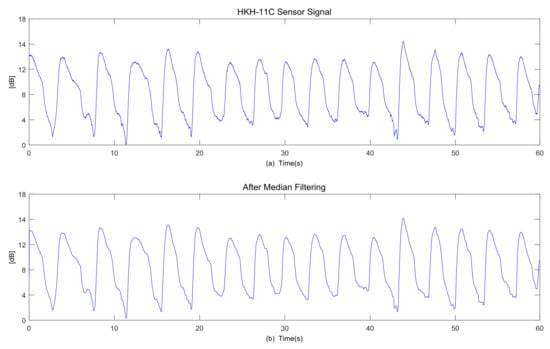
Figure 5.
Estimated breathing pattern obtained using Digital Respiratory Sensor. (a) Raw breathing pattern obtained; (b) Filtered breathing pattern obtained.
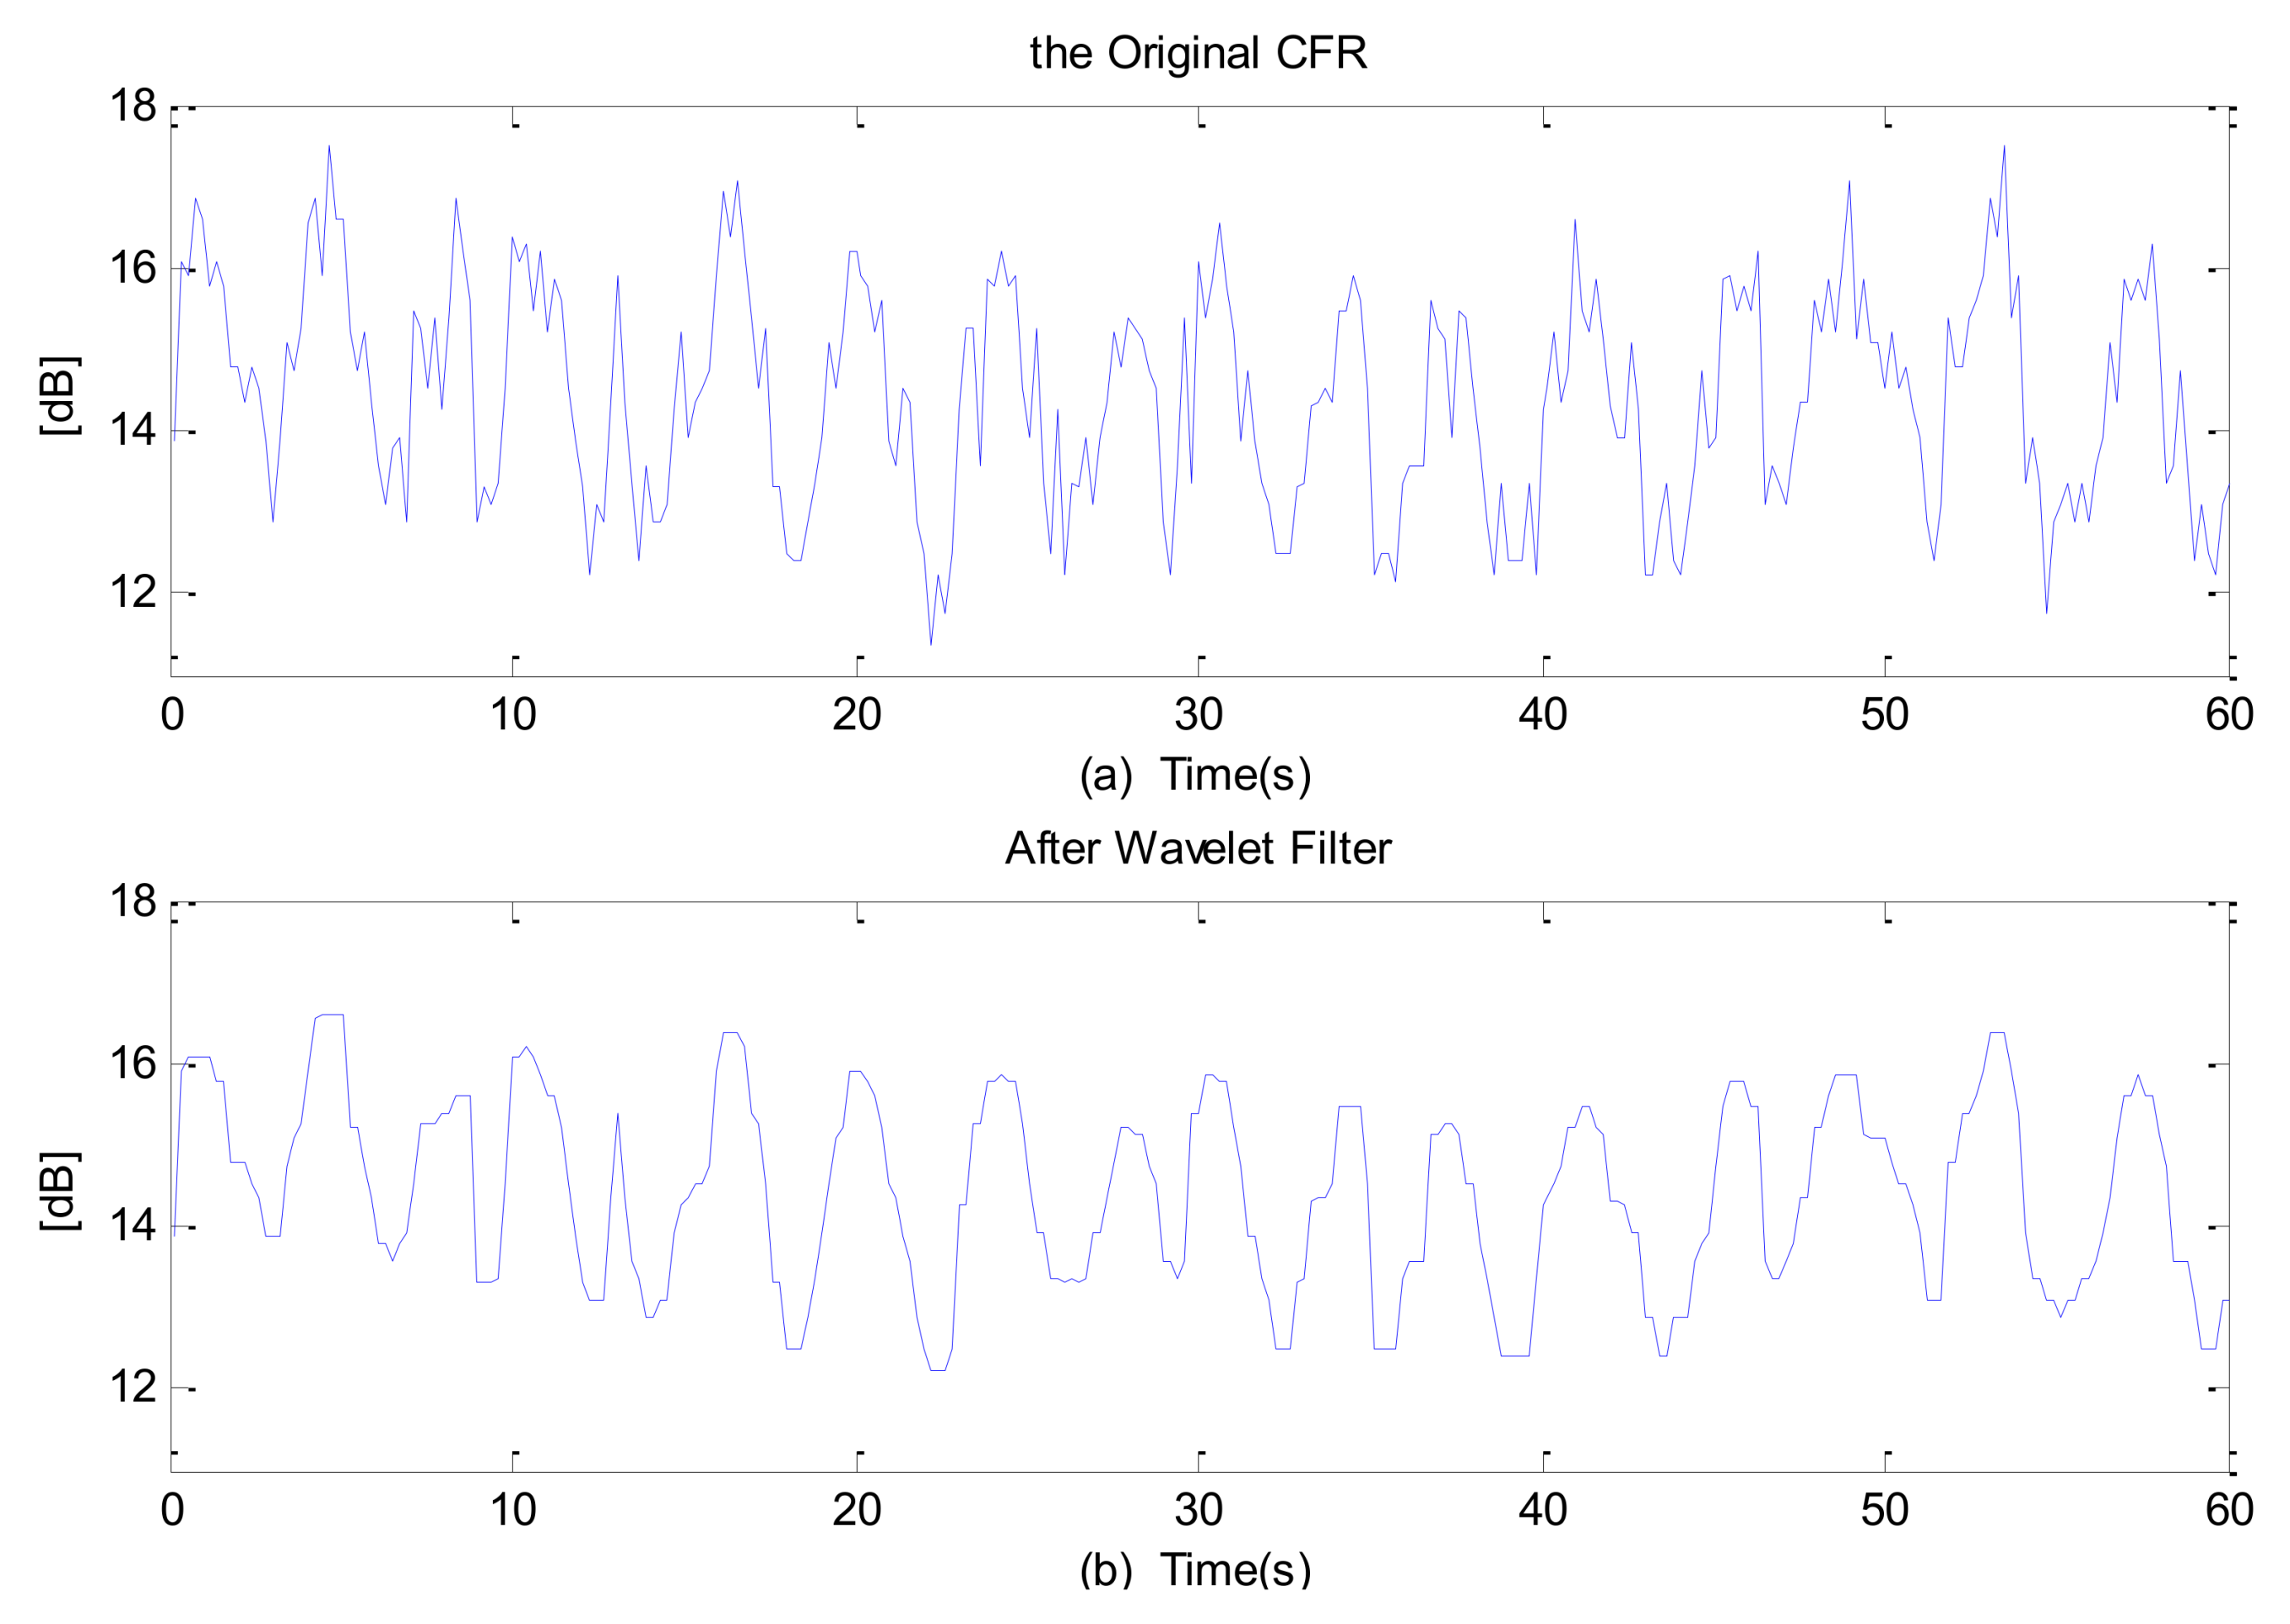
The frequency-selective fading poses various extents on the RF signal considering different frequencies. As shown in Figure 6, different frequencies have different variations with respect to time for different power levels. Thus we select frequency # 13 that best describes the breathing pattern of the subject as illustrated in Figure 6a. The data obtained for the particular frequency was then passed into the wavelet filter to remove the sharp edges and smooth the signal. Comparing the breathing pattern shown in Figure 6b with the one in Figure 5b, we observe that both the waves forms obtained are identical considering the number of cycles during the same time period.
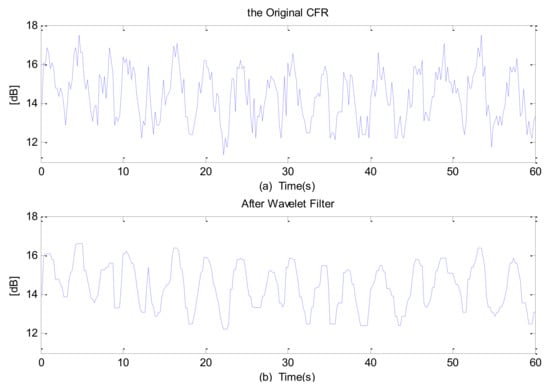
Figure 6.
The breathing pattern obtained using S-Band sensing. (a) Variances of raw amplitude information of frequency # 13; (b) Filtered breathing pattern of the individual frequency.
6.2. Tracking Abnormal Breathing
In the prevision section, we described how S-Band sensing technique can be used to track person’s normal breathing and compared the measured data with that of a wearable sensor. We now present the measurements obtained for tracking person’s abnormal breathing, one of the conditions experienced by a patient suffering from hyperthyreosis disease. We used the typical experimental environment and asked the volunteer to breathe abnormally. Hence, we collected the raw amplitude information for 30 frequencies by retrieving 200 WCI packets over a period of time as shown in Figure 7.
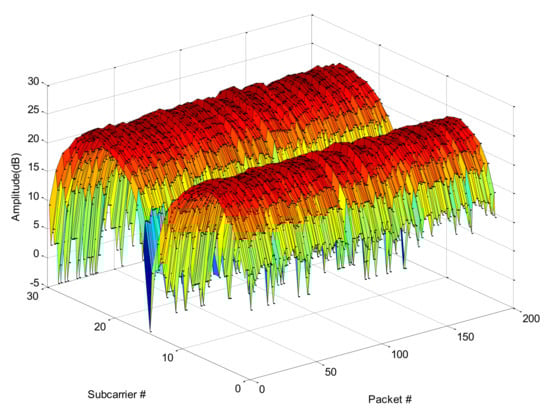
Figure 7.
Raw amplitude information received for tracking abnormal breathing.
We follow the same procedure as described earlier, and examine all the frequencies to extract the abnormal breathing. The patient was observing abnormal breathing during the process and we opted the frequency # 13 for data analysis from Figure 8. Thus we examine the same frequency for tracking abnormal breathing and compare the measured results with wearable breathing sensor.

Figure 8.
The CFR sequence of all frequencies obtained for abnormal breathing.
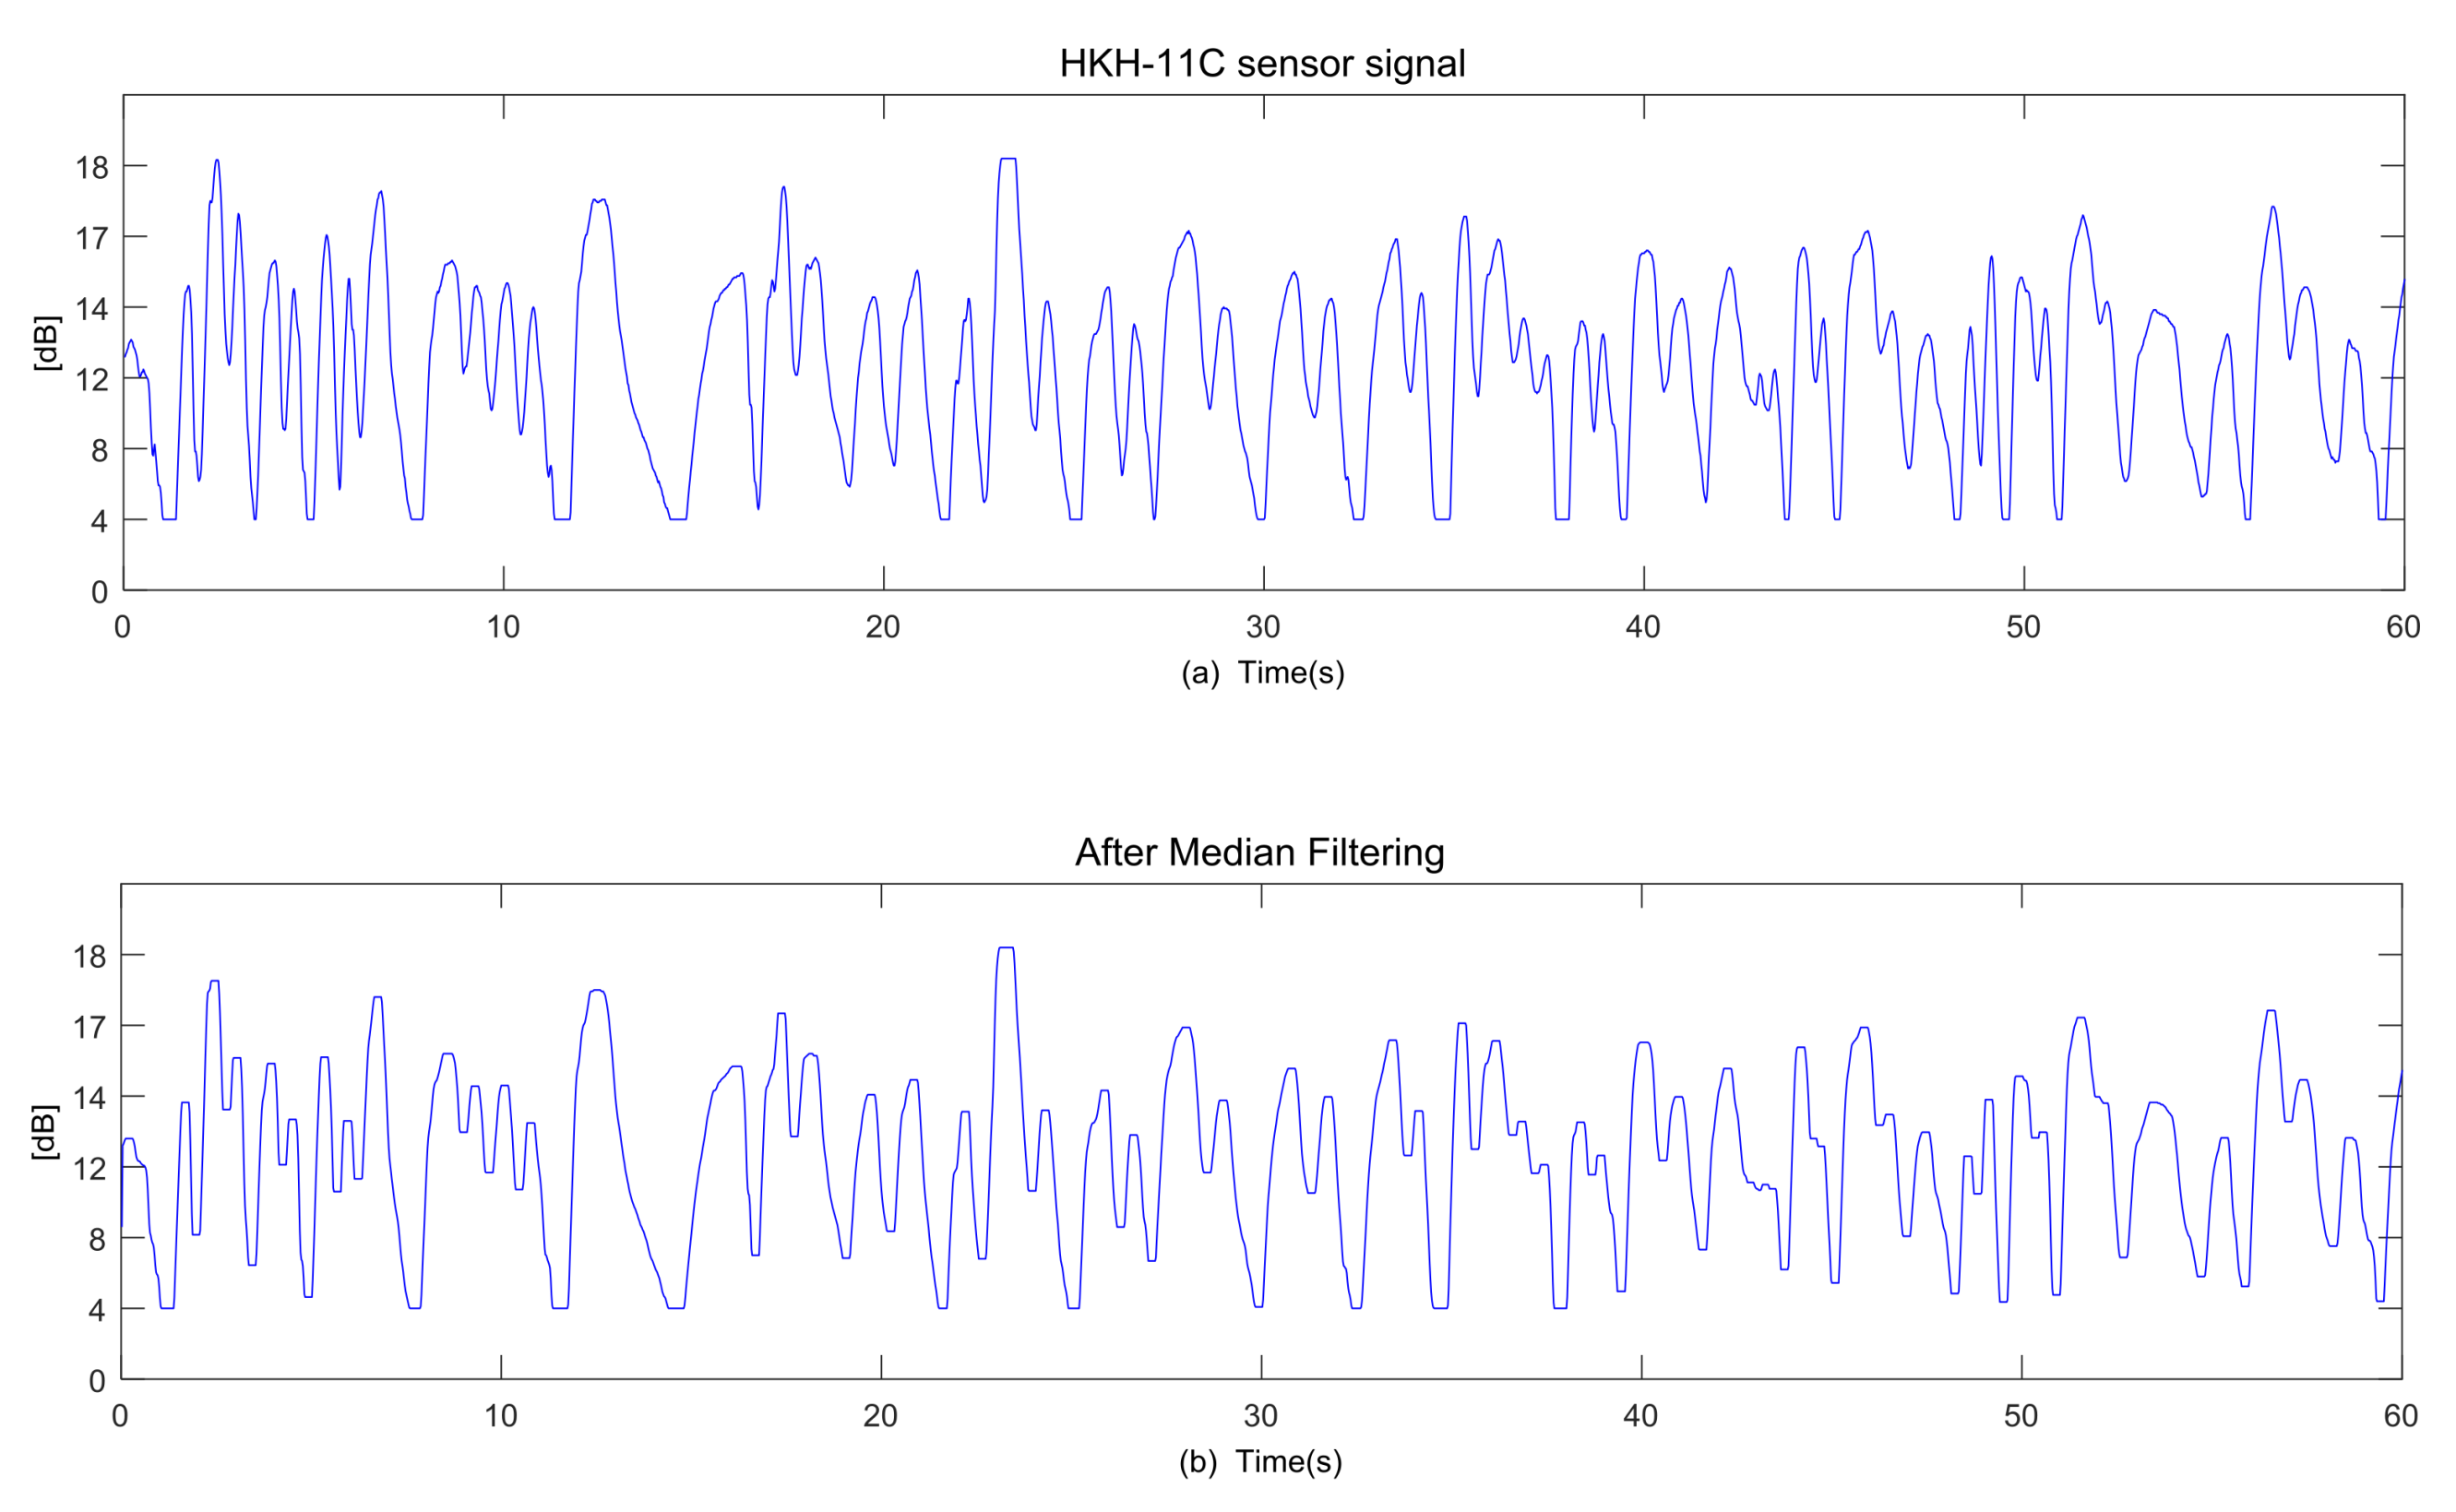
Figure 9 shows the data obtained using the wearable sensor to track the person’s abnormal breathing pattern. The raw data measured for 60 s show clear signs that the person was experiencing abnormal breathing while filtering out the measured data also indicate the same. A clearly non-periodicity can be observed. We further analyze the data retrieved using S-Band sensing as shown in Figure 10a that present raw breathing patterns and Figure 10b which shows filtered breathing pattern and see whether it is able to detect the abnormal sleeping pattern or not.
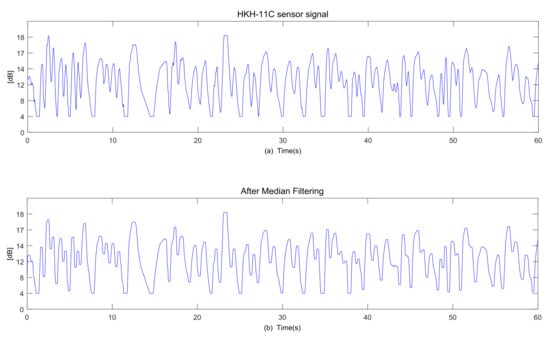
Figure 9.
Abnormal breathing pattern tracked using Digital Respiratory Sensor. (a) The original data measured for abnormal breathing; (b) Filtered abnormal breathing pattern obtained.
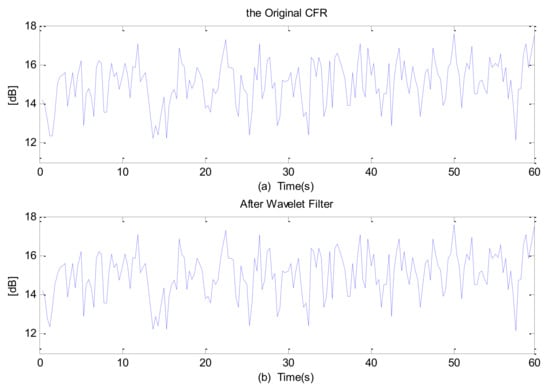
Figure 10.
Abnormal breathing tracked using S-Band. (a) Variations of raw amplitude information for frequency # 13; (b) Variances of amplitude information filtered using wavelet filter.
The person in this scenario was asked to breathe abnormally which was finely tracked by the wearable sensor. The primary indicator in the particular case was the breathing sensor which did not present any periodicity. The same principle is applied here. The raw and filtered amplitude information indicates a clear non-periodicity for a period of time which indicates the abnormal breathing when the subject was laying on the back (straight position).
Spearman’s Rank Correlation
We used Spearman’s rank correlation to find out correlation between the breathing signals obtained through wearable sensor and S-Band. The Spearman correlation is based on rank method. The coefficient of correlation is calculated by rank differences. On the basis of rank differences, we find out the correlation between two signals. The advantage of Spearman’s correlation coefficient is that the computation is quicker, especially when number of observations is limited. The method is useful for series of data such as rank, scores, etc. The formula for Spearman’s correlation coefficient is as written follows:
Here rk is the coefficient of rank correlation, D denotes the rank differences, and N is the number of pair observations. The value of rk lies between +1 and −1. Positive value shows that the direction of rank is the same and negative value shows that the ranks are given in opposite direction. We have compared the two signals obtained using wearable sensor and S-Band sensing as shown in Figure 5b and Figure 6b, respectively. The Spearman’s correlation coefficient obtained is 0.89 which employs that the value is positive and close to +1. We then compare the two waveforms for abnormal breathing as in Figure 9b and Figure 10b. The rk value obtained is 0.86 which is positive that means the direction of rank is same. Hence we can conclude that the signals obtained using wearable sensor and S-Band are identical considering both cases.
7. Conclusions
This paper presented monitoring of vital signs experienced by patients suffering from various diseases such as hyperthyreosis, sleep apnea and SIDS diseases using S-Band sensing technique. The results obtained indicate that the wireless channel information can be used to monitor the breathing pattern and efficiently detects the abnormal respiratory when compared to the data retrieved using wearable sensor. However, the results we presented were preliminary findings of the breathing pattern of a person lying in supine position. The experiment was performed eight times on six different subjects at eight different locations lying in particular posture. The authors aim is to use the proposed framework as a foundation to develop an advanced level model that can detect subtle chest movement for various body postures on bed such as right lateral, left lateral, and fowler. The model would also be able to detect the patient’s heartbeat which is one of the vital signs that needs to be monitored in order to assists the caregiver or doctor in home or hospital environment.
Acknowledgments
The authors would like to thank Dou Fan for data processing.
Author Contributions
Lu Liu, Syed Aziz Shah performed the experiment and wrote the paper; Guoqing Zhao and Xiaodong Yang contributed the idea.
Conflicts of Interest
The authors declare no conflict of interest.
References
- Devereaux, D.; Tewelde, S.Z. Hyperthyroidism and thyrotoxicosis. Emerg. Med. Clin. North Am. 2014, 32, 277–292. [Google Scholar] [CrossRef] [PubMed]
- De Leo, S.; Lee, S.Y.; Braverman, L.E. Hyperthyroidism. Lancet 2016, 388, 906–918. [Google Scholar] [CrossRef]
- Yoon, H.N.; Choi, S.H.; Kwon, H.B.; Kim, S.K.; Hwang, S.H.; Oh, S.M.; Choi, J.W. Sleep-Dependent Directional Coupling of Cardiorespiratory System in Patients with Obstructive Sleep Apnea. IEEE Trans. Biom. Eng. 2018, PP, 1. [Google Scholar] [CrossRef]
- De Miguel-Bilbao, S.; Aguirre, E.; Iturri, P.L. Evaluation of Electromagnetic Interference and Exposure Assessment from s-Health Solutions Based on Wi-Fi Devices. BioMed Res. Int. 2015, 2015. [Google Scholar] [CrossRef] [PubMed]
- Solanas, A.; Patsakis, C.; Conti, M.; Vlachos, I.S.; Ramos, V.; Falcone, F.; Martinez-Balleste, A. Smart health: A context-aware health paradigm within smart cities. IEEE Commun. Mag. 2014, 52, 74–81. [Google Scholar] [CrossRef]
- Ancoli-Israel, S.; Chesson, A.; Quan, S.F. The AASM Manual for the Scoring of Sleep and Associated Events: Rules, Terminology and Technical Specifications; American Academy of Sleep Medicine: Darien, IL, USA, 2007. [Google Scholar]
- Zhao, M.; Yue, S.; Katabi, D.; Jaakkola, T.S.; Bianchi, M.T. Learning Sleep Stages from Radio Signals: A Conditional Adversarial Architecture. In Proceedings of the 34th International Conference on Machine Learning, Sydney, Australia, 6–11 August 2017. [Google Scholar]
- Li, W.; Sun, C.; Yuan, W.; Gu, W.; Cui, Z.; Chen, W. Smart Mat System with Pressure Sensor Array for Unobtrusive Sleep Monitoring. In Proceedings of the 39th Annual International Conference of the IEEE Engineering in Medicine and Biology Society (EMBC), Jeju Island, Korea, 11–15 July 2017; pp. 177–180. [Google Scholar]
- Lim, S.H.; Golkar, E.; Rahni, A.A.A. Respiratory Motion Tracking Using the Kinect Camera. In Proceedings of the 2014 IEEE Conference on Biomedical Engineering and Sciences (IECBES), Sarawak, Malaysia, 8–10 December 2014; pp. 797–800. [Google Scholar]
- Adib, F.; Kabelac, Z.; Mao, H.; Katabi, D.; Miller, R.C. Demo: Real-time Breath Monitoring Using Wireless Signals. In Proceedings of the 20th Annual International Conference on Mobile Computing and Networking, Maui, HI, USA, 7–11 September 2014; pp. 261–262. [Google Scholar]
- Patwari, N.; Wilson, J.; Ananthanarayanan, S.; Kasera, S.K.; Westenskow, D.R. Monitoring breathing via signal strength in wireless networks. IEEE Trans. Mob. Comput. 2014, 13, 1774–1786. [Google Scholar] [CrossRef]
- Kaltiokallio, O.J.; Yigitler, H.; Jäntti, R.; Patwari, N. Non-Invasive Respiration Rate Monitoring Using a Single COTS TX-RX Pair. In Proceedings of the 13th International Symposium on Information Processing in Sensor Networks, Berlin/Heidelberg, Germany, 15–17 April 2014; pp. 59–70. [Google Scholar]
- Yang, X.; Shah, S.A.; Ren, A.; Fan, D.; Zhao, N.; Cao, D.; Tian, J. Detection of Essential Tremor at the S-Band. IEEE J. Trans. Eng. Health Med. 2018, 6, 1–7. [Google Scholar] [CrossRef] [PubMed]
- Shah, S.A.; Zhao, N.; Ren, A.; Zhang, Z.; Yang, X.; Yang, J.; Zhao, W. Posture Recognition to Prevent Bedsores for Multiple Patients Using Leaking Coaxial Cable. IEEE Access 2016, 4, 8065–8072. [Google Scholar] [CrossRef]
- Shah, S.A.; Ren, A.; Fan, D.; Zhang, Z.; Zhao, N.; Yang, X.; Luo, M.; Wang, W.; Hu, F.; Rehman, M.U.; et al. Internet of Things for Sensing: A Case Study in the Healthcare System. Appl. Sci. 2018, 8, 508. [Google Scholar] [CrossRef]
- Halperin, D.; Hu, W.; Sheth, A.; Wetherall, D. Tool release: Gathering 802.11 n traces with channel state information. ACM SIGCOMM Comput. Commun. Rev. 2011, 41, 53. [Google Scholar] [CrossRef]
- Yang, X.; Shah, S.A.; Ren, A.; Zhao, N.; Fan, D.; Hu, F.; Tian, J. Wandering Pattern Sensing at S-Band. IEEE J. Biom. Health Inf. 2017. [Google Scholar] [CrossRef]
- Shah, S.A.; Zhang, Z.; Ren, A.; Zhao, N.; Yang, X.; Zhao, W.; Hao, Y. Buried Object Sensing Considering Curved Pipeline. IEEE Antenna. Wirel. Propag. Lett. 2017, 16, 2771–2775. [Google Scholar] [CrossRef]
- Dong, B.; Ren, A.; Shah, S.A.; Hu, F.; Zhao, N.; Yang, X.; Abbasi, Q.H. Monitoring of atopic dermatitis using leaky coaxial cable. Healthc. Technol. Lett. 2017, 4, 244–248. [Google Scholar] [CrossRef] [PubMed]
- Villasenor, J.D.; Belzer, B.; Liao, J. Wavelet filter evaluation for image compression. IEEE Trans. Image Proc. 1995, 4, 1053–1060. [Google Scholar] [CrossRef] [PubMed]


© 2018 by the authors. Licensee MDPI, Basel, Switzerland. This article is an open access article distributed under the terms and conditions of the Creative Commons Attribution (CC BY) license (http://creativecommons.org/licenses/by/4.0/).