Featured Application
In this study, Rumex japonicus Houtt. ethanol extract revealed both antilipidemic and antihyperglycemic effect on diet-induced obesity mice model. It was more beneficial than nepodin, a functional compound in the ethanol extract.
Abstract
Obesity is a continuous chronic metabolic disorder and has adverse effects on health, such as dyslipidemia, hyperglycemia, and insulin resistance. This study evaluated whether Rumex japonicus Houtt. ethanol extract (RU) and its active component nepodin (NE) affect obesity and its related complications, such as dyslipidemia and hyperglycemia in high-fat diet (HFD)-fed obese mice. The NE and RU supplements did not produce significant differences in body weight and adipose tissue weight compared to HFD group, while plasma lipid profiles were only improved by the RU supplement. However, both the NE and RU supplement had beneficial effects on glucose homeostasis and insulin resistance through reduction of plasma free fatty acid (FFA) (p < 0.05), insulin (p < 0.05), homeostatic model assessment for insulin resistance (p < 0.05), and C-peptide (p < 0.05) levels. In particular, the RU supplement decreased the area under the curve (AUC) of intraperitoneal glucose tolerance test (IPGTT) (p < 0.05), and improved glucose intolerance. Taken together, NE and RU supplements can contribute to improvements in HFD-induced hyperglycemia, while dyslipidemia was only improved by the RU supplement.
1. Introduction
Obesity that results from an imbalance of energy intake and expenditure is a continuous chronic metabolic disorder. It has adverse effects on health, such as hyperglycemia, type-2 diabetes mellitus (T2DM), dyslipidemia, and non-alcoholic fatty liver disease (NAFLD), and the number of obese people is steadily increasing [1].
Since adipose tissue hypertrophy by obesity becomes refractory to the interference of fat mobilization by insulin, the increased flux of fatty acids in the circulation has acute adverse effects on insulin sensitivity [2]. Numerous studies have reported that free fatty acids (FFAs) play a key role in inducing obesity and insulin resistance, and elevated circulating FFA has been shown to impair insulin action [3,4]. Moreover, obesity is an important risk factor for hyperglycemia and T2DM, as it desensitizes glucose recipient organs to the action of insulin. As obesity induces insulin resistance, decrease of glucose uptake in recipient organs can result in hyperglycemia.
Recently, many functional components from plants and plant extracts that improve obesity and its complications have been studied. Plant extracts, defined as raw or refined products derived from plants or parts of plants (e.g., leaves, stems, buds, flowers, roots or tubers), are frequently used for the treatment of diseases [5]. Rumex japonicus Houtt. (Family polygonaceae) is a perennial herb with erect stems 40–100 cm long that grows in wet meadows along ditches in the low lands of Japan, Korea, and China. Flowering occurs from June to July. The roots of Rumex japonicus Houtt. are collected in August or September and eaten after drying in the sun. Rumex japonicus Houtt. exerts anti-oxidative and anti-bacterial activities [6,7]. Nepodin, acetyl-1,8-dihydroxy-3-methylnaphthalene, is a compound from the root of rumex japonicus Houtt. A previous study has reported that nepodin modifies imbalanced lipid and glucose homeostasis [8]. However, there are few reports about the effects of Rumex japonicus Houtt. and its active component, nepodin, on obesity and related metabolic syndrome. Therefore, in this study, we evaluated the effect of Rumex japonicus Houtt. ethanol extract and its compound, nepodin, on hyperlipidemia, and hyperglycemia in diet-induced C57BL/6J mice. This study demonstrates for the first time that Rumex japonicus Houtt. ethanol extract can contribute to ameliorating hyperglycemia and dyslipidemia in HFD-fed obese mice.
2. Materials and Methods
2.1. Preparation of Substances
2.1.1. Isolation of Nepodin
The fresh roots of Rumex japonicus Houtt. were extracted [9] with methanol at room temperature for 12 h. The extract was filtered and concentrated under reduced pressure. The residue was partitioned between water/ethyl acetate. The material obtained from the organic layer was further partitioned between methanol/water (90:10) and n-hexane. The aqueous methanol fraction was separated by column chromatography on octadecylsilyl-silica gel using 40% aqueous methanol, 60% aqueous methanol, 80% aqueous methanol and methanol. The fraction eluted with 80% aqueous methanol was subjected to reversed-phase high performance liquid chromatography (HPLC) to yield nepodin. The purity of nepodin was determined to be >95% by HPLC analysis.
2.1.2. Preparation of Nepodin-Enrich Rumex Japonicus Houtt. Ethanol Extract
The fresh roots of Rumex japonicus Houtt. were extracted with ethanol at room temperature for 12 h. Water was added to the extract, and the diluted extract was concentrated to a small volume and filtrated. A mixture of the brown amorphous powders obtained from the extract and aqueous 0.1% NaHCO3 was stirred in flask for 5 min and filtrated. The obtained brown amorphous powders and aqueous 0.1% NaOH was stirred in the flask for 60 min and filtrated. Acetic acid is added to the filtrate, thereby causing the nepodin-rich extract to precipitate. The purity of the nepodin in nepodin-enrich extract was about 40% (w/w).
2.2. Animal and Diets
Male C57BL/6J mice (4-week-old) were purchased from the Jackson Laboratory (Bar harbor, ME, USA) and individually housed under a controlled temperature (22 ± 2 °C) and a 12 h light–dark cycle. After a one week adaptation period, mice were randomly divided into 4 groups of 13 mice per each group and fed a normal diet (ND), high-fat diet (HFD), HFD + 0.002% (w/w) nepodin (NE) and HFD + 0.005% (w/w) nepodin-rich Rumex japonicus Houtt. ethanol extract (RU) for 16 weeks (Table 1). The ND was prepared in accordance with a purified AIN-76 rodent diet. The HFD contained 40 kcal % fat (85% lard (w/w) and 15% corn oil (w/w) of total fat), 17 kcal % protein. The diets were fed in the form of a pellet for 16 weeks. The body weight and food intake of mice were monitored once a week. All procedures were approved by the animal ethics committee of Kyungpook National University (Approval No. KNU 2016-37).

Table 1.
Experimental diets.
2.3. Sample Collection and Preparation
At the end of the experimental period, all the mice were anesthetized with isoflurane (5 mg/kg body weight, Baxter, Deerfield, IL, USA) after a 12-h fast, and blood samples were collected from the inferior vena cava into heparin-coated tube for determination of their plasma lipids and adipokines levels. The blood was centrifuged at 1000× g for 15 min at 4 °C, and plasma was separated. After blood collection, liver, skeletal muscle, pancreas, white adipose tissue (WAT) and brown adipose tissue were promptly removed, rinsed with physiological saline, and weighed immediately. Livers and eWAT were used for histological analysis and immunohistochemistry and pancreases were used for immunohistochemistry.
2.4. Biochemistry Analysis
2.4.1. Plasma Lipid Contents
Enzymatic assays for plasma total-cholesterol (TC), HDL-cholesterol (HDL-C) and triglycerides (TG) were performed using enzymatic kits (Asan Pharm Co., Seoul, Korea). Apolipoprotein A-I (apo A-I) and apolipoprotein B (apo B) levels were also measured using enzymatic kits (NITTOBO MEDICAL CO., LTD., Tokyo, Japan). Plasma FFA was measured using the Non-esterified fatty acid (NEFA) kit (Wako, Osaka, Japan). Non-HDL-C was calculated as (TC)-(HDL-C)-(TG/5).
2.4.2. Hepatic Lipid Contents
Hepatic lipids were extracted [10], and the dried lipid residues were dissolved in 1 mL of ethanol for triglyceride, cholesterol, and fatty acid assays. A solution of Triton X-100 and sodium cholate in distilled water was added to 200 μL of a dissolved lipid solution for the purpose of emulsification. Triglyceride, cholesterol, and fatty acid contents were analyzed using the same enzymatic kit used for the plasma analysis.
2.4.3. Insulin Resistance Biomarkers
The blood glucose concentration was measured every 4 weeks with whole blood obtained from the tail veins after withholding food for 12 h using a glucose analyzer (One touch ultra blood glucose test strip, Desmef, Srl, Cassino, Italy). The intraperitoneal glucose tolerance test (IPGTT) was performed at the 15th week. After a 12-h fast, mice were injected intraperitoneally with glucose (0.4 g/kg body weight). Blood glucose levels were determined from the tail vein at 0, 30, 60, and 120 min after the glucose injection. Radioimmunometric assays were used to measure plasma insulin, glucagon, and c-peptide concentrations using a multiplex detection kit (Bio-Rad, Millipore, Hercules, CA, USA). Homeostatic index of insulin resistance (HOMA-IR) was calculated as follows: HOMA-IR = [fasting glucose (mmol/L) × fasting insulin (μLU/mL)]/22.5.
2.5. Histological Analysis and Immunohistochemistry
Liver and eWAT were removed and fixed in a buffer solution of 10% formalin. Afterwards, all fixed tissues were paraffin embedded, and 4 μm sections were prepared and stained with haematoxylin and eosin (H&E) or Masson’s trichrome. The stained areas were viewed using an optical microscope (Zeiss Axioscope) with 200× magnification.
Pancreases were removed from the mice and fixed in a buffer solution of 10% formalin. For immunohistochemistry, the islet was sectioned, fixed in hydrogen peroxide, and washed in a citrate buffer (pH 6.0). These sections were treated with blocking reagent (horseradish peroxidase (HRP), Ultratech, Inc., San Jose, CA, USA) to prevent nonspecific binding, and incubated with monoclonal antibodies against insulin and glucagon (SantaCuz Biotech. Inc., Dallas, TX, USA). Antibody reactivity was detected using HRP-conjugated biotin-streptavidin complexes and developed with diaminobensidine tetrahydrochloride as the substrate. The stained areas were viewed using an optical microscope (Zeiss Axioscope) at 200× magnification.
2.6. Statistical Analysis
All results are presented as mean ± S.E.M. Statistical analysis was performed using SPSS (SPSS Inc., Chicago, IL, USA). Differences between the ND and HFD groups were analyzed using Student’s t-test. Differences between groups fed the high-fat diet (HFD, NE, and RU) were determined via one-way ANOVA, followed by Duncan’s multiple-range test, multiple comparison procedure at p < 0.05.
3. Results
3.1. Body Weight, Food Efficiency Ratio (FER), Adipose Tissue Weights and Epididymal White Adipose Tissue Morphology
Body weight was measured weekly for 16 weeks. The HFD group significantly increased body weight compared to ND group from week 1 to 16. Meanwhile, there were no significant changes in body weight by supplementation of NE and RU compared to HFD group (Figure 1A). Also, RU and NE supplements did not significantly alter body weight gain (BWG) and food efficiency ratio (FER) compared to HFD group (Figure 1B). The fat pad weights (g/100 g body weight) were significantly higher in the HFD group than in the ND group, and those of the NE and RU groups were similar to the HFD group (Figure 1C). Epididymal WAT morphology is as shown in Figure 1D. The NE and RU groups did not show difference in size of adipocyte compared to HFD group. Meanwhile, the adipocyte size of ND group was the smallest among all 4 groups. Masson’s trichrome staining of epididymal WAT revealed collagen accumulation around adipocyte in HFD group, whereas there were no signs of collagen accumulation in the ND, NE, and RU groups.
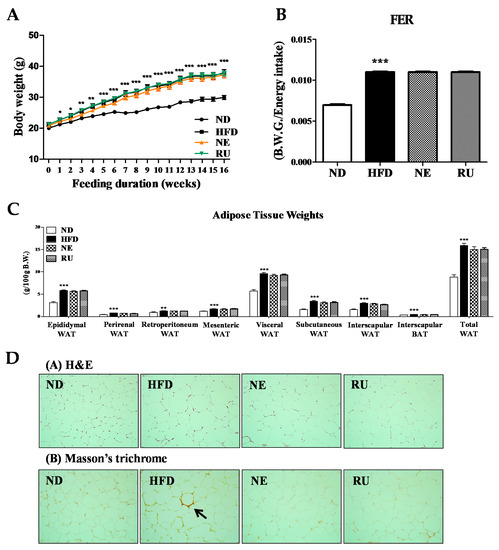
Figure 1.
Effect of NE and RU supplementation for 16 weeks on body weight (A), food efficiency ratio (FER) (B), adipose tissue weights (C) and epididymal white adipose tissue morphology (200× magnification) (D) in C57BL/6J mice fed high-fat diet. Data are mean ± S.E. Significant differences between HFD versus ND are indicated; * p < 0.05, ** p < 0.01, *** p < 0.001. The food efficiency ratio is given as the body weight gain per energy intake per day.
3.2. Plasma Lipid Profiles
After 16 weeks, plasma TG, TC, FFA, HDL-C, nonHDL-C, and apo B levels were significantly increased in HFD group than in ND group, while plasma apo A-I and apo A-I/apo B ratio were significantly lowered in HFD group compared to ND group (Table 2). The NE supplement significantly decreased plasma FFA as well as TC level compared to HFD group. Regarding the efficacy of the RU supplement, it significantly decreased plasma TG, FFA, nonHDL-C, and apo B levels compared to the HFD group. In addition, the RU supplement significantly increased HTR (HDL-C/Total-C × 100), apo A-I and apo A-I/apo B ratio than HFD group (Table 2).
Table 2.
Effect of NE and RU supplementation for 16 weeks on plasma lipid profiles in C57BL/6J mice fed high-fat diet.
3.3. Liver Weight, Hepatic Lipid Profiles and Hepatic Morphology
Liver weight was significantly higher in the HFD group than in the ND group, and those in the NE and RU groups were similar to the HFD group (Figure 2A). Hepatic triglyceride and fatty acid contents were increased in the HFD group compared to the ND group. Meanwhile, the NE supplement significantly decreased hepatic triglyceride and fatty acid contents compared to the HFD group, while the RU group was not different from the HFD group (Figure 2B). However, there was no difference between NE and RU in those hepatic lipids contents. Moreover, hematoxylin and eosin (H&E) staining analysis revealed that the size of hepatic lipid droplet was slightly decreased in the NE and RU groups compared to the HFD group (Figure 2C). As shown in Figure 2C(B), collagen fiber deposition (yellow color, arrow) around portal vein was observed in the HFD group, while there was a little fibrotic change in the NE and RU groups. There was no fibrotic change in the ND group.
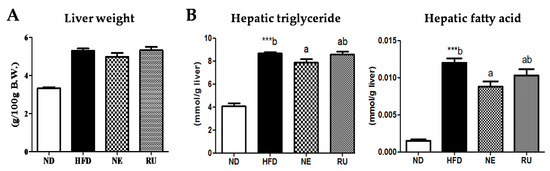
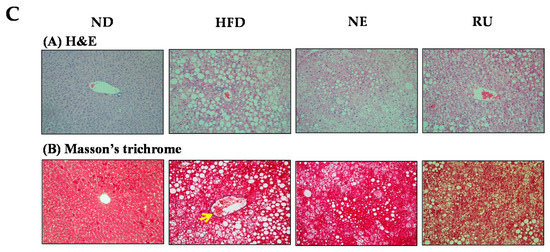
Figure 2.
Effect of NE and RU supplementation for 16 weeks on liver weight (A), hepatic lipid profiles (B) and hepatic morphology (200× magnification) (C) in C57BL/6J mice fed high-fat diet. Data are mean ± S.E. Significant differences between HFD vs. ND are indicated; *** p < 0.001. ab Means not sharing a common superscript are significantly different among the high-fat diet fed groups at p < 0.05.
3.4. Fasting Blood Glucose, Plasma Glucose, Insulin, Glucagon, and C-peptide Levels, Glucose Tolerance, Homeostatin Model Assessment-Insulin Resistance (HOMA-IR) and Pancreatic Immunohistochemistry Analysis
Change of the fasting blood glucose concentration during the experimental period revealed that HFD led to increase in fasting blood glucose level compared to the ND group (Figure 3A). The NE supplement significantly lowered blood glucose level at 4th, 8th and 16th week. The RU supplement also significantly decreased blood glucose level from the 8th week. Result of glucose tolerance test and area under the graph curve (AUC) is as shown in Figure 3B,C. Relative levels had significant differences in the HFD group compared to ND group. IPGTT and AUC levels of the RU group exhibited similar patterns to the ND group, having significant differences compared to HFD. The NE supplement seemed to be more effective than the RU supplement in glucose tolerance, although there was no difference between the NE and RU groups in AUC.
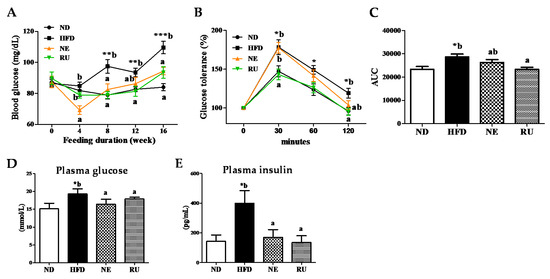
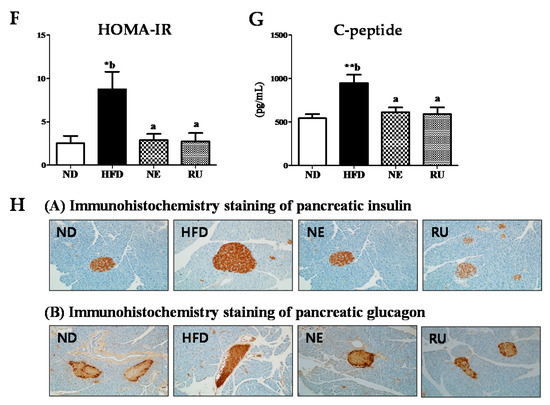
Figure 3.
Effect of NE and RU supplementation for 16 weeks on fasting blood glucose (A), glucose tolerance (B), area under the curve (AUC) (C), plasma glucose (D) and insulin (E) levels, HOMA-IR (F), c-peptide level (G), and pancreatic immunohistochemistry analysis (200× magnification) (H) in C57BL/6J mice fed high-fat diet. Data are mean ± S.E. Significant differences between HFD versus ND are indicated; * p < 0.05, ** p < 0.01, *** p < 0.001. ab Means not sharing a common superscript are significantly different among the high-fat diet fed groups at p < 0.05. HOMA-IR, homeostatin model assessment-insulin resistance; C-peptide, connecting peptide.
As presented in Figure 3D–G, there were some significant differences in plasma glucose and insulin levels among the groups. Plasma glucose (Figure 3D), insulin (Figure 3E), HOMA-IR (Figure 3F), and c-peptide (Figure 3G) level were significantly elevated in the HFD group compared to the ND group. However, those markers were significantly decreased by the NE and RU supplements.
Immunohistochemistry staining expression of pancreatic insulin and glucagon is as shown in Figure 3H. As a result, it was consistent with plasma insulin and glucagon levels. Expression of pancreatic insulin displayed a visibly increased size of the islet boundary in HFD group compared to the ND, NE, and RU groups. Expression of pancreatic glucagon was also visibly higher in the HFD group than in the rest of groups.
4. Discussion
4.1. Effect of Rumex Japonicus Houtt. Extract and Nepodin on Plasma and Hepatic Lipid Profiles
Obesity can induce insulin resistance, thereby inducing hyperglycemia, leading to the progress to T2DM [2,3,4,11]. The HFD-fed mice showed significant increases in body weight and adipose tissue weight as well as increases in plasma TG, TC, FFA, HDL-C, nonHDL-C, and apo B. And plasma apo A-I and apo A-I/apo B ratio were decreased in the HFD group compared to the ND group. Although the NE and RU supplements did not change body weight and adipose tissue weights, the NE supplement significantly decreased plasma TC and FFA. The RU supplement markedly reduced plasma TG, FFA, nonHDL-C, and apo B levels. In addition, the RU supplement significantly increased HTR, apo A-I, and apo A-I/apo B ratio. The RU supplement also tended to elevate HDL-C level compared to HFD mice. Previous studies have suggested that an elevated HTR combined with TG is associated with high coronary heart disease (CHD) risk [12,13]. Moreover, the apo B/apo A-I ratio was also markedly linked with the risk of CHD, even when the levels of other lipids were within normal ranges, and the apo B/apo A-I ratio was a superior predictor of CHD risk compared to the HTR [14,15,16,17]. Thus, the results of the present work indicate that RU has the potential to regulate plasma lipid profiles, which is linked to reduced dyslipidemia in HFD-fed obese mice.
In general, a reduction of body fat mass and an improvement of dyslipidemia are highly correlated with improved hepatic steatosis [18]. Neither the NE nor the RU supplement altered body fat mass, although the NE supplement improved hepatic and plasma lipid profile as well as hepatic steatosis. The RU supplement changed plasma lipid compositions more favorably than the NE supplement, and improved dyslipidemia in diet-induced obese mice.
4.2. Effect of Rumex Japonicus Houtt. Extract and Nepodin on Hyperglycemia and Insulin Resistance
The anti-diabetic effect of Nepodin as an 5′ AMP-activated protein kinase (AMPK) activator was already identified. Nepodin can mediate stimulation of solute carrier family 2 (facilitated glucose transporter), member 4 (SLC2A4) translocation via AMPK activation [8]. In our study, the NE supplement decreased blood glucose, plasma insulin and C-peptide, and HOMA-IR. We identified that RU has anti-diabetic effect of which the efficacy was somewhat more potent than NE; this may be due to the synergy effect of multicompounds present in RU, Rumex japonicus Houtt. ethanol extract.
Obesity increases plasma FFA levels because of enlarged adipose tissue. Elevated plasma FFA inhibits insulin-mediated suppression of glycogenolysis. Thereby, obesity can induce insulin resistance [19]. More recently, Bartelt et al. have reported that brown adipose tissue also strongly influences improved insulin sensitivity via modulating Nrf1 expression [20].
In this study, NE and RU supplements significantly decreased plasma FFA levels, thereby improving insulin resistance. The fasting blood glucose concentration during the experimental period was increased in the HFD group compared to the ND group. On the other hand, the NE and RU supplements significantly decreased blood glucose levels. Plasma glucose, insulin, and glucagon, C-peptide, HOMA-IR and IPGTT levels were measured to identify the effect of the NE and RU supplements on insulin resistance. Lower HOMA-IR values were considered to indicate higher insulin sensitivity, whereas higher HOMA-IR values were considered to indicate lower insulin sensitivity or insulin resistance [21]. In our results, plasma glucose and insulin levels were reduced by both the RU and NE supplements compared to the HFD group; this result was consistent with immunohistochemistry staining expression of pancreatic insulin. Decreased HOMA-IR by the NE and RU supplements showed similar levels to the ND group. Judging from this, supplementation of both NE and RU can ameliorate insulin resistance. HFD led to glucose intolerance, pre-diabetic symptom compared to ND group by increasing AUC of IPGTT, whereas the RU supplement improved glucose intolerance by decreasing AUC of IPGTT. Although the NE supplement decreased the fasting blood glucose during experimental period, it did not lead to a significant difference in IPGTT.
5. Conclusions
Taken together, we provide evidence that NE and RU supplements have beneficial effects on glucose homeostasis without altering body weights and fats compared to the HFD group. By comparing the efficacy of NE and RU, the RU supplement is more favorable for HFD-induced dyslipidemia and hyperglycemia, which may be mediated by a synergy effect of multi-phytochemicals included in RU in addition to NE compounds.
Author Contributions
E.-Y.K. and M.K.Y. contributed to the design of the experiments, generated the data, contributed to the discussion, wrote the manuscript, and reviewed/edited the manuscript. J.T.W. and A.Y. contributed to the preparation of nepodin and Rumex japonicus Houtt. extract for this experiment. S.-J.C. participated in writing the discussion. M.-S.C. contributed to the original idea, generated the data, contributed to the discussion, wrote the manuscript, and reviewed/edited the manuscript.
Funding
This research was supported by a National Research Foundation (NRF) of Korea grant funded by the Korea government (MSIP, 2015R1C1A2A01051533 and 2015R1A5A6001906).
Conflicts of Interest
The authors declare no conflict of interest.
Abbreviations
| AMPK | 5′ AMP-activated protein kinase |
| Apo | apolipoprotein |
| AUC | area under the graph curve |
| BW | body weight |
| CHD | coronary heart disease |
| FFA | Free fatty acid |
| FER | food efficiency ratio |
| H&E | haematoxylin and eosin |
| HDL-C | high-density lipoprotein cholesterol |
| HFD | high-fat diet |
| HOMA | homeostasis model assessment |
| HPLC | high performance liquid chromatography |
| HTR | HDL-C-to-TC ratio |
| IPGTT | intraperitoneal glucose tolerance test |
| NAFLD | non-alcoholic fatty liver disease |
| ND | normal diet |
| NE | nepodin |
| RU | Rumex japonicus Houtt. ethanol extract |
| T2DM | type 2 diabetes mellitus |
| TC | total plasma cholesterol |
| TG | triglycerides |
| WAT | white adipose tissue |
References
- Fuster, J.J.; Ouchi, N.; Gokce, N.; Walsh, K. Obesity-Induced Changes in Adipose Tissue Microenvironment and Their Impact on Cardiovascular Disease. Circ. Res. 2016, 118, 1786–1807. [Google Scholar] [CrossRef] [PubMed]
- Frayn, K.N. Adipose tissue and the insulin resistance syndrome. Proc. Nutr. Soc. 2001, 60, 375–380. [Google Scholar] [CrossRef] [PubMed]
- Boden, G. Role of fatty acids in the pathogenesis of insulin resistance and NIDDM. Diabetes 1997, 46, 3–10. [Google Scholar] [CrossRef] [PubMed]
- McGarry, J.D. Glucose-fatty acid interactions in health and disease. Am. J. Clin. Nutr. 1998, 67, S500–S504. [Google Scholar] [CrossRef] [PubMed]
- Hasani-Ranjbar, S.; Nayebi, N.; Larijani, B.; Abdollahi, M. A systematic review of the efficacy and safety of herbal medicines used in the treatment of obesity. World J. Gastroenterol. 2009, 15, 3073–3085. [Google Scholar] [CrossRef] [PubMed]
- Elzaawely, A.A.; Xuan, T.D.; Tawata, S. Antioxidant and antibacterial activities of Rumex japonicus HOUTT. Aerial parts. Biol. Pharm. Bull. 2005, 28, 2225–2230. [Google Scholar] [CrossRef] [PubMed]
- Li, Y.P.; Takamiyagi, A.; Ramzi, S.T.; Nonaka, S. Inhibitory effect of Rumex Japonicus Houtt on the porphyrin photooxidative reaction. J. Dermatol. 2000, 27, 761–768. [Google Scholar] [CrossRef] [PubMed]
- Ha, B.G.; Yonezawa, T.; Son, M.J.; Woo, J.T.; Ohba, S.; Chung, U.-I.; Yagasaki, K. Antidiabetic effect of nepodin, a component of Rumex roots, and its modes of action in vitro and in vivo. BioFactors 2014, 40, 436–447. [Google Scholar] [CrossRef] [PubMed]
- Minami, M.; Mori, T.; Yonezawa, T.; Saito, Y.; Teruya, T.; Woo, J.T. Evaluation of raw nepodin extraction from Rumex japonicus and R. obtusifolius and their DNA polymorphisms. J. Nat. Med. 2018, 72, 369–374. [Google Scholar] [CrossRef] [PubMed]
- Folch, J.; Lees, M.; Sloane Stanley, G.H. A simple method for the isolation and purification of total lipides from animal tissues. J. Biol. Chem. 1957, 226, 497–509. [Google Scholar] [PubMed]
- Cerf, M.E. Beta Cell Dysfunction and Insulin Resistance. Front. Endocrinol. (Lausanne) 2013, 4, 37. [Google Scholar] [CrossRef] [PubMed]
- Holman, R.R.; Chleman, R.L.; Shine, B.S.; Stevens, R.J. Non-HDL cholesterol is less informative than the total-to-HDL cholesterol ratio in predicting cardiovascular risk in type 2 diabetes. Diabetes Care 2005, 28, 1796–1797. [Google Scholar] [CrossRef] [PubMed]
- Yu, D.; Cai, Y.; Qin, R.; Graffy, J.; Holman, D.; Zhao, Z.; Simmons, D. Total/high density lipoprotein cholesterol and cardiovascular disease (re)hospitalization nadir in type 2 diabetes. J. Lipid Res. 2018, 59, 1745–1750. [Google Scholar] [CrossRef] [PubMed]
- Yusuf, S.; Hawken, S.; Ounpuu, S.; Dans, T.; Avezum, A.; Lanas, F.; McQueen, M.; Budaj, A.; Pais, P.; Varigos, J.; et al. INTERHEART Study Investigators. Effect of potentially modifiable risk factors associated with myocardial infarction in 52 countries (the INTERHEART study): Case-control study. Lancet 2004, 364, 937–952. [Google Scholar] [CrossRef]
- Meisinger, C.; Loewel, H.; Mraz, W.; Koenig, W. Prognostic value of apolipoprotein B and A-I in the prediction of myocardial infarction in middle-aged men and women: Results from the MONICA/KORA Augsburg cohort study. Eur. Heart J. 2005, 26, 271–278. [Google Scholar] [CrossRef] [PubMed]
- Walldius, G.; Jungner, I.; Holme, I.; Aastveit, A.H.; Kolar, W.; Steiner, E. High apolipoprotein B, low apolipoprotein A-I, and improvement in the prediction of fatal myocardial infarction (AMORIS study): A prospective study. Lancet 2001, 358, 2026–2033. [Google Scholar] [CrossRef]
- Walldius, G.; Jungner, I.; Aastveit, A.H.; Holme, I.; Furberg, C.D.; Sniderman, A.D. The apoB/apoA-I ratio is better than the cholesterol ratios to estimate the balance between plasma proatherogenic and antiatherogenic lipoproteins and to predict coronary risk. Clin. Chem. Lab. Med. 2004, 42, 1355–1363. [Google Scholar] [CrossRef] [PubMed]
- Kwon, E.Y.; Lee, J.; Kim, Y.J.; Do, A.; Choi, J.Y.; Cho, S.J.; Jung, U.J.; Lee, M.K.; Park, Y.B.; Choi, M.S. Seabuckthorn Leaves Extract and Flavonoid Glycosides Extract from Seabuckthorn Leaves Ameliorates Adiposity, Hepatic Steatosis, Insulin Resistance, and Inflammation in Diet-Induced Obesity. Nutrients 2017, 9, 569. [Google Scholar] [CrossRef] [PubMed]
- Boden, G. Obesity, insulin resistance and free fatty acids. Curr. Opin. Endocrinol. Diabetes Obes. 2011, 18, 139–143. [Google Scholar] [CrossRef] [PubMed]
- Bartelt, A.; Widenmaier, S.B.; Schlein, C.; Johann, K.; Goncalves, R.L.S.; Eguchi, K.; Fischer, A.W.; Parlakgül, G.; Snyder, N.A.; Nguyen, T.B.; et al. Brown adipose tissue thermogenic adaptation requires Nrf1-mediated proteasomal activity. Nat. Med. 2018, 24, 292–303. [Google Scholar] [CrossRef] [PubMed]
- Zhang, Q.; Tan, Y.; Zhang, N.; Yao, F. Polydatin supplementation ameliorates diet-induced development of insulin resistance and hepatic steatosis in rats. Mol. Med. Rep. 2015, 11, 603–610. [Google Scholar] [CrossRef] [PubMed]
© 2018 by the authors. Licensee MDPI, Basel, Switzerland. This article is an open access article distributed under the terms and conditions of the Creative Commons Attribution (CC BY) license (http://creativecommons.org/licenses/by/4.0/).