Abstract
This study presents mathematical models for predicting VO2max based on a 20 m shuttle run and anthropometric parameters. The research was conducted with data provided by 308 young healthy people (aged 20.6 ± 1.6). The research group includes 154 females (aged 20.3 ± 1.2) and 154 males (aged 20.8 ± 1.8). Twenty-four variables were used to build the models, including one dependent variable and 23 independent variables. The predictive methods of analysis include: the classical model of ordinary least squares (OLS) regression, regularized methods such as ridge regression and Lasso regression, artificial neural networks such as the multilayer perceptron (MLP) and radial basis function (RBF) network. All models were calculated in R software (version 3.5.0, R Foundation for Statistical Computing, Vienna, Austria). The study also involved variable selection methods (Lasso and stepwise regressions) to identify optimum predictors for the analysed study group. In order to compare and choose the best model, leave-one-out cross-validation (LOOCV) was used. The paper presents three types of models: for females, males and the whole group. An analysis has revealed that the models for females ( mL·kg−1·min−1) are characterised by a smaller degree of error as compared to male models ( mL·kg−1·min−1). The model accounting for sex generated an error level of mL·kg−1·min−1.
1. Introduction
Cardiorespiratory fitness (CRF) is a strong health indicator [1,2,3,4,5,6]. A low CRF level entails the risk of adverse cardiovascular events [2]. In adults, CRF is regarded as a predictor of general mortality and it is negatively correlated with hypertension and diabetes [7,8,9,10,11,12,13]. Low CRF in young people is related e.g., to obesity, which increases the risk of cardiovascular diseases [14] and metabolic syndrome characteristics [15,16]. Studies have also revealed that improved CRF leads to better health results regardless of body mass index (BMI) [9]. A higher physical fitness index in adults significantly reduces the metabolic risk for a particular body fat level [17]. Preventive measures against cardiovascular diseases which are intended to optimise CRF are also implemented in low-risk groups (10% risk of ischaemic heart disease occcurrence within the next 10 years) [18,19,20]. The authors of many studies emphasise the significance of lifelong physical activity to improve or maintain the appropriate level of CRF [19,21,22]. In early adulthood, a high CRF level provides the most benefit related to survival. The maximum oxygen consumption (VO2max) is the main CRF criterion measurement [15]. A direct measurement of the factor is regarded as the best indicator of aerobic fitness [23,24]. Since the implementation of VO2max direct measurement is quite complex, maximal oxygen uptake tends to be forecasted based on indirect measurements, using predictive models [23,25,26]. A 20 m shuttle run test (20 m SRT) is often used to measure cardivascular fitness [22,23,27,28]. Therefore, it seems reasonable to model the index using various mathematical methods. A predictive model may help to identify the level of CRF without costly equipment and specialised research time. The prediction of the VO2max parameter may become an important element of health monitoring and fitness improvement in young healthy people.
In the literature, there are many papers that focus on the prediction of this indicator using, among other factors, the results of resistance tests, anthropometric parameters or physical activity indicators [15,23,29]. Therefore, the VO2max predictive models may be classified as both exercise and non-exercise models. Exercise models make predictions based on the result of an endurance test with maximum or submaximal intensity [15,23,30,31,32,33,34]. In the literature, there are also prediction models based on ergometric tests [35,36]. The most popular predictors include age, sex and BMI [25]. Most of the published models are based on multiple regression or machine learning methods.
In this paper, the authors present different models to predict VO2max based on the result of the 20 m shuttle run test and anthropometric parameters. The aim of the work is to determine the optimal predictive model to estimate VO2max for young healthy people (students). The models may be used e.g., by a Physical Education teacher for CRF monitoring. To the best of our knowledge, these are the first studies for such a large group (n = 308) using the direct measurement of oxygen uptake. Data was collected at five large universities in various parts of Poland.
2. Material and Methods
2.1. Participants
The nature of the study was cross-sectional. It applied to a group of 1097 (aged 19.7 ± 1.4) healthy students (487 males aged 20.0 ± 1.6 and 610 females aged 19.5 ± 1.3) studying in five large academic centres in Poland (Krosno State College, University of Rzeszow, Maria Curie Skłodowska University in Lublin, Cracow University of Technology and Poznań University of Life Sciences). The study group was selected in two stages. In the first stage, randomly selected students at the academic level of bachelor’s studies participated in a 20 m SRT. Based on the median of the covered distance (sections): Me = 880 m for females (44 sections) and Me = 1520 m for males (76 sections) people who completed 20 m SRT below and above the median of the distance covered (sections) were selected for the second stage to ensure the highest possible differentiation of results. Finally, 154 women (aged 20.3 ± 1.2) and 154 men (aged 20.8 ± 1.8) participated in the last stage. They participated in a 20 m SRT and the VO2max was identified using a portable gas analyser K4b2. Before the cardiac stress test, a skilled study team made anthropometric measurements. The body height was measured with a stadiometer (SECA 213 Hamburg, Germany) with an accuracy of up to 1 mm. Measurements of the waist circumference were carried out with non-elastic flexible tape according to two protocols: WHO (World Health Organization) STEPS protocol (approximate midpoint between the lower margin of the last palpable rib and the top of the iliac crest) and according to US NIH (United States National Institutes of Health) protocol (a measurement was made at the top of the iliac crest) [37]. The hip circumference measured around the widest portion of the buttocks. The body weight and body weight components (Fat—body fat percentage, FFM—fat free mass, TBW—total body water) were measured by means of Body Composition Analyzer Tanita TBF 300 (Tokyo, Japan). Table 1 presents used somatic indexes with equations. Generally, the measured anthropometric parameters (height and body weight, waist circumference, WHR—waist-hip ratio, WHtR—waist to height ratio, BMI—body mass index, BAI—body adiposity index) comply with the results for the mean values of the parameters in the population of Polish students presented in studies by other authors [38,39].

Table 1.
Description of somatic indexes.
A description of the variables (e.g., VO2max level, age, heart rate and anthropometric parameters) together with the basic statistics (mean value and standard deviation) is given in Table 2. The models were calculated on the basis of 23 independent variables (–) and one dependent variable (y). Independent variables include: gender (), parameters of the 20 m shuttle run (–), age (), anthropometric features (–), somatic indexes (–), and body components (–). The VO2max result (y) obtained during the 20 m shuttle run test with a telemetry gas exchange system (Cosmed K4b2) was a dependent variable.
Table 2.
Description of the variables used to construct the models.
2.2. Field Assessment of VO2max
The 20 m SRT was conducted according to established procedures [40]. The speed at the first minute was 8.5 km/h and this increased by 0.5 km/h every minute. The measurement of the VO2max during a 20 m shuttle run test was made using a portable gas analyzer K4b2 (Cosmed, Rome, Italy). During the graded test, inspired and expired gases were continuously monitored, breath by breath. Prior to testing, Cosmed K4b2 was warmed-up for a minimum of 20 min. Following the warm-up period, the K4b2 was calibrated with standard gases in accordance with the manufacturer’s specifications. Heart Rate (HR-beats/min) was continuously monitored (Polar coded transmitter) with a focus on the maximal heart rate () and recovery heart rate in the first () and fourth () minutes after the test. The criteria for attaining VO2max included any two of the following: volitional exhaustion; attainment of at least 90% of the age predicted (220 beats/min minus the age of the subject in years); respiratory exchange ratio (RER) equal to or greater than 1.10; and VO2 leveled off even with an increase in intensity [41,42].
2.3. Predictive Methods
Multiple input single output (MISO) model types were used in the study. Classic regression models, regularised regression models and artificial neural networks were used in the calculations of the models. All predictive models were calculated in R colorred software [43]. The implemented methods included:
- The ordinary least squares (OLS) regression used a popular method of least squares, in which weights are calculated by minimizing the sum of the squared errors. The function lm to calculate the OLS was used. The criterion of performance takes the form:where n—total number of data, p—total number of input, —input variable, —output variable, are unknown weights (parameters) of the model.
- The Ridge model was calculated using the function lm.ridge from the “MASS” package. In Ridge regression [44], the criterion of performance includes a penalty for increased weights and takes the form:Parameter decides the size of the penalty: the greater the value of , the bigger the penalty.
- Multilayer Percleptron (MLP)—to implement these methods, the RSNNS package was used [45]. Apart from the linear models, the artificial neural network was used. Two types of ANNs were applied: a multi-layer perceptron (MLP). MLPs are fully connected feedforward networks, and the most popular architecture used in applications. Training was performed by error backpropagation and logistical function as an activation function of hidden layers was used.
- Artificial neural networks with a radial basis function (RBF)—the application of the RBF network is similar to MLP and used the RSNNS package [45]. The RBF are also feed-forward networks, but they have only one hidden layer. This network performs a linear combination of radially basis functions.
The presented methods were used to calculate models from all variables (Table 2) and for subcollections of variables received after using selected reductive procedures of the input collection variables [46,47]. Lasso regression is the first method analysed. Its mechanism facilitates assigning a penalty to variables and in this way they are eliminated from equations. The Lasso regression was obtained with the function enet from the “elasticnet” package. In Lasso regression [48], the norm is used i.e., the sum of absolute values:
Classic “variable selection” procedures are used when there is a high number of potential predictive variables () which means a high number of potentially calculable equations (solutions of input collections) [47]. The procedures introduce or eliminate individual variables from the equation and consist only of studying the subcollection of all possible equations. The following four selection procedures were used in the analysis:
- Stepwise Forward Regression—The forward selection procedure begins with an equation which contains only a free expression. The first variable in the equation is the one which has the highest correlation with the variable. If the coefficient of regression of the variable differs significantly from zero, the variable remains in the equation and another variable is added. The second variable introduced into the equation is the one which has the highest correlation with ( has been adjusted for the effect of the first variable). If the regression coefficient is significant, adding the next variable is implemented in the same way.
- Stepwise Backward Regression—The backward elimination procedure begins with an equation with all variables. One variable is removed in each step. The variables are neglected depending on their contribution to a reduction in the total error of squares. The variable with the lowest contribution to the reduction in the total error of squares, i.e., the one which has the smallest t-test in the equation, will be removed as the first one. Assuming that there is one or more variables with negligible t-tests, the procedure consists of removing all variables with the lowest negligible t-test. The procedure is completed when all t-tests are significant or when all variables have been removed.
- Stepwise Regression (bidirection)—The stepwise method combines the action mechanisms of both abovementioned methods. Generally, it is a forward selection procedure which contains an extra mechanism that enables the removal of variables on any stage, similarly to backward selection. In this procedure, the variable which was earlier added to the equation can be removed later. Calculations made to add and remove variables are the same as in the forward and backward procedures.
All models determined in the study were tested by means of leave-one-out-cross-validation (LOOCV). During the LOOCV, was calculated which has the form:
where: n—total number of data, —the output of a model calculated after removing the pair .
3. Results
All models were evaluated using the prediction error calculated during cross-validation (Table 3 and Table 4). Figure 1 presents validation errors in relation to the parameters of the models. For Ridge models, this parameter is the lambda parameter with a step of 1, in the case of the Lasso regression, the parameter has a step of . Artificial neural networks (MLP and RBF) were evaluated for the number of neurons in the hidden layer .
Table 3.
Mathematical models for all predictors.
Table 4.
Mathematical models with variable selection.
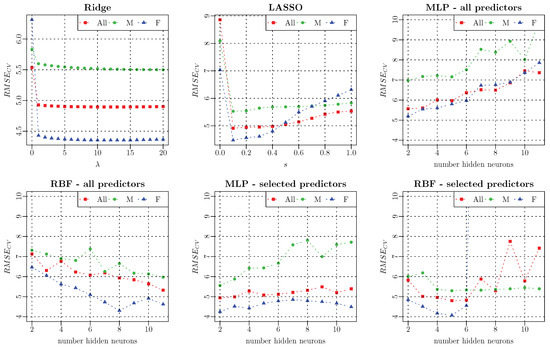
Figure 1.
Model optimization.
By analysing the results for the models identified based on all variables (Table 3), it may be observed that the most accurate model for women was obtained using the RBF type neural network with eight neurons in the hidden layer ( [mL·kg−1·min−1]). The best model making predictions among men were based on the whole collection of variables which generates an error of [mL·kg−1·min−1]. This was calculated with Ridge regression for . A similar observation may be made for the most accurate model for all data where the Ridge regression () is also the one which generates the smallest error ( [mL·kg−1·min−1]). The following stage of the analysis involved variable selection methods to improve the predictive capacity of the presented models, determine optimal input collections, and consequently to identify the factors which determine the VO2max prediction in the analysed group. The models determined by means of Lasso and stepwise regression were evaluated using LOOCV (Table 4). The application of variable selection methods improved the predictive capacity of the OLS model. The error level for the female group was [mL·kg−1·min−1] when the bidirectional method was used, while, for males, the model obtained with forward regression turned out to be more precise— [mL·kg−1·min−1]. For all data, the forward and bidirectional methods determined the same input data for which the error generated by the model amounted to [mL·kg−1·min−1]. The identified input collections were used to calculate new neural networks (Table 4). Neural networks for selected variables are characterised by a smaller prediction error than the networks identified based on all variables. RBF models generate the value of [mL·kg−1·min−1] for women, [mL·kg−1·min−1] for men and [mL·kg−1·min−1] for all participants. The models obtained for females and males demonstrate the poorest fitness among all analysed models, while the model for all data is worse than the OLS model (forward, bidirectional). The equations for optimal linear models are presented in Table 5.
Table 5.
VO2max linear predictive equations.
4. Discussion
The paper presents mathematical models for the prediction of VO2max based on a 20 m SRT and anthropometric parameters. All models were developed and cross-validated using a sample of 308 healthy young people (aged 19–27). The models obtained are classified as “maximal models” [49] and that is why errors in this group of models were compared with errors presented by other authors. The majority of papers with VO2max maximal predictive models present a common model for females and males [15,30,31]. An analysis of errors for predictive models in which sex was the input variable revealed that the error [mL·kg−1·min−1] is a result which does not deviate from errors presented in other papers (Table 6). The calculated model is more accurate than the model proposed by Mahar [30] and Silva [15]. It is however less accurate than the models proposed in papers by Akay [31,50]. The optimal model for the whole group used the following factors for prediction: sex (), distance (20 m SRT) (), body height () and content of adipose tissue ().
Table 6.
Comparison of predictive models.
In young males and females, regular physical exercise definitely improves CRF by increasing VO2max and decreasing body fat percentage, leading to a better quality of life [51,52,53,54]. The VO2max level varies significantly among individuals and mainly depends on genetic aspects, sex, age anthropometric properties of health, lifestyle and training status [51,52,55,56,57,58,59]. Reference values may change over time and should be regularly updated/validated [60]. The data may be found in papers analysing the results of cardiac stress tests carried out for large groups of healthy people [8,60,61]. Typical values of VO2max in young healthy male students amount to about 50 [mL·kg−1·min−1], and in women to about 40 [mL·kg−1·min−1] [62]. CRF in terms of aerobic capacity is affected by the composition of the body. Low CRF in young adults with increased body fat could be a factor in the development of cardiovascular comorbidities later in middle age and old age [63]. Bioimpedance is an alternative method to estimate the percentage of body fat, when compared to DXA (Dual Energy X-ray Absoptiometry), it is a gold standard method, as there is a high level of agreement [64]. Simple use, lack of radiation and the relatively low cost of bioelectric impedance suggests that it is a feasible analysis for body fat measurement, especially in large populations [65].
Besides a common model for females and males, this paper determines separate models for each group. It may be observed that the models for females are characterised by a significantly smaller error as compared to those for men. The RBF neural network with eight neurons in the hidden layer turned out to be the most accurate. It generates an error of [mL·kg−1·min−1]. Bandyopadhyay [66] presented similar studies in his paper. He described a multiple regression model whose prediction error amounted to 1.27 [mL·kg−1·min−1] (Table 6). The model used speed and body height as predictors. Other studies concerning prediction among females were published by Chatterjee [23], who calculated a model generating an error of 0.53 [mL·kg−1·min−1]. The model used only the maximum speed. When the errors obtained in this paper are compared with errors obtained by other authors, it may be concluded that their errors were significantly smaller. It shall be emphasized that the population analysed in the study was much larger and more diversified for the VO2max level ( [mL·kg−1·min−1]). Moreover, cross-validation was used in the paper for evaluation, while in the papers discussed the model quality was evaluated by means of standard errors. That is why direct comparisons are impossible. The model calculated for women has the simplest structure and includes: distance (20 m SRT) (), body height () and body fat (). The model contains the same variables as the model for all participants save for sex, which is a constant.
Similarly to the female group, the RBF network turned out to be the best model for males, whereby in the male group the optimal network consists only of two neurons in the hidden layer. The network generates an error level of [mL·kg−1·min−1]. Comparing the obtained results with other papers where models were calculated only for males, it may be observed that the parameter value does not deviate significantly from the published results (Table 6). The optimal model for males calculated in the study generated greater errors than the models presented by Machado and Demadai [67] (4.10 [mL·kg−1·min−1]) and Bandyopdhyay [68] (1.41 [mL·kg−1·min−1]). The error obtained is still smaller than the error generated using the Costa model [69] (7.20 [mL·kg−1·min−1]).
When comparing the errors of the calculated models, it should be emphasized that a direct comparison of the errors obtained in the studies is valid only when the same maximal test is used and when a similar study sample is employed [70]. Therefore, it seems that the results obtained may only be compared with models which use 20 m SRT and are developed based on a population of healthy people aged 19–27 years, and are cross-validated. Cross-validation does not evaluate the fitness error but a generalisation error.
The model determined for males consisted of the following variables: distance (20 m SRT) (), waist circumference (NIH protocol) (), WHR (NIH protocol) (), FFMI () and BSA (). The obtained collection of predicators is not incidental and the significance of each variance for VO2max is reflected in the literature. Waist circumference and WHR are popular indicators used for the evaluation of cardiovascular diseases [71]. Waist circumference is also a predictor of visceral fat and indicator of central obesity [72]. There remains no uniformly accepted measurement protocol, resulting in a variety of techniques employed throughout the published literature [73,74]. The most commonly used are four measurements of waist circumference defined by specific anatomic landmarks: (1) immediately below the lowest ribs, (2) at the narrowest waist, (3) the midpoint between the lowest rib and iliac crest, and (4) immediately above the iliac crest [75,76]. Measurements made at the umbilicus are also commonly used in clinical and research settings [74]. Besides DXA and bioimpedance, different indicators based on anthropometric measurements are used for the evaluation of body fat content. The indicator that is often used in obesity studies is BMI [39,71,77]. However, it presents some limitations. It neither evaluates the content of adipose tissue and its distribution in the body nor does it differentiate body fat content depending on age, sex and ethnic origin [71,78]. The identification of adipose tissue location is necessary to detect visceral (central) obesity, which increases the risk of cardiovascular diseases [79]. That is why the qualitative supplementation of the classical concept of BMI may help to create reference values for FFMI for a given age category [80]. BSA, a method for describing body size, is commonly used in medicine as a biometric unit [81,82].
The use of a predictive model makes it possible to determine the level of CFR without using expensive equipment and specialized research teams. The prediction of the VO2max parameter may be useful as an element of monitoring the health and physical performance of students of young healthy people.
The strongest points of presented paper are:
- a large research group representing the population,
- VO2max measurements made using direct methods,
- the use of a large set of variables to determine the optimal predictors for VO2max estimation,
- and obtaining a relatively small VO2max estimation error.
The limitations of the study are related to the using models in practice. VO2max estimation by the proposed models should be performed for healthy people of the same age as the research group.
Author Contributions
Conceptualization, K.P., Z.B., E.N.-B. and E.Z.; Data Curation, Z.B., M.Z.-D. and K.S.; Formal Analysis, K.P. and K.H.P.; Funding Acquisition, E.N.-B.; Investigation, Z.B., M.Z.-D., E.N.-B., M.H., K.S. and E.Z.; Methodology, K.P., Z.B., K.H.P. and E.Z.; Project Administration, E.N.-B. and M.H.; Software, K.P. and B.D.; Supervision, E.Z.; Writing—Original Draft, K.P., Z.B., M.Z.-D., K.H.P. and E.Z.; Writing—Review and Editing, K.P., M.Z.-D. and E.Z.
Funding
This work has been supported by the Polish Ministry of Science and Higher Education within the research project “Development of Academic Sport” in the years 2016-2019, project No. N RSA4 01654.
Conflicts of Interest
The authors declare no conflict of interests.
Ethical Standards
Written informed consent was obtained from all subjects. The project and used methods were approved by the Bioethics Committee of Rzeszow University, Poland, which noted the absence of any contraindications and ethical violations (Resolution No. 20/12/2015). The research was conducted according to the guidelines laid down in the Declaration of Helsinki.
References
- Castro-Piñero, J.; Perez-Bey, A.; Segura-Jiménez, V.; Aparicio, V.A.; Gómez-Martínez, S.; Izquierdo-Gomez, R.; Marcos, A.; Ruiz, J.R.; Marcos, A.; Castro-Piñero, J.; et al. Cardiorespiratory fitness cutoff points for early detection of present and future cardiovascular risk in children: A 2-year follow-up study. In Mayo Clinic Proceedings; Elsevier: Amsterdam, The Netherlands, 2017; Volume 92, pp. 1753–1762. [Google Scholar]
- Ross, R.; Blair, S.N.; Arena, R.; Church, T.S.; Després, J.P.; Franklin, B.A.; Haskell, W.L.; Kaminsky, L.A.; Levine, B.D.; Lavie, C.J.; et al. Importance of assessing cardiorespiratory fitness in clinical practice: A case for fitness as a clinical vital sign: A scientific statement from the American Heart Association. Circulation 2016, 134, 653–699. [Google Scholar] [CrossRef] [PubMed]
- Ramírez-Vélez, R.; Daza, F.; González-Jiménez, E.; Schmidt-RioValle, J.; González-Ruíz, K.; Correa-Bautista, J.E. Cardiorespiratory Fitness, Adiposity, and Cardiometabolic Risk Factors in Schoolchildren: The FUPRECOL Study. West. J. Nurs. Res. 2017, 39, 1311–1329. [Google Scholar] [CrossRef] [PubMed]
- Jackson, A.S.; Sui, X.; O’Connor, D.P.; Church, T.S.; Lee, D.C.; Artero, E.G.; Blair, S.N. Longitudinal cardiorespiratory fitness algorithms for clinical settings. Am. J. Prev. Med. 2012, 43, 512–519. [Google Scholar] [CrossRef] [PubMed]
- Lang, J.J. Exploring the utility of cardiorespiratory fitness as a population health surveillance indicator for children and youth: An international analysis of results from the 20-m shuttle run test. Appl. Physiol. Nutr. Metab. 2018, 43, 211. [Google Scholar] [CrossRef] [PubMed]
- Black, N.E.; Vehrs, P.R.; Fellingham, G.W.; George, J.D.; Hager, R. Prediction of VO2max in Children and Adolescents Using Exercise Testing and Physical Activity Questionnaire Data. Res. Q. Exerc. Sport 2016, 87, 89–100. [Google Scholar] [CrossRef] [PubMed]
- Gander, J.C.; Sui, X.; Hébert, J.R.; Hazlett, L.J.; Cai, B.; Lavie, C.J.; Blair, S.N. Association of cardiorespiratory fitness with coronary heart disease in asymptomatic men. In Mayo Clinic Proceedings; Elsevier: Amsterdam, The Netherlands, 2015; Volume 90, pp. 1372–1379. [Google Scholar]
- Ahmed, H.M.; Al-Mallah, M.H.; McEvoy, J.W.; Nasir, K.; Blumenthal, R.S.; Jones, S.R.; Brawner, C.A.; Keteyian, S.J.; Blaha, M.J. Maximal exercise testing variables and 10-year survival: Fitness risk score derivation from the FIT Project. In Mayo Clinic Proceedings; Elsevier: Amsterdam, The Netherlands, 2015; Volume 90, pp. 346–355. [Google Scholar]
- Brawner, C.A.; Al-Mallah, M.H.; Ehrman, J.K.; Qureshi, W.T.; Blaha, M.J.; Keteyian, S.J. Change in maximal exercise capacity is associated with survival in men and women. In Mayo Clinic Proceedings; Elsevier: Amsterdam, The Netherlands, 2017; Volume 92, pp. 383–390. [Google Scholar]
- De Lannoy, L.; Sui, X.; Lavie, C.J.; Blair, S.N.; Ross, R. Change in Submaximal Cardiorespiratory Fitness and All-Cause Mortality. In Mayo Clinic Proceedings; Elsevier: Amsterdam, The Netherlands, 2018. [Google Scholar]
- Gray, B.J.; Stephens, J.W.; Williams, S.P.; Davies, C.A.; Turner, D.; Bracken, R.M.; Group, P.S.G. Cardiorespiratory fitness is a stronger indicator of cardiometabolic risk factors and risk prediction than self-reported physical activity levels. Diabetes Vasc. Disease Res. 2015, 12, 428–435. [Google Scholar] [CrossRef] [PubMed]
- Kodama, S.; Saito, K.; Tanaka, S.; Maki, M.; Yachi, Y.; Asumi, M.; Sugawara, A.; Totsuka, K.; Shimano, H.; Ohashi, Y.; et al. Cardiorespiratory fitness as a quantitative predictor of all-cause mortality and cardiovascular events in healthy men and women: A meta-analysis. Jama 2009, 301, 2024–2035. [Google Scholar] [CrossRef] [PubMed]
- Barlow, C.E.; LaMonte, M.J.; FitzGerald, S.J.; Kampert, J.B.; Perrin, J.L.; Blair, S.N. Cardiorespiratory fitness is an independent predictor of hypertension incidence among initially normotensive healthy women. Am. J. Epidemiol. 2005, 163, 142–150. [Google Scholar] [CrossRef] [PubMed]
- Silva, D.R.; Werneck, A.O.; Collings, P.J.; Ohara, D.; Fernandes, R.A.; Barbosa, D.S.; Ronque, E.R.; Sardinha, L.B.; Cyrino, E.S. Cardiorespiratory fitness effect may be under-estimated in ’fat but fit’ hypothesis studies. Ann. Hum. Biol. 2017, 44, 237–242. [Google Scholar] [CrossRef] [PubMed]
- Silva, G.; Oliveira, N.L.; Aires, L.; Mota, J.; Oliveira, J.; Ribeiro, J.C. Calculation and validation of models for estimating VO2max from the 20-m shuttle run test in children and adolescents. Arch. Exerc. Health Dis. 2012, 3, 145–152. [Google Scholar] [CrossRef]
- Ling, J.C.Y.; Mohamed, M.N.A.; Jalaludin, M.Y.; Rampal, S.; Zaharan, N.L.; Mohamed, Z. Determinants of high fasting insulin and insulin resistance among overweight/obese adolescents. Sci. Rep. 2016, 6, 36270. [Google Scholar] [CrossRef] [PubMed]
- Lee, S.; Kuk, J.L.; Katzmarzyk, P.T.; Blair, S.N.; Church, T.S.; Ross, R. Cardiorespiratory fitness attenuates metabolic risk independent of abdominal subcutaneous and visceral fat in men. Diabetes Care 2005, 28, 895–901. [Google Scholar] [CrossRef] [PubMed]
- Barlow, C.E.; DeFina, L.F.; Radford, N.B.; Berry, J.D.; Cooper, K.H.; Haskell, W.L.; Jones, L.W.; Lakoski, S.G. Cardiorespiratory fitness and long-term survival in “low-risk” adults. J. Am. Heart Assoc. 2012, 1, e001354. [Google Scholar] [CrossRef] [PubMed]
- Strasser, B.; Burtscher, M. Survival of the fittest: VO2max, a key predictor of longevity? Front. Biosci. 2018, 23, 1505–1516. [Google Scholar] [CrossRef]
- Majid, H.A.; Amiri, M.; Azmi, N.M.; Su, T.T.; Jalaludin, M.Y.; Al-Sadat, N. Physical activity, body composition and lipids changes in adolescents: Analysis from the MyHeART Study. Sci. Rep. 2016, 6, 30544. [Google Scholar] [CrossRef] [PubMed]
- Cao, Z.B.; Miyatake, N.; Higuchi, M.; Miyachi, M.; Ishikawa-Takata, K.; Tabata, I. Predicting VO2max with an objectively measured physical activity in Japanese women. Med. Sci. Sports Exerc. 2010, 42, 179–186. [Google Scholar] [CrossRef] [PubMed]
- Agostinis-Sobrinho, C.A.; Ruiz, J.R.; Moreira, C.; Abreu, S.; Luís, L.; Oliveira-Santos, J.; Mota, J.; Santos, R. Cardiorespiratory fitness and inflammatory profile on cardiometabolic risk in adolescents from the LabMed Physical Activity Study. Eur. J. Appl. Physiol. 2017, 117, 2271–2279. [Google Scholar] [CrossRef] [PubMed]
- Chatterjee, P.; Banerjee, A.K.; Das, P.; Debnath, P. A regression equation for the estimation of maximum oxygen uptake in Nepalese adult females. Asian J. Sports Med. 2010, 1, 41. [Google Scholar] [CrossRef] [PubMed]
- Pescatello, L.S.; Arena, R.; Riebe, D.; Thompson, P.D. ACSMs Guidelines for Exercise Testing and Prescription, 9th ed.; Wolters Kluwer/Lippincott Williams & Wilkins: Philadelphia, PA, USA, 2014. [Google Scholar]
- Abut, F.; Akay, M.F. Machine learning and statistical methods for the prediction of maximal oxygen uptake: Recent advances. Med. Devices 2015, 8, 369. [Google Scholar]
- Mayorga-Vega, D.; Aguilar-Soto, P.; Viciana, J. Criterion-related validity of the 20-m shuttle run test for estimating cardiorespiratory fitness: A meta-analysis. J. Sports Sci. Med. 2015, 14, 536. [Google Scholar] [PubMed]
- Zou, Z.; Chen, P.; Yang, Y.; Xiao, M.; Wang, Z. Relationships among anthropometric characteristics, muscular fitness, and sprint performance in adolescents. Isokinet. Exerc. Sci. 2018, 26, 89–94. [Google Scholar] [CrossRef]
- Magutah, K. Cardio-respiratory fitness markers among Kenyan university students using a 20 m shuttle run test (SRT). Afr. Health Sci. 2013, 13, 10–16. [Google Scholar] [PubMed]
- Abut, F.; Akay, M.F. Determination of the variables affecting the maximal oxygen uptake of cross-country skiers by using machine learning and feature selection algorithms. In Proceedings of the 2015 23th Signal Processing and Communications Applications Conference (SIU), Malatya, Turkey, 16–19 May 2015; pp. 156–159. [Google Scholar]
- Mahar, M.T.; Guerieri, A.M.; Hanna, M.S.; Kemble, C.D. Estimation of aerobic fitness from 20-m multistage shuttle run test performance. Am. J. Prev. Med. 2011, 41, S117–S123. [Google Scholar] [CrossRef] [PubMed]
- Akay, M.F.; Ghahremanlou, N.; Aktürk, E.; George, J.; Aktarla, E. Performance comparison of different regression methods for VO2max prediction. In Proceedings of the 7th International Symposium on Electrical and Electronics Engineering and Computer Systems, Gemikonagi, North Cyprus, 29–30 November 2012; pp. 7–11. [Google Scholar]
- Aktürk, E. Prediction of Maximal Oxygen Uptake Using Machine Learning Methods Combined with Feature Selection. Master’s Thesis, Cukurova University, Adana, Turkey, 2014. [Google Scholar]
- Aktürk, E.; Akay, M.F. Prediction of maximal oxygen uptake using multilayer perceptron combined with feature selection. In Proceedings of the 7th Engineering and Technology Symposium, Ankara, Turkey, 15–16 May 2014; pp. 3–6. [Google Scholar]
- Akay, M.F.; Özsert, G.; George, J. Prediction of maximal oxygen uptake using support vector machines from submaximal data. DEÜ Eng. Fac. Eng. Sci. J. 2014, 16, 42–48. [Google Scholar]
- Fitchett, M. Predictability of VO2 max from submaximal cycle ergometer and bench stepping tests. Br. J. Sports Med. 1985, 19, 85–88. [Google Scholar] [CrossRef] [PubMed]
- Van Horn, L.; Cuomo, M.; Huntbach, S.; O’Donel, A.; Mullin, C.; Sanders, J.; Braun, W. Comparison of Astrand VO2 Max Prediction to a Graded Leg Ergometry VO2 Max Test in Endurance Athletes. Int. J. Exerc. Sci. Conf. Proc. 2016, 9, 104. [Google Scholar]
- World Health Organization. Waist Circumference and Waist-Hip Ratio, Report of a WHO Expert Consultation; World Health Organization: Geneva, Switzerland, 2011. [Google Scholar]
- Smolarczyk, M.; Wiśniewski, A.; Czajkowska, A.; Kęska, A.; Tkaczyk, J.; Milde, K.; Norkowski, H.; Gajewski, J.; Trajdos, A.; Majchrzak, A. The physique and body composition of students studying physical education: A preliminary report. Pediatr. Endocrinol. Diabetes Metab. 2012, 18, 27–32. [Google Scholar] [PubMed]
- Zwierzchowska, A.; Grabara, M.; Palica, D.; Zając, A. BMI and BAI as markers of obesity in a Caucasian population. Obes. Facts 2013, 6, 507–511. [Google Scholar] [CrossRef] [PubMed]
- Leger, L.A.; Mercier, D.; Gadoury, C.; Lambert, J. The multistage 20 metre shuttle run test for aerobic fitness. J. Sports Sci. 1988, 6, 93–101. [Google Scholar] [CrossRef] [PubMed]
- Gore, C. Physiological Test for Elite Athletes. Australian Sports Commission; Human Kinetics: Champaign, IL, USA, 2000. [Google Scholar]
- Stojanovic, M.D.; Calleja-Gonzalez, J.; Mikic, M.; Madic, D.M.; Drid, P.; Vuckovic, I.; Ostojic, S.M. Accuracy and Criterion-Related Validity of the 20-M Shuttle Run Test in Well-Trained Young Basketball Players. Montenegrin J. Sports Sci. Med. 2016, 5, 5–10. [Google Scholar]
- R Core Team. R: A Language and Environment for Statistical Computing; R Foundation for Statistical Computing: Vienna, Austria, 2016. [Google Scholar]
- Hoerl, A.E.; Kennard, R.W. Ridge regression: Biased estimation for nonorthogonal problems. Technometrics 1970, 12, 55–67. [Google Scholar] [CrossRef]
- Bergmeir, C.; Benítez, J.M. Neural Networks in R Using the Stuttgart Neural Network Simulator: RSNNS. J. Stat. Softw. 2012, 46, 1–26. [Google Scholar] [CrossRef]
- Hastie, T.; Tibshirani, R.; Friedman, J. Unsupervised learning. In The Elements of Statistical Learning; Springer: Berlin, Germany, 2009; pp. 485–585. [Google Scholar]
- Chatterjee, S.; Hadi, A.S. Regression Analysis by Example; John Wiley & Sons: Hoboken, NJ, USA, 2015. [Google Scholar]
- Tibshirani, R. Regression shrinkage and selection via the lasso. J. R. Stat. Soc. Ser. B (Methodological) 1996, 58, 267–288. [Google Scholar]
- Abut, F.; Akay, M.F.; George, J. Developing new VO2max prediction models from maximal, submaximal and questionnaire variables using support vector machines combined with feature selection. Comput. Biol. Med. 2016, 79, 182–192. [Google Scholar] [CrossRef] [PubMed]
- Akay, M.F.; Abut, F.; Georg, J. Using support vector machines to predict maximal oxygen uptake with the help of questionnaire variables. In Proceedings of the International Symposium on Engineering, Artificial Intelligence and Applications, Kyrenia, North Cyprus, 5–7 November 2014; pp. 5–6. [Google Scholar]
- Bute, S.S.; Shete, A.N.; Khan, S. A Comparative Study of VO2 Max in Young Female Athletes and Non-Athletes. IOSR J. Sports Phys. Educ. 2014, 1, 2347–6737. [Google Scholar]
- Sarma, A.S. A comparative study of selected physiological variables between active and sedentary college students. Int. J. Phys. Educ. Sports Health 2017, 4, 100–102. [Google Scholar]
- Sánchez, G.F.L.; Díaz-Suárez, A.; Radziminski, Ł.; Jastrzębski, Z. Effects of a 12-week physical education program on the body composition of 10-and 11-year-old children. Sci. Sports 2017, 32, e155–e161. [Google Scholar]
- Sánchez, G.F.L.; Díaz-Suárez, A.; Radziminski, Ł.; Jastrzębski, Z. Effects of a 12-week-long program of vigorous-intensity physical activity on the body composition of 10-and 11-year-old children. J. Hum. Sport Exerc. 2017, 12, 236–245. [Google Scholar] [CrossRef]
- Dencker, M.; Thorsson, O.; Karlsson, M.K.; Lindén, C.; Eiberg, S.; Wollmer, P.; Andersen, L.B. Gender differences and determinants of aerobic fitness in children aged 8–11 years. Eur. J. Appl. Physiol. 2007, 99, 19–26. [Google Scholar] [CrossRef] [PubMed]
- Eynon, N.; Morán, M.; Birk, R.; Lucia, A. The champions’ mitochondria: Is it genetically determined? A review on mitochondrial DNA and elite athletic performance. Physiol. Genom. 2011, 43, 789–798. [Google Scholar] [CrossRef] [PubMed]
- Weiss, E.P.; Spina, R.J.; Holloszy, J.O.; Ehsani, A.A. Gender differences in the decline in aerobic capacity and its physiological determinants during the later decades of life. J. Appl. Physiol. 2006, 101, 938–944. [Google Scholar] [CrossRef] [PubMed]
- Arabmokhtari, R.; Khazani, A.; Bayati, M.; Barmaki, S.; Fallah, E. Relationship between Body Composition and Cardiorespiratory Fitness in Students at Postgraduate Level. Zahedan J. Res. Med. Sci. 2019, in press. [Google Scholar] [CrossRef]
- Gawali, U.P.; Bhutkar, M. Association between Cardio Respiratory Fitness and Sedentary Life Style. Int. J. Health Sci. Res. 2015, 5, 204–208. [Google Scholar]
- Paap, D.; Takken, T. Reference values for cardiopulmonary exercise testing in healthy adults: A systematic review. Expert Rev. Cardiovasc. Ther. 2014, 12, 1439–1453. [Google Scholar] [CrossRef] [PubMed]
- Herdy, A.H.; Uhlendorf, D. Reference values for cardiopulmonary exercise testing for sedentary and active men and women. Arq. Brasileiros Cardiol. 2011, 96, 54–59. [Google Scholar] [CrossRef]
- Górski, J. Fizjologiczne Podstawy Wysiłku Fizycznego; Wydawnictwo Lekarskie PZWL: Warsaw, Poland, 2001. [Google Scholar]
- Sharma, M.; Kamal, R.; Chawla, K. Correlation of body composition to aerobic capacity; A cross sectional study. Int. J. Appl. Res. 2016, 2, 38–42. [Google Scholar]
- Sun, G.; French, C.R.; Martin, G.R.; Younghusband, B.; Green, R.C.; Xie, Y.G.; Mathews, M.; Barron, J.R.; Fitzpatrick, D.G.; Gulliver, W.; et al. Comparison of multifrequency bioelectrical impedance analysis with dual-energy X-ray absorptiometry for assessment of percentage body fat in a large, healthy population. Am. J. Clin. Nutr. 2005, 81, 74–78. [Google Scholar] [CrossRef] [PubMed]
- Sung, Y.A.; Oh, J.Y.; Lee, H. Comparison of the body adiposity index to body mass index in Korean women. Yonsei Med. J. 2014, 55, 1028–1035. [Google Scholar] [CrossRef] [PubMed]
- Bandyopadhyay, A. Validity of 20 meter multi-stage shuttle run test for estimation of maximum oxygen uptake in female university students. Indian J. Physiol. Pharmacol. 2013, 57, 77–83. [Google Scholar] [PubMed]
- Machado, F.A.; Denadai, B.S. Predição da potência aeróbia (VO 2máx) de crianças e adolescentes em teste incremental na esteira rolante. Motriz: Revista de Educação Fisica 2013, 19, 126–132. [Google Scholar]
- Bandyopadhyay, A. Validity of 20 meter multi-stage shuttle run test for estimation of maximum oxygen uptake in male university students. Indian J. Physiol. Pharmacol. 2011, 55, 221–226. [Google Scholar] [PubMed]
- Da Costa, A.V.; da Cunha Costa, M.; de Oliveira, S.F.M.; de Albuquerque, F.L.; Guimarães, F.J.D.S.P.; Barbosa, T.M. Validation of an equation for estimating maximal oxygen consumption of nonexpert adult swimmers. Open Access J. Sports Med. 2013, 4, 19. [Google Scholar] [CrossRef] [PubMed]
- Abut, F.; Akay, M.F.; Yildiz, I.; George, J. Performance comparison of different machine learning methods for prediction of maximal oxygen uptake from submaximal data. In Proceedings of the Eighth Engineering and Technology Symposium, Ankara, Turkey, 14–15 May 2015; pp. 367–370. [Google Scholar]
- Lam, B.C.C.; Koh, G.C.H.; Chen, C.; Wong, M.T.K.; Fallows, S.J. Comparison of body mass index (BMI), body adiposity index (BAI), waist circumference (WC), waist-to-hip ratio (WHR) and waist-to-height ratio (WHtR) as predictors of cardiovascular disease risk factors in an adult population in Singapore. PLoS ONE 2015, 10, e0122985. [Google Scholar] [CrossRef] [PubMed]
- Lone, S.W.; Atta, I.; Ibrahim, M.N.; Leghari, T.M.; Khan, Y.N.; Raza, J. Hyperinsulinemia and waist circumference in childhood metabolic syndrome. J. Coll Phys. Surg. Pak 2011, 21, 146–150. [Google Scholar]
- Wang, J.; Thornton, J.C.; Bari, S.; Williamson, B.; Gallagher, D.; Heymsfield, S.B.; Horlick, M.; Kotler, D.; Laferrère, B.; Mayer, L.; et al. Comparisons of waist circumferences measured at 4 sites. Am. J. Clin. Nutr. 2003, 77, 379–384. [Google Scholar] [CrossRef] [PubMed]
- Mason, C.; Katzmarzyk, P.T. Variability in waist circumference measurements according to anatomic measurement site. Obesity 2009, 17, 1789–1795. [Google Scholar] [CrossRef] [PubMed]
- Bosy-Westphal, A.; Booke, C.A.; Blöcker, T.; Kossel, E.; Goele, K.; Later, W.; Hitze, B.; Heller, M.; Glüer, C.C.; Müller, M.J. Measurement site for waist circumference affects its accuracy as an index of visceral and abdominal subcutaneous fat in a Caucasian population. J. Nutr. 2010, 140, 954–961. [Google Scholar] [CrossRef] [PubMed]
- Hitze, B.; Bosy-Westphal, A.; Bielfeldt, F.; Settler, U.; Mönig, H.; Müller, M.J. Measurement of waist circumference at four different sites in children, adolescents, and young adults: Concordance and correlation with nutritional status as well as cardiometabolic risk factors. Obes. Facts 2008, 1, 243–249. [Google Scholar] [CrossRef] [PubMed]
- Geliebter, A.; Atalayer, D.; Flancbaum, L.; Gibson, C.D. Comparison of body adiposity index (BAI) and BMI with estimations of % body fat in clinically severe obese women. Obesity 2013, 21, 493–498. [Google Scholar] [CrossRef] [PubMed]
- Brambilla, P.; Bedogni, G.; Heo, M.; Pietrobelli, A. Waist circumference-to-height ratio predicts adiposity better than body mass index in children and adolescents. Int. J. Obes. 2013, 37, 943. [Google Scholar] [CrossRef] [PubMed]
- Sironi, A.; Petz, R.; De Marchi, D.; Buzzigoli, E.; Ciociaro, D.; Positano, V.; Lombardi, M.; Ferrannini, E.; Gastaldelli, A. Impact of increased visceral and cardiac fat on cardiometabolic risk and disease. Diabet. Med. 2012, 29, 622–627. [Google Scholar] [CrossRef] [PubMed]
- Schutz, Y.; Kyle, U.; Pichard, C. Fat-free mass index and fat mass index percentiles in Caucasians aged 18–98 y. Int. J. Obes. 2002, 26, 953. [Google Scholar] [CrossRef] [PubMed]
- Verbraecken, J.; Van de Heyning, P.; De Backer, W.; Van Gaal, L. Body surface area in normal-weight, overweight, and obese adults. A comparison study. Metab.-Clin. Exp. 2006, 55, 515–524. [Google Scholar] [CrossRef] [PubMed]
- Zafrir, B.; Salman, N.; Crespo-Leiro, M.G.; Anker, S.D.; Coats, A.J.; Ferrari, R.; Filippatos, G.; Maggioni, A.P.; Mebazaa, A.; Piepoli, M.F.; et al. Body surface area as a prognostic marker in chronic heart failure patients: Results from the Heart Failure Registry of the Heart Failure Association of the European Society of Cardiology. Eur. J. Heart Fail. 2016, 18, 859–868. [Google Scholar] [CrossRef] [PubMed]
© 2018 by the authors. Licensee MDPI, Basel, Switzerland. This article is an open access article distributed under the terms and conditions of the Creative Commons Attribution (CC BY) license (http://creativecommons.org/licenses/by/4.0/).